Can Large Language Models Beat Wall Street? Unveiling the Potential of AI in Stock Selection
Abstract
In the dynamic and data-driven landscape of financial markets, this paper introduces MarketSenseAI, a novel AI-driven framework leveraging the advanced reasoning capabilities of GPT-4 for scalable stock selection. MarketSenseAI incorporates Chain of Thought and In-Context Learning methodologies to analyze a wide array of data sources, including market price dynamics, financial news, company fundamentals, and macroeconomic reports emulating the decision making process of prominent financial investment teams. The development, implementation, and empirical validation of MarketSenseAI are detailed, with a focus on its ability to provide actionable investment signals (buy, hold, sell) backed by cogent explanations. A notable aspect of this study is the use of GPT-4 not only as a predictive tool but also as an evaluator, revealing the significant impact of the AI-generated explanations on the reliability and acceptance of the suggested investment signals. In an extensive empirical evaluation with S&P 100 stocks, MarketSenseAI outperformed the benchmark index by 13%, achieving returns up to 40%, while maintaining a risk profile comparable to the market. These results demonstrate the efficacy of Large Language Models in complex financial decision-making and mark a significant advancement in the integration of AI into financial analysis and investment strategies. This research contributes to the financial AI field, presenting an innovative approach and underscoring the transformative potential of AI in revolutionizing traditional financial analysis investment methodologies.
keywords:
Artificial Intelligence , Large Language Models , GPT-4 , Finance , Stock Selection , Investment Strategy , MarketSenseAIPACS:
C45 , C61 , G11 , G15MSC:
68T07 , 68T50 , 91G10 , 91G15[unipi]organization=Department of Digital Systems, University of Piraeus, addressline=Karaoli and Dimitriou 80, city=Piraeus, postcode=18534, country=Greece
[innov]organization=Innov-Acts Limited,addressline=Kolokotroni 6, city=Nicosia, postcode=1101, country=Cyprus
[km3]organization=KM Cube Asset Management,addressline=Gkyzi 3, city=Athens, postcode=15125, country=Greece
1 Introduction
1.1 Background and motivation
Capital markets serve as an efficient conduit for capital allocation within an economy, and their price discovery process plays a key role in maintaining the health and stability of the financial system (Kidwell et al., 2016). The price discovery process is a complex interplay of factors, including company and sector specific factors, macroeconomic data, momentum effects, as well as political and geopolitical influences (Lewellen, 2002). Market participants collectively participate in this intricate machinery of price discovery, thereby ensuring the efficient functioning of the financial markets (Malkiel, 2003).
Stock selection essentially operates as a price discovery mechanism through which market participants focus on stocks perceived as ”mispriced,” thereby offering the potential for attractive returns relative to the broader market. This principle forms the essence of value investing (Greenwald et al., 2020). However, the concept of ”mispricing” can be expanded upon, as it may also relate to the market’s perceived fair price of an asset, which may not necessarily align with its fundamental value. This can encompass expectations of future growth for a company, a strategy often referred to as ”growth investing,” which sometimes overlooks current fundamentals. Beyond the realms of value and growth investing, there are other factors that influence and add complexity to stock selection. The significance of passive investing, capital flows, derivative-related flows, and macroeconomic factors all contribute to a financial system that is inherently probabilistic and often chaotic in nature (Bouchaud et al., 2003).
Market participants make decisions by understanding and using a wide range of information. Retail investors often struggle with analyzing individual stocks. This challenge stems from their limited capacity to analyze information, susceptibility to behavioral biases, and lack of robust risk management skills. As a result, they might miss promising investment opportunities or expose themselves to undue risks. In this context, Exchange Traded Funds (ETFs) offer a practical solution. ETFs enable these investors to engage with the broader market more effectively, an approach often referred to as investing in ’beta.’
Similarly, small to medium-sized asset or wealth management firms encounter their own set of challenges. They may find it difficult to conduct in-depth analysis of individual stocks due to resource constraints or limited selection scope. For these firms, ETFs can also be an appealing option, providing a more manageable and diversified investment approach.
In contrast, larger professional firms are typically well-equipped with advanced technology, infrastructure, and skilled personnel. This enables them to conduct superior analysis and risk management of their investment portfolios. These firms often have dedicated teams of stock analysts, economists, and traders whose collective knowledge and reasoning ability are focused on capitalizing on potential investment opportunities. However, even with these advantages, their ability to outperform the market is not guaranteed. They face unique challenges often associated with large-scale organizations, such as organizational silos, poor communication, and diverse incentives (Weiss-Cohen et al., 2019).
During the last 15 years and following the financial crisis of 2008, there have been significant changes in the fabric and functioning of the capital markets, with lasting effects on price discovery. More specifically:
-
1.
Central banks policies: The 2008 crisis led to a strong belief among market participants that central banks would intervene to stabilize markets using every tool at their disposal. An over-reliance on central bank interventions, risks distorting market mechanisms and incentives as it can give rise to an underpricing of risk, and lead to moral hazard and potential increases in system-wide externalities (BIS, 2022).
-
2.
The rise of passive investing: ETFs offer ”blind” participation in market-weighted indices, treating all participating stocks irrespective of their fundamental value. This can allow stocks to substantially deviate from their fair value. It is evident that stocks that are widely held by passive investors are more likely to be affected than stocks that are not (Goyal and He, 2015).
-
3.
The significant impact of retail investors: The emergence of retail investors, with easy access to gamified, leveraged, and derivative-enabled trading platforms, has also significantly impacted price discovery. One example is a highly popular retail product, zero-day expiry options (0DTE), which are option contracts that expire within a single day (Brogaard et al., 2023). In 2022 0DTE accounted for approximately 43% of the total S&P 500 options volume compared with just 6% in 2017. Another example is meme stocks, such as GameStop, where retail herd behavior drove the price of the stock to astronomical levels (Anand and Pathak, 2022).
The aforementioned factors collectively disrupt the proper functioning of price discovery, leading to reduced incentives for investors to accurately assess risk and value assets. In today’s market environment, this underscores the urgent need for more sophisticated tools. These tools should not only enhance the analytical capabilities of human decision-makers but also augment their capacity to navigate the increasingly complex and data-rich financial landscape. With such tools, investors can achieve precision and insight, critical for making informed decisions in the current market dynamics.
1.2 Potential of LLMs in Stock Selection and Financial Analysis
The emergence of Large Language Models (LLMs) like ChatGPT holds promise for substantial enhancements in financial analysis and stock selection. These sophisticated Artificial Intelligence (AI) systems, trained in vast amounts and types of corpora, have not only demonstrated the capacity to replicate intricate facets of human cognition but, in numerous instances, have surpassed them (OpenAI, 2023).
Quickly parsing through vast financial data, LLMs can discern intricate details from earnings reports to macroeconomic studies and process vast amounts of unstructured data such as news articles or expert opinions, more efficiently than human analysts (Guo et al., 2023). This swift deep content analysis enables them to pinpoint patterns often missed in traditional analysis (Alshami et al., 2023).
While humans may be influenced by cognitive biases, LLMs provide a more objective lens. They operate largely free from the emotional and cognitive biases that can cloud human judgment, although some biases from their training persist (Abramski et al., 2023; Atreides and Kelley, 2023). Furthermore, LLMs transcend the limitations of individual or team analysts, seamlessly scaling this capacity across products, markets and most importantly investors.
Although such AI systems may outperform humans in some specific tasks, their predominant value proposition lies in supporting human capabilities. They serve as robust tools that enhance decision-making, elevate the quality of analytical endeavors, and augment overall productivity (Noy and Zhang, 2023). For instance, complex tasks such as consolidating multiple financial statements from diverse subsidiaries of a large corporation can be streamlined by an LLM-based system (Kim et al., 2023). The latter is capable of highlighting discrepancies, flagging outliers, and providing an executive summary, a task that would be both time-consuming and susceptible to errors if done manually.
Validating the aforementioned observations, prominent players in the financial sector, including JPMorgan and Bloomberg, have recently launched AI-powered initiatives. Announcements of an AI-enable advisory platform (CNBC, 2023) and the release of a finance-centric LLM (Wu et al., 2023) from these entities, respectively, reaffirm the prominence of generative AI within the financial sector.
1.3 Paper Contributions
This paper makes several key contributions to the evolving discourse on the fusion of AI and financial analysis, primarily through the presentation of an innovative service for stock analysis, named MarketSenseAI111MarketSenseAI service is available at www.marketsense-ai.com., rooted in the power of LLMs. The salient contributions are outlined as follows:
-
1.
A novel LLM-driven Investment Service: Integrating various data sources to provide holistic stock investment insights.
-
2.
Explainable Investment Signals: Explainable investment insights to empower investors and ensure transparency.
-
3.
Versatile Use Cases: MarketSenseAI’s design allows for individual usage of service components, catering to diverse investor needs.
-
4.
Empirical Evaluation: Demonstrating the reliability and statistical significance of the service’s recommendations.
-
5.
Superior Performance: Highlighting its potential to outshine high-performing indices.
-
6.
An Independent Financial Advisor: Democratizing access to premium investment insights for retail investors, asset managers and other stakeholders.
In essence, this paper pioneers the integration of multi-source data analysis with the cognitive capabilities of LLMs to redefine stock selection and portfolio management. The resultant service not only enhances the quality of stock recommendations but ensures they are backed by robust, explainable reasoning.
The rest of this paper is structured as follows: Section 2 reviews related works, particularly focusing on AI in investment finance and the significance of LLMs. Section 3 introduces MarketSenseAI, detailing its architecture and key components. Section 4 describes the evaluation methodology, touching upon the data utilized and the comparison methods. Empirical findings are shared in Section 5. Section 6 discusses the results and Section 7 concludes the paper summarizing the primary contributions and insights.
2 Related Work
The integration of AI techniques in finance has experienced a pronounced surge in the past decade, increasingly overshadowing traditional statistical or algorithmic methodologies (OECD, 2021). Various dimensions of the financial domain have seen the infusion of AI, encompassing risk assessment (Fatouros et al., 2023a), banking services (Kotios et al., 2022), and trading operations (Bloomberg, 2019). Concurrently, the ascendance of foundational models, particularly the successive iterations of the Generative Pre-trained Transformer (GPT) and their affiliated chat interfaces, is effecting transformative shifts across diverse sectors. Notably, the financial sector is increasingly incorporating insights from such models into its business operations (Chui et al., 2023).
Despite the relatively recent public accessibility of these models — with ChatGPT API, for instance, becoming openly available only in March 2023 — a plethora of research endeavors have surfaced, elucidating methodologies that harness these Generative AI frameworks to augment investment paradigms.
Research presented in (Zaremba and Demir, 2023) elucidates ChatGPT’s potential in finance, especially for tasks necessitating natural language processing capabilities, such as sentiment analysis of financial news and summarizing earnings reports. Such tasks demonstrate a marked correlation with stock market dynamics (Tetlock et al., 2008). Furthermore, (Lopez-Lira and Tang, 2023) establishes the accuracy of ChatGPT in sentiment analysis of financial news, emphasizing the positive correlation between ChatGPT-generated scores and subsequent stock returns. Under several investment strategies, they found that ChatGPT outperforms traditional sentiment analysis methods, with the news sentiment contributing to impressive returns.
In comparative evaluations, (Li et al., 2023) posits that ChatGPT and GPT-4 surpass domain-specific models like FinBERT (Araci, 2019) and BloombergGPT (Wu et al., 2023) in several tasks including named entity recognition and news classification. Notably, while FinBERT exhibits superiority in financial sentiment analysis over ChatGPT, the research lacks prompt engineering and utilizes a dataset that inherently favors FinBERT. In contrast, (Fatouros et al., 2023b) presents evidence that ChatGPT, when applied with zero-shot prompting, outperforms FinBERT in financial sentiment analysis both in terms of classification performance and correlation with actual returns.
Further, (Kim et al., 2023) advocates the utility of GPT-3.5 in summarizing corporate disclosures, suggesting that sentiment derived from these summaries provides a more accurate predictor of stock market reactions than the original documents. This finding underscores the value GPT offers to investors seeking concise and targeted information.
Finally, (Yu et al., 2023) underlines the superior performance of LLMs when provided with news and historical stock returns, outpacing both traditional statistical models and other machine learning techniques in financial time series forecasting.
In summary, current research on LLMs in financial applications aligns with and reinforces the methodologies underpinning each component of the proposed system. However, to the best of our knowledge, the presented approach is distinct both in its design and evaluation methodology as it leverages multi-modal financial data, instead of barely news or news with historical prices, to deliver actionable and interpretable investment recommendations for the analyzed stocks while it outperforms high-performing ETFs. A key aspect of MarketSenseAI is its provision of detailed, AI-generated explanations for each recommendation, enhancing the interpretability and trustworthiness of the investment decisions. What is more, the evaluation considers transaction costs and number of trades highlighting the MarketSenseAI’s applicability in real-world settings.
3 Methods
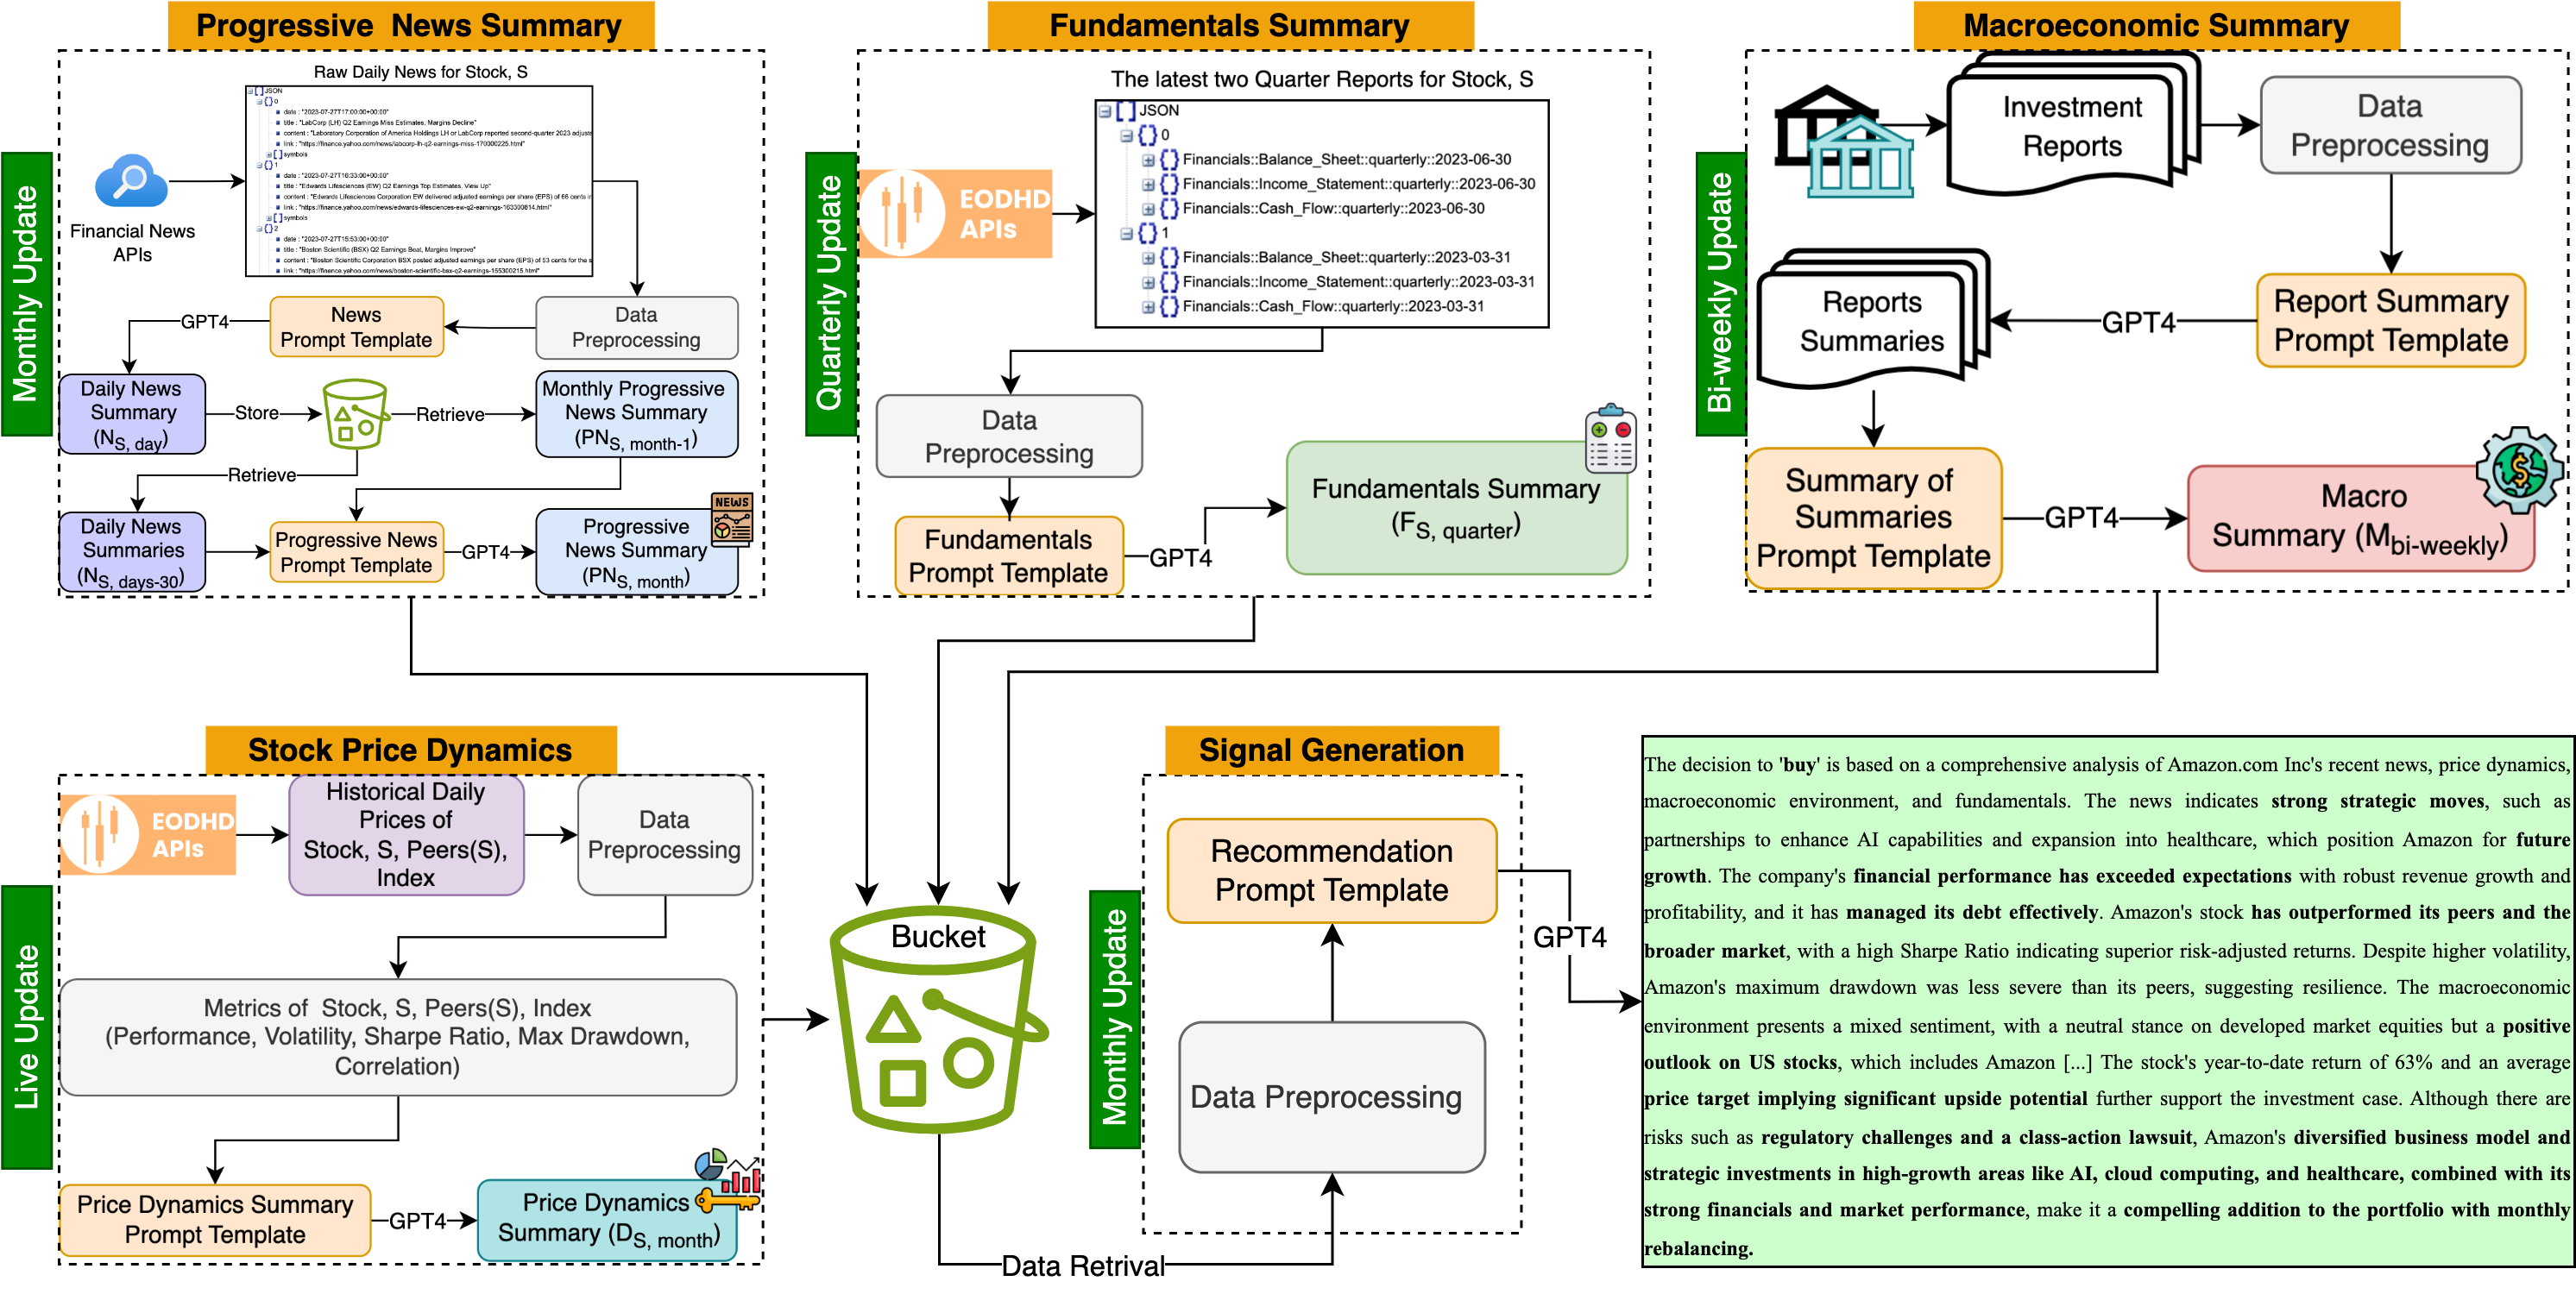
MarketSenseAI’s architectural framework, depicted in Figure 1, harmoniously merges four core components responsible for data inputs with a fifth component to facilitate the final recommendation (i.e., buy, hold, or sell). This component synthesizes all the information and provides a concise explanation for the respective decision. Each component is built upon OpenAI’s API and employs GPT-4 model (OpenAI, 2023), utilizing one-shot prompting and in-context learning to execute distinct tasks (Dong et al., 2022).
The framework is designed to emulate the decision-making process of a professional investment team, which involves tracking recent developments of the company or its sector (via a news summarizer), analyzing the company’s latest financial statements (through a fundamentals summarizer), conducting a macroeconomic analysis of the prevailing environment while taking into account the price action dynamics (via marco and price dynamics summaries).
The following paragraphs present the key components of this architecture in detail.
3.1 Progressive News Summarizer
The influence of company-specific news — encompassing announcements, reports, analyst opinions, and research findings — on market sentiment and subsequently stock prices cannot be understated (Malik, 2011). Depending on their content, such news could have a short, long-term, or minimal influence (Alqahtani et al., 2020). Hence, the sourcing and interpretation of news, demand meticulous handling in stock analysis.
The Progressive News Summarizer is responsible for news acquisition, condensation, and crafting a progressive synopsis of a stock’s most influential news. As portrayed in Figure 2, daily news items corresponding to a specific stock are fetched from available APIs. The study utilized EODHD222https://eodhd.com/financial-apis/stock-market-financial-news-api/ Stock Market and Financial News API for news sourcing.
The daily news for a company is preprocessed to exclude text unrelated to the company, such as clickbait articles, ensuring it is in an appropriate format for entry into the prompt. GPT-4, accessed via OpenAI’s API, is systematically prompted to distill the stock’s daily news and generate a concise daily news summary (). The latter is stored in a centralized repository.
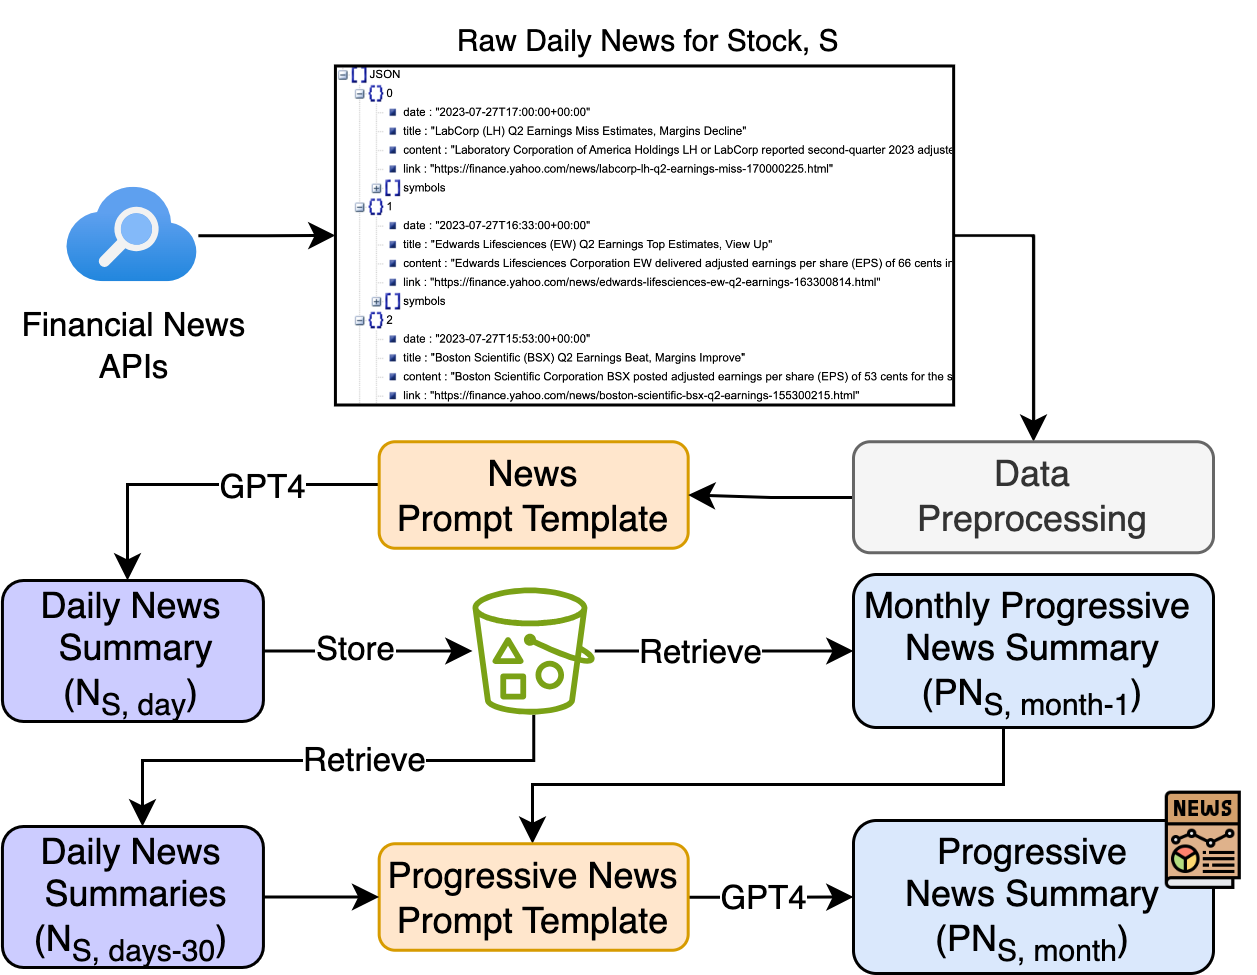
While this method provides a summary for a specific date, it is essential to include the ongoing narrative of news-related content for the company, particularly older news that remains significant. For example, in the case of a merger or legal dispute, an announcement about the company’s better-than-expected results may be less influential in the overall decision-making process. The Progressive News Summarizer addresses this by integrating the latest news summaries () with the preceding progressive summary (). The GPT-4 model generates a curated narrative that incorporates key events, becoming instrumental in MarketSenseAI’s subsequent analyses.
In this work, the Progressive News Summarizer is designed to operate on a monthly basis, ensuring that it captures the most current and pertinent state of a company as reflected in news coverage. Specifically, on the last day of each month, following market closure, it generates an updated summary for each stock. This summary is a sophisticated synthesis that takes into account both the daily news summaries of the past month and the Progressive News Summary formulated in the previous month. This process ensures that the summarizer consistently reflects the latest, most relevant, and significant developments, offering a comprehensive and current snapshot of the company’s status in the news.
Moreover, the flexibility of the Progressive News Summarizer’s design allows for its frequency to be modified to suit diverse investment strategies. It can be configured for different intervals, such as biweekly, weekly, or even daily, thereby accommodating various temporal requirements and investment strategies.
As illustrated by Table 1, the Progressive News Summarizer effectively captures the evolving narrative surrounding Apple Inc. (AAPL.US) over two distinct months in 2023. The summaries encompass a wide range of topics, from the company’s ongoing financial performance to its strategic initiatives and market challenges.
In October, the focus was on Apple’s significant role in the tech industry, marked by the launch of the iPhone 15 series and updates to its Apple Watch and AirPods. This period also highlighted challenges in smartphone sales, the impact of geopolitical issues, and fluctuations in stock performance. Unique to this month were reports on Apple’s interest in acquiring Formula 1 broadcasting rights and CEO Tim Cook’s sale of company stock, underscoring the company’s diverse strategic interests and executive decisions.
By November, while many earlier themes continued, new elements emerged. The summary shed light on Apple’s sales slowdown, competitive pressures in the smartphone market, and its strategic shift in partnerships, including the termination of its credit card agreement with Goldman Sachs. Notably, the company’s sustainability efforts and the launch of the M3 chip were highlighted, alongside its expansion in streaming content.
This table demonstrates the adaptive capability of the Progressive News Summarizer to integrate the latest corporate developments, market dynamics, and strategic maneuvers. It proves invaluable as a tool for delivering a comprehensive and current analysis of investment opportunities and industry trends. An example of a summary produced by this component is provided in Table 2.
| Topic | October | November |
|---|---|---|
| Financial Performance | Yes | Yes |
| Guidance for Q4 2023 | Yes | Yes |
| iPhone 15 Launch | Yes | Yes |
| New Apple Watch and AirPods | Yes | No |
| Smartphone Sales Challenges | Yes | Yes |
| Geopolitical Issues Impact | Yes | Yes |
| Stock Performance | Yes | Yes |
| Partnership with DuckDuckGo | Yes | No |
| CEO Tim Cook’s Stock Sale | Yes | No |
| Interest in Formula 1 Broadcasting | Yes | No |
| Product Lineup including M3 Chip | No | Yes |
| Sales Slowdown and Competition | No | Yes |
| Appeal Win in UK | No | Yes |
| Partnership with Goldman Sachs | No | Yes |
| Regulatory Issues in Payment Apps | No | Yes |
| Category | News Summary |
|---|---|
| Market Position | Dominant in the tech sector with record services revenue and robust product lineup, including the iPhone 15 series and new Mac products. |
| Sales Performance | Experiencing a slowdown, potentially dropping 5% in iPhone sales due to challenges in China and Japan. |
| Stock Analysis | Recent dip viewed as a buying opportunity by analysts, seasonal performance aligns with product launch cycle. |
| Legal and Strategic Moves | Won UK appeal on mobile browser and cloud gaming services, potentially ending credit card partnership with Goldman Sachs. |
| Innovation and Sustainability | Launched M3 silicon chip based on 3-nanometer technology, expanding streaming content on Apple TV+. |
| Regulatory Challenges | Faces oversight of digital wallets and payment apps, navigating geopolitical and economic risks. |
| Investment Consideration | Despite challenges, presents a promising opportunity with strategic expansion, innovative products, and strong services division. |
3.2 Fundamentals Summarizer
Fundamental data is crucial in predictive financial analytics, offering quantifiable metrics that reflect a company’s current health and future trajectory. As depicted in Figure 3, we utilize EODHD’s Fundamental Data API to source this quarterly information. To facilitate the comparison of financial data, we preprocess the data before inputting it into the prompt. Specifically, we employ numerical abbreviation techniques, using prefixes like ”million” and ”billion” to represent large numbers in a more compact and readable format. Additionally, data from different quarters are placed side by side in a table format. The resulting prompt, fed to the GPT-4 model, delves into aspects such as profitability, revenue trajectory, debt metrics, and cash flow dynamics by comparing the two most recent quarterly financial statements. This focus on recent data enables the LLM to detect shifts in financial performance, potentially correlating it with progressive news. Although LLMs traditionally face challenges in comprehending complex numerical data, our preprocessing approach, combined with GPT-4’s capabilities, ensures accurate comparison and interpretation. The fundamentals summarizer is designed to present an unbiased, factual overview of a company’s financial status, avoiding any direct investment recommendation.
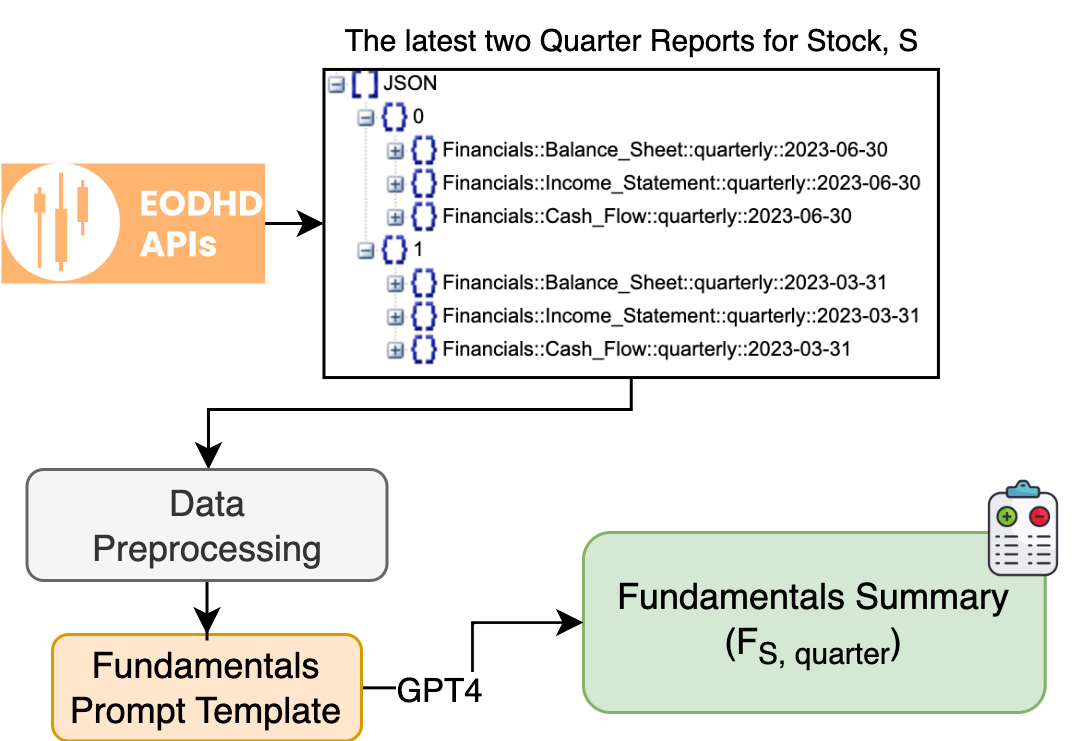
Table 3 showcases how the Fundamentals Summarizer distills key insights from financial statements, including income, balance, and cash flow statements. Similar to the Progressive News Summarizer, this component can be employed independently to provide a concise financial overview of the company being analyzed.
| Category | Fundamentals Summary |
|---|---|
| Profitability | Apple’s net income has increased from $19.88 billion in Q2 2023 to $22.96 billion in Q3 2023, indicating a strong profitability. The company’s gross profit also increased from $36.41 billion to $40.43 billion over the same period. |
| Revenue Growth | Total revenue increased from $81.80 billion in Q2 2023 to $89.50 billion in Q3 2023, showing a positive revenue growth |
| Debt Levels | The company’s total liabilities increased from $274.76 billion in Q2 2023 to $290.44 billion in Q3 2023. The long-term debt decreased slightly from $98.07 billion to $95.28 billion, but the short-term debt increased from $11.21 billion to $15.81 billion. The net debt also increased slightly from $80.87 billion to $81.12 billion. This indicates that the company’s debt level is increasing, which could be a concern if not managed properly. |
| Cash Flow | The company’s net cash from operating activities decreased from $26.38 billion in Q2 2023 to $21.60 billion in Q3 2023. However, the end period cash flow increased from $29.90 billion to $30.74 billion, indicating a positive cash flow generation. |
| Assets and Equity | Total assets increased from $335.04 billion in Q2 2023 to $352.58 billion in Q3 2023. The total stockholder equity also increased from $60.27 billion to $62.15 billion, indicating a growth in the company’s assets and equity. |
| Conclusion | Apple Inc. shows strong profitability and revenue growth. However, the increasing debt level needs to be monitored. The company has a positive cash flow generation, and its assets and equity are growing. |
3.3 Stock Price Dynamics Summarizer
The Stock Price Dynamics Summarizer, a key component of MarketSenseAI, analyzes and contextualizes the price movements and financial metrics of stocks. As shown in Figure 4, this component not only examines the target stock but also compares its performance with the five most similar stocks, based on company description and sector, and includes the broader market context represented by the S&P 500 index.
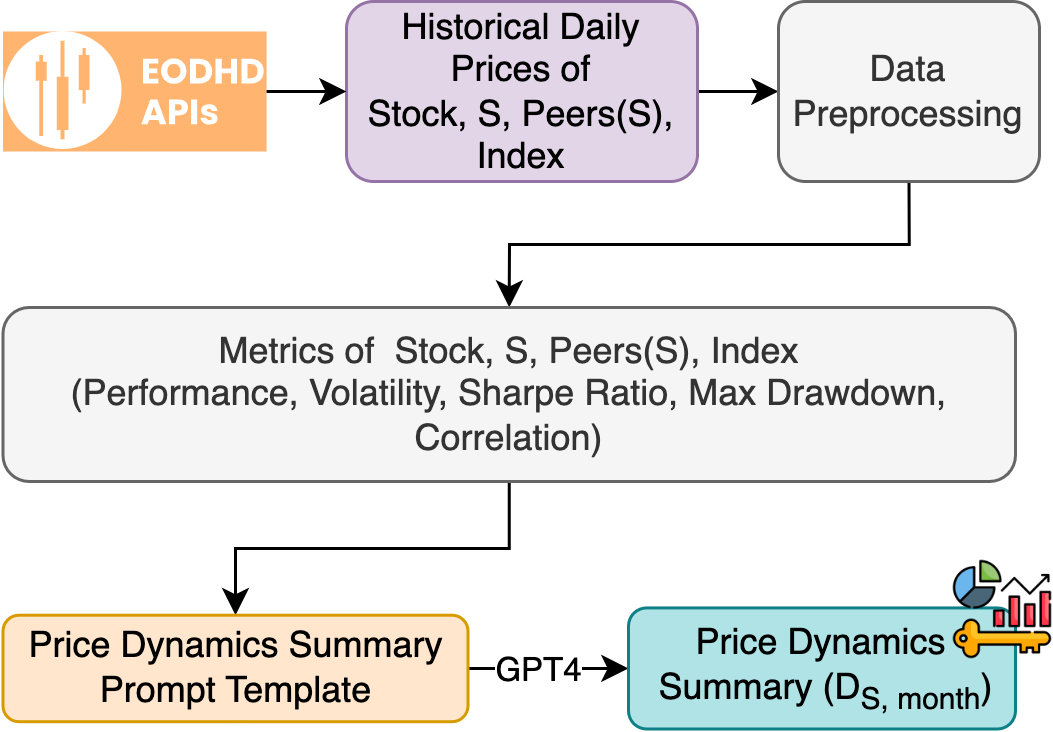
The methodology for identifying similar stocks is outlined in Algorithm 1, utilizing the MPNet language model to generate embeddings and compute similarity scores (Song et al., 2020). This approach ensures a thorough and relevant comparative analysis, integrating both individual stock performance and broader market trends.
The summarizer fetches market data for the target stock, its similar stocks, and the S&P 500 index. It analyzes key financial indicators, including cumulative returns and Sharpe ratios over 3, 6, and 12 months, and calculates volatility and maximum drawdown. These metrics, especially the Sharpe ratio and maximum drawdown, are crucial as they provide insights into the risk-adjusted returns and resilience of the stocks during market downturns, respectively (Korn et al., 2022). This comprehensive analysis offers a broad understanding of the stock’s performance relative to its peers and the broader market.
An example of the summarizer’s output is illustrated in Table 4, showcasing its ability to distill complex data into accessible insights. This provides a multi-dimensional view of the stock’s market dynamics in relation to similar companies and the overall market trends.
| Metric | Price Dynamics Summary |
|---|---|
| Cumulative Return | Apple Inc demonstrated a 29.0% return, outperforming the S&P 500 index’s 13.7% but underperforming tech peers like Adobe Systems and Amazon.com Inc. |
| Sharpe Ratio | Apple’s Sharpe Ratio of 1.34 indicates a favorable risk-adjusted return compared to the market index Sharpe Ratio of 0.99, suggesting better compensation for the risk taken. |
| Volatility | Apple’s volatility at 21.7% is lower than that of Alphabet Inc, Adobe, and Amazon, indicating less erratic stock price movements. |
| Maximum Drawdown | Apple experienced a maximum drawdown of -16.0%, which is less severe than the drawdowns of Adobe, Amazon, and Best Buy Co. Inc. |
| Correlation | Apple shows a high correlation with the S&P 500 (0.76) and moderate correlation with other tech stocks like Microsoft Corporation and Amazon. |
| Conclusion | Apple has shown resilience and strong risk-adjusted performance relative to the broader market and some tech peers, with lower volatility and a relatively modest maximum drawdown. |
3.4 Macroeconomic Environment Summary
Conducting an in-depth macroeconomic analysis is essential for making informed investment decisions and effective capital allocation. Such analysis offers vital insights into the overall economic health and performance, significantly influencing the profitability and value of individual companies as well as the broader stock market. By considering major forces that shape the investment landscape, such as the Covid-19 pandemic or the Ukraine war, investors can make better-informed decisions.
To facilitate this, MarketSenseAI includes a component named MarketDigest, depicted in Figure 5. This component synthesizes investment reports and research articles biweekly, providing succinct summaries of complex economic data and trends. MarketDigest sources information from a variety of publicly accessible reports from leading banks and investment institutions, including Goldman Sachs, Morgan Stanley, UBS, and BlackRock.
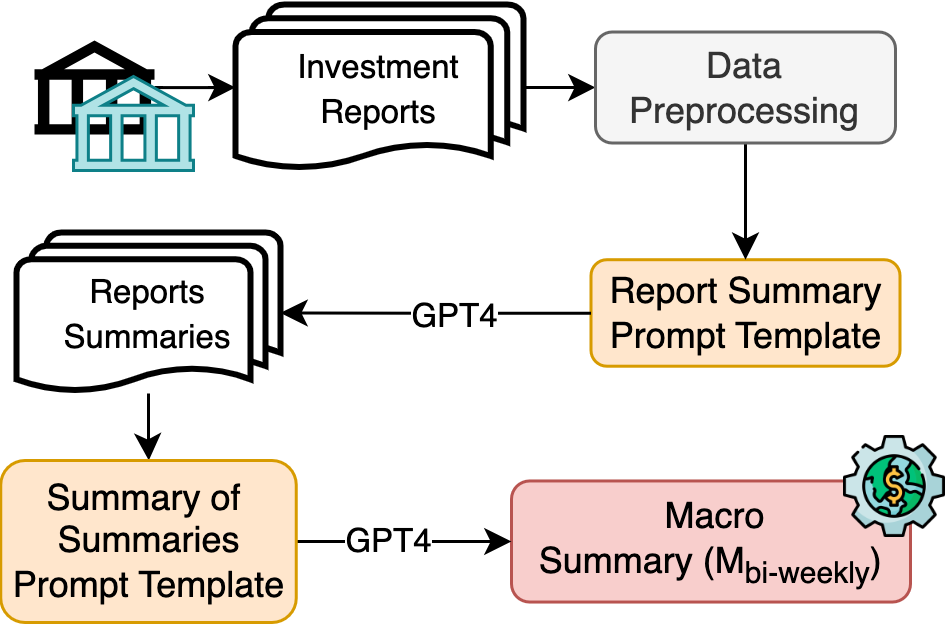
The process begins by transforming these reports and articles into text form. Subsequently, the component utilizes GPT-4 to summarize individual reports, and then, in a second step, it condenses these individual summaries into a comprehensive overview. This approach allows MarketDigest to encapsulate diverse perspectives and analyses into a coherent narrative, offering a consensus view on the macroeconomic climate, central bank policies, preferred sectors or countries, as well as geopolitical trends. The output is concise yet thorough, accounting for potential contradictions or differing viewpoints among market analysts and experts.
Table 5 provides an example of a MarketDigest summary. Notably, KM Cube Asset Management333https://www.km3am.com/ already disseminates MarketDigest as a bi-weekly newsletter to its clientele, underscoring its practical application and value in the real-world financial context (Metaxas, 2023).
| Category | Macro Summary |
|---|---|
| Inflation | US core PCE inflation eased to 3.5% in October, indicating a disinflation trend. |
| Interest Rates | Market-implied pricing suggests potential rate cuts in March 2024 for both the US and Europe. |
| Japan’s Monetary Policy | Bank of Japan expected to weaken or abandon yield curve control due to domestic inflation. |
| ECB Policy | European Central Bank has begun balance sheet unwind. |
| Bond Market Outlook | Positive outlook on short- to medium-term developed market sovereign bonds. |
| Equity Market Stance | Neutral stance on developed market equities, with US stocks as largest allocation. |
| Global Growth | Global economy expected to experience below-trend growth in 2024. |
| Investment Strategy | Portfolios should maintain neutral exposure to risk and equities, overweight allocation to quality fixed income. |
| US Dollar | US dollar’s position as leading global reserve currency showing signs of vulnerability. |
| Employment Risks | Risks to employment are on the downside, with leading indicators of employment deteriorating significantly. |
| Market Rally | Global financial markets experiencing significant rally, boosted by cooling inflation and falling Treasury yields. |
| Contradictions | Positive outlook on bonds but neutral on equities; US dollar vulnerability but remains a key currency. |
| Positive Sentiment | Short- to medium-term bonds, inflation-linked bonds, private market income, quality fixed income, US stocks. |
| Negative Sentiment | Credit, US Treasury, private markets, small-cap equities, Chinese equities. |
| Neutral Sentiment | Developed market equities, investment-grade credit, real estate, private equity funds, emerging markets outside China. |
3.5 Signal Generation
The signal generation component, as the final stage in the MarketSenseAI pipeline (Figure 1), integrates insights from the news, fundamentals, price dynamics, and macroeconomic analysis components. This process results in a comprehensive investment recommendation for a specific stock, paired with a detailed rationale.
In essence, we argue that an investment decision for a stock () is a function of the most important developments for the underlying company available in some extent in the news (), the company’s financial health (), stock’s performance in relation to competitors and the market (), as well as the broader macroeconomic environment (see Equation 1).
| (1) |
We posit that the state-of-the-art LLM, GPT-4, possesses the requisite capacity to weigh and reason upon these different categories of data, as evidenced by its demonstrated proficiency in complex financial reasoning tasks (Callanan et al., 2023). In its operation, the GPT-4 model is prompted to adopt the role of an expert financial analyst. This approach employs a Chain of Thought methodology, guiding the model through a multi-step analysis to make a decision on portfolio allocation for the upcoming month (Wei et al., 2022). The prompt structure is as follows:
-
1.
News Analysis: The model first evaluates the latest news summaries regarding the target company, assessing their potential impact on the stock’s performance.
-
2.
Price Dynamics Analysis: Next, it compares the stock’s price dynamics with those of related stocks and the overall market, offering a relative performance perspective.
-
3.
Macroeconomic Environment Analysis: The model then assesses the broader macroeconomic landscape and its implications for the target company, considering global economic trends and events.
-
4.
Fundamentals Analysis: The final step involves a review of the company’s fundamental financial data, analyzing its current financial health and future prospects.
The model’s output, structured in a concise format, includes a decision (”buy,” ”sell,” or ”hold”) along with a clear, step-by-step explanation of the reasoning behind this choice. The terms ”buy” and ”sell” are defined within the context of portfolio positioning (long and short positions, respectively), while ”hold” indicates no inclusion in the portfolio’s composition regarding the specific stock.
Table 6 demonstrates MarketSenseAI’s functionality in generating an explainable investment recommendation for Apple Inc. at the end of November 2023, suggesting a ”hold” position in the rebalanced portfolio for the following month. The table reveals mixed signals, balancing positive developments such as strong financials and successful product launches against challenges like sales slowdowns, competitive pressures, and regulatory scrutiny. The overall decision to ”hold” reflects a prudent approach, considering the various contrasting factors at play.
| Decision | Explanationa |
| HOLD | The analysis […] presents a mixed picture. Starting with the news analysis, while Apple remains a dominant player in the tech sector with solid financials and a successful product launch in South Korea, it faces challenges such as a sales slowdown, competitive pressures, and regulatory scrutiny. The Chinese government ban and sluggish sales in China and Japan are concerning, but analysts see the recent stock dip as a buying opportunity, suggesting underlying strength. The company’s strategic moves, such as potentially ending its credit card partnership with Goldman Sachs, indicate a focus on its services business, which is a positive sign. However, the legal challenges and geopolitical risks cannot be ignored. In terms of price dynamics, Apple has outperformed the S&P 500 […] strong risk-adjusted performance. However, the maximum drawdown and the high correlation with the market suggest that Apple is not immune to market downturns. The macro environment analysis reveals a disinflation trend in the US and potential rate cuts in 2024, which could be favorable for equities. However, the global economy is expected to grow below trend, and there is a neutral stance on developed market equities, suggesting caution. The positive outlook on quality fixed income and US stocks is encouraging, but the vulnerability of the US dollar and downside risks to employment add uncertainty. Fundamentals analysis shows strong profitability and revenue growth for Apple, with increased net income and gross profit. The company’s debt levels have risen, which warrants monitoring, but the positive cash flow generation and growth in assets and equity are reassuring. Considering the mixed signals […] a ”hold” decision is prudent[…] |
-
a
Note: Green text highlights positive developments for the company/stock, while red text marks elements with negative sentiment.
The analysis of text similarity in MarketSenseAI, as shown in Figure 6 and detailed in Table 7, reveals how the model’s reasoning aligns with the dynamics of the input data, crucial for generating monthly investment signals. The high similarity scores in the ”News” and ”Price Dynamics” summaries (mean scores of 0.923 and 0.907, respectively) reflect the model’s emphasis on these rapidly changing factors, recognizing their immediate impact on stock prices. This is especially relevant for short-term, monthly predictions where current developments and price trends can significantly sway market behavior.
In contrast, outputs from ”Fundamentals” and ”Macro” components, with mean similarity scores of 0.849 and 0.803, respectively, exhibit a lesser direct influence on the model’s monthly decisions. The fundamentals, updated quarterly, provide a stable but less frequently changing view of a company’s financial health, while macroeconomic data, being broader and more generic, have a more moderate impact on short-term investment decisions.
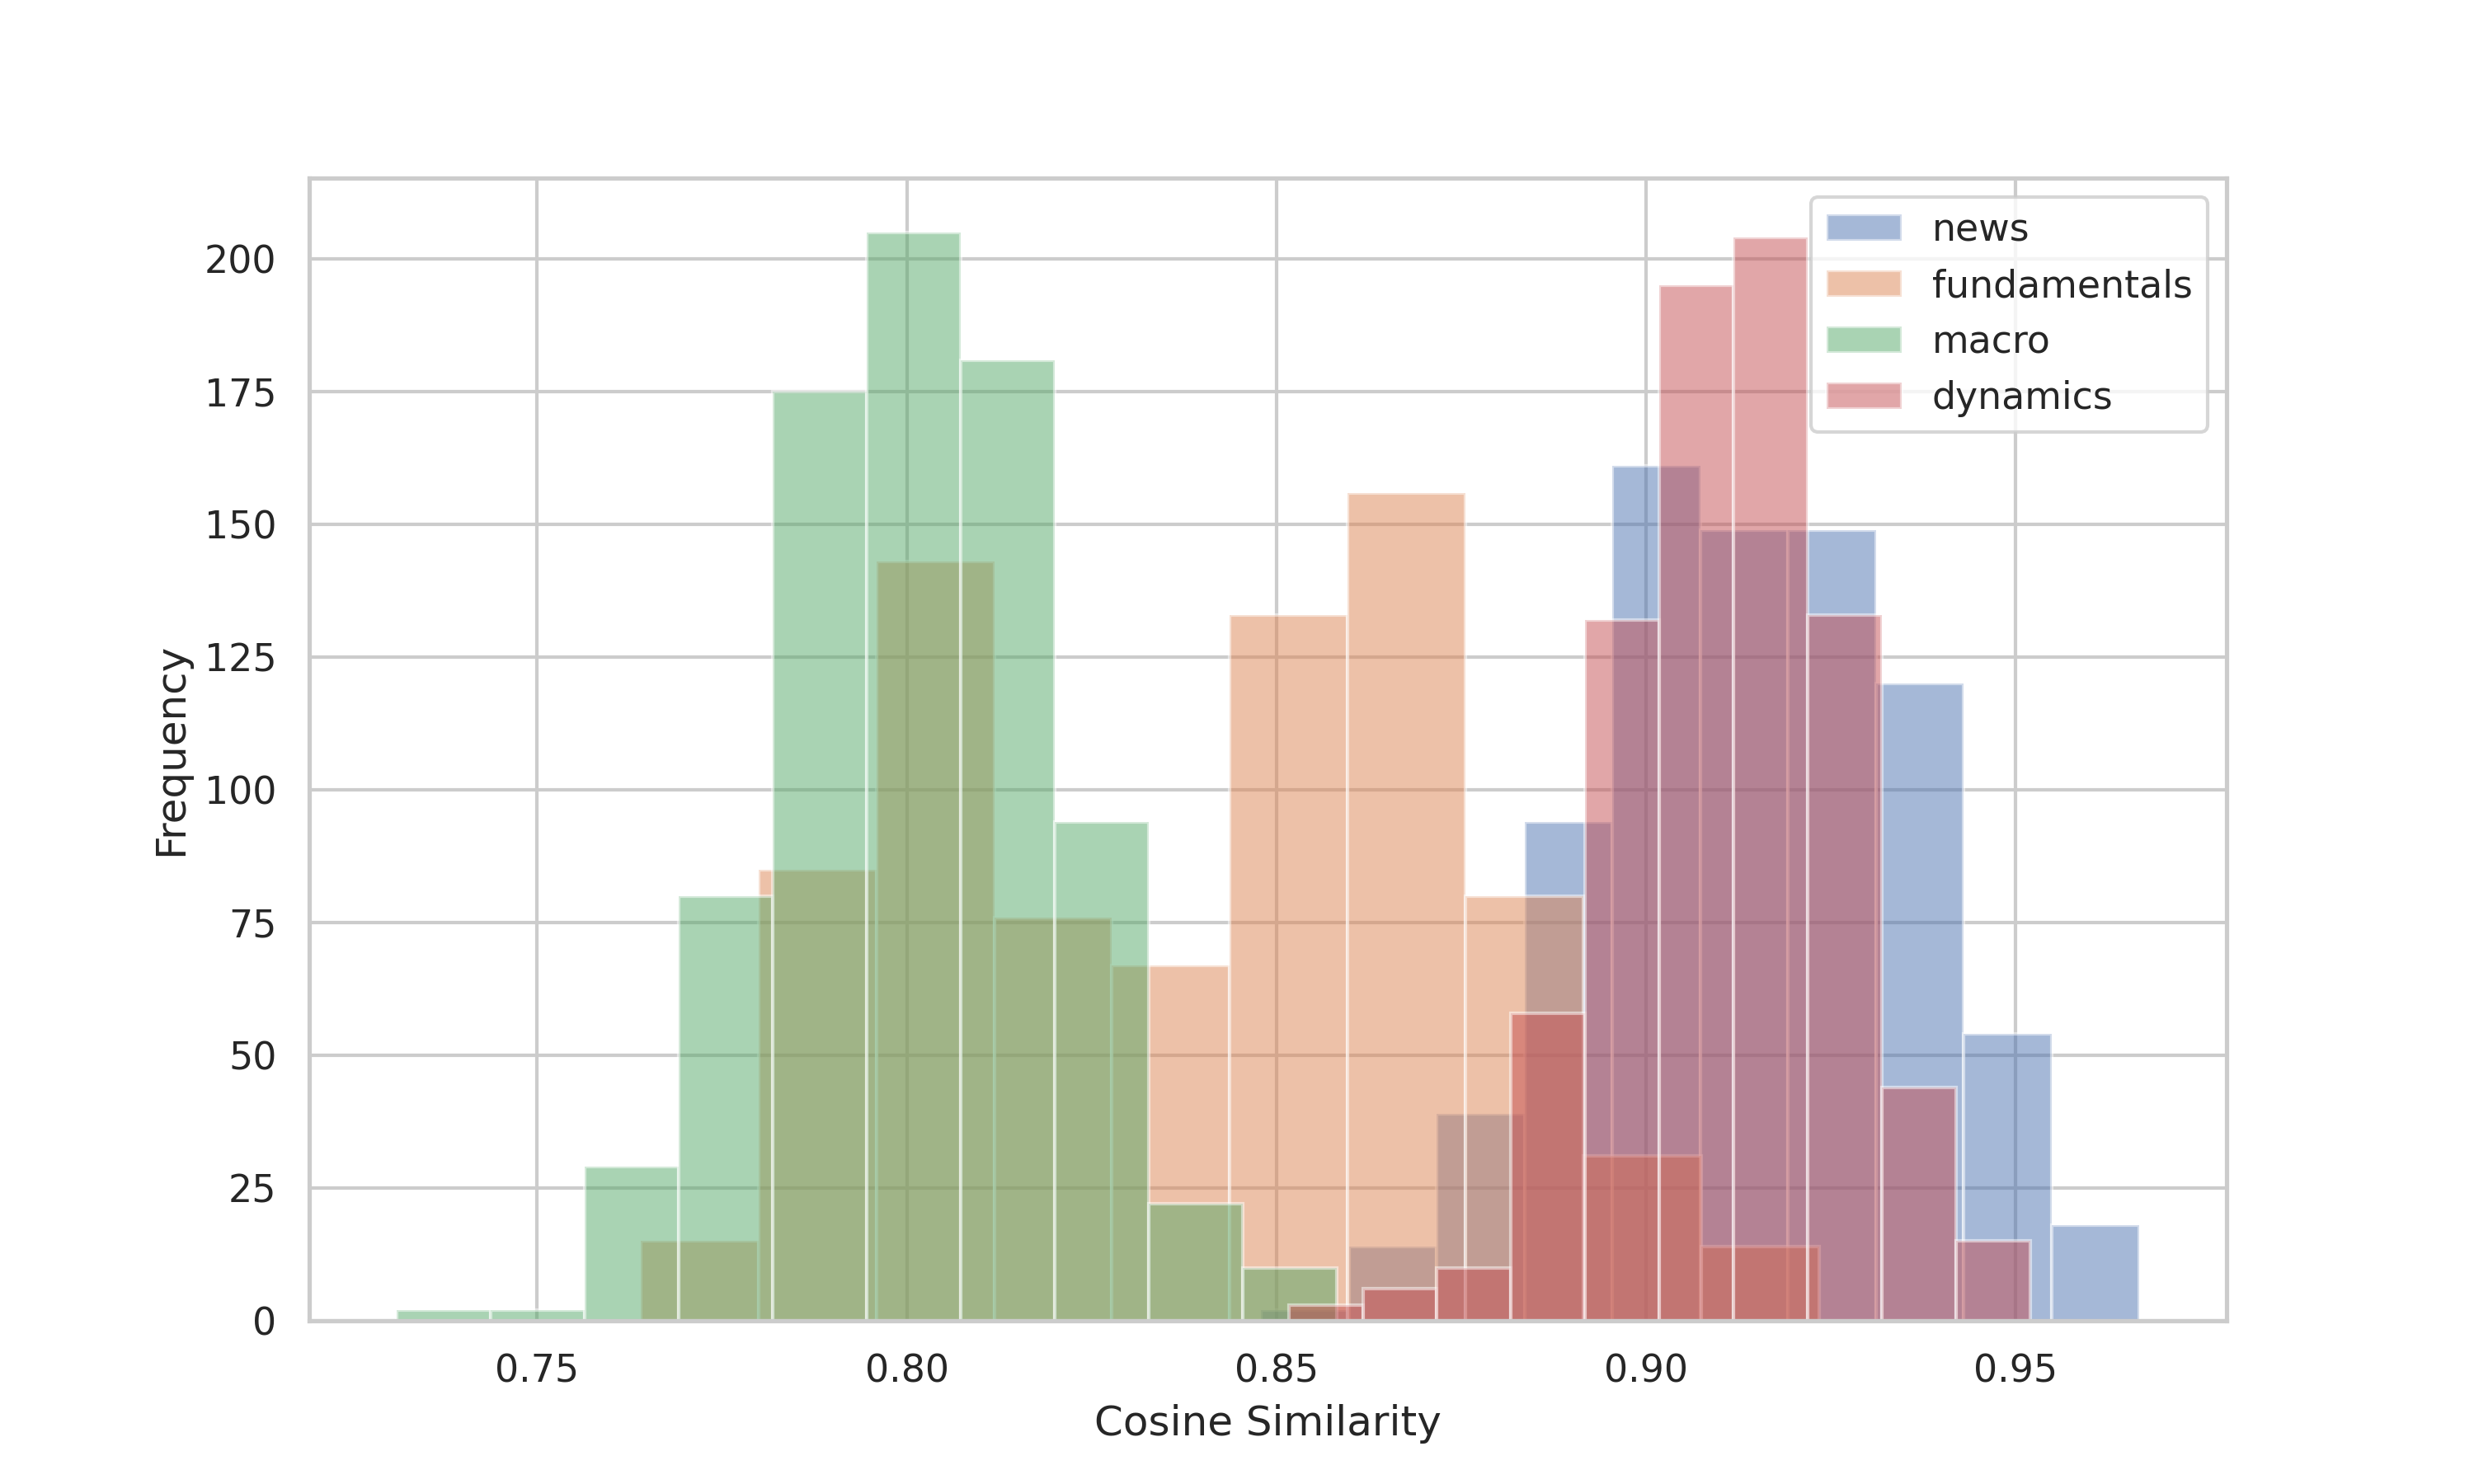
| Component | mean | std | min | max |
|---|---|---|---|---|
| News | 0.923573 | 0.016005 | 0.865069 | 0.967842 |
| Price Dynamics | 0.907652 | 0.013444 | 0.854822 | 0.942414 |
| Fundamentals | 0.849269 | 0.033589 | 0.769349 | 0.934139 |
| Macro | 0.802891 | 0.017896 | 0.752009 | 0.870194 |
This analysis underscores MarketSenseAI’s ability to process and integrate various data categories, tailoring its decision-making process to the nature of the input data. This approach is key to providing accurate and timely investment recommendations considering investment horizon.
4 Experiments
This section outlines the data sources and methodologies employed in MarketSenseAI’s analysis, along with the experimental setup used to evaluate and interpret the generated investment signals and explanations.
4.1 Data
The evaluation of MarketSenseAI’s performance leverages stocks listed in the S&P 100 index, comprising the 100 largest and most established companies in U.S. equity markets. These stocks, due to their public visibility and the volume of analysis they attract, present a challenging environment for achieving superior stock-selection performance, especially when considering transaction costs (Fontinelle, 2022).
The assessment period spans from December 1, 2022, to November 30, 2023. During this time, MarketSenseAI utilized diverse datasets for its in-context learning processes:
-
1.
News: A total of 136,136 articles published from December 1, 2022, to November 30, 2023, averaging 3.72 articles per day per stock, with a standard deviation of 5.69. The mean number of tokens per article was 817, with a standard deviation of 1161. These data produced 36,904 daily, company-specific, news summaries and 1,200 monthly progressive summaries.
-
2.
Fundamentals: Financial data were gathered from 612 quarterly reports of the S&P 100 stocks, starting from the second quarter of 2022. This data set produced 511 unique fundamentals summaries, averaging about 5 per stock.
-
3.
Descriptions: : Concise descriptions of each stock and its sector, employed by Algorithm 1 to identify similar stocks.
-
4.
Prices: Historical daily stock prices (adjusted close) from January 1, 2022, to November 30, 2023, were analyzed to compute stock price dynamics. This data was employed by the Stock Price Dynamics component to produce one summary per month for each stock, totaling 1,200 summaries.
-
5.
Macro: 132 investment reports (20-30 pages each) from major financial institutions published between April and November 2023, were analyzed by MarketDigest. For predictions made from January to March 2023, macroeconomic summaries were not available for the signal generation component, resulting in 8 macroeconomic summaries used for signal generation.
To evaluate the system, the ”Signal Generation” component was fed at the end of each month with the latest available summaries (news, fundamentals, price dynamics, macro). While macroeconomic summaries were identical for all stocks, fundamental summaries were updated only when a new quarterly report for a stock became available. News and price summaries, being more dynamic, provided updated stock-specific insights each month. The investment signals generated by MarketSenseAI were subsequently assessed based on the actual stock performance in the month following the signal. Out of the 1,200 signals produced (12 months x 100 stocks), a breakdown of these signals reveals 220 ”buy”, 972 ”hold”, and 8 ”sell” signals. At the time of writing (December, 2023), 1,100 of these signals have been evaluated. This limitation is due to the time frame of the study, which allows for the analysis of only those signals where subsequent market data is available to measure their accuracy.
4.2 Evaluation
The evaluation of MarketSenseAI’s generated signals focused on comparing them against bootstrapped signals and actual stock price movements under various investment strategies. Additionally, GPT-4’s capability to rank ”buy” signals based on their explanations was utilized as an indirect assessment of the quality of the signals and their accompanying explanations.
4.2.1 Bootstrapping
Bootstrapping is a statistical method that involves resampling data with replacement to estimate the variability of specific statistics, including standard errors, confidence intervals, and various accuracy metrics (Efron and Tibshirani, 1986). This method is particularly useful when dealing with complex or unknown data distributions.
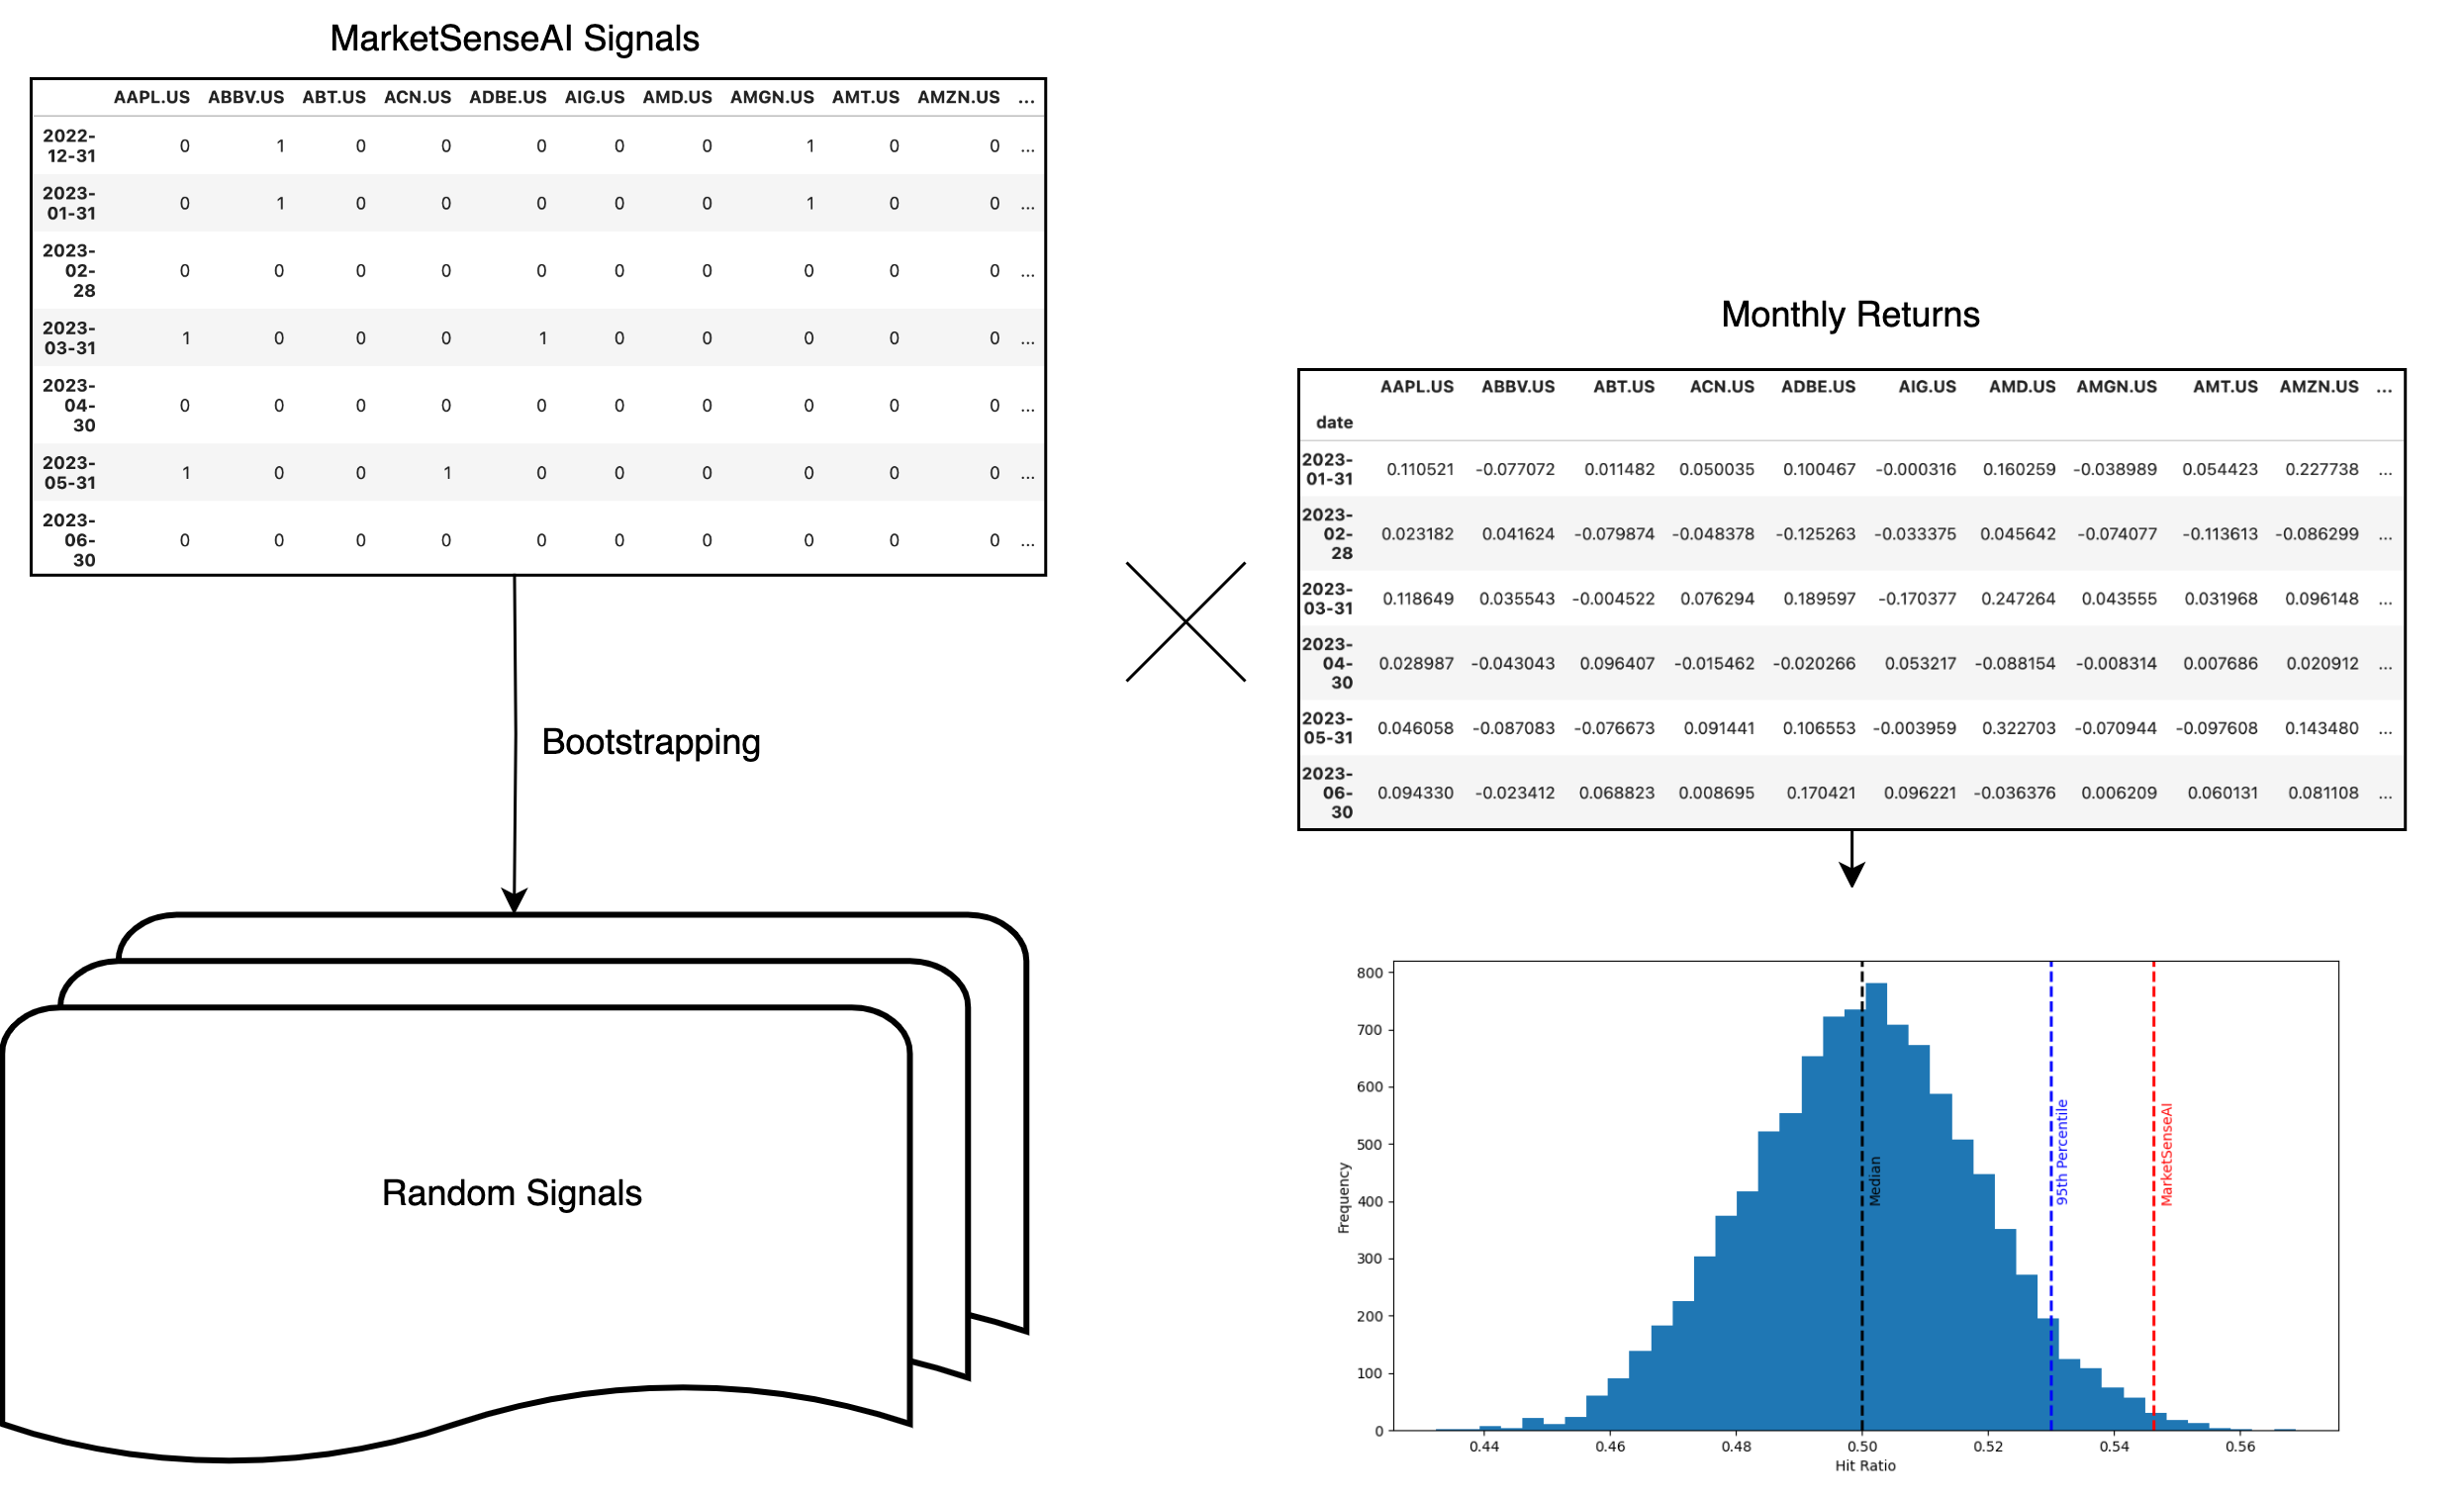
In this study, bootstrapping was employed to evaluate MarketSenseAI’s performance and its statistical significance against randomized investment signals. For this purpose, a matrix of signals for MarketSenseAI () was used, from which samples were drawn randomly, representing ”sell” (-1), ”hold” (0), and ”buy” (1) positions. It is crucial to note that the distribution of these randomly generated signals might not mirror the distribution within the MarketSenseAI dataset.
This approach ensures that the findings are not due to random chance and provides a robust assessment of the model’s performance. After an iterative examination, we settled on creating 10,000 random portfolios for bootstrapping, observing that additional samples did not significantly alter the evaluation outcomes.
In this context, multiple randomized signals were generated for the stocks under consideration over the designated time frame. MarketSenseAI’s performance was then compared against these randomized signals using two primary metrics. Firstly, the portfolio’s cumulative returns were calculated by adhering to ”buy”, ”sell”, or both signals, applying equal weight to each and implementing monthly rebalancing (as depicted in Figure 7 and defined in Equation 2). Secondly, the effectiveness of the signals was evaluated using a hit ratio, with the following month’s actual returns serving as the reference benchmark (as detailed in Equation 3).
The portfolio performance (cumulative return) is given by:
| (2) |
The hit ratio is calculated as:
| (3) |
where,
| . | |||
| and 0 otherwise. |
This methodology ascertains the substantive impact of MarketSenseAI as it discerns the tangible benefits of MarketSenseAI’s recommendations as opposed to adhering to random trading signals.
4.2.2 Market Performance
This part of the assessment compares the performance of portfolios constructed based on MarketSenseAI’s signals with actual market prices. The design of the MarketSenseAI-based portfolios and the baseline portfolios and the evaluation metrics are detailed in Table 8 and Table 9, respectively. The MarketSenseAI portfolios were formulated by following the service’s signals, generated on the last day of each month after market closure, and held for one month.
| Abbr. | Description |
|---|---|
| MS | Equally weighted portfolio rebalanced monthly based on both ”buy” and ”sell” signals of MarketSenseAI. |
| MS-L | Equally weighted portfolio rebalanced monthly based on the ”buy” signals of MarketSenseAI. |
| MS-L-Cap | Capitalization-weighted portfolio rebalanced monthly based on the ”buy” signals of MarketSenseAI. |
| MS-Top10-SR | Equally weighted portfolio rebalanced monthly based on the 10 stocks with the best Sharpe Ratio of all the stocks with a ”buy” signal. |
| S&P100-Eq | Equally weighted portfolio of all the stocks of the S&P 100 index. |
| S&P100 | Capitalization-weighted S&P 100 index (OEX ETF). |
| Naive | Equally weighted portfolio rebalanced monthly for all S&P 100 stocks with price above their corresponding 200 day moving average, fully allocated. |
| Naive-Top10 | Equally weighted portfolio rebalanced monthly based on the 10 stocks with the best Sharpe Ratio and their price above their corresponding 200 day moving average, fully allocated. |
| MS-TopN-GPT | Equally weighted portfolio rebalanced monthly based on the stocks with the best score produced by GPT-4 after processing of all the stocks with a ”buy” signal. |
| MS-High-GPT | Equally weighted portfolio rebalanced monthly based on stocks with score grater than 7.5/10 produced by GPT-4 after processing of all the stocks with a ”buy” signal. |
| MS-Low-GPT | Equally weighted portfolio rebalanced monthly based on stocks with score lower or equal than 7.5/10 produced by GPT-4 after processing of all the stocks with a ”buy” signal. |
| Metric | Description |
|---|---|
| Total Return | The portfolio cumulative returns over a specific period (Equation 2) |
| Sharpe Ratio | A measure of risk-adjusted return; calculated as the average return earned in excess of the risk-free rate per unit of volatility. |
| Sortino Ratio | Similar to the Sharpe Ratio, but measures returns relative to downside risk, focusing on negative asset volatility. |
| Volatility | A statistical measure of the dispersion of returns for a given security or market index, measured using standard deviation. |
| Win Rate | The percentage of trades that are profitable out of the total number executed. |
| Maximum Drawdown | The maximum observed loss from a peak to a trough of a portfolio, before a new peak is attained. |
| Maximum Drawdown Duration | The length of time (days) for which the maximum drawdown is observed, measured from peak to recovery. |
4.2.3 Ex-post evaluation with Ranking
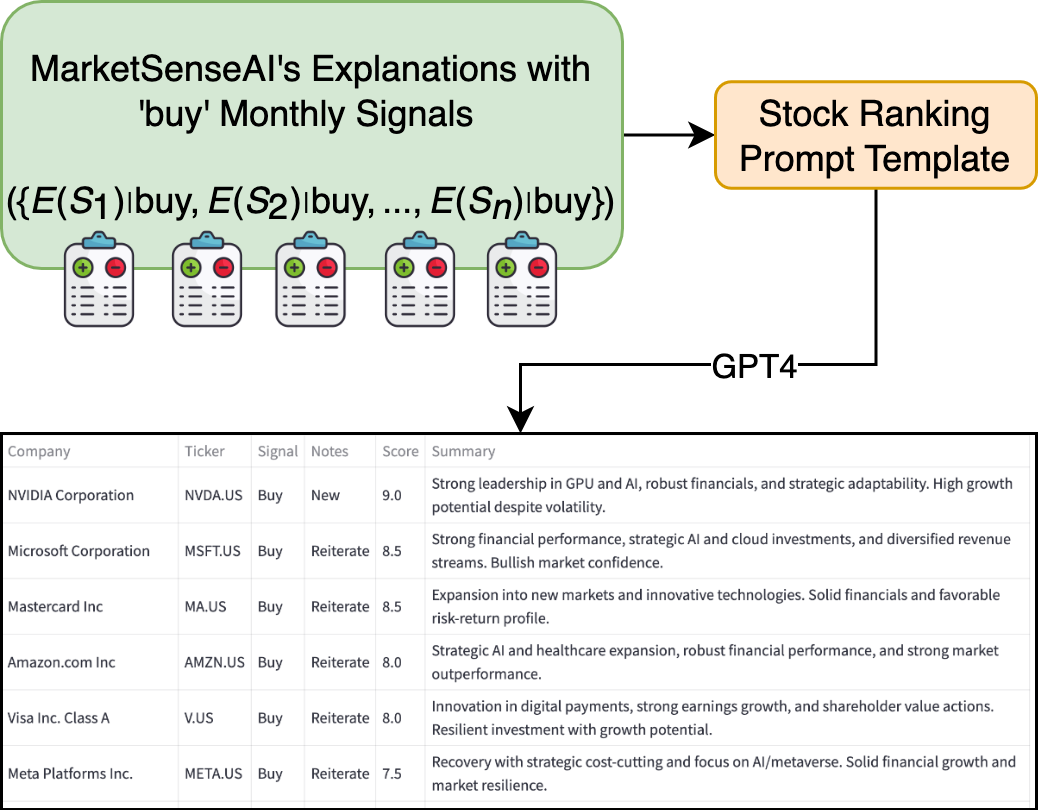
An additional layer of analysis was introduced to evaluate the quality and context of the explanations accompanying the ”buy” signals. This process involved incorporating a ranking mechanism into the system, as depicted in Figure 8. The GPT-4 model was fed with all explanations that led to ”buy” signals for each stock within a given month. The set included all explanations associated with a ”buy” indication for each stock . The prompt directed GPT-4 to rank these explanations on a scale of 0 to 10, with 10 indicating a strong buy.
The rationale behind this approach is that if MarketSenseAI’s outputs are insightful, specific, and actionable, GPT-4 should be able to rank them effectively (Shu et al., 2023; Liu et al., 2023). Stocks with higher scores are expected to contribute to better-performing portfolios. This method also provides an alternative ranking, filtering, and weighting mechanism for portfolio management. This evaluation approach was implemented in the last three investment strategies listed in Table 8.
4.3 Setup
The implementation of MarketSenseAI was executed using Python 3.11, leveraging the LangChain framework (Chase, 2022) for prompt construction and utilizing OpenAI’s API for accessing the GPT-4 model. Each component of MarketSenseAI, as outlined in Section 3, functions independently, running as a standalone script. The outputs from these components are systematically stored in a datastore, ensuring organized and efficient data management.
For the backtesting of the portfolios used in the evaluation process, the VectorBT PRO library444https://vectorbt.pro/ was chosen. This library is known for its versatility and efficiency in conducting financial analysis and backtesting investment strategies, making it a suitable choice for rigorously evaluating the performance of MarketSenseAI-generated portfolios.
5 Results
This section presents the empirical findings obtained from the multifaceted evaluations outlined in Section 4.
5.1 Bootstrapping Evaluation Results
Table 10 displays the outcomes of the bootstrapping evaluation, which is instrumental in contrasting the efficacy of MarketSenseAI with various bootstrapped portfolios. This evaluation includes an assessment of MarketSenseAI’s performance with detrended returns, providing a refined analysis of its signal generation capability. The detrending of returns is mathematically expressed as:
| (4) |
In this formula, denotes the detrended return for asset at time , is the actual return, and is the average return at time across all assets. This detrending process is crucial as it helps to isolate the performance of individual stocks from the broader market trends, thereby offering a clearer perspective on MarketSenseAI’s signal precision.
The table evaluates both cumulative returns () and hit ratios (), along with their respective quantiles ( and ), delivering an extensive view of the system’s effectiveness in comparison to randomized strategies.
| Signals | ||||
|---|---|---|---|---|
| Detrend-Buy | 6.04 | 95.99 | 51.26 | 96.28 |
| Buy | 21.20 | 97.39 | 53.77 | 74.47 |
| Detrend-Sell | 24.82 | 100 | 100 | 100 |
| Sell | 14.98 | 100 | 83.33 | 100 |
| Detrend-Both | 7.55 | 99.36 | 52.68 | 92.69 |
| Both | 21.86 | 100 | 54.63 | 99.45 |
-
a
Note: MarketSenseAI cumulative returns and hit ratio (%) and their quantiles (, ) in the bootstrapped distribution.
The results from the bootstrapping evaluation reveal that MarketSenseAI’s signals notably outperform random chance, as evident from the high quantiles achieved in both cumulative returns () and hit ratios () across diverse signal categories. This superior performance holds true even when assessing detrended returns, indicating MarketSenseAI’s proficiency in discerning profitable investment opportunities from broader market movements.
A particularly key observation is the marked increase in the hit ratio quantile for the ”Buy” signals following detrending. Considering the upward trend of the market during the evaluation period, this indicates that MarketSenseAI’s recommendations have a greater probability of success compared to a random signal generation approach. This finding is significant as it highlights the model’s capability in effectively pinpointing potential market-outperforming opportunities.
In essence, the bootstrapping evaluation robustly demonstrates MarketSenseAI’s capacity to produce trading signals that significantly surpass what would be expected by mere chance.
5.2 Market Performance Evaluation Results
It is important to note that the year 2023 witnessed disparate performances among stocks. While technology giants and AI-centric companies experienced a robust year, others showed modest returns (Thompson, 2023). Our analysis places special emphasis on equal-weighted indices, which helps counterbalance this disparity and illustrates MarketSenseAI’s potential. Additionally all results presented below account for transaction costs to assess real-world applicability and effectiveness of MarketSenseAI-derived strategies.
5.2.1 Vanilla strategies
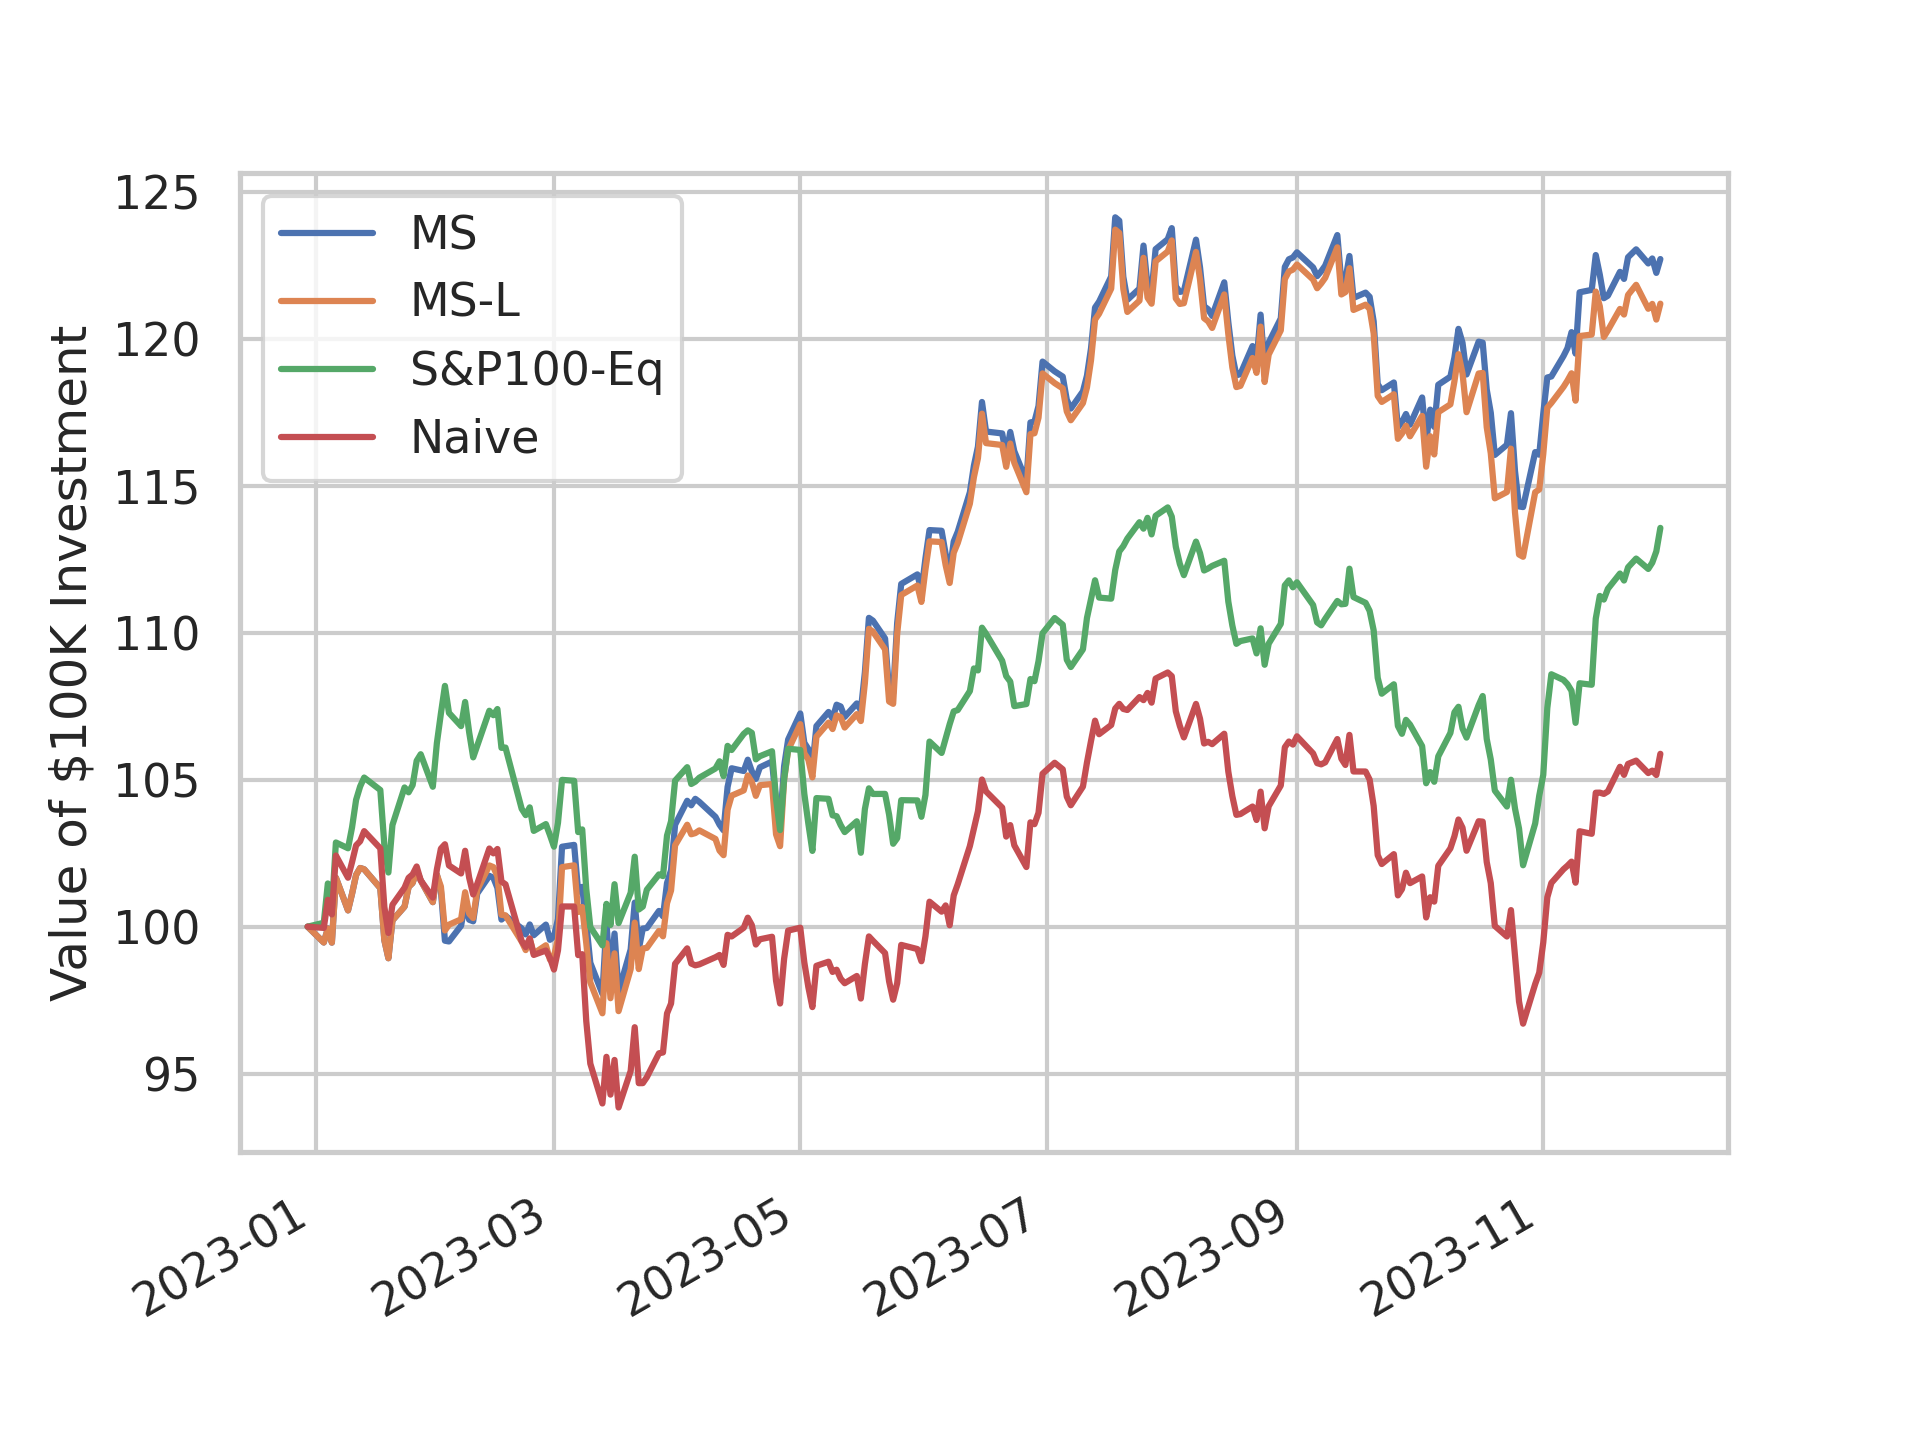
The assessment of MarketSenseAI’s vanilla strategies, as detailed in Table 11 and illustrated in Figure 9, reveals the efficacy of LLM-driven investment strategies. The strategy following the complete set of MarketSenseAI’s signals (MS) equally weighted, yields a total return of 22.72% with a Sharpe and Sortino ratio of 2.02 and 3.13, respectively. The long-only version (MS-L) that takes into account only the ”buy” signals of MarketSenseAI gives similar results (somewhat lower) given the relatively few ’sell’ signals generated.
These results significantly outperform the equally-weighted S&P 100 (S&P100-Eq) both in total and risk-adjusted returns, with an ”alpha” of approximately 9%. The naive trend-following strategy (Naive), often used by market participants, yielded significantly lower results in 2023.
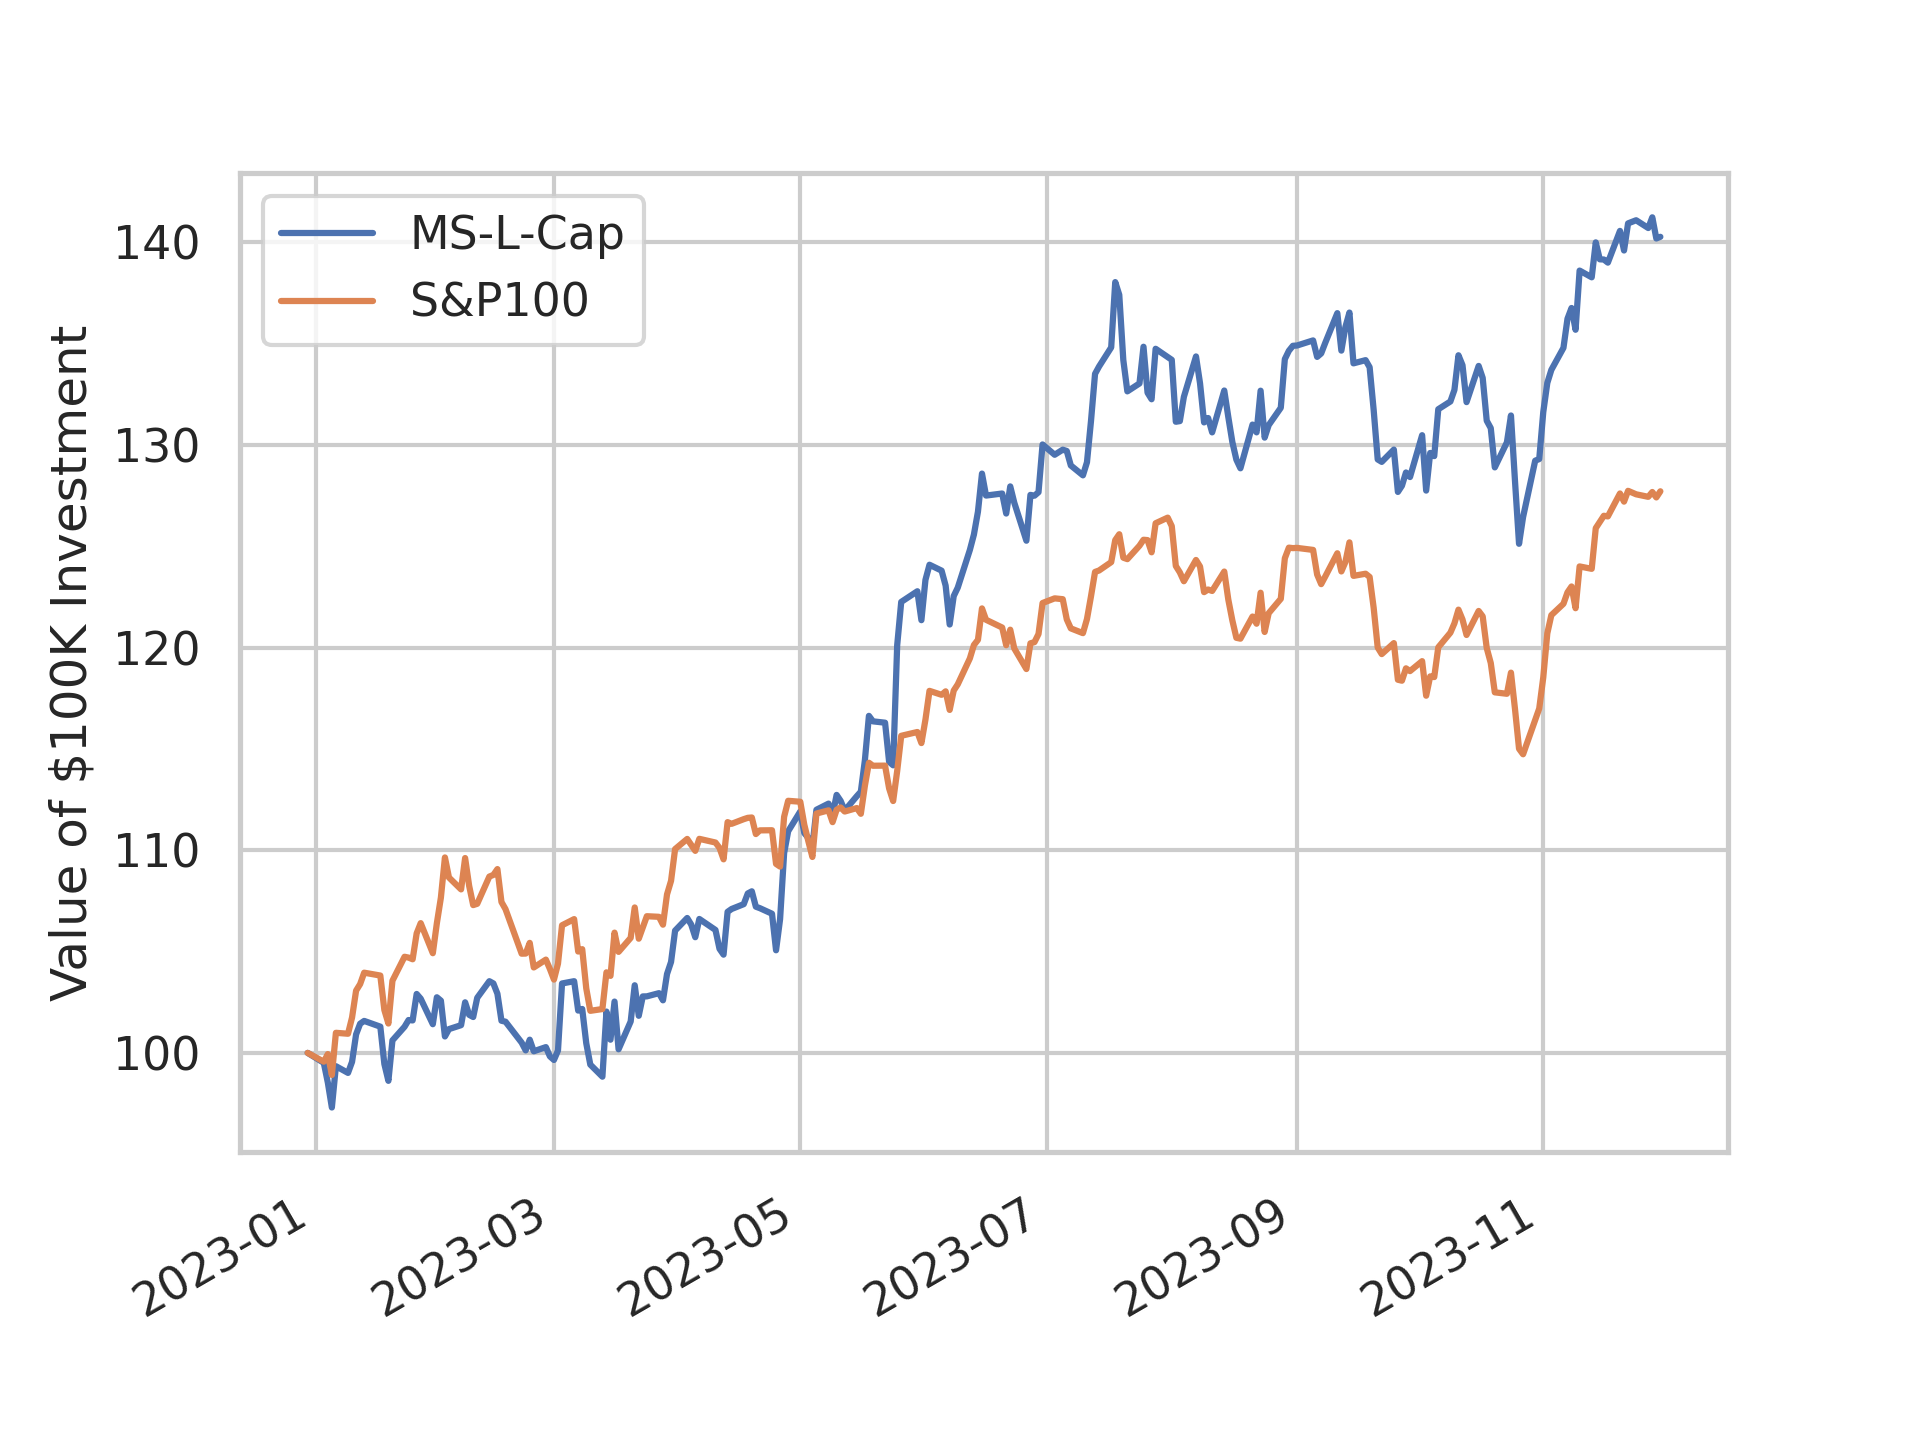
In terms of capitalization-weighted performance, the MS-L-Cap emerges as a top performer in terms of Sharpe and Sortino ratios, as well as total return, reaching an impressive 40.27% total return. This is a significant outperformance of 12.6% to the S&P100 ETF as depicted in Figure 10.
| Strategy | Total Return(%) | Sharpe | Sortino | Vol(%) | Total Trades | Win Rate(%) | Max Ddn(%) | Max Ddn Dur. |
|---|---|---|---|---|---|---|---|---|
| MS | 22.72 (21.34) | 2.02 | 3.13 | 16.74 | 160 | 63.31 | 7.94 | 96 |
| MS-L | 21.20 (20.52) | 1.85 | 2.86 | 17.22 | 159 | 60.87 | 9.00 | 96 |
| S&P100-Eq | 13.57 (13.48) | 1.38 | 2.09 | 15.37 | 622 | 72.61 | 10.66 | 90 |
| Naive | 5.88 (5.20) | 0.66 | 0.94 | 15.45 | 469 | 58.50 | 11.00 | 103 |
| MS-L-Cap | 40.27 (39.56) | 2.53 | 4.19 | 22.09 | 158 | 59.12 | 9.36 | 82 |
| S&P100 | 27.71 (27.65) | 2.39 | 3.79 | 16.73 | 1 | N/A | 9.24 | 77 |
-
a
Note: Values at bold indicate the best scores among the weighted strategies, while underlined values indicate the best scores among the equally weighted strategies. Values in parenthesis represent the total returns after transaction costs (5bps/trade).
| Strategy | Total Return(%) | Sharpe | Sortino | Vol(%) | Total Trades | Win Rate(%) | Max Ddn(%) | Max Ddn Dur. |
|---|---|---|---|---|---|---|---|---|
| MS-Top10-SR | 13.33 (12.63) | 1.08 | 1.57 | 20.29 | 101 | 64.84 | 12.66 | 65 |
| MS-Top5-GPT | 35.99 (35.09) | 2.17 | 3.33 | 23.70 | 47 | 66.67 | 9.24 | 83 |
| MS-Top10-GPT | 30.91 (30.07) | 2.28 | 3.57 | 19.49 | 100 | 67.78 | 10.77 | 58 |
| MS-High-GPT | 37.19 (36.11) | 2.27 | 3.70 | 23.20 | 78 | 57.75 | 10.82 | 95 |
| MS-Low-GPT | 11.91 (10.95) | 1.14 | 1.72 | 16.87 | 107 | 59.14 | 9.05 | 91 |
| Naive-Top10 | 20.47 (19.88) | 1.46 | 2.16 | 21.80 | 98 | 65.91 | 9.79 | 78 |
-
a
Note: Values at bold indicate the best scores among strategies. Values in parenthesis represent the total returns after transaction costs (5bps/trade).
5.2.2 Rank-based strategies
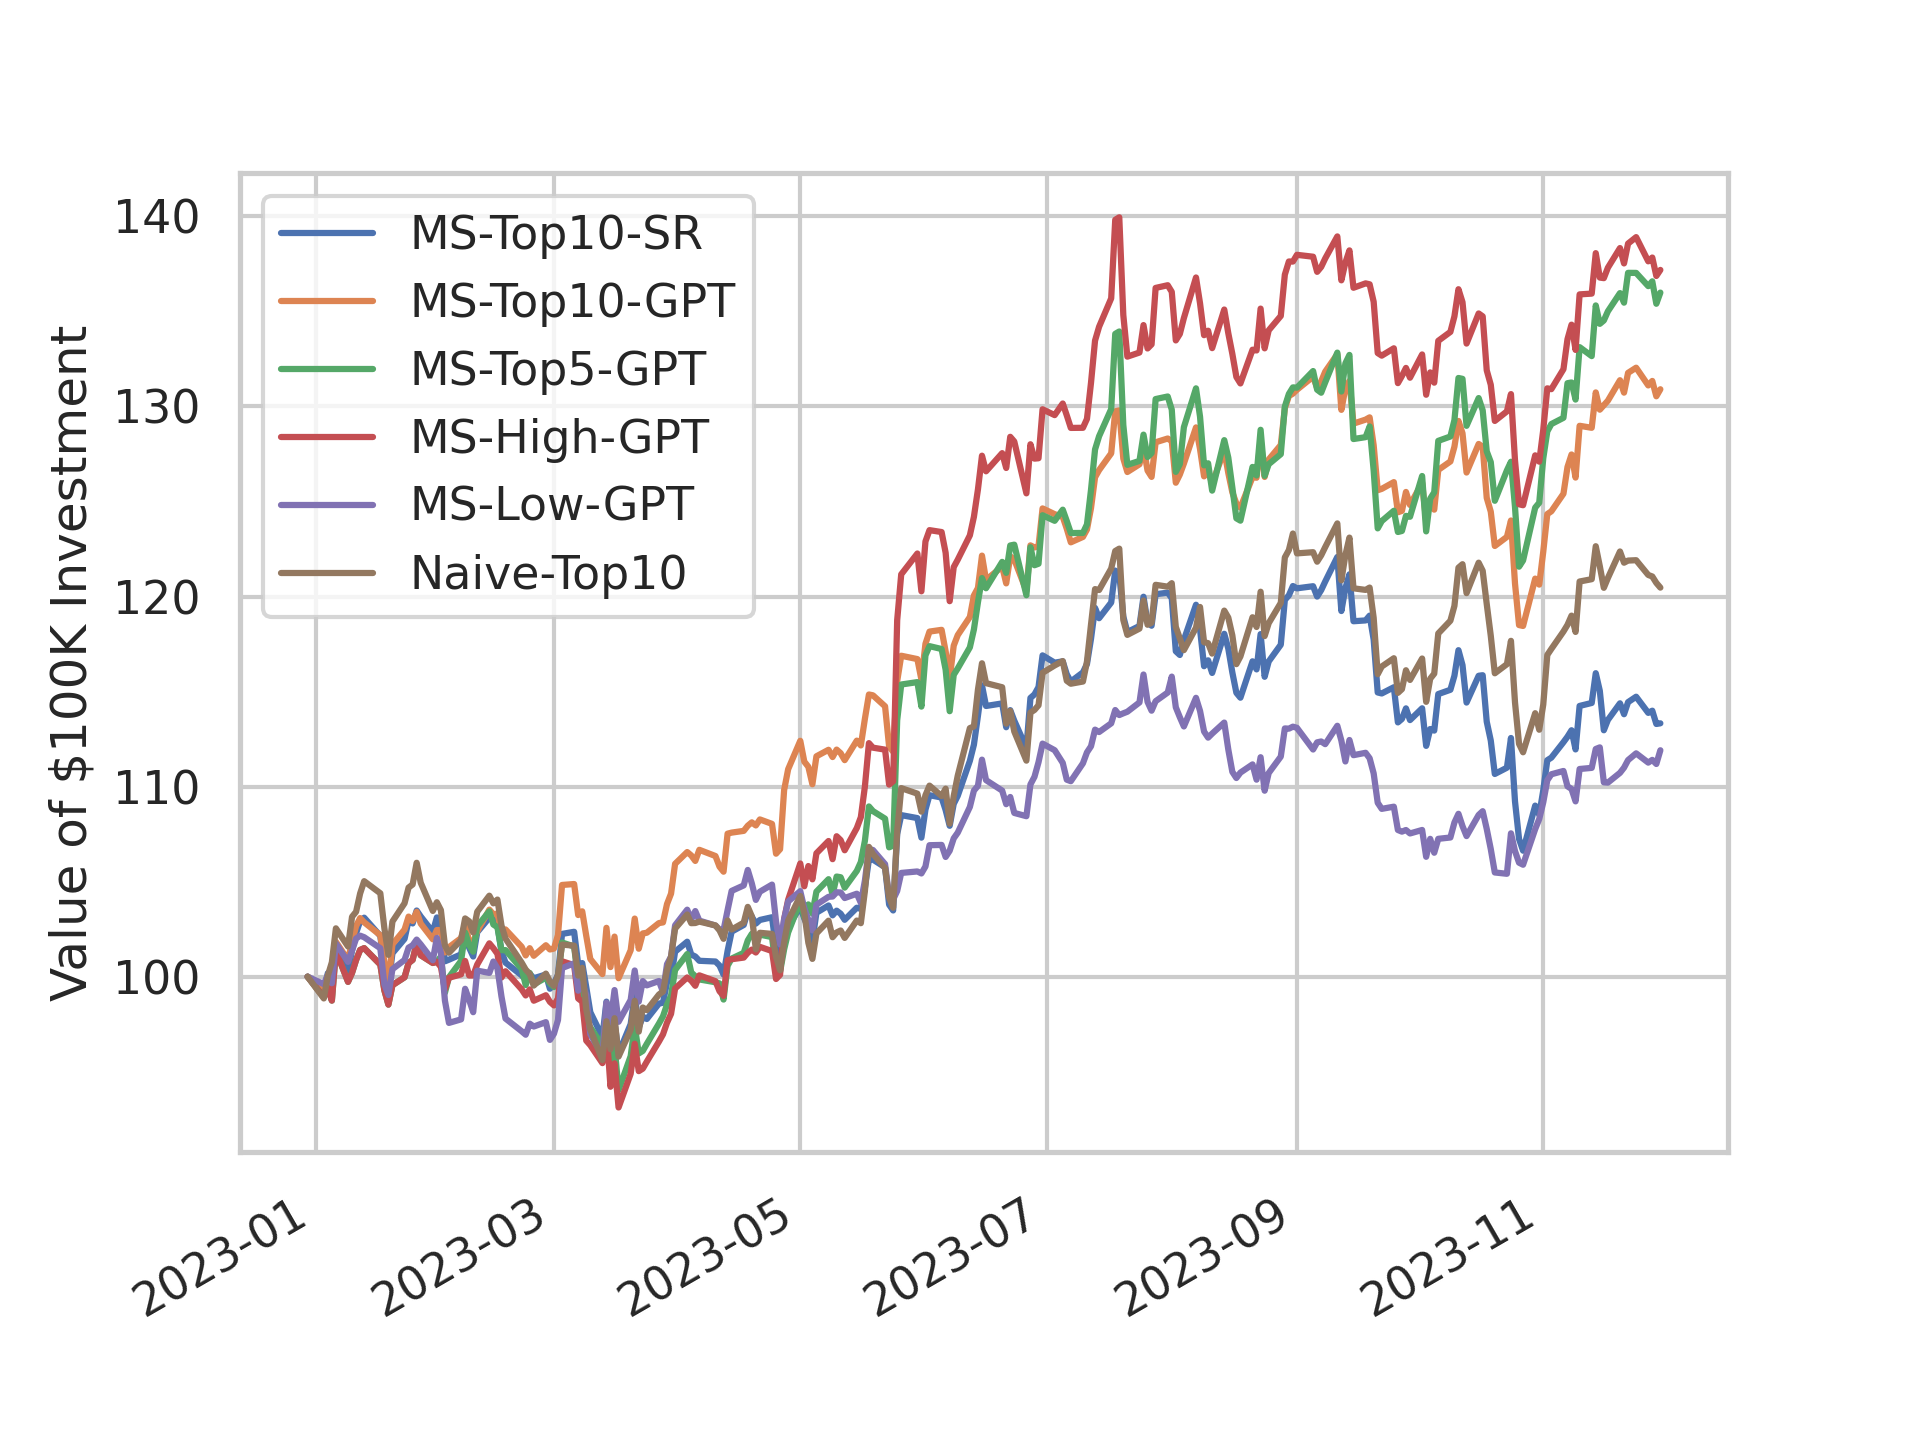
Continuing the exploration of MarketSenseAI’s performance, Table 12 and Figure 11 provide a detailed analysis of rank-based strategies derived from MarketSenseAI’s signals. These results delve into the practical applications of these signals, focusing on portfolios with a manageable number of assets (around 10), and highlight how different strategic implementations can impact investment results.
The strategies incorporating GPT-4 rankings significantly outperform other variants (MS-Top10-SR, Naive-Top10) with very strong total returns and risk adjusted metrics. Another interesting result is the significant outperformance of MS-High-GPT vs MS-Low-GPT strategy that underscores the value of the explanations attached to MarketSenseAI’s signals and a promising alternative to conventional risk/return-based stock ranking methods.
5.2.3 GPT ranking
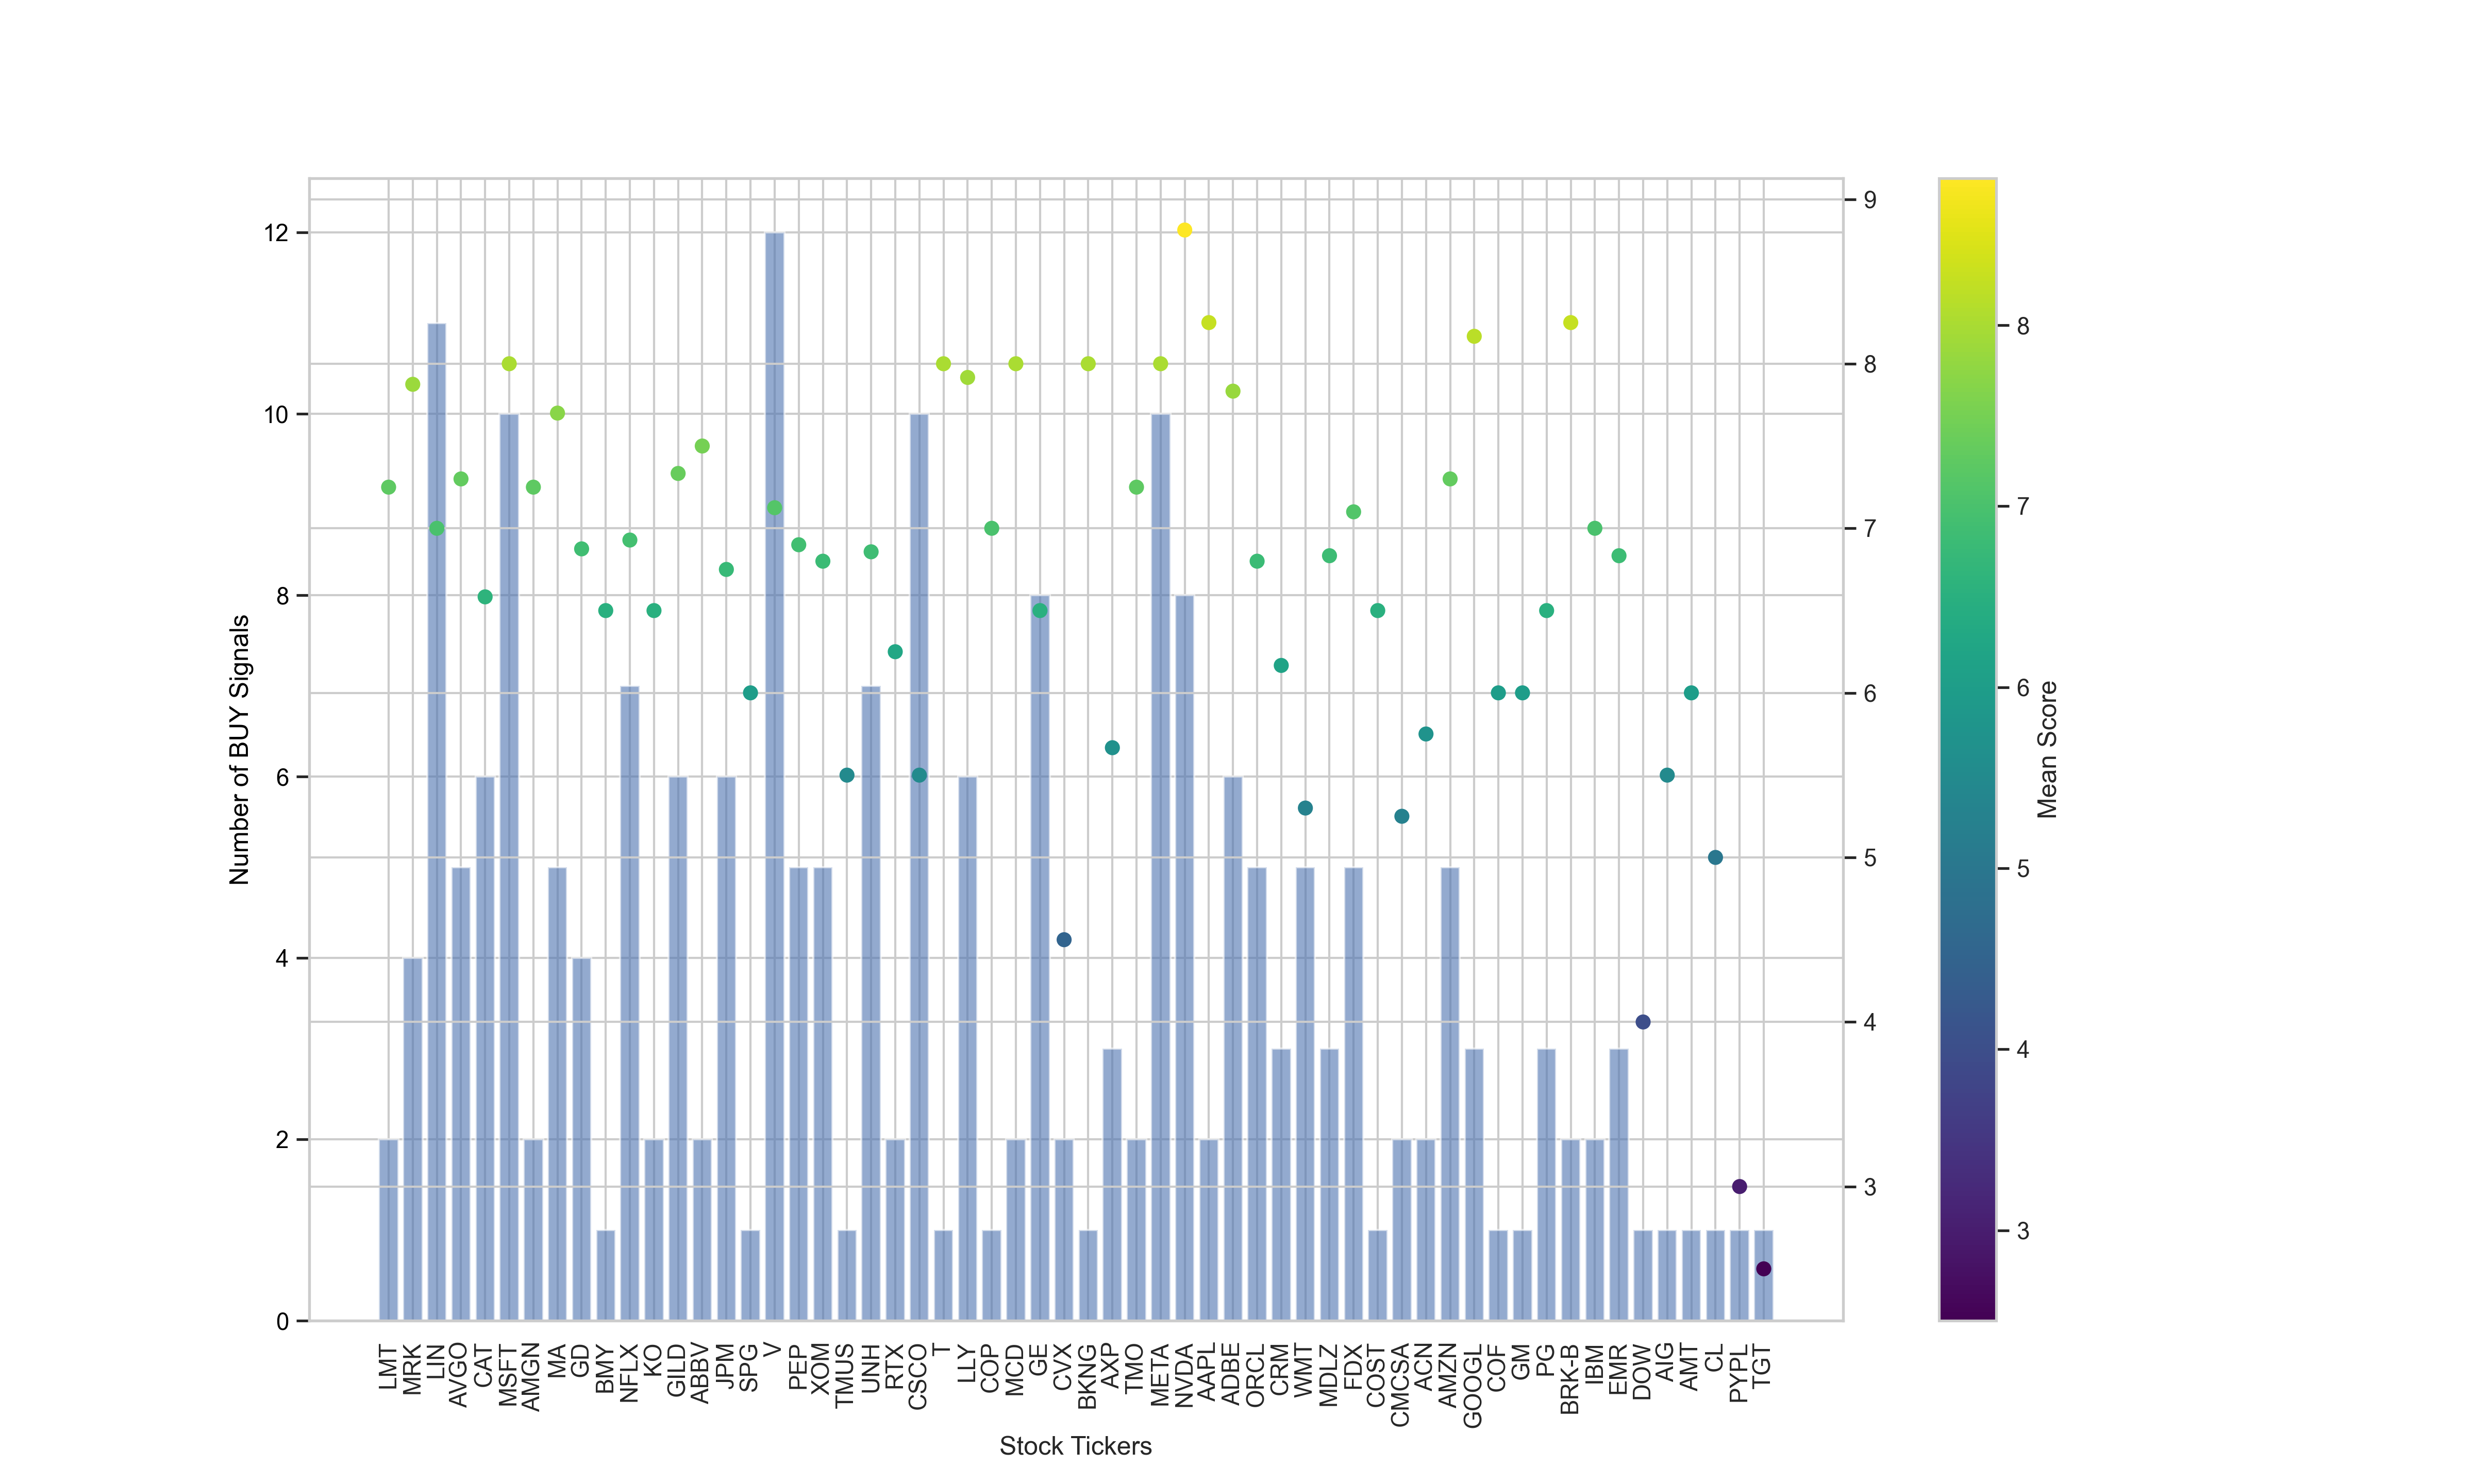
Building upon the insights gained from GPT-4’s rankings of MarketSenseAI signals, Figure 12 provides a visual representation of the quality of explanations accompanying MarketSenseAI’s ”buy” signals throughout the evaluation period. The figure depicts (bar plot) the frequency of ”buy” signals for each stock over the months. It also illustrates (scatter plot) the evaluative scores assigned by GPT-4, based on the depth and relevance of explanations behind each ”buy” recommendation. In this visualization, the scatter plot points are placed according to the average score given to each stock, allowing for an intuitive understanding of how the explanations for each stock were perceived in terms of quality and persuasiveness by the GPT-4 layer.
A key observation from Figure 12 is the higher scoring of technology and AI-related stocks, such as Nvidia, META, and Adobe. This trend is reflective of the market hype surrounding these sectors in 2023. The tendency of these stocks to receive higher scores not only demonstrates the relevance of MarketSenseAI’s ”buy” signals but also underscores the model’s capability to encapsulate and convey the prevailing market sentiment and potential in its explanations.
6 Discussion
MarketSenseAI’s innovative use of GPT-4’s advanced reasoning capabilities represents a significant leap forward in financial analysis. This AI-powered framework provides both retail and professional investors with a comprehensive and unique tool for processing and analyzing extensive data sets, enabling the generation of scalable, actionable investment signals. Its utility is particularly evident in single stock analysis within environments rich in untapped opportunities.
The robust performance of MarketSenseAI within the S&P 100 — a heavily analyzed and traded stock universe — lays a solid foundation for potential outperformance in less scrutinized markets. In such markets, MarketSenseAI’s sophisticated analytical tools could offer even greater advantages, potentially uncovering opportunities that remain obscure to most market participants. This possibility paves the way for broader applications of MarketSenseAI across various financial assets, especially in markets traditionally lacking in-depth analysis.
However, it is vital to consider the limitations posed by the brief duration of the study. An extended evaluation period would offer a more thorough insight into MarketSenseAI’s effectiveness across diverse market conditions. This current limitation underscores the necessity for continued research and prolonged trials to confirm MarketSenseAI’s efficiency and flexibility throughout different market cycles and scenarios.
7 Conclusion
This work introduces MarketSenseAI, an innovative AI-driven framework for stock analysis and selection. Utilizing the advanced reasoning capabilities of GPT-4, MarketSenseAI effectively analyzes a diverse range of data, including company news, fundamentals, market dynamics, and macroeconomic information. In 2023, it demonstrated exceptional decision-making ability in both single stock recommendations and broader portfolio management within the S&P 100, yielding returns of up to 40% and surpassing market performance by 13%.
The findings underscore the significant benefits of integrating AI into financial analysis tools. MarketSenseAI enhances investment strategies with insights that are not only data-driven but also explainable. It offers a scalable and viable solution for retail and professional investors in single stock selection, leveraging them for more effective investment decisions.
Beyond the specific signals generated by MarketSenseAI, its individual components independently provide substantial value. They deliver a clear and concise picture of each factor affecting a stock, combining summarization capabilities with comprehensive data aggregation.
These results contribute to understanding the role of AI in finance, suggesting new possibilities for future advancements in this dynamic and evolving field. MarketSenseAI represents a step forward in the process of investment decision-making and shows potential in supporting the overall health and stability of the financial system.
CRediT authorship contribution statement
Georgios Fatouros: Conceptualization, Methodology, Software, Validation, Formal analysis, Investigation, Data curation, Writing – original draft & Visualization. Konstantinos Metaxas: Conceptualization, Methodology, Software, Validation, Investigation, Data curation, Writing - Review & Editing. John Soldatos: Funding acquisition, Writing – review & editing. Dimosthenis Kyriazis: Resources & Supervision.
Declaration of Competing Interest
The authors declare their involvement in the development and planned commercialization of the presented framework (i.e., MarketSenseAI) as part of a fintech startup.
Funding
This work was supported by European Union’s funded Project HUMAINE [grant number 101120218].
References
- Abramski et al. (2023) Abramski, K., Citraro, S., Lombardi, L., Rossetti, G., Stella, M., 2023. Cognitive network science reveals bias in gpt-3, gpt-3.5 turbo, and gpt-4 mirroring math anxiety in high-school students. Big Data and Cognitive Computing 7, 124.
- Alqahtani et al. (2020) Alqahtani, A., Wither, M.J., Dong, Z., Goodwin, K.R., 2020. Impact of news-based equity market volatility on international stock markets. Journal of Applied Economics 23, 224–234.
- Alshami et al. (2023) Alshami, A., Elsayed, M., Ali, E., Eltoukhy, A.E., Zayed, T., 2023. Harnessing the power of chatgpt for automating systematic review process: Methodology, case study, limitations, and future directions. Systems 11, 351.
- Anand and Pathak (2022) Anand, A., Pathak, J., 2022. The role of reddit in the gamestop short squeeze. Economics Letters 211, 110249.
- Araci (2019) Araci, D., 2019. Finbert: Financial sentiment analysis with pre-trained language models. Preprint at https://arxiv.org/abs/1908.10063.
- Atreides and Kelley (2023) Atreides, K., Kelley, D., 2023. Cognitive biases in natural language: Automatically detecting, differentiating, and measuring bias in text. doi:10.13140/RG.2.2.14044.56967.
- BIS (2022) BIS, 2022. Market dysfunction and central bank tools. https://www.bis.org/publ/mc_insights.pdf.AccessedSeptember28,2023.
- Bloomberg (2019) Bloomberg, 2019. What’s an “algo wheel?” and why should you care? — bloomberg professional services. https://www.bloomberg.com/professional/blog/whats-algo-wheel-care/. Accessed September 24, 2023.
- Bouchaud et al. (2003) Bouchaud, J.P., Gefen, Y., Potters, M., Wyart, M., 2003. Fluctuations and response in financial markets: the subtle nature ofrandom’price changes. Quantitative finance 4, 176.
- Brogaard et al. (2023) Brogaard, J., Han, J., Won, P.Y., 2023. How does zero-day-to-expiry options trading affect the volatility of underlying assets? Available at SSRN: https://ssrn.com/abstract=4426358 or http://dx.doi.org/10.2139/ssrn.4426358.
- Callanan et al. (2023) Callanan, E., Mbakwe, A., Papadimitriou, A., Pei, Y., Sibue, M., Zhu, X., Ma, Z., Liu, X., Shah, S., 2023. Can gpt models be financial analysts? an evaluation of chatgpt and gpt-4 on mock cfa exams. Preprint at https://arxiv.org/abs/2310.08678.
- Chase (2022) Chase, H., 2022. Langchain. https://github.com/langchain-ai/langchain. Accessed December 29, 2023.
- Chui et al. (2023) Chui, M., Hazan, E., Roberts, R., Singla, A., Smaje, K., Sukharevsky, A., Yee, L., Zemmel, R., 2023. The Economic Potential of Generative AI: The Next Productivity Frontier. Technical Report. McKinsey & Company. https://www.mckinsey.com/capabilities/mckinsey-digital/our-insights/the-economic-potential-of-generative-ai-the-next-productivity-frontier. Accessed September 24, 2023.
- CNBC (2023) CNBC, 2023. Jpmorgan ai investment advisor. https://www.cnbc.com/2023/05/25/jpmorgan-develops-ai-investment-advisor.html. Accessed September 24, 2023.
- Dong et al. (2022) Dong, Q., Li, L., Dai, D., Zheng, C., Wu, Z., Chang, B., Sun, X., Xu, J., Sui, Z., 2022. A survey for in-context learning. Preprint at https://arxiv.org/abs/2301.00234.
- Efron and Tibshirani (1986) Efron, B., Tibshirani, R., 1986. Bootstrap methods for standard errors, confidence intervals, and other measures of statistical accuracy. Statistical science 1, 54–75.
- Fatouros et al. (2023a) Fatouros, G., Makridis, G., Kotios, D., Soldatos, J., Filippakis, M., Kyriazis, D., 2023a. Deepvar: a framework for portfolio risk assessment leveraging probabilistic deep neural networks. Digital finance 5, 29–56.
- Fatouros et al. (2023b) Fatouros, G., Soldatos, J., Kouroumali, K., Makridis, G., Kyriazis, D., 2023b. Transforming sentiment analysis in the financial domain with chatgpt. Machine Learning with Applications 14, 100508.
- Fontinelle (2022) Fontinelle, A., 2022. Can anybody beat the market? https://www.investopedia.com/ask/answers/12/beating-the-market.asp, Accessed January 01, 2024.
- Goyal and He (2015) Goyal, A., He, Z., 2015. Passive investing and market liquidity. The Review of Financial Studies 28, 2167–2203.
- Greenwald et al. (2020) Greenwald, B.C., Kahn, J., Bellissimo, E., Cooper, M.A., Santos, T., 2020. Value investing: from Graham to Buffett and beyond. John Wiley & Sons.
- Guo et al. (2023) Guo, B., Zhang, X., Wang, Z., Jiang, M., Nie, J., Ding, Y., Yue, J., Wu, Y., 2023. How close is chatgpt to human experts? comparison corpus, evaluation, and detection. Preprint at https://arxiv.org/abs/2301.07597.
- Kidwell et al. (2016) Kidwell, D.S., Blackwell, D.W., Whidbee, D.A., 2016. Financial institutions, markets, and money. John Wiley & Sons.
- Kim et al. (2023) Kim, A.G., Muhn, M., Nikolaev, V.V., 2023. Bloated disclosures: Can chatgpt help investors process information? Available at SSRN: https://ssrn.com/abstract=4425527 or http://dx.doi.org/10.2139/ssrn.4425527.
- Korn et al. (2022) Korn, O., Möller, P.M., Schwehm, C., 2022. Drawdown measures: Are they all the same? The Journal of Portfolio Management 48, 104–120.
- Kotios et al. (2022) Kotios, D., Makridis, G., Fatouros, G., Kyriazis, D., 2022. Deep learning enhancing banking services: a hybrid transaction classification and cash flow prediction approach. Journal of big Data 9, 100.
- Lewellen (2002) Lewellen, J., 2002. Momentum and autocorrelation in stock returns. The Review of Financial Studies 15, 533–564.
- Li et al. (2023) Li, X., Zhu, X., Ma, Z., Liu, X., Shah, S., 2023. Are chatgpt and gpt-4 general-purpose solvers for financial text analytics? an examination on several typical tasks. Preprint at https://arxiv.org/abs/2305.05862.
- Liu et al. (2023) Liu, Y., Iter, D., Xu, Y., Wang, S., Xu, R., Zhu, C., 2023. Gpteval: Nlg evaluation using gpt-4 with better human alignment. Preprint at https://arxiv.org/abs/2303.16634.
- Lopez-Lira and Tang (2023) Lopez-Lira, A., Tang, Y., 2023. Can chatgpt forecast stock price movements? return predictability and large language models. Preprint at https://arxiv.org/abs/2304.07619.
- Malik (2011) Malik, F., 2011. Estimating the impact of good news on stock market volatility. Applied Financial Economics 21, 545–554.
- Malkiel (2003) Malkiel, B.G., 2003. The efficient market hypothesis and its critics. Journal of economic perspectives 17, 59–82.
- Metaxas (2023) Metaxas, K., 2023. Marketdigest. https://www.km3am.com/2023/03/13/marketdigest-new-ai-powered-tool-for-wealth-management-insights/. Accessed September 24, 2023.
- Noy and Zhang (2023) Noy, S., Zhang, W., 2023. Experimental evidence on the productivity effects of generative artificial intelligence. Science 381, 187–192. URL: https://www.science.org/doi/abs/10.1126/science.adh2586, doi:10.1126/science.adh2586.
- OECD (2021) OECD, 2021. Artificial intelligence, machine learning and big data in finance: Opportunities, challenges, and implications for policy makers. https://www.oecd.org/finance/financial-markets/Artificial-intelligence-machine-learning-big-data-in-finance.pdf. Accessed September 24, 2023.
- OpenAI (2023) OpenAI, 2023. Gpt-4 technical report. arXiv:2303.08774. preprint at https://arxiv.org/abs/2303.08774.
- Shu et al. (2023) Shu, L., Wichers, N., Luo, L., Zhu, Y., Liu, Y., Chen, J., Meng, L., 2023. Fusion-eval: Integrating evaluators with llms. Preprint at https://arxiv.org/abs/2311.09204.
- Song et al. (2020) Song, K., Tan, X., Qin, T., Lu, J., Liu, T.Y., 2020. Mpnet: Masked and permuted pre-training for language understanding. Advances in Neural Information Processing Systems 33, 16857–16867.
- Tetlock et al. (2008) Tetlock, P.C., Saar-Tsechansky, M., Macskassy, S., 2008. More than words: Quantifying language to measure firms’ fundamentals. The journal of finance 63, 1437–1467.
- Thompson (2023) Thompson, C., 2023. Magnificent 7 stocks: What you need to know. https://www.investopedia.com/magnificent-seven-stocks-8402262, Accessed January 01, 2024.
- Wei et al. (2022) Wei, J., Wang, X., Schuurmans, D., Bosma, M., Xia, F., Chi, E., Le, Q.V., Zhou, D., et al., 2022. Chain-of-thought prompting elicits reasoning in large language models. Advances in Neural Information Processing Systems 35, 24824–24837.
- Weiss-Cohen et al. (2019) Weiss-Cohen, L., Ayton, P., Clacher, I., Thoma, V., 2019. Behavioral biases in pension fund trustees’ decision making. Review of Behavioral Finance 11, 128–143.
- Wu et al. (2023) Wu, S., Irsoy, O., Lu, S., Dabravolski, V., Dredze, M., Gehrmann, S., Kambadur, P., Rosenberg, D., Mann, G., 2023. Bloomberggpt: A large language model for finance. Preprint at https://arxiv.org/abs/2303.17564.
- Yu et al. (2023) Yu, X., Chen, Z., Ling, Y., Dong, S., Liu, Z., Lu, Y., 2023. Temporal data meets llm–explainable financial time series forecasting. Preprint at https://arxiv.org/abs/2306.11025.
- Zaremba and Demir (2023) Zaremba, A., Demir, E., 2023. Chatgpt: Unlocking the future of nlp in finance. Available at SSRN: https://ssrn.com/abstract=4323643 or http://dx.doi.org/10.2139/ssrn.4323643.