The outflow of the protostar in B335: I
Abstract
The isolated globule B335 contains a single, low luminosity Class 0 protostar associated with a bipolar nebula and outflow system seen nearly perpendicular to its axis. We observed the innermost regions of this outflow as part of JWST/NIRCam GTO program 1187, primarily intended for wide-field slitless spectroscopy of background stars behind the globule. We find a system of expanding shock fronts with kinematic ages of only a few decades emerging symmetrically from the position of the embedded protostar, which is not directly detected at NIRCam wavelengths. The innermost and youngest of the shock fronts studied here shows strong emission from CO. The next older shock front shows less CO and the third shock front shows only H2 emission in our data. This third and most distant of these inner shock fronts shows substantial evolution of its shape since it was last observed with high spatial resolution in 1996 with Keck/NIRC. This may be evidence of a faster internal shock catching up with a slower one and of the two shocks merging.
1 Introduction
Stars form out of dense cores of molecular gas by accretion of material. In almost all circumstances, the gas accreted in this process has much larger angular momentum than the newly formed star will have. As a way of shedding the excess angular momentum, mass accretion onto a protostar or young star is associated with outflow activity. For the youngest stars in their main accretion phase, the outflow is in the form of a collimated jet with internal shock fronts radiating primarily in the emission lines of H2. This fast jet interacts turbulently with the ambient molecular material and entrains it into a broader, slower molecular outflow that is best studied by radio emission of CO. In later phases of mass accretion onto almost completely formed young stellar objects (YSO), well collimated, very high velocity jets radiating in atomic emission lines are commonly found. Outflow and jet phenomena in young stars were recently reviewed by Bally (2016) and we refer to the references therein for an outline of the history of this field.
The isolated globule Barnard 335 in Aquila (Barnard et al., 1927) was observed as part of JWST program 1187, primarily to map the broadband extinction and to measure ice absorption column densities with NIRCam Wide Field Slitless Spectroscopy (WFSS). Details of our sample selection and preliminary ground-based results on the onset of ice formation in those cores was presented by Chu & Hodapp (2021). B335 is the only molecular core in our sample of three cores for program 1187 that has an embedded protostar, discovered by Keene et al. (1983).
The distance to B335 was first measured by Tomita et al. (1979) at 250 pc and this was long used as the canonical distance. Using similar purely photometric methods, Olofsson & Olofsson (2009) measured a distance in the range of 90 - 120 pc. They had already mentioned a possible association of the B335 cloud with the star HD 184982 on the basis that this star appears to be illuminating the cloud in addition to the general interstellar radiation field. Watson (2020) obtained new images of this reflection nebulosity and used the Gaia DR2 distance to HD 184982 of 164.5 pc as a proxy for the distance of the B335 molecular core. For this paper, we adopt this distance value of 164.5 pc.
The larger molecular cloud surrounding the Bok globule B335 was found by Frerking & Langer (1982). The molecular outflow associated with the embedded protostar was discovered and mapped by Hirano et al. (1988) who also determined that the outflow axis is inclined only 10 from the plane of the sky, i.e., the bipolar outflow is seen nearly perpendicular to its axis. The molecular core B335 is the densest part of a larger cometary globule, suggesting that an external wind shaped the globule and triggered the star formation in it, as was discussed in the case of the globules associated with the Gum nebula by Reipurth (1983). The pattern of background star polarization, first mapped by Hodapp (1987) is also consistent with the globule having been formed by an external wind.
The bipolar outflow emerging from the single protostar in B335 was studied by Stutz et al. (2008) based on Spitzer Space Telescope imaging data. Out to a wavelength of 8 m the object appears as a bipolar nebula. Only at wavelengths of 24 m and longer does the object appear as an unresolved point source, probably direct light from the central embedded protostar. The ALMA-based studies of B335 by Evans et al. (2015) and Evans et al. (2023) found clear evidence for infall from the redshifted absorption seen in HCN and HCO+, estimated the age of the accreting protostar at 5.0 104 yrs, and found evidence for variability and episodic accretion. Based on ALMA data Bjerkeli et al. (2019) found evidence for the recent (around 2015) ejection of a molecular bullet and Bjerkeli et al. (2023) presented evidence for infall faster than free-fall velocity, interpreted as evidence for variable infall and accretion. WISE W2 (4.6 m) scattered light from the embedded protostar showed an outburst between 2015 and 2022 (Kim et al., 2023), again supporting variable accretion.
Optical Herbig-Haro shock fronts emerging from the B335 globule were found first by Vrba et al. (1986) and then confirmed and added to by Reipurth et al. (1992) who labelled them as HH 119 A-C. In the infrared, the first major imaging study was done by Hodapp (1998) who labelled shock fronts found in the H S emission line, but not confirmed by optical spectroscopy as HH 119 IR1-5. This naming scheme was expanded to include newly identified shocks by Gâlfalk & Olofsson (2007). The strong extinction by the nearly edge-on disk and the dense inner envelope around the protostar in B335 has prevented any studies of infrared shock fronts in the immediate vicinity of the protostar prior to JWST.
Our JWST observing program 1187 on B335 was cut short by a guide star acquisition failure on the second of two different telescope pointings. The data presented here are about half of the originally intended data set, which explains the incomplete spatial coverage.
In this paper, we present our imaging and wide-field slitless spectroscopy (WFSS) data in section 2. We discuss the outflow cavity in section 3.1, the position and proper motion of the protostar in section 3.2, the shock proper motions in 3.3, and the emission spectrum of some of the shocks in section 3.4.
2 Observations and Results
The results reported here are based on guaranteed time observations (GTO) with the James Webb Space Telescope (JWST) (Gardner et al., 2023). The imaging observations were obtained as part of the JWST Near-Infrared Camera (NIRCam) (Rieke et al., 2023) Wide Field Slitless Spectroscopy (WFSS) of background stars behind B335 aimed at mapping the column density of H2O, CO2, and CO ice (program 1187). The use of the NIRCam grisms for slitless spectroscopy was described by Greene et al. (2017). The observations were carried out on 2023 April 21 UTC (MJD 60059). WFSS data were obtained through the four medium width filters F410M, F430M, F460M, and F480M, whose bandpasses cover the CO2 and CO ice features The DOI 10.17909/p188-aj80 (catalog 10.17909/p188-aj80) contains all the spectra extracted by the stage 3 pipeline, which were not used in this study. However, the WFSS data were used in stage 2 calibration form and the filenames used are listed in Table 1. They can be filtered from the dataset pointed to by the DOI. Direct images in the F277W, F300M, F356W, and F444W filters were obtained as part of the source registration and wavelength calibration procedure for the slitless spectroscopy and these data is available at MAST: 10.17909/qa3f-5703 (catalog 10.17909/qa3f-5703).
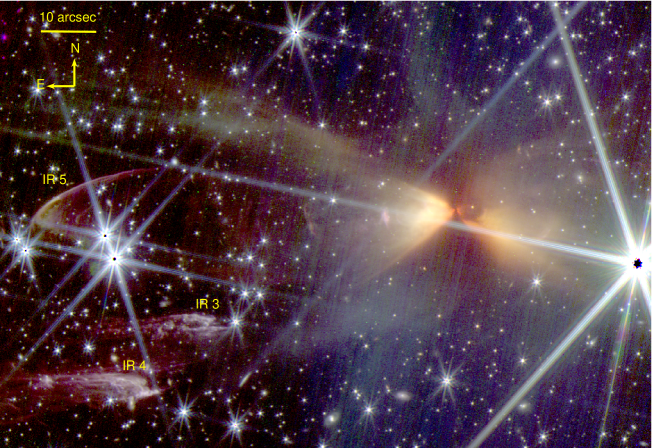
Due to the strong extinction near the B335 protostar, only the long-wavelength module data at wavelengths longer than 2.5 m proved useful for this paper, and are summarized in Table 1. The imaging data were processed by STScI using the JWST Science Calibration Pipeline (10.5281/zenodo.8067394 (catalog 10.5281/zenodo.8067394)) version 1.9.6 and calibration file with astrometric calibration based on the Gaia DR3 catalog. Figure 1 shows an overview color image of B335, composed of the images in the F277W (blue channel), F356W (green channel), and F444W (red channel), in logarithmic scaling to emphasize low flux regions.
| Filter | grism | Total Integration | NGROUPS | NINTS | Date [MJD] | MAST File Name |
|---|---|---|---|---|---|---|
| F277W | clear | 773 | 4 | 2 | 60055 | jw01187-o011_t001_nircam_clear-f277w_i2d.fits |
| F356W | clear | 344 | 4 | 2 | 60059 | jw01187-o014_t001_nircam_clear-f356w_i2d.fits |
| F444W | clear | 1374 | 4 | 2 | 60059 | jw01187-o015_t001_nircam_clear-f444w_i2d.fits |
| F410M | GRISMC | 172 | 8 | 1 | 60059 | jw01187015002_2101_0001_nrcalong_rate.fits |
| F410M | GRISMC | 172 | 8 | 1 | 60059 | jw01187015002_210c_0001_nrcalong_rate.fits |
| F430M | GRISMC | 172 | 8 | 1 | 60059 | jw01187015002_2103_0001_nrcalong_rate.fits |
| F430M | GRISMC | 172 | 8 | 1 | 60059 | jw01187015002_210e_0001_nrcalong_rate.fits |
| F460M | GRISMC | 172 | 8 | 1 | 60059 | jw01187015002_2105_0001_nrcalong_rate.fits |
| F460M | GRISMC | 172 | 8 | 1 | 60059 | jw01187015002_210g_0001_nrcalong_rate.fits |
| F480M | GRISMC | 172 | 8 | 1 | 60059 | jw01187015002_2107_0001_nrcalong_rate.fits |
| F480M | GRISMC | 172 | 8 | 1 | 60059 | jw01187015002_210i_0001_nrcalong_rate.fits |
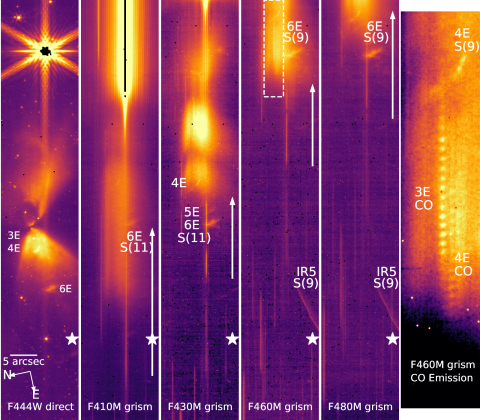
For the WFSS observations, a grism, in our case the GRISMC in the NIRCam pupil wheel, disperses the light from every object in the field into a spectrum. Individual medium band filters were used to record sections of this spectrum. When using medium bandpass filters, the spectrum section in each of the WFSS images only 200 - 300 pixels long, so that the problem of spectra of different objects overlapping is mitigated. As it turned out, without this sub-division of the spectral range, the CO emission from the bright compact shock front would have been masked by flux from the reflection nebula and bright stars. Figure 2 shows cutouts of the inner regions of the B335 bipolar nebula in the orientation of the NIRCam detectors, where the dispersion of the GRISMC is along the column axis. The left panel is the direct F444W image for orientation. The other panels show the same range of columns and a wavelength dependent shift in the vertical (dispersion) direction.
The WFSS spectra of the extended shock fronts were extracted with custom python routines from the the flux calibrated “rate” files produced by the STScI pipeline. The wavelength calibration was done using the H2 emission lines in the object spectra themselves. Slitless spectroscopy data in general intermix spatial and spectral information and the spectral resolution depends on the spatial extent of the object. Since the shock fronts studied here are extended and of complex morphology, our data are suitable for detecting the presence of emission lines, but not for studies of the radial velocity or its line structure. In extracted spectra, the lines for one object are recorded at the proper wavelengths, but other objects, spatially offset, will also contribute to the spectra and their lines are recorded at correspondingly offset wavelengths.
We had two visits scheduled for WFSS observations through the four medium width filters. Visit 15:1, covering the western part of the globule, was not successful due to guide star acquisition problems, and a repeat request was approved. This will give more imaging and spectroscopy in the western part of the globule, and hopefully allow better proper motion studies. The repeat observations, now labelled visit 65:1, are expected to be scheduled in April or May of 2024, and will be published separately.
3 Discussion
3.1 The outflow cavity
The central region of the B335 outflow appears as a bipolar nebula in our images. Other studies have shown that we see this outflow nearly edge-on and that the extinction towards the protostar must be extremely high. Chandler et al. (1990) have measured an AV 320 mag. and Keene et al. (1983) have shown that the protostar is only detectable at far infrared and radio wavelengths. Stutz et al. (2008) demonstrated that the embedded protostar only becomes directly visible at 24m in Spitzer Space Telescope images.
Indeed, even our longest wavelength image, in the JWST F444W filter, does not show the protostar itself. Recently, Evans et al. (2023) and Kim et al. (2023) pointed out that the WISE/NEOWISE mission (Wright et al., 2010), recorded a pronouced outburst of B335 in the W2 (4.6m). The outburst lasted about 12 years and is just now ending in 2023, with some uncertainty since there is only one data point to define the quiescent baseline. Using a sophisticated radiative transfer model of the B335 protostar, Evans et al. (2023) have interpreted the W2 flux maximum as evidence for a temporary increase in the protostar luminosity up to 22 L⊙. This near infrared variability coincides with an increase in radio line flux observed in 2018 with ALMA by Evans et al. (2023) and is therefore indicative of an increase in accretion activity on the B335 protostar.
Due to the r = 5″photometry aperture and the poor spatial resolution of the WISE telescope, these measurements covered essentially all the scattered light from the bright parts of the B335 outflow cavities. At the time of our observations, the B335 protostar had a luminosity of 16 L⊙ (Kim et al., 2023), a factor of 4 above the 2010 quiescent value.
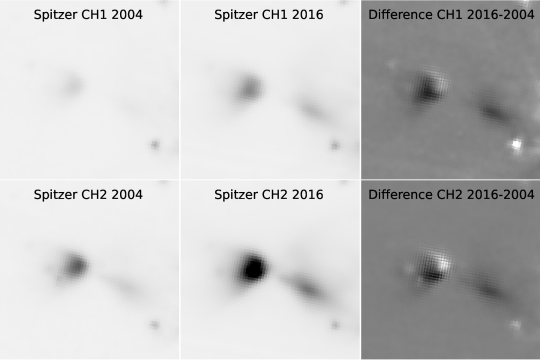
Archival Infrared Array Camera (IRAC) (Fazio et al., 2004) images (10.26131/IRSA413 (catalog 10.26131/IRSA413)) from 2004 and images taken with the same instrument by Chu & Hodapp (2021) in 2016 during the outburst are shown in Fig. 3. In both IRAC channels 1 (3.55 m) and 2 (4.49 m), the bipolar nebula was substantially brighter in 2016 than in 2004, confirming the brightness outburst. The Spitzer photometry shown by (Kim et al., 2023) based on the 2004 data shows the object above the quiescent brightness, but this data point was taken with an aperture of 12″, so is not directly comparable to the WISE data points. For our discussion, the only important point is that the difference images in Fig. 3 do not show the full amplitude of the outburst of the protostar.
With the better spatial resolution of , the difference images (2016-2004) show that the change in brightness was not entirely uniform across the eastern lobe of the bipolar reflection nebula, but that changes in the local illumination conditions contributed to the brightness changes. Such spatial variations are common in bipolar reflection nebulae, e.g., in Hubble’s Variable Nebula NGC 2261 (Hubble, 1916), and also observed in several younger and more deeply embedded bipolar such as Cep A by Hodapp & Bressert (2009) and L483 by Connelley et al. (2009). However, in B335, the latest outburst was dominated by an overall increase in the protostar luminosity, and extinction and variations along the scattering light path are a minor contribution. Our JWST imaging data were taken close to the end of this outburst, but with the luminosity still about 50% above the quiescent value of 4 L⊙.
The eastern outflow cavity is outlined in the wide-field view of B335 in the RGB composite in Fig. 1. The two lobes of the bipolar nebula are of different surface brightness, with the eastern lobe being brighter, indicating that this eastern lobe suffers less extinction and is on the front side of the equatorial disk around the protostar. This essentially confirms the finding by Hirano et al. (1988) that the eastern outflow is slightly inclined towards the observer. The outflow cavity walls, seen in CO velocity-integrated line emission (Kim et al., 2023) or even better in the CS line (Evans et al., 2023) closely resemble the outflow cavity in our images (Fig. 1), including the fact that the eastern outflow lobe appears narrower than the western lobe.
Beyond the outflow cavity that is illuminated by the embedded protostar, the B335 molecular core exhibits coreshine (Steinacker et al., 2010), i.e. its edges are outlined at infrared wavelength by the scattered interstellar radiation field. The central area of the core appears darker than the edges in Fig. 1 and the dark area is extended roughly in north-south direction, consistent with a large thick disk seen edge-on. This same phenomenon has been described as a “shadow” minimum in the extended flux at 3.6 m and 8.0 m approximately 10″ to the south of the protostar by Stutz et al. (2008) based on images. The extended flux minimum is clearly associated with the nearly complete absence of background stars seen in this area of the cloud. This qualitatively confirms the interpretation by Stutz et al. (2008) that this depression in the extended emission is due to the flattened structure of the B335 molecular core. A detailed mapping of the extinction in B335 was the original purpose of our JWST observing program and will be published separately from this paper on the outflow.
3.2 Position of the embedded protostar
The protostar in B335 has been observed at radio frequencies numerous times, at different wavelengths and with basically every suitable telescope system available. Since there is only one protostellar source in B335, the centroid of the continuum flux distribution measures the position of the protostellar object irrespective of wavelength. For the purpose of determining the proper motion of the protostar, only interferometric measurements have sufficient spatial resolution and precision of the position. In the lower panel of Fig. 4, we have indicated the position at 3.6 cm wavelength reported by Reipurth et al. (2002) and measured in 2001. More recently, the best position measurements are from ALMA at 1.2 or 1.3 mm, and we have included the measurements from Maury et al. (2018) with epoch 2015, Imai et al. (2019) with epoch 2017 and that of Okoda et al. (2022) with epoch 2019 in Fig. 4. For clarity, it should be mentioned that these radio positions are measured against the celestial reference coordinate system, and not relative to the B335 molecular cloud. The protostar has always been located at the center of the bipolar nebula and plotting those older radio positions on a contemporary image does not suggest otherwise. Rather, the whole bipolar nebula, and likely, the whole B335 globule, has the same proper motion as the protostar radio source.
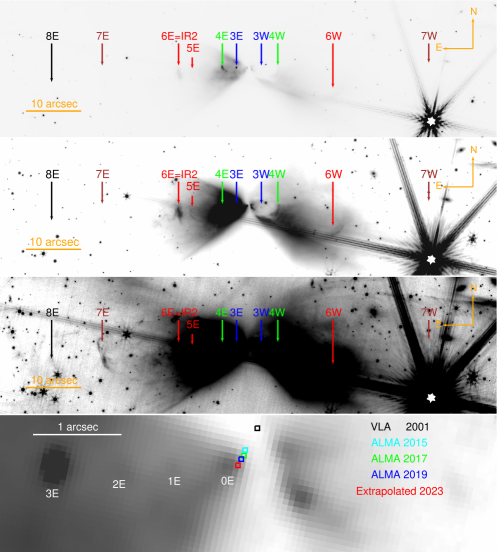
The proper motion of the B335 protostar is 19 mas yr-1 with an estimated uncertainty of 1 mas yr-1 based on the positions by Reipurth et al. (2002) and Okoda et al. (2022). Extrapolating from the Reipurth et al. (2002) and Okoda et al. (2022) measurements, we get the extrapolated position of the protostar at the epoch of the JWST imaging observations as 19 37 0.9025 +7 34 09.42 (J2000.0) with an uncertainty of 20 mas and have indicated this by the red box in Fig. 4. This position places the protostar not in the center of the high-extinction region separating the two outflow lobes, but close to its eastern edge, consistent with the eastern lobe being oriented slightly towards the observer, as was already noted by Hirano et al. (1988) and discussed in the subsection above. The protostar is located close to what appears to be the first emission knot in the string of shock fronts, and that we therefore label HH119 JWST 0E. At present, we do not have spectroscopic data to prove that this is indeed a shock front, rather than scattered continuum light.
3.3 Shock proper motion
Numerous outflow shock fronts are found within the outflow cavity by Vrba et al. (1986), Reipurth et al. (1992), Hodapp (1998), and Gâlfalk & Olofsson (2007). The newly discovered shock fronts described here are named HH 119 JWST with a numbering scheme acknowledging the symmetric nature of these shocks: for example, the closest of the newly discovered shock fronts east of the protostar is HH 119 JWST 0E, labelled 0E in Fig. 4. In this paper, in particular for labels in figures, we will abbreviate the shock front names to just the last two characters, e.g., 0E. Of these shock fronts, only HH 119 JWST 6E has previously been labelled as IR2. Figure 1 shows three large shock fronts in the eastern half of the bipolar outflow and outside of the more detailed view in Fig. 4: IR3, 4 and 5 in the nomenclature of Hodapp (1998).
The proper motion measurements of Gâlfalk & Olofsson (2007) showed that shock front IR2, the only one of the inner shock fronts that was found by ground-based observations (Hodapp, 1998), and D = IR5, the large thin bow shock front, have large proper motions around 200 mas yr-1. Both are located on the central axis of the outflow cavity, defined by a string of smaller shock fronts closer to the protostar, shown in Fig. 4. We will refer to these shocks as axial shocks.
In contrast, IR3 and IR4a are located farther away from that central axis and have an order of magnitude smaller proper motions of around 20 mas yr-1. We will refer to these and similar shocks as peripheral shocks. This distinction is also seen in the morphology of these shocks: The axial shock IR5, in particular, is clearly a large shock front of the outflow from the protostar into ambient gas, with the bow of the shock front pointing away from the protostar. In contrast, the bows of the peripheral shock fronts IR3 and IR4a appear to point towards the protostar, indicating a shock of the outflow on a stationary denser clump of material, with a wake of outflow gas flowing around the obstacle. This morphology and their location away from the outflow axis suggest that IR3 and IR4a may be shocks formed by the interaction of the outflow with the cavity walls.
To generalize this finding: High proper motion shock fronts are found mostly along a fairly narrow jet near the center of the outflow cavity, while low proper motion shock fronts are less concentrated and may be formed by interaction of the outflow with the cavity walls.
To illustrate the proper motion of shock fronts, we compare the JWST results with the -band image of B335 obtained by Hodapp (1998) on 1996 Oct. 1 (MJD = 50357 ) with the Keck I NIRC camera. This image is the deepest ground-based image of B335 and it shows part of the reflection nebulosity in the eastern outflow lobe, and, in particular, the shock front named IR2. Fig. 5 shows cutouts of the 2023 JWST F277W image and the 1996 Keck NIRC -band image. The images were aligned to optimally match the background stars within the limits imposed by their random proper motions. The rms shift of individual stars on the 1996 Keck images relative to their position in the 2023 JWST images was 221 mas or 8 mas yr-1.
The axial shock front 6E = IR2, shows a dramatic position shift and major morphological changes. In contrast, the peripheral shock front IR 3 (lower row in Fig. 5) that was just recorded in the south-eastern corner of the -band image, shows very little motion.
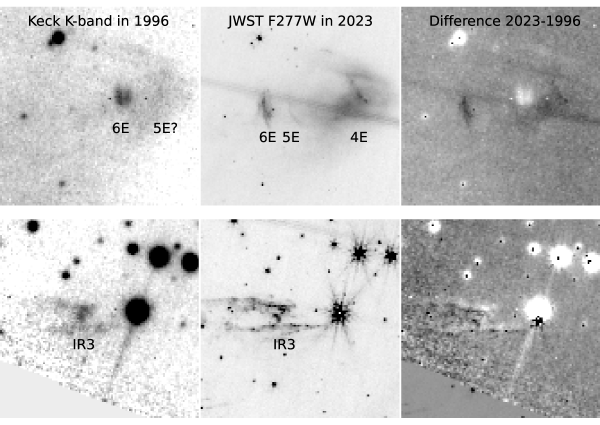
The shock front 6E = IR2 was measured by Gâlfalk & Olofsson (2007) to be 183 mas yr-1. We essentially confirm this proper motion with a measurement of the proper motion from the epoch 1996 Keck image of Hodapp (1998) and our JWST F277W image, the closest equivalent to the -band in our data set. Our measurement of the proper motion is 166 mas yr-1 or 129.4 km s-1 transverse velocity. The accuracy of this value is limited by the morphological changes that this shock front has undergone between the two images, making a clear association of features in the two images impossible. Whereas the 1996 image (Fig. 5 top left panel) shows two distinct shock fronts closely together along the outflow axis, the younger of those shock fronts has apparently caught up with the older one and by 2023, they formed one merged shock. From its proper motion, we derive the kinematic age of shock front 6E as 27784 d = 76 yrs and the ejection year at 1947. Due to the morphological changes, we estimate the accuracy of the proper motion and the kinematic age to be 10% and the accuracy of the ejection data as 8 yrs.
Without second epoch data, we do not know the proper motion of the other axial shock fronts closer to the protostar that form a string of individual shocks tracing the central axis of the flow. Assuming, for lack of better information, that their proper motion is the same as that of 6E = IR2, their distance from the extrapolated present position of the protostar leads to the shock front ages and ejection dates listed in Table 2. The ages of those axial shocks close to the protostar are only of order of decades, similar to what was found in adaptive optics studies of other protostellar outflows, e.g., SVS 13 (Hodapp & Chini, 2014), and MHO3252Y3 (Hodapp & Chini, 2018). We compare our result to those of Evans et al. (2023) who interpret the start of the W2 light curve outburst as the time of launch of a new molecular “bullet”. This point in time closely matches our estimate for the launch time of the rather dim shock 2E, but the light curve does not show a similar maximum coinciding with the launch of the much brighter shock 3E.
We have tentatively included the feature 0E in this list, assuming that this is the youngest shock front that is just emerging at present. Since this object is so faint and does not have much contrast with the surrounding emission, we could not obtain a spectrum of it. However, Rubinstein et al. (2023) have published a JWST NIRSpec IFU spectrum of this feature, which will be discussed in section 3.4. We expect that with a second epoch NIRCam image expected in 2024, the other axial shocks close to the protostar should also have measurable proper motions.
| Identification | RA | Dec | Distance | Ejection Age [d] | Ejection JD | Ejection Date |
|---|---|---|---|---|---|---|
| HH119 JWST 0E | 294.25380 | 7.56928 | 0.12 | 265 | 2459794 | 2022 Aug. |
| HH119 JWST 1E | 294.25397 | 7.56927 | 0.75 | 1654 | 2458405 | 2018 Oct. |
| HH119 JWST 2E | 294.25414 | 7.56927 | 1.34 | 2954 | 2457105 | 2015 Mar. |
| HH119 JWST 3E | 294.25434 | 7.56928 | 2.08 | 4587 | 2455472 | 2010 |
| HH119 JWST 3W | 294.25307 | 7.56921 | ||||
| HH119 JWST 4E | 294.25550 | 7.56930 | 4.65 | 10254 | 2449805 | 1995 |
| HH119 JWST 4W | 294.25222 | 7.56904 | ||||
| HH119 JWST 5E | 294.25667 | 7.56887 | 10.5 | 23153 | 2436906 | 1959 |
| HH119 JWST 6E | 294.25723 | 7.56897 | 12.6 | 27784 | 2432275 | 1947 |
| HH119 JWST 6W | 294.24943 | 7.56784 | ||||
| HH119 JWST 7E | 294.26113 | 7.56870 | 27.0 | 59537 | 2400522 | 1860 |
| HH119 JWST 8E | 294.26367 | 7.56848 | 35.6 | 78501 | 2381558 | 1808 |
Note. — The distance in arcsec is measured from the extrapolated position of the protostar. The ejection ages assume that all shock fronts listed here have the same proper motion as 6E
3.4 Emission from the youngest shock fronts
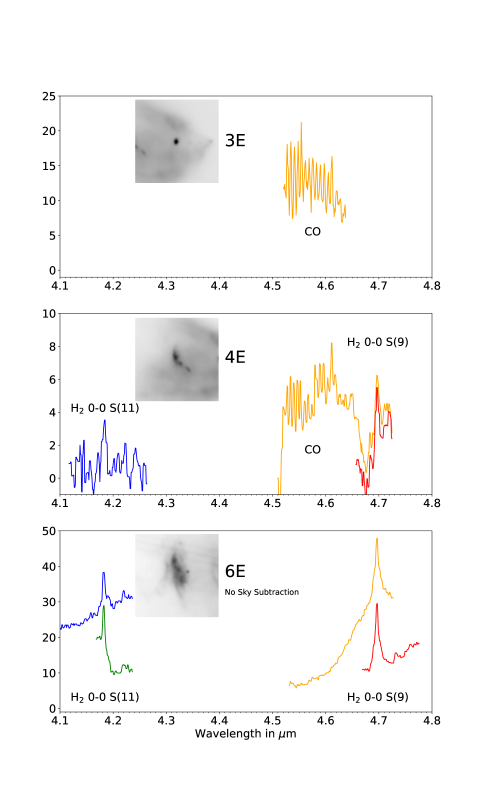
The marginally resolved 13 year old bright emission knot labelled 3E in Fig. 4 is indeed a shock front. One NIRCam long-wave module pixel subtends 10 AU at the distance of B335, so this is the approximate linear size of the marginally resolved knots. The axial shock front 3E is bright enough relative to the surrounding emission in the eastern outflow lobe that in the F460M WFSS frame in Fig. 2, it shows a series of emission lines that are identified as ro-vibrational transitions of CO in the extracted spectrum in Fig. 6 (top panel). CO bandhead emission is frequently seen in the spectra of protostars and young star themselves, a recent example being the work on the B335 protostar and its disk, seen in scattered light in the innermost parts of the outflow cavity by Rubinstein et al. (2023). Their NIRSpec IFU pointing contained object 0E in our nomenclature, which they name B335-E, and the reflection nebulosity immediately west of the protostar that they call B335-W and we have not individually labelled. They detect strong emission from the CO ro-vibrational transitions in the range from 4.4 - 5.2 m. While Rubinstein et al. (2023) work under the assumption that this emission is scattered light from the protostar and its disk, their result leaves the question open whether 0E (their B335-E) is actually an emerging shock front. Recently, JWST observations of HH211 by Ray et al. (2023) have shown CO emission around 4.6 m not only from scattered light from the immediate vicinity of the protostar, but also in the bow shocks of that outflow.
The bright, extended scattered light in the eastern outflow lobe shows deep absorption in the WFSS frame through the F430M filter in Fig. 2. This absorption feature, broadened by the extended flux distribution of the scattered light in the outflow cavity, is indicative of absorption by CO2 ice in the B335 molecular core. Our WFSS spectroscopy of background stars behind B335, the original purpose of our program 1187, shows saturated CO2 ice absorption near the center of the B335 core, which will be published in a separate paper.
The next of the inner axial shock fronts is the more extended 28-year-old 4E that has a clear bow shock morphology. We show the extracted spectrum in Fig. 6 (middle panel). The emission from CO is clearly detected, and the emission lines of H2 are more prominent relative to CO than in the case of the younger, more compact 3E. The third spectrum, the bottom panel in Fig. 6, is the extracted spectrum of the 76-year-old axial shock 6E and is dominated by the two H2 emission lines that fall in the transmission bands of the filters used here. We do not detect CO emission in this shock. Similarly, the more distant older shock fronts are emitting in the 0-0 S(9) (4.6946 m) and S(11) (4.1811 m) lines of H2. The H2 0-0 S(10) line is just outside the bandpass of filter F430M and therefore not recorded.
Assuming that the morphology, extent, and emission line characteristics of these three shocks represent a pattern, we conclude that typical shocks emerge from the protostar as fairly small ( 10 AU) clumps of material, expand over the course of a few decades, and change their density and temperature so that CO ro-vibrational lines are no longer excited. In the recent past, the B335 protostar appears to have undergone velocity changes in its molecular jet, leading to the production of internal shock fronts every 3 to 5 years. The apparently much higher frequency of shock ejection in recent decades compared to the larger separation and therefore lower shock frequency in the older shocks. This can be understood if shock fronts are initially ejected at a higher than average velocity and over time catch up with slower moving outflow material ahead of them. This scenario of individual internal work surfaces in a jet propagating into a dense medium was developed and modeled by Raga et al. (1990), applied to HH47, and further developed for jets of non-uniform density by Raga & Kofman (1992), applied to the case of HH34. Their scenario is similar to what we actually observed for shock front 6E, where two closely spaced shock fronts appear to have merged over the course of the past 27 years. We explain the fact that only a few strong shocks remain detectable after centuries by the combined effect of shock fronts expanding sideways and of shock fronts merging.
4 Summary and Conclusions
While many of the more distant and less obscured shock fronts have been studied before, the deep JWST images in the NIRCam long wavelength channel presented here show the full bipolar nebula associated with the B335 protostar. With much higher spatial resolution than older images, symmetric sets of shock fronts were found in the outflow lobes that indicate the repeated ejection of fast-moving gas whose differential velocities lead to the formation of these internal, relatively low excitation shock fronts. The kinematic age of the closest shock fronts from the protostar is of the order of a few years, if we assume the same proper motion as the closest shock with measured proper motion (6E). The youngest shock front with a spectrum (3E) is dominated by emission lines of gaseous CO. The next older shock front (4E) still shows CO emission, but with diminished strength, while more distant and older shock fronts (6E) do not show CO, but are dominated by H2 emission lines. The string of shock fronts emerging from the B335 protostar is indicative of repeated ejection events, probably due to some form of accretion episodicity. Among the older shock fronts at larger distances from the protostar, we note a distinction into two classes of proper motion, based on the measurements by Gâlfalk & Olofsson (2007). The low proper motion peripheral shocks in our images have their bow shocks pointing towards the protostar, indicative of shocks on a nearly stationary clump of denser material where the outflowing gas flows around the obstacle. By contrast, all high proper motion axial shock fronts have their bow shocks pointing away from the protostar, indicating shocks of the outflow wind against near stationary and uniform ambient gas. For the shock front 6E, we document the apparent merger of two distinct shock front seen in 1996 into one shock front in 2023.
References
- Bally (2016) Bally, J. 2016, ARA&A, 54, 491. doi:10.1146/annurev-astro-081915-023341
- Barnard et al. (1927) Barnard, E. E., Frost, E. B., & Calvert, M. R. 1927, [Washington] Carnegie institution of Washington, 1927.
- Bjerkeli et al. (2023) Bjerkeli, P., Ramsey, J. P., Harsono, D., et al. 2023, A&A, 677, A62. doi:10.1051/0004-6361/202245195
- Bjerkeli et al. (2019) Bjerkeli, P., Ramsey, J. P., Harsono, D., et al. 2019, A&A, 631, A64. doi:10.1051/0004-6361/201935948
- Boogert et al. (2015) Boogert, A. C. A., Gerakines, P. A., & Whittet, D. C. B. 2015, ARA&A, 53, 541. doi:10.1146/annurev-astro-082214-122348
- Chandler et al. (1990) Chandler, C. J., Gear, W. K., Sandell, G., et al. 1990, MNRAS, 243, 330
- Chu & Hodapp (2021) Chu, L. E. U. & Hodapp, K. W. 2021, ApJ, 918, 2. doi:10.3847/1538-4357/ac0ae8
- Connelley et al. (2009) Connelley, M. S., Hodapp, K. W., & Fuller, G. A. 2009, AJ, 137, 3494. doi:10.1088/0004-6256/137/3/3494
- Evans et al. (2015) Evans, N. J., Di Francesco, J., Lee, J.-E., et al. 2015, ApJ, 814, 22. doi:10.1088/0004-637X/814/1/22
- Evans et al. (2023) Evans, N. J., Yang, Y.-L., Green, J. D., et al. 2023, ApJ, 943, 90. doi:10.3847/1538-4357/acaa38
- Fazio et al. (2004) Fazio, G. G., Hora, J. L., Allen, L. E., et al. 2004, ApJS, 154, 10. doi:10.1086/422843
- Frerking & Langer (1982) Frerking, M. A. & Langer, W. D. 1982, ApJ, 256, 523. doi:10.1086/159928
- Gâlfalk & Olofsson (2007) Gâlfalk, M. & Olofsson, G. 2007, A&A, 475, 281. doi:10.1051/0004-6361:20077889
- Gardner et al. (2023) Gardner, J. P., Mather, J. C., Abbott, R., et al. 2023, PASP, 135, 068001. doi:10.1088/1538-3873/acd1b5
- Greene et al. (2017) Greene, T. P., Kelly, D. M., Stansberry, J., et al. 2017, Journal of Astronomical Telescopes, Instruments, and Systems, 3, 035001. doi:10.1117/1.JATIS.3.3.035001
- Hirano et al. (1988) Hirano, N., Kameya, O., Nakayama, M., et al. 1988, ApJ, 327, L69. doi:10.1086/185142
- Hodapp (1987) Hodapp, K.-W. 1987, ApJ, 319, 842. doi:10.1086/165502
- Hodapp (1998) Hodapp, K.-W. 1998, ApJ, 500, L183. doi:10.1086/311412
- Hodapp & Bressert (2009) Hodapp, K. W. & Bressert, E. 2009, AJ, 137, 3501. doi:10.1088/0004-6256/137/3/3501
- Hodapp & Chini (2014) Hodapp, K. W. & Chini, R. 2014, ApJ, 794, 169. doi:10.1088/0004-637X/794/2/169
- Hodapp & Chini (2018) Hodapp, K. W. & Chini, R. 2018, ApJ, 864, 172. doi:10.3847/1538-4357/aad636
- Hubble (1916) Hubble, E. P. 1916, ApJ, 44, 190. doi:10.1086/142284
- Imai et al. (2019) Imai, M., Oya, Y., Sakai, N., et al. 2019, ApJ, 873, L21. doi:10.3847/2041-8213/ab0c20
- Keene et al. (1983) Keene, J., Davidson, J. A., Harper, D. A., et al. 1983, ApJ, 274, L43. doi:10.1086/184147
- Kim et al. (2023) Kim, C.-H., Lee, J.-E., Contreras Peña, C., et al. 2023, arXiv:2312.05781. doi:10.48550/arXiv.2312.05781
- Maury et al. (2018) Maury, A. J., Girart, J. M., Zhang, Q., et al. 2018, MNRAS, 477, 2760. doi:10.1093/mnras/sty574
- Okoda et al. (2022) Okoda, Y., Oya, Y., Imai, M., et al. 2022, ApJ, 935, 136. doi:10.3847/1538-4357/ac7ff4
- Olofsson & Olofsson (2009) Olofsson, S. & Olofsson, G. 2009, A&A, 498, 455. doi:10.1051/0004-6361/200811574
- Raga et al. (1990) Raga, A. C., Canto, J., Binette, L., et al. 1990, ApJ, 364, 601. doi:10.1086/169443
- Raga & Kofman (1992) Raga, A. C. & Kofman, L. 1992, ApJ, 386, 222. doi:10.1086/171008
- Ray et al. (2023) Ray, T. P., McCaughrean, M. J., Caratti o Garatti, A., et al. 2023, Nature, 622, 48. doi:10.1038/s41586-023-06551-1
- Reipurth (1983) Reipurth, B. 1983, A&A, 117, 183
- Reipurth et al. (1992) Reipurth, B., Heathcote, S., & Vrba, F. 1992, A&A, 256, 225
- Reipurth et al. (2002) Reipurth, B., Rodríguez, L. F., Anglada, G., et al. 2002, AJ, 124, 1045. doi:10.1086/341172
- Rieke et al. (2023) Rieke, M. J., Kelly, D. M., Misselt, K., et al. 2023, PASP, 135, 028001. doi:10.1088/1538-3873/acac53
- Rubinstein et al. (2023) Rubinstein, A. E., Tyagi, H., Nazari, P., et al. 2023, arXiv:2312.07807. doi:10.48550/arXiv.2312.07807
- Steinacker et al. (2010) Steinacker, J., Pagani, L., Bacmann, A., et al. 2010, A&A, 511, A9. doi:10.1051/0004-6361/200912835
- Stutz et al. (2008) Stutz, A. M., Rubin, M., Werner, M. W., et al. 2008, ApJ, 687, 389. doi:10.1086/591789
- Tomita et al. (1979) Tomita, Y., Saito, T., & Ohtani, H. 1979, PASJ, 31, 407
- Vrba et al. (1986) Vrba, F. J., Luginbuhl, C. B., Strom, S. E., et al. 1986, AJ, 92, 633. doi:10.1086/114194
- Watson (2020) Watson, D. M. 2020, Research Notes of the American Astronomical Society, 4, 88. doi:10.3847/2515-5172/ab9df4
- Wright et al. (2010) Wright, E. L., Eisenhardt, P. R. M., Mainzer, A. K. et al., AJ, 140, 1868