Extraplanar emission in isolated edge-on late-type galaxies.
I.
The H distribution versus to the old and young
stellar discs.††thanks: Based on observations obtained at the Observatoire de
Haute Provence (OHP, France), operated by the French CNRS.
Abstract
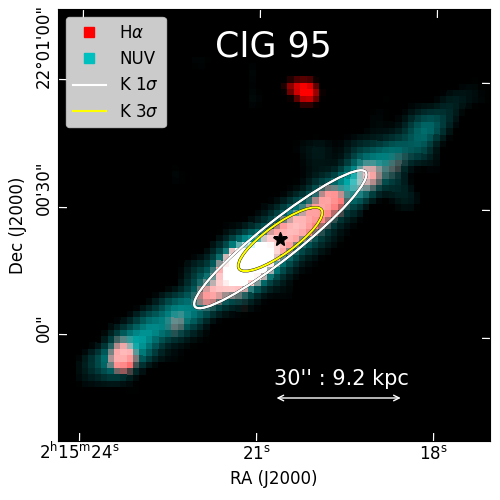
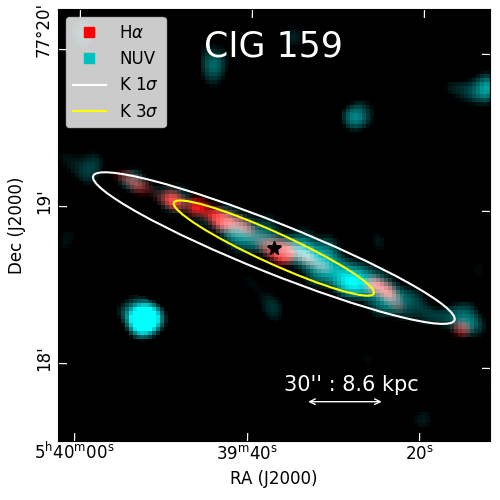
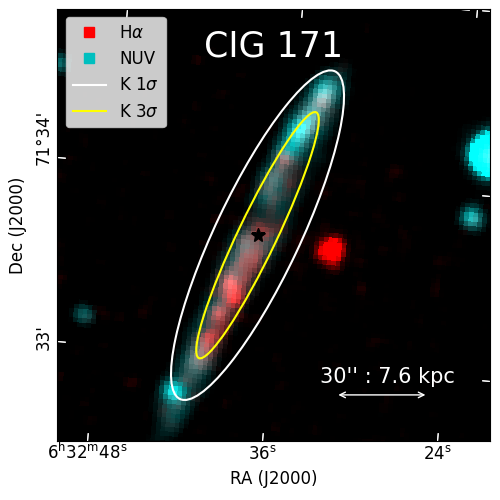
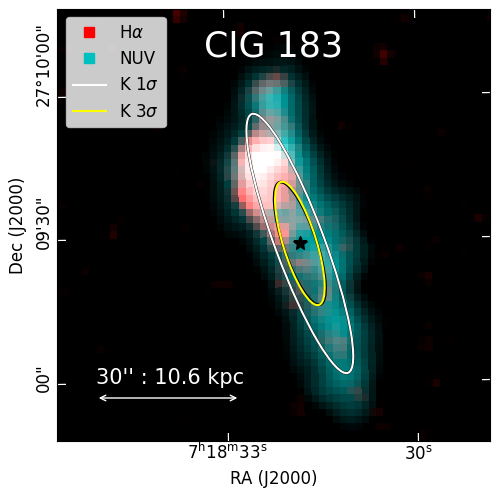
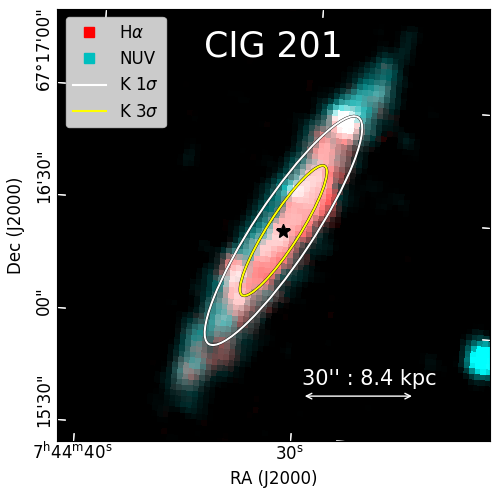
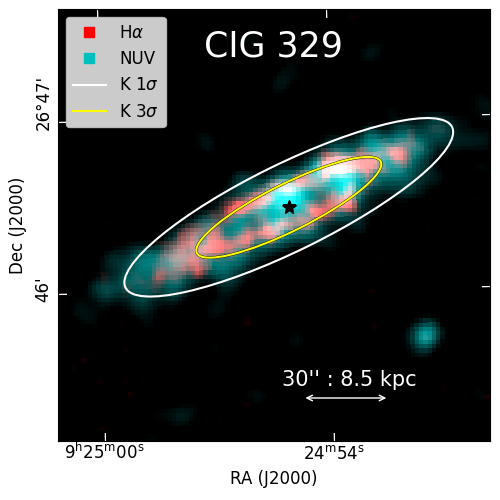
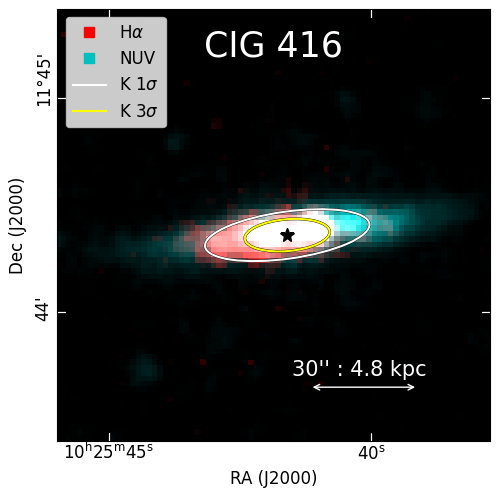
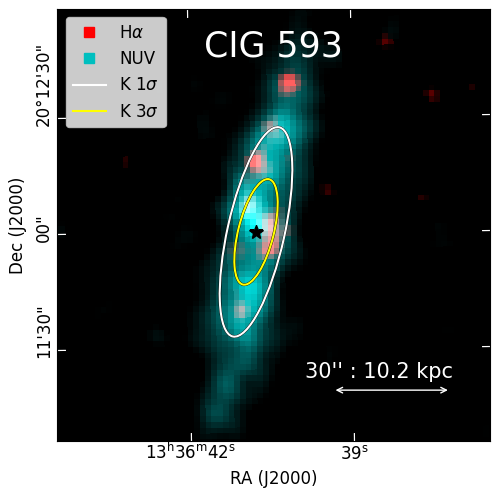
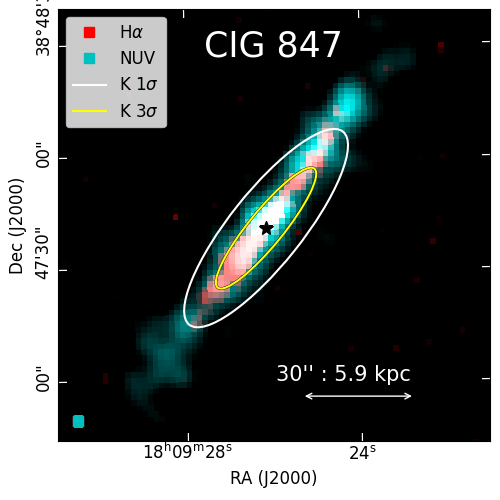
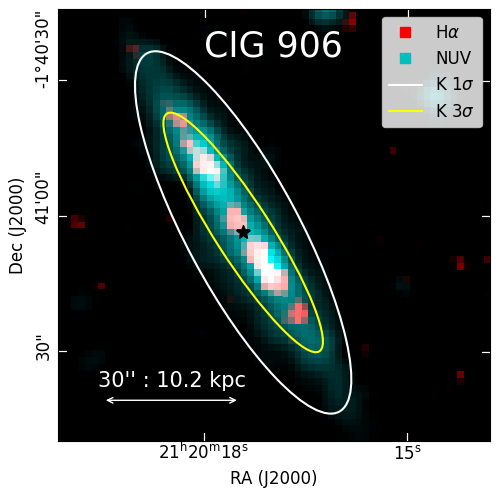
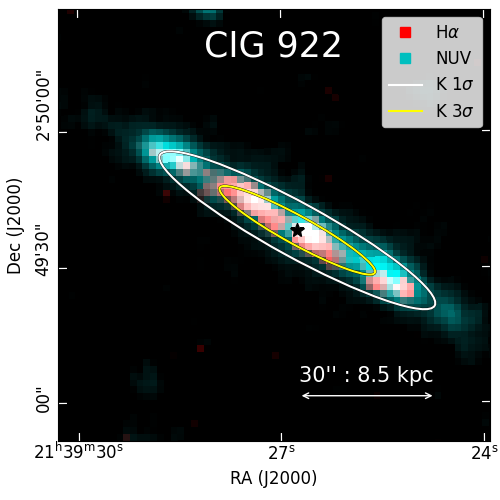
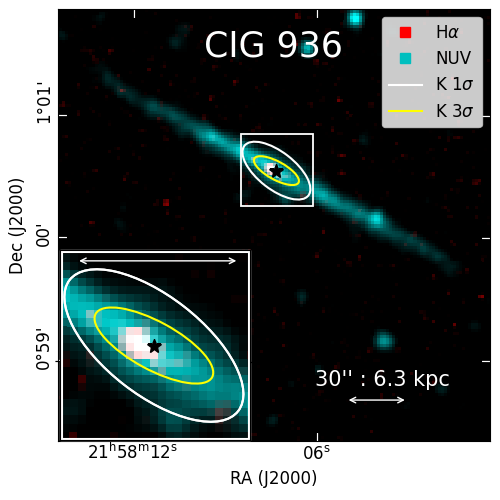
Isolated galaxies are the ideal reference sample to study the galaxy structure minimising potential environmental effects. We selected a complete sample of 14 nearby, late-type, highly inclined (), isolated galaxies from the Catalogue of Isolated Galaxies (CIG) which offers a vertical view of their disc structure. We aim to study extraplanar Diffuse Ionized Gas (eDIG) by comparing the old and young disc components traced by near-infrared (NIR) and Ultraviolet (UV) imaging with the H emission structure. We obtained H monochromatic maps from the Fabry-Perot (FP) interferometry, while the old and young discs structures are obtained from the photometric analysis of the 2MASS K-band, and GALEX NUV and FUV images, thereby identifying the stellar disc and whether the eDIG is present. The H morphology is peculiar in CIG 71, CIG 183, CIG 593 showing clear asymmetries. In general, geometric parameters (isophotal position angle, peak light distribution, inclination) measured from H, UV and NIR show minimal differences (e.g. 10), suggesting that interaction does not play a significant role in shaping the morphology, as expected in isolated galaxies. From H maps, the eDIG was detected vertically in 11 out of 14 galaxies. Although the fraction of eDIG is high, the comparison between our sample and a generic sample of inclined spirals suggests that the phenomenon is uncorrelated to the galaxy environment. As suggested by the extraplanar UV emission found in 13 out of 14 galaxies the star formation extends well beyond the disc defined by the H map.
keywords:
galaxies: haloes – galaxies: evolution – galaxies: ISM – galaxies: photometry – galaxies: stellar content – galaxies: fundamental parameters1 Introduction
Galaxy interactions dramatically impact several galaxy properties, such as their morphology and star-formation history (see e.g. rampazzo-2016, and references therein). The idea of gathering catalogues of isolated galaxies has been developed at least since the 1970s (e.g. the Catalogue of Isolated Galaxies (CIG), Karachentseva-1973) as a baseline for comparison with galaxies located in denser environments subject to interaction-induced phenomena. In the last decades, catalogues of isolated galaxies, selected from very low galaxy density regions, have been either implemented or revised using redshift measurements (verdesm-2005; Karachentseva-2009; Argudo-F-2013; Argudo-F-2015). A recent H i study of isolated galaxy samples suggests a picture of "nurture free" galaxies (Jones2018). Other works (see e.g. Rampazzo2020) have shown that isolated elliptical galaxies suffered past interactions from which they still show the ‘scars’, although they have probably not experienced gravitational influences from their close neighbours over the past billion years.
This paper concentrates on the stellar versus H components in isolated spiral galaxies seen nearly edge-on (). This galactic configuration relative to the sky plane provides more information on the vertical structure of the disc (e.g. burstein-1979; fraternalli-2006; kamphuis-2007; peters-2017) revealing the extraplanar Diffuse Ionized Gas (eDIG), detected in galaxies with relatively high star formation rate (SFR) surface densities (rossa-2003-i; rossa-2003-ii). The eDIG is usually traced at optical wavelengths using the H recombination line (e.g Rosado-2013). In addition, as the eDIG might be spatially correlated with the star formation (SF)-gas relations, it has been observed to trace regions of H i dominance within galactic discs, especially those located outside active star-forming regions, making the 21-cm emission line a helpful tool for the eDIG detection (e.g. Zschaechner-2015-a). Ultraviolet (UV) imaging can also detect the low-intensity outer star formation disc by detecting OB stars located in very low SFR density regions (e.g. hoopes-2001; thilker-2002; gil-de-paz-2005; thilker-2005; thilker-2007-i; gil-de-paz-2007-ii). From the comparison between the H and the UV images of spiral galaxies with low inclination (), thilker-2007-i showed that the Near Ultraviolet (NUV) emitting component is radially more extended than the emission of the old stellar population in at least 30% of galaxies from the Local Universe (z0.02). In high inclined galaxies, in cases where an eDIG layer does exist, the UV haloes tend to form a thick disc having a similar morphology to the UV halo and occurring in about the same place (hodges-k-2016). Moreover, it has been observed that the H-UV flux ratio is lower in the eDIG than in H ii regions, indicating that the field OB stars, which are situated outside the star-forming regions, are important contributors to the eDIG ionization in most of the galaxies, and even in some galaxies they may be the dominant ionization source (hoopes-2001; hodges-k-2016; jo-2018).
The eDIG morphology shows a wide variety of local morphological features rand-1998; rossa-2003-ii; Rosado-2013 such as prominent layers of diffuse gas, filamentary structures, or just one or a few patches of extraplanar emission rand-1998; rossa-2003-ii; Rosado-2013. Some eDIG originating phenomena have been proposed, such as Inter Stellar Medium (ISM) activity in the galaxy disc (e.g. heald-2006; heald-2006-b; heald-2007; Rosado-2013; ho-2016; jones-manga-2017; bizayaev-2017), intergalactic medium accretion (e.g. putman-2012; putman-2017; levy-2019; bizyaev-2022), satellite galaxies interaction (e.g. walker-1996; Zschaechner-2015-a) and accretion or intra-cluster interaction (e.g. tomicic-2021; sardaneta-2022; boselli-2022). In parallel, several studies have demonstrated that the UV halo emission is consistent with a reflection nebula produced by dust in the halo (e.g. hodges-k-2014; shin-2015; hodges-k-2016; jo-2018; shin-2019). Various mechanisms have been suggested as potential sources for diffuse-and-global UV haloes, including galactic radiation, magneto-hydrodynamic phenomena, and dust accretion from the circumgalactic or intergalactic medium (see shin-2015, for a comprehensive examination). The contribution of each process over cosmic time is still unclear as they both produce hot and cold components that occupy roughly the same space (e.g. hodges-k-2014).
Several studies from large surveys such as SAMI111Sydney-AAO Multi-object Integral field spectrograph (SAMI) (ho-2016), MaNGA222Mapping Nearby Galaxies at Apache Point (MaNGA) (jones-manga-2017; bizayaev-2017; bizyaev-2022) and CALIFA333Calar-Alto Legacy Integral Field Area (CALIFA) (levy-2019), and from specific surveys as CHANG-ES444Continuum haloes in Nearby Galaxies—an EVLA Survey (CHANG-ES) (lu-changes-2023) have employed various environmental definitions in the selection of their samples of edge-on galaxies, contributing to varying interpretations of the relationship between extraplanar gas properties and their host galaxies. For instance, they have either discarded major mergers with clear tidal features (ho-2016; bizyaev-2022), rejected galaxies that have another object in the field, including stars (bizayaev-2017) or excluded galaxies with distorted discs in their H images (lu-changes-2023). Recently, two studies agreed that the eDIG could be a consequence of the accretion of the CircumGalactic Medium (CGM) (levy-2019; bizyaev-2022) which has also been proposed as probable UV halo origin (e.g. hodges-k-2014; shin-2015). However, most of the literature still lacks a general agreement on the sources of ionization for eDIG. Since the eDIG may be related to the CGM, bizyaev-2022 visually examined the outer regions of each galaxy of their sample aiming to locate environmental structures that might be connected to the eDIG. Their findings ranged from small satellites lacking noticeable structure to large satellites even larger than the primary object. Therefore, the consensus or discrepancy in explaining the eDIG origin is likely a consequence of the different definitions of environment adopted. As a reference study case, isolated star-forming galaxies with the possibility of edge-on observations is needed.
In order to study the environmental effects on the eDIG distribution, we selected a sample of isolated nearby late-type, high-inclined galaxies from the CIG catalogue (Karachentseva-1973). Indeed, nearby galaxies are better resolved, late-type galaxies are those which contain the most H emission, and almost edge-on galaxies are those for which it is easier to detect the gas emission at high galactic latitude and for which the column density is higher, even in the disk outskirts. The extraplanar gas is commonly defined as the detectable H emission where the stellar continuum is not detected. This could be done from the continuum-subtracted emission-line image which delimits the stellar disc (e.g. miller-2003-i; Rosado-2013; levy-2019; tomicic-2021). This is typically what is done when observations with narrow- and broad-band filters around H emission are combined. Alternatively, the old stellar disk in spiral galaxies (Population II stars) could be better defined from redder broad-band in the near-infrared (NIR, e.g. kamphuis-2007; ho-2016; bizayaev-2017; bizyaev-2022) and young stellar population from bluer broad-band, e.g. in the UV, which traces the young stellar populations of ages up to tenths of Myrs (hoopes-2001; thilker-2007-i; bianchi-2011; Kennicutt2012). We used this method in this work. We present the H emission maps of a sample of galaxies. The net H maps (i.e. continuum free) were obtained using the scanning Fabry-Perot spectroimager (FP) GHASP, providing complete two-dimensional coverage of very extended line emission regions, ideal for studying the faint diffuse gas emission. We compared H FP monochromatic maps with NIR, NUV and Far UV (FUV) images available in the literature. We defined a certain threshold in the NIR image under which the stellar density is low and consider that the eDIG is the H emission below this limit. The geometric parameters of the galaxies, such as the isophotal position angle, peak light distribution and inclination, are obtained from the photometric analysis of the UV and NIR images, and will serve as reference when studying the H kinematics in a forthcoming paper.
The paper is structured as follows. In Section 2, we provide details about the sample selection. In Section 3, we describe the data acquisition and reduction processes. In Section LABEL:Sec:stellarDisc, we explain how the stellar disc and the extraplanar components are identified. In Section LABEL:Sec:results, we present the individual results of the photometric analysis of each galaxy in our sample. In Section LABEL:Sec:discussion, we discuss our main results. Finally, in Section LABEL:Sec:Conc, we provide a summary and the conclusions of our results. In order to compare our results with previous surveys, throughout this work we assumed a Hubble constant of (e.g. thilker-2007-i; ho-2016; levy-2019).
2 The sample selection
| CIG | Other | RA (J2000) | Dec (J2000) | Distance | Type | |||||||
|---|---|---|---|---|---|---|---|---|---|---|---|---|
| Name | Name | (hh mm ss) | ( ‘ “) | () | (Mpc) | (deg) | (mag) | (kpc) | (Jy) | (Jy) | () | |
| (1) | (2) | (3) | (4) | (5) | (6) | (7) | (8) | (9) | (10) | (11) | (12) | (13) |
| 71 | UGC 01391 | 01 55 15.8 | +10 00 49.2 | 5901 | 84.3 | 83.8 | 10.8 | 35.4 | Sc | 0.66 | 1.38 | 6.79 |
| 95 | UGC 01733 | 02 15 20.6 | +22 00 22.0 | 4418 | 63.1 | 86.5 | 11.6 | 33.4 | Sc-w | 0.22 | 0.64 | 1.49 |
| 159 | UGC 03326 | 05 39 37.1 | +77 18 44.9 | 4121 | 58.9 | 85.4 | 9.6 | 60.8 | *Scd: | 1.10 | 3.57 | 3.26 |
| 171 | UGC 03474 | 06 32 37.6 | +71 33 39.5 | 3634 | 51.9 | 84.0 | 10.1 | 33.8 | *Scd: | 0.57 | 1.43 | 4.40 |
| 183 | UGC 03791 | 07 18 31.8 | +27 09 28.7 | 5090 | 72.7 | 80.4 | 11.4 | 26.0 | *Sd : | 0.49 | 1.38 | 2.78 |
| 201 | UGC 03979 | 07 44 31.0 | +67 16 24.9 | 4061 | 58.0 | 80.9 | 10.6 | 31.4 | SA(rs)c | 1.18 | 2.86 | 3.39 |
| 329 | UGC 05010 | 09 24 55.1 | +26 46 28.8 | 4096 | 58.5 | 81.3 | 9.3 | 42.8 | SA(rs)b | 0.30 | 1.34 | 1.61 |
| 416 | UGC 05642 | 10 25 41.8 | +11 44 20.8 | 2322 | 33.2 | 81.1 | 11.6 | 18.0 | Sd -pec | 0.52 | 1.16 | 2.69 |
| 593 | UGC 08598 | 13 36 40.7 | +20 12 00.5 | 4909 | 70.1 | 83.2 | 10.8 | 35.5 | SBx(s)b: | 0.09 | 0.40 | 0.53 |
| 847 | UGC 11132 | 18 09 26.2 | +38 47 39.9 | 2837 | 40.5 | 81.2 | 10.7 | 24.6 | *Sb | 0.59 | 1.98 | 5.74 |
| 906 | UGC 11723 | 21 20 17.5 | -01 41 03.6 | 4899 | 70.0 | 80.9 | 10.0 | 37.9 | Sbc | 1.97 | 5.95 | 11.51 |
| 922 | UGC 11785 | 21 39 26.8 | +02 49 37.6 | 4074 | 58.2 | 84.2 | 11.0 | 29.4 | Scd-w | 0.31 | 1.62 | 2.57 |
| 936 | UGC 11859 | 21 58 07.4 | +01 00 32.3 | 3011 | 43.0 | 85.7 | 11.4 | 38.7 | Sc: | 0.71 | 1.49 | 1.13 |
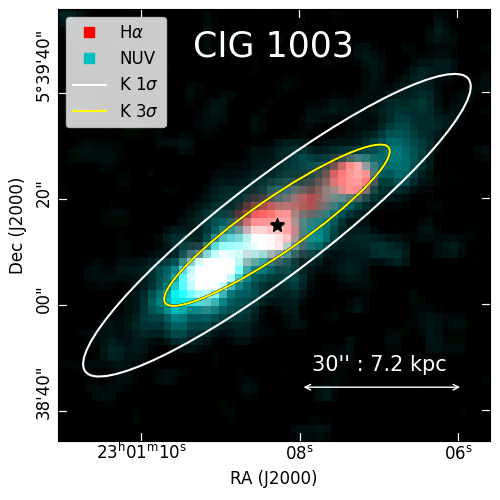
| 1003 | UGC 12304 | 23 01 08.3 | +05 39 15.7 | 3470 | 49.6 | 82.5 | 10.3 | 22.9 | Scd | 2.06 | 4.57 | 15.07 |
Columns: (1) CIG galaxy name; (2) UGC galaxy name; (3) and (4) wcs coordinates (J2000); (5) : systemic velocity from NED; (6) heliocentric distance to the galaxy; (7) : inclination computed using the relation 1 (see the text); (8) : apparent K-band magnitude from NED; (9) : optical diameter in the -band from NED; (10) Hubble classification from buta-2019 and, if not available, from NED (*); (11) and (12) flux densities at 25m, 60m and 100m in Jy from lisenfeld-2007; (13) FIR luminosity computed with the equation LABEL:ec:LFIR-rossa00Eq8 (see Section LABEL:Sec:ddd).
Isolated galaxies have been the subject of selection and study for many decades. Evidences are accumulating that over at least a few billion years the evolution of isolated galaxies has not been driven by interactions with physically associated companions (see e.g. verdesm-2005; Karachentseva-2009; Karachentsev-2011; Rampazzo2020, and references therein). In this sense, isolated galaxies are the ideal reference sample to study internal galactic forces and galaxy morphological, dynamical and photometric evolution minimizing possible environmental effects.
The CIG catalogue (Karachentseva-1973) and its more recent revisions (verdesm-2005; verley-2007; Argudo-F-2013) are examples of a successful attempt to compile a sample of isolated galaxies. Historically, Karachentseva-1973 obtained her catalogue from the visual inspection of the Digitized Sky Survey (DSS) images of the 27 837 galaxies – and of their surroundings – (at Galactic latitudes ) contained in the CGCG555Catalogue of galaxies and of clusters of galaxies (CGCG, Zwicky-1968) https://cdsarc.cds.unistra.fr/viz-bin/cat/VII/190 .. A list of 1050 galaxies were found to meet the isolation criterion she adopted (see also Karachentseva-2009).
Since we are looking for the incidence of eDIG among isolated galaxies we have selected a sample from the CIG catalogue (Karachentseva-1973) of late-type galaxies (Spirals with morphologycal type , i.e. Sb to be checked) (see buta-2019) dominated by Population I stars that satisfy the following additional characteristics we derived from the NED data-base:
-
1.
galaxies with high inclination () computed with the expression
(1) where and are the apparent optical major and minor axes of the galaxy respectively;
-
2.
galaxies with redshift to ensure that the emission of the redshifted H line fits in the optical wavelength;
-
3.
galaxies with apparent K-band magnitude . The near-infrared is sensitive to nuclear rings and large-scale bars, which might fuel active nuclei (e.g. kormendy-1982; Eskridge-2002; jarrett-2003).
A complete sample of 14 nearby isolated late-type edge-on galaxies was obtained (see Figure 2). General parameters of our galaxy sample are listed in Table 1.

Isolation degree
To be an isolated galaxy, the CIG catalogue required that no similar size neighbours were found close to the galaxy. This requirement can be described as follows: a galaxy with a standard angular diameter denoted as is classified as isolated when the angular separation between the galaxy and its -th neighbor with angular diameter , meets or exceeds a threshold of (see equations 1 and 2 in Karachentseva-2009). Since galaxies from the CIG catalogue were collected by visual inspection of DSS images, the companion galaxies are expected to be faint or mostly dwarf galaxies. Recently, the CIG catalogue has been refined using new quantification methods (e.g. verley-2007) and modern tools like images with higher resolution than the plates of Palomar (e.g. Argudo-F-2013) and new images from H i emission data (e.g. Jones2018). In this Section, we discuss how effectively our galaxy sample selected from the CIG catalogue meets these new isolation checks. However, even if a subset of our sample does not meet the strictest isolation criteria, all galaxies in our sample still represent a significant part of the overall isolated galaxy sample.
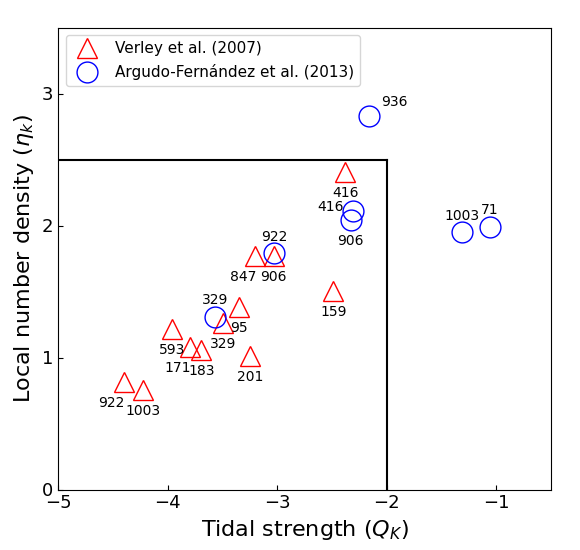
In the frame of the long-term AMIGA project (Analysis of the interstellar Medium of Isolated GAlaxies666Analysis of the interstellar Medium of Isolated GAlaxies (AMIGA) (http://www.iaa.es/AMIGA.html/)), verley-2007-i; verley-2007 revised all the positions of the CIG galaxies based upon the digitized photographic plates from POSS-1 and POSS-2 providing a quantification of the degree of isolation of CIG galaxies with the local number density of neighbour galaxies (), and the tidal strength () affecting the central galaxy by its neighbourhood. These parameters depend on the position, diameter and mass of the primary galaxy and its -th neighbour. Thus, these parameters provide a clear picture of the environment around the isolated galaxies: the presence of one single similar size neighbour at a small distance to the CIG galaxy would result in a high value of the tidal strength () estimation, while the local number density () remains quite low as it is averaged over more nearest neighbours (verley-2007). In Table 2 we list the number of neighbours and the nearest-neighbour distance to each galaxy in our sample according to verley-2007-i. Then, Argudo-F-2013 re-evaluated the isolation criteria of AMIGA galaxies within a field radius of 1 Mpc using both photometric and spectroscopic data available from the Sloan Digital Sky Survey (SDSS) to refine the and parameters.
Figure 3 shows the comparison between the local number density () and tidal strength () of the galaxies in our sample making the distinction between the results of verley-2007 and Argudo-F-2013. From Figure 3 and Table 2, we observe that some galaxies classified as isolated in the AMIGA sample have its nearest neighbour at an angular distance of twice or three times their optical diameters, for example CIG 171 and 201. According with verley-2007-i, most of the neighbouring galaxies of CIG galaxies have a diameter , implying they are dwarf companions which were not took into account by Karachentseva-1973 when collecting the CIG catalogue but perhaps they can influence the evolution of the main galaxy. Therefore, if CIG 171 and 201 are in region of bona fide isolated galaxies in the AMIGA sample, we may infer that the nearest neighbours are small enough to not exert significant gravitational perturbations on the main galaxy. On the other hand, verley-2007 had already determined that the galaxies of our sample, CIG 71 and CIG 936, were outside this region, excluding both galaxies from the AMIGA sample. As Argudo-F-2013 improved the quantification of the isolation degree, another galaxy of our sample, CIG 1003, is also out of the area of isolated galaxies in the plane. In this way, 3 out of 14 galaxies in our sample failed the isolation criteria of the AMIGA sample, probably because they have some faint companions previously undetected by Karachentseva-1973.
Later, Jones2018 provided integrated H i fluxes of AMIGA galaxies by presenting a catalogue of H i single dish observations. With these new data, Jones2018 included a review of integral features of AMIGA galaxies allowing to ensure isolation level of the AMIGA catalogue. Since the Argudo-F-2013 work is limited to the SDSS data, Jones2018 adopted the criteria of verley-2007, and excluded all sources with heliocentric velocities below 1500 , removed all dwarf galaxies that were in the CIG, and discarded all sources with potentially spurious spectral parameters, leaving a final sample of 544 CIG galaxies. In these terms, 8 out of 14 galaxies in our sample would not be considered well isolated: CIG 71, 159, 171, 201, 416, 922, 936 and 1003.
While some members of our sample, selected from the CIG catalogue (Karachentseva-1973), may not fully meet the strictest current isolation criteria, it is important to stress that all galaxies in our sample are still classified as isolated galaxies. The different arguments stated above make us aware of the different degrees of isolation of the galaxies in our sample. However, previous studies indicate that late-type galaxies are usually located in very low-density environments. In this context, we decided not to exclude any galaxy a priori but rather discuss each of them knowing their isolation properties.
| CIG | Neighbours | Distance | |
| Name | (arcsec) | (kpc) | |
| (1) | (2) | (3) | (4) |
| 71 | 4 | 941 | 384.6 |
| 95 | 71 | 362 | 110.7 |
| 159 | 34 | 456 | 130.2 |
| 171 | 91 | 152 | 38.2 |
| 183 | 25 | 784 | 276.3 |
| 201 | 57 | 109 | 30.6 |
| 329 | 101 | 316 | 89.6 |
| 416 | 168 | 362 | 58.3 |
| 593 | 26 | 739 | 251.2 |
| 847 | 79 | 644 | 126.4 |
| 906 | 28 | 391 | 132.7 |
| 922 | 97 | 197 | 55.6 |
| 936 | 88 | 234 | 48.8 |
| 1003 | 77 | 118 | 28.4 |
Columns: (1) CIG galaxy name; (2) number of neighbours in a physical radius of 0.5 Mpc; (3) and (4) distance to the nearest neighbour in arcseconds and kpc respectively given the heliocentric galactic distance listed in Table 1.
3 The data
3.1 H observations and data reduction
Observations of the H emission line were performed using the scanning Fabry-Perot (FP) interferometer, GHASP, attached at the Cassegrain focus of the 1.93m telescope at the Observatoire de Haute-Provence (OHP, see Table 3). A GaAs Image Photon Counting System (IPCS) is used to reach low detection levels, offering a total FoV of about arcmin with a pixel scale of 0.68 arcsec pix (gach-2002). Since the IPCS has no readout noise, exposures of 10 seconds were chosen for each of the 32 scanning steps required to cover the GHASP’s free spectral range (FSR). In order to detect the eDIG emission, the scanning sequence was typically repeated 35 times, resulting in a total exposure time per galaxy of 180 min. We used narrow-band interference filters (mainly FWHM15 Å and in a few cases slightly larger up to 24 Å) enabling to select the redshifted H line of ionized hydrogen (6562.78 Å). The scanning Fabry-Perot interferometer we used, with an interference order of 798 and a finesse 13 at H, allowed GHASP to reach a typical spectral resolution of .
Two calibration cubes were obtained, one at the beginning and another at the end of the observation, using a neon lamp with selected narrow line at Å, close to the redshifted nebular wavelength in order to minimize phase shift effect (e.g. gomezl-2019). The observation date, filter’s central wavelength and FWHM, the total exposure time and the astronomical seeing of each galaxy are listed in Table 4.
For the data reduction, we used the packages based on homemade IDL777Interactive Data Language, ITT Visual Information Solutions: https://www.l3harrisgeospatial.com/Software-Technology/IDL routines, reducWizard and ComputeEverything (see e.g. epinat-2008-ii). The data reduction technique has been widely reported in daigle-2006-fp. In summary, it consists in the following steps: (1) integration with guiding correction of the total data cubes obtained during the observation; (2) application of a Hanning spectral smoothing on the data cube; (3) calibration in wavelength of the integrated data cubes through the computation of a parabolic phase map which is computed from the calibration cube in order to obtain the reference wavelength for the line profile observed inside each pixel, creating a wavelength-sorted data cube by applying the phase map correction to the interferogram data cube; (4) subtraction of the OH sky-lines emission; (5) a Gaussian spatial smoothing with a FWHM selected on the wavelength data cubes; and (6) computation of H monochromatic, continuum, radial velocity and velocity dispersion maps for each wavelength calibrated cube. Finally, astrometric information was attached to the processed files by using the IDL task koords from the KARMA package (gooch-1996). In Table 4, we also listed the seeing and the final spatial resolution in kpc arcsec after the spatial Gaussian smoothing of the H maps.
We performed two separate processes on the wavelength data cube. First, we applied Gaussian spatial smoothing, and then, independently, we performed adaptive spatial binning using a Voronoi tessellation with a target SNR5. To ensure a signal-to-noise ratio SNR in the Gaussian smoothed data cube, we compared the monochromatic H maps derived from both processes and set a threshold for the emission detected in the Gaussian smoothed maps. For a SNR5, the GHASP surface brightness detection limit is (see epinat-2008-ii; gomezl-2019; sardaneta-2022). As no H calibrated image of any galaxy in our sample has been previously published, we followed the calibration procedure outlined by epinat-2008-ii to determine the total H flux for the GHASP data (see Appendix LABEL:sec:flux).
The data analysis was made with the program ADHOCw888‘Analyse et Depouillement Homogene des Observations Cigale for Windows’ http://cesam.lam.fr/fabryperot/index/softwares developed by J. Boulesteix at Marseille Observatory in 2005., IRAF999‘Image Reduction and Analysis Facility’ http://iraf.noao.edu/ tasks, the SAO Image DS9 software101010SAO Image DS9. An image display and visualization tool for astronomical data (ds9) https://sites.google.com/cfa.harvard.edu/saoimageds9 and our own Python scripts.
| Parameter | Value |
|---|---|
| Telescope | 1.93 m OHP |
| Aperture ratio of the focal reducer | |
| Instrument | GHASP |
| Detector type | IPCS GaAs system |
| Detector size (pix) | 512512 |
| Image scale (arcsec pix) | 0.68 |
| Field of view (arcmin) | 5.95.9 |
| Interference order at H | 798 |
| FSR at H (Å / ) | 8.23 / 376 |
| Finesse observed | 13 |
| Resolution | 10000 |
| Spectral sampling at H (Å / ) | 0.26 / 11.5 |
| CIG | Date | FWHM | Seeing | Resolution | ||
|---|---|---|---|---|---|---|
| Name | (aaaa/mm/dd) | (Å) | (Å) | (min) | (arcsec) | (kpc arcsec) |
| (1) | (2) | (3) | (4) | (5) | (6) | (7) |
| 71 | 2019/10/26 | 6700 | 24 | 176 | 4.4 | 2.0 |
| 95 | 2019/10/27 | 6665 | 15 | 192 | 2.4 | 1.0 |
| 159 | 2021/01/13 | 6655 | 15 | 181 | 2.6 | 1.0 |
| 171 | 2021/01/14 | 6645 | 15 | 187 | 2.8 | 0.9 |
| 183 | 2021/01/21 | 6675 | 15 | 213 | 3.0 | 1.3 |
| 201 | 2021/01/16 | 6655 | 15 | 187 | 3.3 | 1.1 |
| 329 | 2021/01/13 | 6655 | 15 | 181 | 3.8 | 1.2 |
| 416 | 2021/01/21 | 6615 | 15 | 187 | 4.1 | 0.7 |
| 593 | 2021/03/09 | 6675 | 15 | 219 | 2.9 | 1.2 |
| 847 | 2019/10/29 | 6630 | 20 | 187 | 2.3 | 0.6 |
| 906 | 2019/10/26 | 6675 | 15 | 187 | 1.9 | 0.9 |
| 922 | 2019/10/25 | 6655 | 15 | 192 | 2.2 | 0.8 |
| 936 | 2019/10/27 | 6630 | 20 | 187 | 3.0 | 0.8 |
| 1003 | 2019/10/26 | 6645 | 15 | 187 | 2.5 | 0.8 |
Columns: (1) CIG galaxy name; (2) date of observation; (3) : non-tilted filter central wavelength; (4) FWHM: non-tilted full width half-maximum; (5) : total exposure time; (6) Seeing in arcs; (7) Final spatial resolution in kpc per arcseconds after having applied a spatial Gaussian smoothing on the H wavelength data cubes (see Section 3.1).