The Dust Attenuation Scaling Relation of Star-Forming Galaxies in the EAGLE Simulations
Abstract
Dust attenuation in star-forming galaxies (SFGs), as parameterized by the infrared excess (IRX ), is found to be tightly correlated with star formation rate (SFR), metallicity and galaxy size, following a universal IRX relation up to . This scaling relation can provide a fundamental constraint for theoretical models to reconcile galaxy star formation, chemical enrichment, and structural evolution across cosmic time. We attempt to reproduce the universal IRX relation over using the EAGLE hydrodynamical simulations and examine sensitive parameters in determining galaxy dust attenuation. Our findings show that while the predicted universal IRX relation from EAGLE approximately aligns with observations at , noticeable disparities arise at different stellar masses and higher redshifts. Specifically, we investigate how modifying various galaxy parameters can affect the predicted universal IRX relation in comparison to the observed data. We demonstrate that the simulated gas-phase metallicity is the critical quantity for the shape of the predicted universal IRX relation. We find that the influence of the infrared luminosity and infrared excess is less important while galaxy size has virtually no significant effect. Overall, the EAGLE simulations are not able to replicate some of the observed characteristics between IRX and galaxy parameters of SFGs, emphasizing the need for further investigation and testing for our current state-of-the-art theoretical models.
keywords:
galaxies: evolution – galaxies: high-redshift – galaxies: ISM – galaxies: statistics – infrared: galaxies1 INTRODUCTION
It is widely accepted that galaxy formation and evolution are governed by the hierarchical assembly of dark matter haloes and baryonic physics (van den Bosch et al., 2002; Mo et al., 2010; Katsianis et al., 2023). Baryonic physics involve complex processes which shape the gas, metals and dust within the interstellar medium (ISM), the underlying stellar populations, star formation, and stellar feedback (Tumlinson et al., 2017; Péroux & Howk, 2020; Tejos et al., 2021; Saintonge & Catinella, 2022). Despite the fact that dust constitutes only 1 per cent of the ISM in the star-forming galaxies (SFGs), it significantly alters the panchromatic spectral energy distribution since it absorbs the ultraviolet (UV)-optical light and then re-emits it in the infrared (IR) (Galliano et al., 2018; Hahn et al., 2022). The above process seriously affects the measurements of galaxy observables (Calzetti, 2001; Conroy, 2013; Trayford et al., 2020). In addition, dust is a crucial component that drives the cycle of baryons as it facilitates the formation of molecular gas and acts as an essential coolant for star and planet formation. Furthermore, dust plays an important role in converting radiation pressure into mechanical energy of outflows (Thompson et al., 2015; Naddaf & Czerny, 2022). Thus, a deep understanding of dust evolution and its relevant physical processes are crucial for the buildup of a comprehensive picture of galaxy evolution.
Although our current state-of-the-art models are able to globally predict the dust content for galaxy populations up to redshift (Popping et al., 2017; Davé et al., 2019), there is a major challenge in simultaneously reproducing the observed fundamental properties of galaxies (e.g. the star formation rate function, the cosmic star formation rate density, the H I mass function, and the H I-to-halo mass relation) at different epochs in a self-consistent framework (Zhao et al., 2020; Katsianis et al., 2021b; Li et al., 2022; Picouet et al., 2023). The dust content of a galaxy is determined by the amount of gas and the gas-to-dust ratio, which is controlled by the gas-phase metallicity (Trayford et al., 2017; Galliano et al., 2018; De Vis et al., 2019; Trčka et al., 2020; Casasola et al., 2020). Observationally, the attenuated stellar emission and dust thermal IR radiation of galaxies can be directly measured while the dust content is indirectly inferred and largely model dependent. Dust attenuation (or obscuration) describes the extent at which the stellar radiation in a galaxy is absorbed and scattered away from and back to the line-of-sight by dust (Salim & Narayanan, 2020). In practice, a luminosity ratio between the IR to the UV (i.e. infrared excess IRX ) is often used to measure dust attenuation (Heckman et al., 1998; Meurer et al., 1999; Heinis et al., 2013; Bourne et al., 2017). The strength of dust attenuation is commonly regulated by the star formation density and the effective dust column density, and thus is tightly coupled with star formation, metallicity, and galaxy compactness (Garn & Best, 2010; Xiao et al., 2012; Battisti et al., 2016; Katsianis et al., 2017a; Zahid et al., 2017; Shapley et al., 2022).
Star formation, chemical enrichment, and structural growth are three key factors governing galaxy evolution. Star formation in SFGs is driven by the gas content and the pre-existing stars, following the Kennicutt-Schmidt Law (–) (Kennicutt, 1998) and the stellar mass–star formation rate (–SFR) relation (Matthee & Schaye, 2019; Katsianis et al., 2020; Thorne et al., 2021; Leja et al., 2022; Kouroumpatzakis et al., 2023). The abundance of metals in the ISM is correlated with stellar mass and forms the stellar mass–metallicity (–) relation (Blanc et al., 2019; Bellstedt et al., 2021; Lewis et al., 2023). The size (i.e. half-light radius in the rest-frame optical band) of disc-dominated SFGs increases with increasing stellar mass, giving the stellar mass–size (–) relation (Ichikawa et al., 2012; Nedkova et al., 2021; Yang et al., 2021). These scaling relations are well established out to and demonstrate rapid evolution over this redshift range.
Dust attenuation IRX is found to increase with stellar mass for SFGs with , however, little change is observed in this relation at (Whitaker et al., 2014; Heinis et al., 2014; Bouwens et al., 2016; McLure et al., 2018; Shapley et al., 2022). From the evolving –SFR, –, and – relations, combined with the Kennicutt-Schmidt Law and a constant metal-to-dust ratio, one can infer a significant increase in dust mass surface density () with increasing redshift (Shibuya et al., 2015; Wuyts et al., 2016), and thus a higher IRX for high- SFGs at a fixed stellar mass, which contradicts observations (see Wuyts et al. 2011, Genzel et al. 2013 and Qin et al. 2019 for more details).
Interestingly, Qin et al. (2019) discovered that the observed IRX is determined by , IR luminosity (), and galaxy inclination () in a form of joint power-law function as , with these power-law indices all a function of gas-phase metallicity, giving a universal relation for SFGs up to . This universal IRX relation unifies the existing correlations between dust attenuation and other galaxy parameters, and describes the relative contributions by metallicity, star formation (), galaxy compactness (), and galaxy inclination. Most importantly, the gas-phase metallicity was found to play a central role in regulating the IRX through a manner that was totally unexpected before. As gas-phase metallicity decreases, all power-law indices decrease, and IRX declines in a way totally different from the estimate based on the Kennicutt-Schmidt Law and a constant metal-to-dust ratio (Wuyts et al., 2011; Genzel et al., 2013; Qin et al., 2019). This discovery demonstrates that for the SFGs with showing “no evolution on IRX” over is no longer puzzling. The universal IRX relation reflects that star formation, ISM metallicity, and galaxy structure jointly determine dust attenuation in SFGs, making it a fundamental relationship to test theoretical models.
We use the state-of-the-art Evolution and Assembly of GaLaxies and their Environments (EAGLE) simulations to investigate the theoretically predicted IRX in relation with other galaxy parameters, and see if the observed universal IRX relation can be recovered from the EAGLE simulations. The cosmological hydrodynamical EAGLE simulations are a valuable tool for understanding the physical mechanisms and determinants of dust attenuation while the universal IRX relation is closely linked with the baryon cycles occurring in galaxies. Thus, the comparison between the two can in turn highlight successes of the simulations and identify areas for further improvement.
This paper is organized as follows. We introduce the EAGLE simulations, sample selection, and galaxy parameter estimation in Section 2. In Section 3, the predicted universal IRX relation is presented, and we compare it with the observations, and focus on the galaxy parameters that should be improved in future efforts of state-of-the-art simulations in order to describe better the observations. We discuss our results in Section 4 and give a summary in Section 5.
| Name | Number of galaxies with > | ||||||||
|---|---|---|---|---|---|---|---|---|---|
| (cMpc) | () | () | (ckpc) | (pkpc) | All | With some dust | With resolved dust | ||
| Ref-L0100N1504 | 100 | 2.66 | 0.70 | 371,728 | 334,717 (90.0%) | 236,346 (63.6%) | |||
2 SIMULATION and DATA
2.1 The EAGLE Simulations
The EAGLE project (Crain et al., 2015; Schaye et al., 2015) was a suite of cosmological, hydrodynamical simulations of galaxy formation within the cubic volumes ranging from 25 to 100 co-moving Mpc (cMpc). As one of the state-of-the-art cosmological, hydrodynamical simulations in the framework of the standard cold dark matter cosmology, the EAGLE simulations modeled the evolution of baryonic matter and cold dark matter from redshift to the present day in a self-consistent manner. The EAGLE simulations made use of an improved version of the N-Body Tree-PM smoothed particle hydrodynamics (SPH) code GADGET-3 (the readers are referred to Springel 2005 for more details), which included a modified hydrodynamics solver, time-step limiters (Durier & Dalla Vecchia, 2012), and sub-grid treatments of baryonic physics. A Chabrier stellar initial mass function (IMF) (Chabrier, 2003) was adopted. The EAGLE simulations utilized sub-grid models for computing radiative cooling, star formation, stellar mass loss (Wiersma et al., 2009), metal enrichment, stellar and active galactic nuclei (AGN) feedback, gas accretion onto supermassive black hole (SMBH), and SMBH mergers.
The EAGLE simulations were calibrated to the redshift galaxy stellar mass function, galaxy stellar mass–size relation, and stellar mass–SMBH mass relation. A large number of studies based on the EAGLE simulations investigated the extent to which they reproduce those different observed variables that are not used for their calibrations (e.g. Furlong et al., 2015; Camps et al., 2016; Furlong et al., 2017; Katsianis et al., 2017b; Lovell et al., 2022; Ward et al., 2022; Das et al., 2023; Keller et al., 2023; Petit et al., 2023). The SUBFIND algorithm (Springel et al., 2001; Dolag et al., 2009) was employed to identify gravitationally-bound sub-haloes as individual galaxies, and the sum of the mass of all star particles that belong to a sub-halo was determined the galaxy stellar mass. The EAGLE collaboration provided a comprehensive dataset for galaxies, spanning 29 redshifts over (McAlpine et al., 2016). Additionally, star formation was set to follow the pressure-dependent Kennicutt-Schmidt relation (Schaye & Dalla Vecchia, 2008), with a metallicity-dependent density threshold adopted to track the transition of warm and atomic gas into unresolved, cold, molecular gas (Schaye, 2004). Furthermore, the EAGLE simulations tracked individually the abundance of 11 elements (H, He, C, N, O, Ne, Mg, Si, S, Ca and Fe; De Rossi et al. 2017).
Dust attenuation and dust emission for sufficiently resolved galaxies with stellar mass were calculated by Camps et al. (2018) using the three-dimensional dust radiative transfer code SKIRT (Baes et al., 2011; Camps & Baes, 2015), in which the Zubko et al. (2004) dust model was adopted to represent the diffuse dust, and a similar dust model was used for the star-forming regions following the MAPPINGS-III templates (Groves et al., 2008). The dust grains in these models include a mixture of non-composite graphite and silicate grains, and neutral and ionized polycyclic aromatic hydrocarbon (PAH) molecules. A fixed dust-to-metal ratio of 0.3 was used regardless of galaxy type or redshift (Camps et al., 2018). Stochastic heating of dust grains was taken into account in SKIRT to obtain realistic 50-band fluxes across the UV to submillimetre spectral range (Trayford et al., 2017; Baes et al., 2019; Katsianis et al., 2019; de Graaff et al., 2022; Trčka et al., 2020; Evans et al., 2022; Cochrane et al., 2023). We refer the readers to Camps et al. (2016), Trayford et al. (2017), and Camps et al. (2018) for more details.
2.2 Sample Selection
We make use of the publicly available data of the EAGLE reference model Ref-L0100N1504.111http://www.eaglesim.org/database.php Note that adoption of the EAGLE high-resolution model Recal-L025N0752 with a smaller sample of galaxies will give quantitatively consistent results. Table 1 summarises the key parameters of the Ref-L0100N1504 model for 371,728 galaxies with stellar mass above M⊙. This stellar mass cutoff matches the set of galaxies for which the public EAGLE database includes optical magnitudes without dust attenuation. The fluxes from SKIRT are meaningful only if the input distributions for both the stellar sources and the dust content are spatially resolved to an acceptable level. The model used a number of smoothed (sub)particles () to count dust content, and we adopt to recognize sample galaxies with resolved dust density distribution (see Camps et al. 2018 for more details). We follow the description in McAlpine et al. (2016) for the use of the EAGLE dataset to select our sample galaxies with parameters of their intrinsic properties, and adopt dust-attenuated fluxes and dust emission fluxes from Camps et al. (2018). We select galaxies from six snapshots, corresponding redshifts = 0.1, 0.5, 1.0, 1.5, 2.0 and 2.5, respectively. The galaxy parameters, including stellar mass, star formation rate, half-mass radius (), absolute abundances of hydrogen and oxygen of star-forming gas, and broadband fluxes, are all derived from a spherical aperture of 30 proper kpc (pkpc). The UV/optical-band fluxes are included for galaxies viewed at face-on, edge-on and random angles (Camps et al., 2018). We choose the fluxes for galaxies at the random viewing angles, corresponding to the random orientation of galaxies in observations.
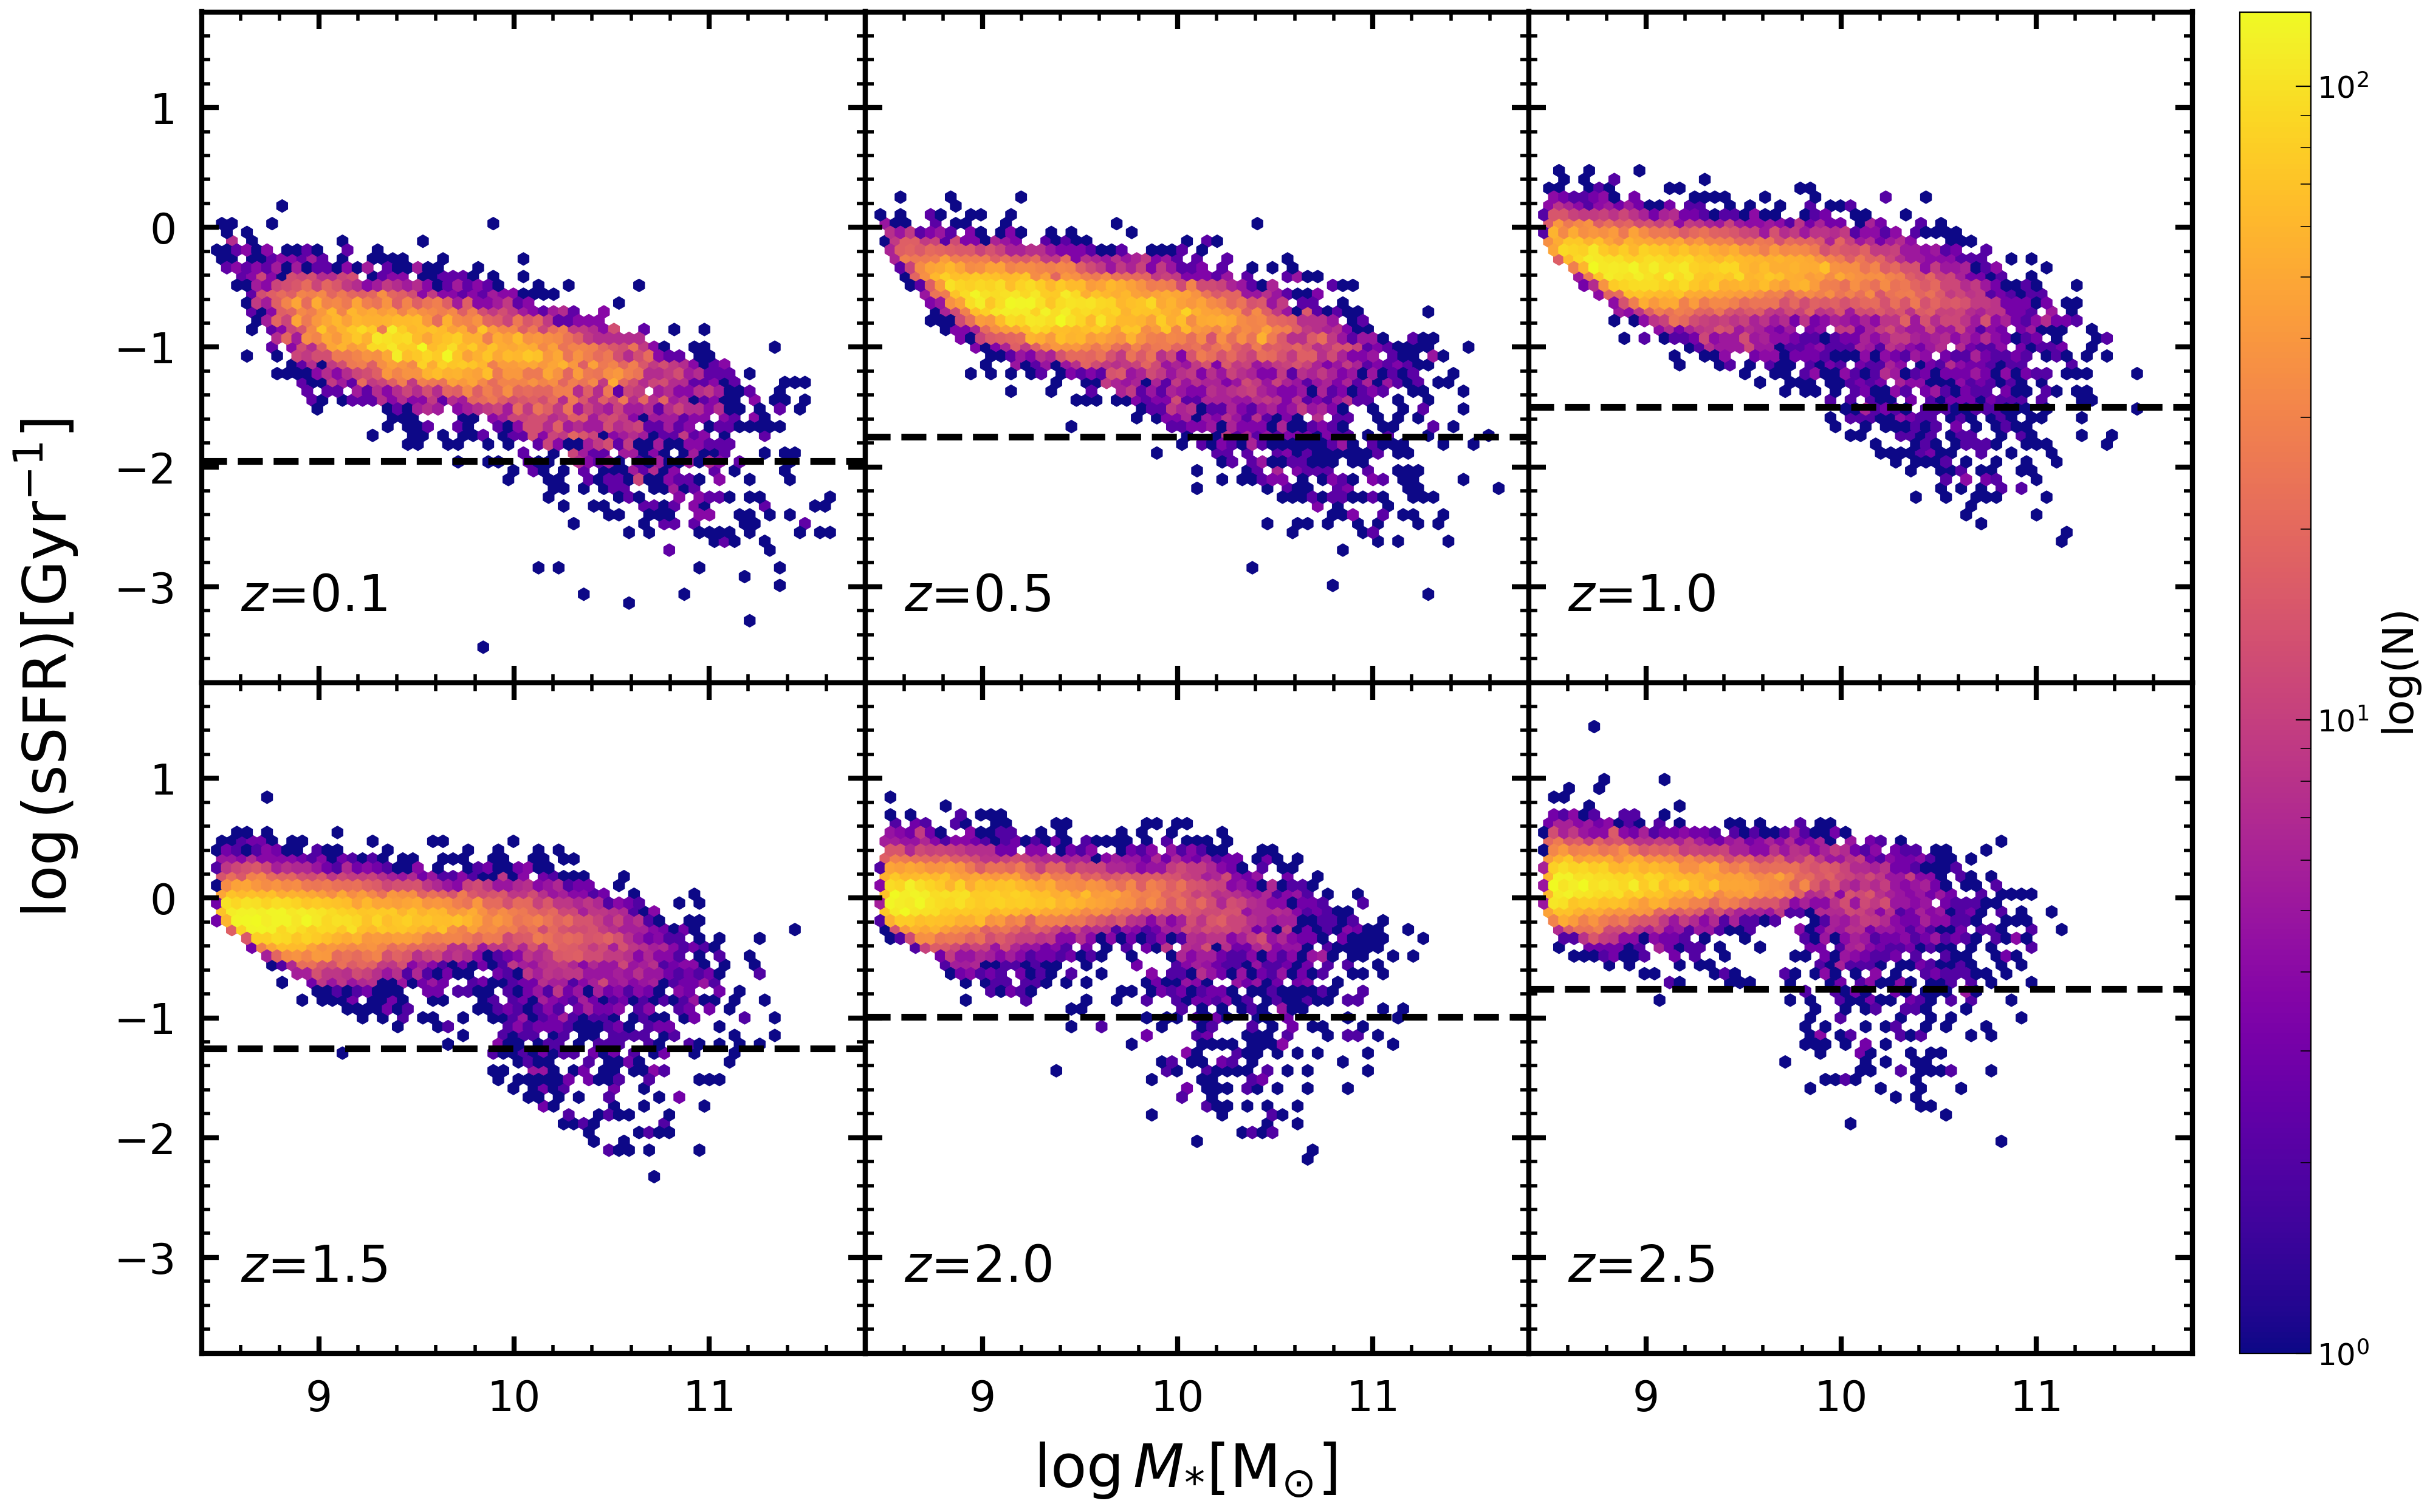
We separate the SFGs from quiescent galaxies (QGs) in the six snapshots of the Ref-L0100N1504 model, using a redshift dependent specific star formation rate ( SFR/) cut, described as () = 0.5 2 with following Furlong et al. (2017). We extrapolate the cut to to fit the redshift range for our sample. Note that at a subsample of low-mass EAGLE SFGs ( M⊙) exhibit compact ( kpc), metal-rich () and dusty (IRX ) characteristics. These populations resemble spurious galaxies (McAlpine et al., 2016), and we remove them from our sample. Fig. 1 shows the sSFR relation in six redshifts, 0.1, 0.5, 1.0, 1.5, 2.0 and 2.5. We note that the simulated galaxies from the EAGLE Ref-L0100N1504 model are mostly SFGs, and the bimodality is not so prominent in the sSFR compared to the observations (Furlong et al., 2015; Trčka et al., 2020). This limitation is prevalent for various models including TNG (Katsianis et al., 2021a). However, this limitation does not affect the results of our work, which focuses on SFGs. As expected at increasing redshift, the number of massive SFGs ( > ) decreases, while the average sSFR gradually increases. In contrast, the low-mass galaxies ( < ) are numerous at all redshifts. Observationally, these low-mass galaxies are hardly detected at higher redshift and thus less explored.
2.3 Galaxy Parameters
2.3.1 Gas-Phase Metallicity
We obtain oxygen abundance from the masses of oxygen and hydrogen in the star-forming gas as the gas-phase metallicity for our EAGLE SFGs. The oxygen abundance is therefore the absolute abundance which does not depend on the solar abundance (Camps et al., 2018).
2.3.2 Half-Light Radius
We focus on the parameters employed to construct the universal IRX relation from Qin et al. (2019). The half-mass radius from the simulation catalogue can be converted into half-light radius which is widely used in observations. Suess et al. (2019b) studied the half-mass-to-half-light ratio () for 16,500 galaxies at in the CANDELS fields, and found that for a fixed stellar mass, the remained roughly constant at , but evolved rapidly between and . We read the versus relations of SFGs in five redshift bins from their Fig. 1, and interpolate them to obtain at six redshifts , yielding and . These relations are used to convert into for our EAGLE SFGs. Note that we extrapolate the – relation into the low-mass regime of M⊙, and the ratio is set to be saturated to unity for all redshifts (Suess et al., 2019a, b; Miller et al., 2023). de Graaff et al. (2022) constructed mock images of Ref-L0100N1504 EAGLE galaxies with SKIRT by accounting for the effects of stellar population gradients and dust, as well as instrumental effects and projection effects, and measured the half-light radius in the same way as in observational studies. The same tendency between the half-mass radius and half-light radius was found for SFGs as the increasing half-mass-to-half-light ratio at decreasing stellar mass shown in Suess et al. (2019b), which is adopted in our work for half-light radius. We make comparison between our work and de Graaff et al. (2022) in Fig. 9, and find that the two are consistent with each other.
2.3.3 UV Luminosity, IR Luminosity and IR Excess
To measure the luminosity, we use the Code Investigating GALaxy Emission222https://cigale.lam.fr/ (CIGALE, Boquien et al., 2019) to fit the broadband SEDs of our EAGLE SFGs, covering FUV, NUV, , , , and . We use stellar spectral templates from the BC03 stellar population synthesis model (Bruzual & Charlot, 2003) with the Chabrier initial mass function (Chabrier, 2003) and solar metallicity. A delayed star formation history additional with a recent starburst is adopted. The stellar age varies from 1 to 13 Gyr, and the e-folding time varies from 5 to 8 Gyr. An additional recent decline starburst is adopted. The burst age and e-folding time are in the range of 20500 Myr and 5100 Myr respectively. For the dust attenuation, we adopt a fixed Calzetti attenuation curve (Calzetti et al., 2000) with E(BV) varies from 0.0 to 0.3 mag. For each galaxy, the UV luminosity (rest-frame 12163000 Å) is calculated from the integration of the best-fitting galaxy SED.
We measure the IR luminosity via best-fitting the simulated IR data points with the IR SED templates from the dust radiation model by Draine & Li (2007). The dust radiation model covers parameter space from 0.47 to 4.58 for the PAH fraction, the minimum radiation field , the maximum radiation field , and the fraction illuminated from to is [0, 1]. If the IR bands which fall below 3 do have valid flux and error measurements, they are also included to constrain the IR luminosity measurements. For the bands without detections, the upper limits are used in the fitting.
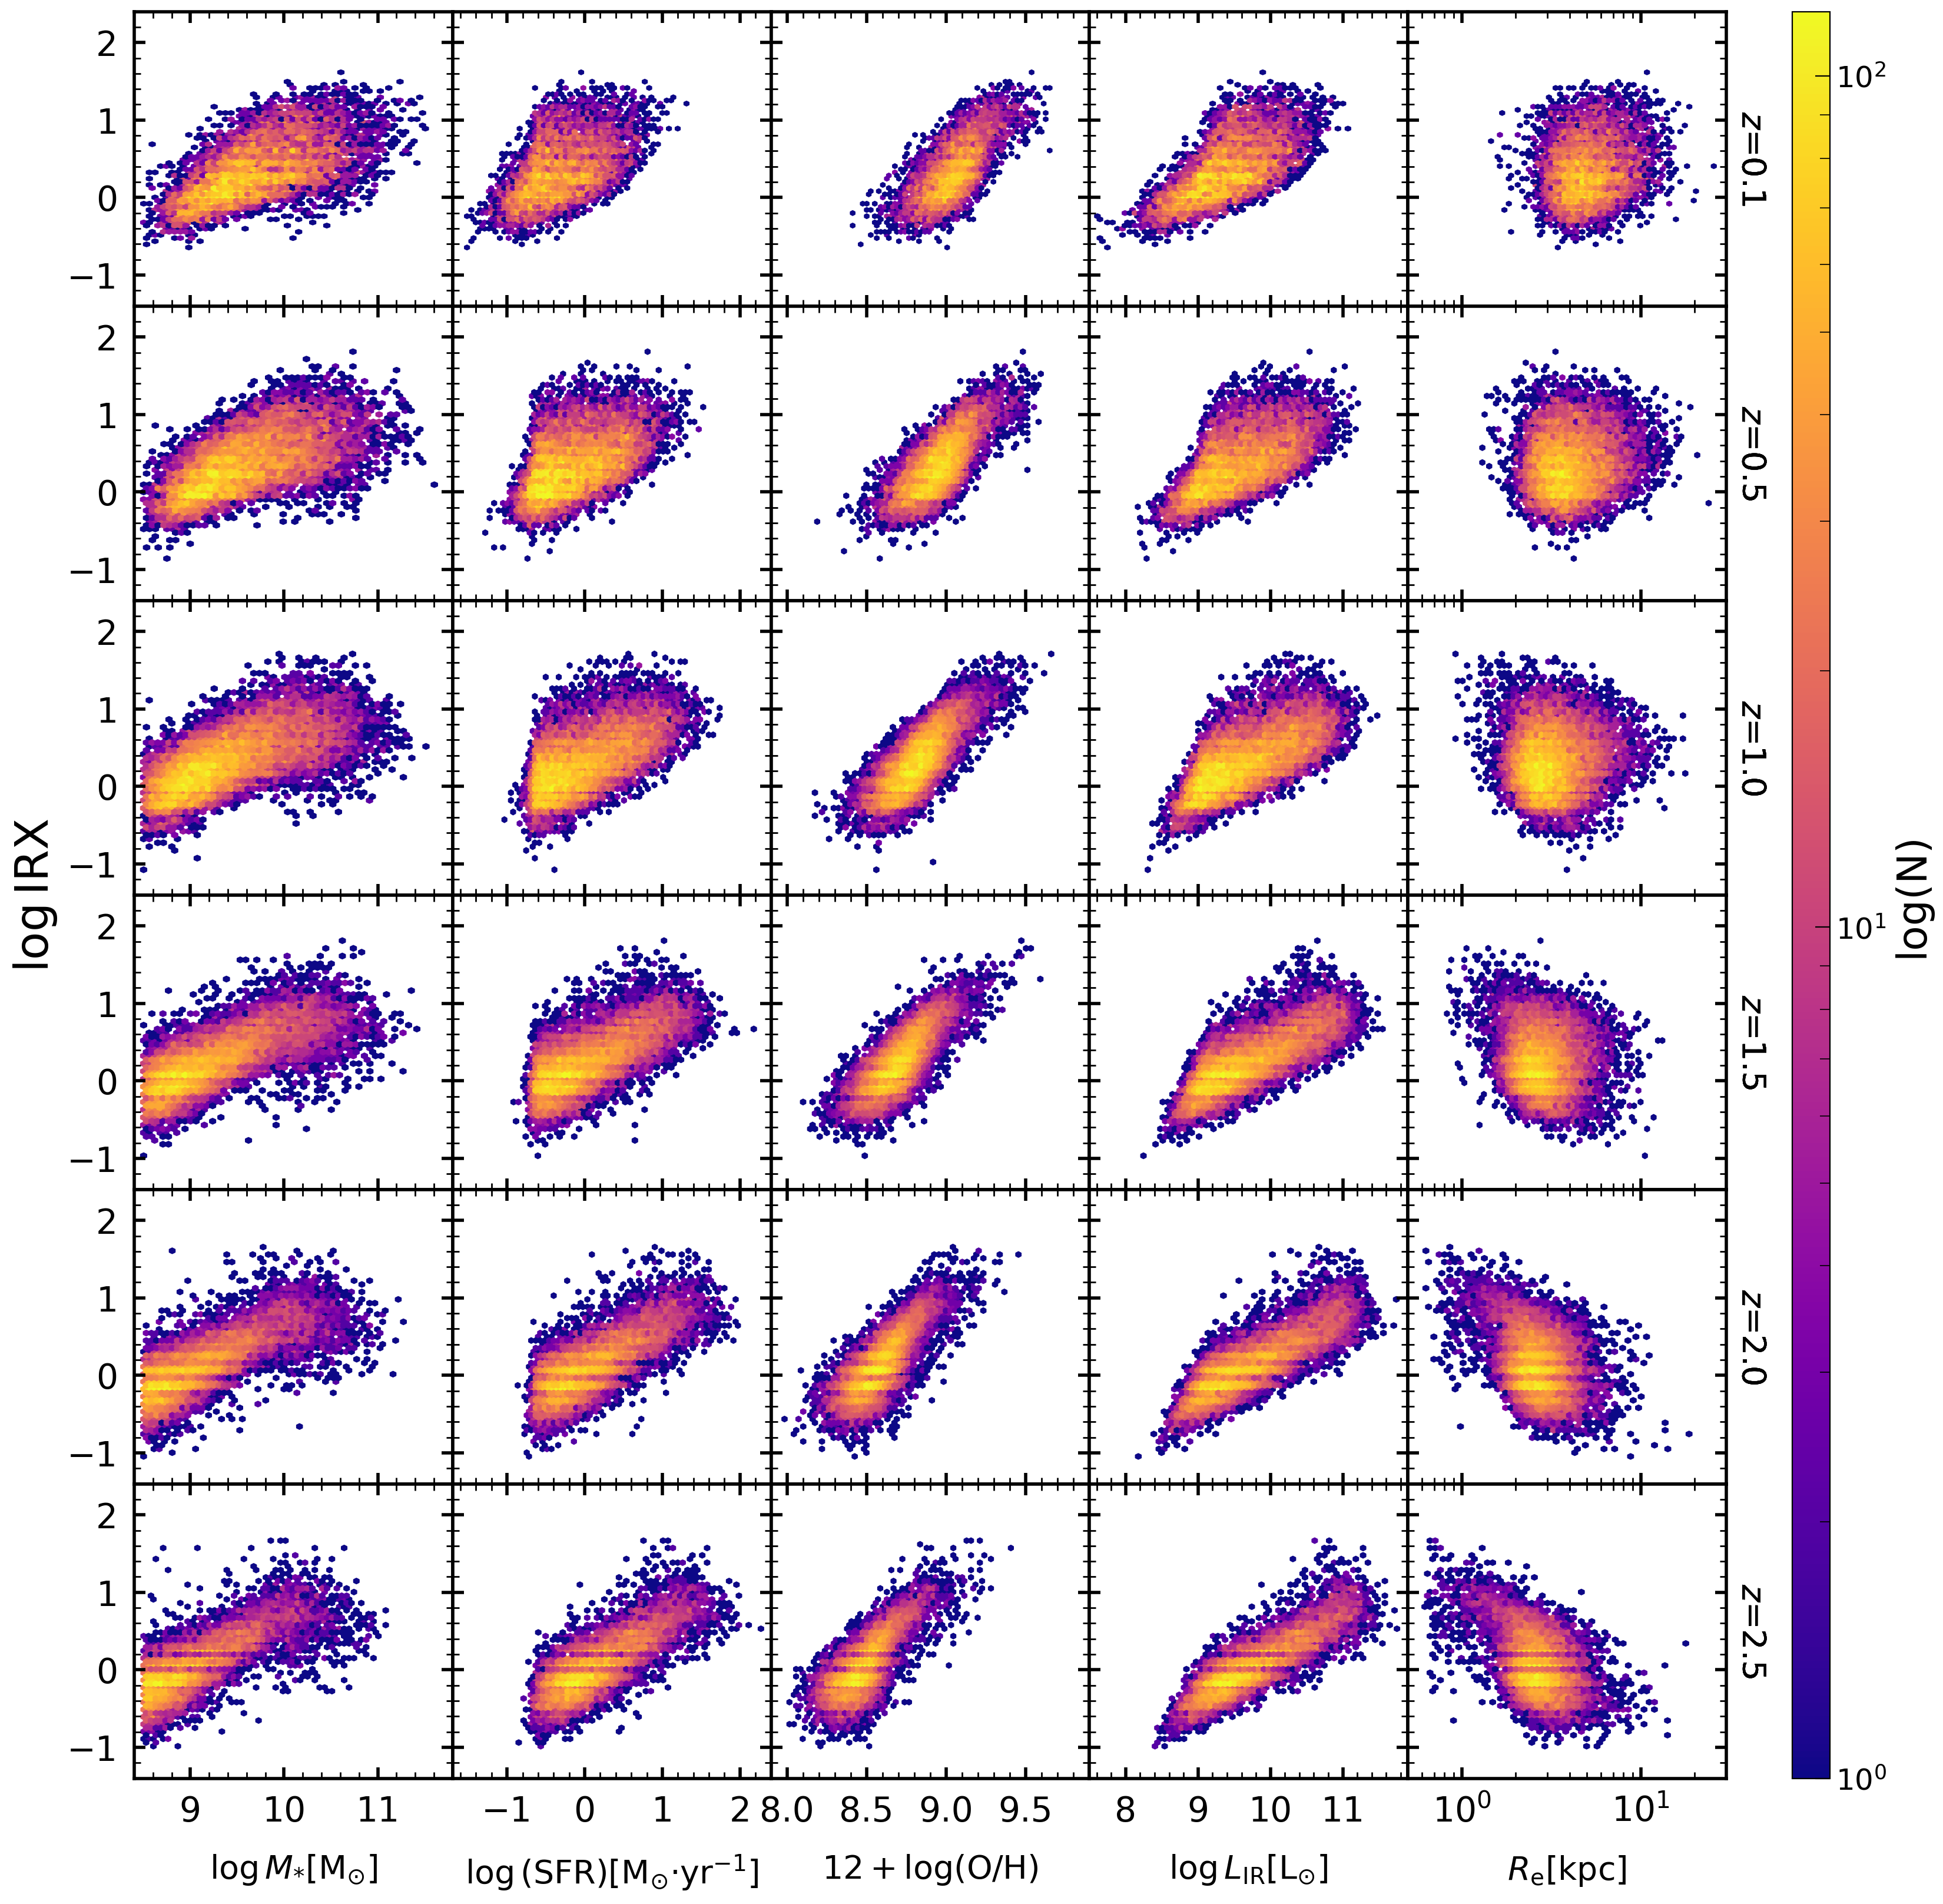
Using the and , we calculate the IRX for our EAGLE SFGs. Fig. 8 shows the relationships between the IRX and the main physical quantities, including , SFR, , and , for our sample of the EAGLE SFGs at six different redshifts over . It is clear that , SFR, and all strongly correlate positively with IRX, whereas displays a relatively negative weak correlation with IRX.
3 RESULTS
The universal IRX relation reported by Qin et al. (2019) is a joint power-law relation between , , , and IRX, following
| (1) |
The observed IRX increases with increasing and , but decreases with increasing and . The power-law indices all exponentially increase with gas-phase metallicity, denoting that the gas-phase metallicity is a key driver of galaxy dust attenuation.
3.1 Comparison between Simulations and Observations
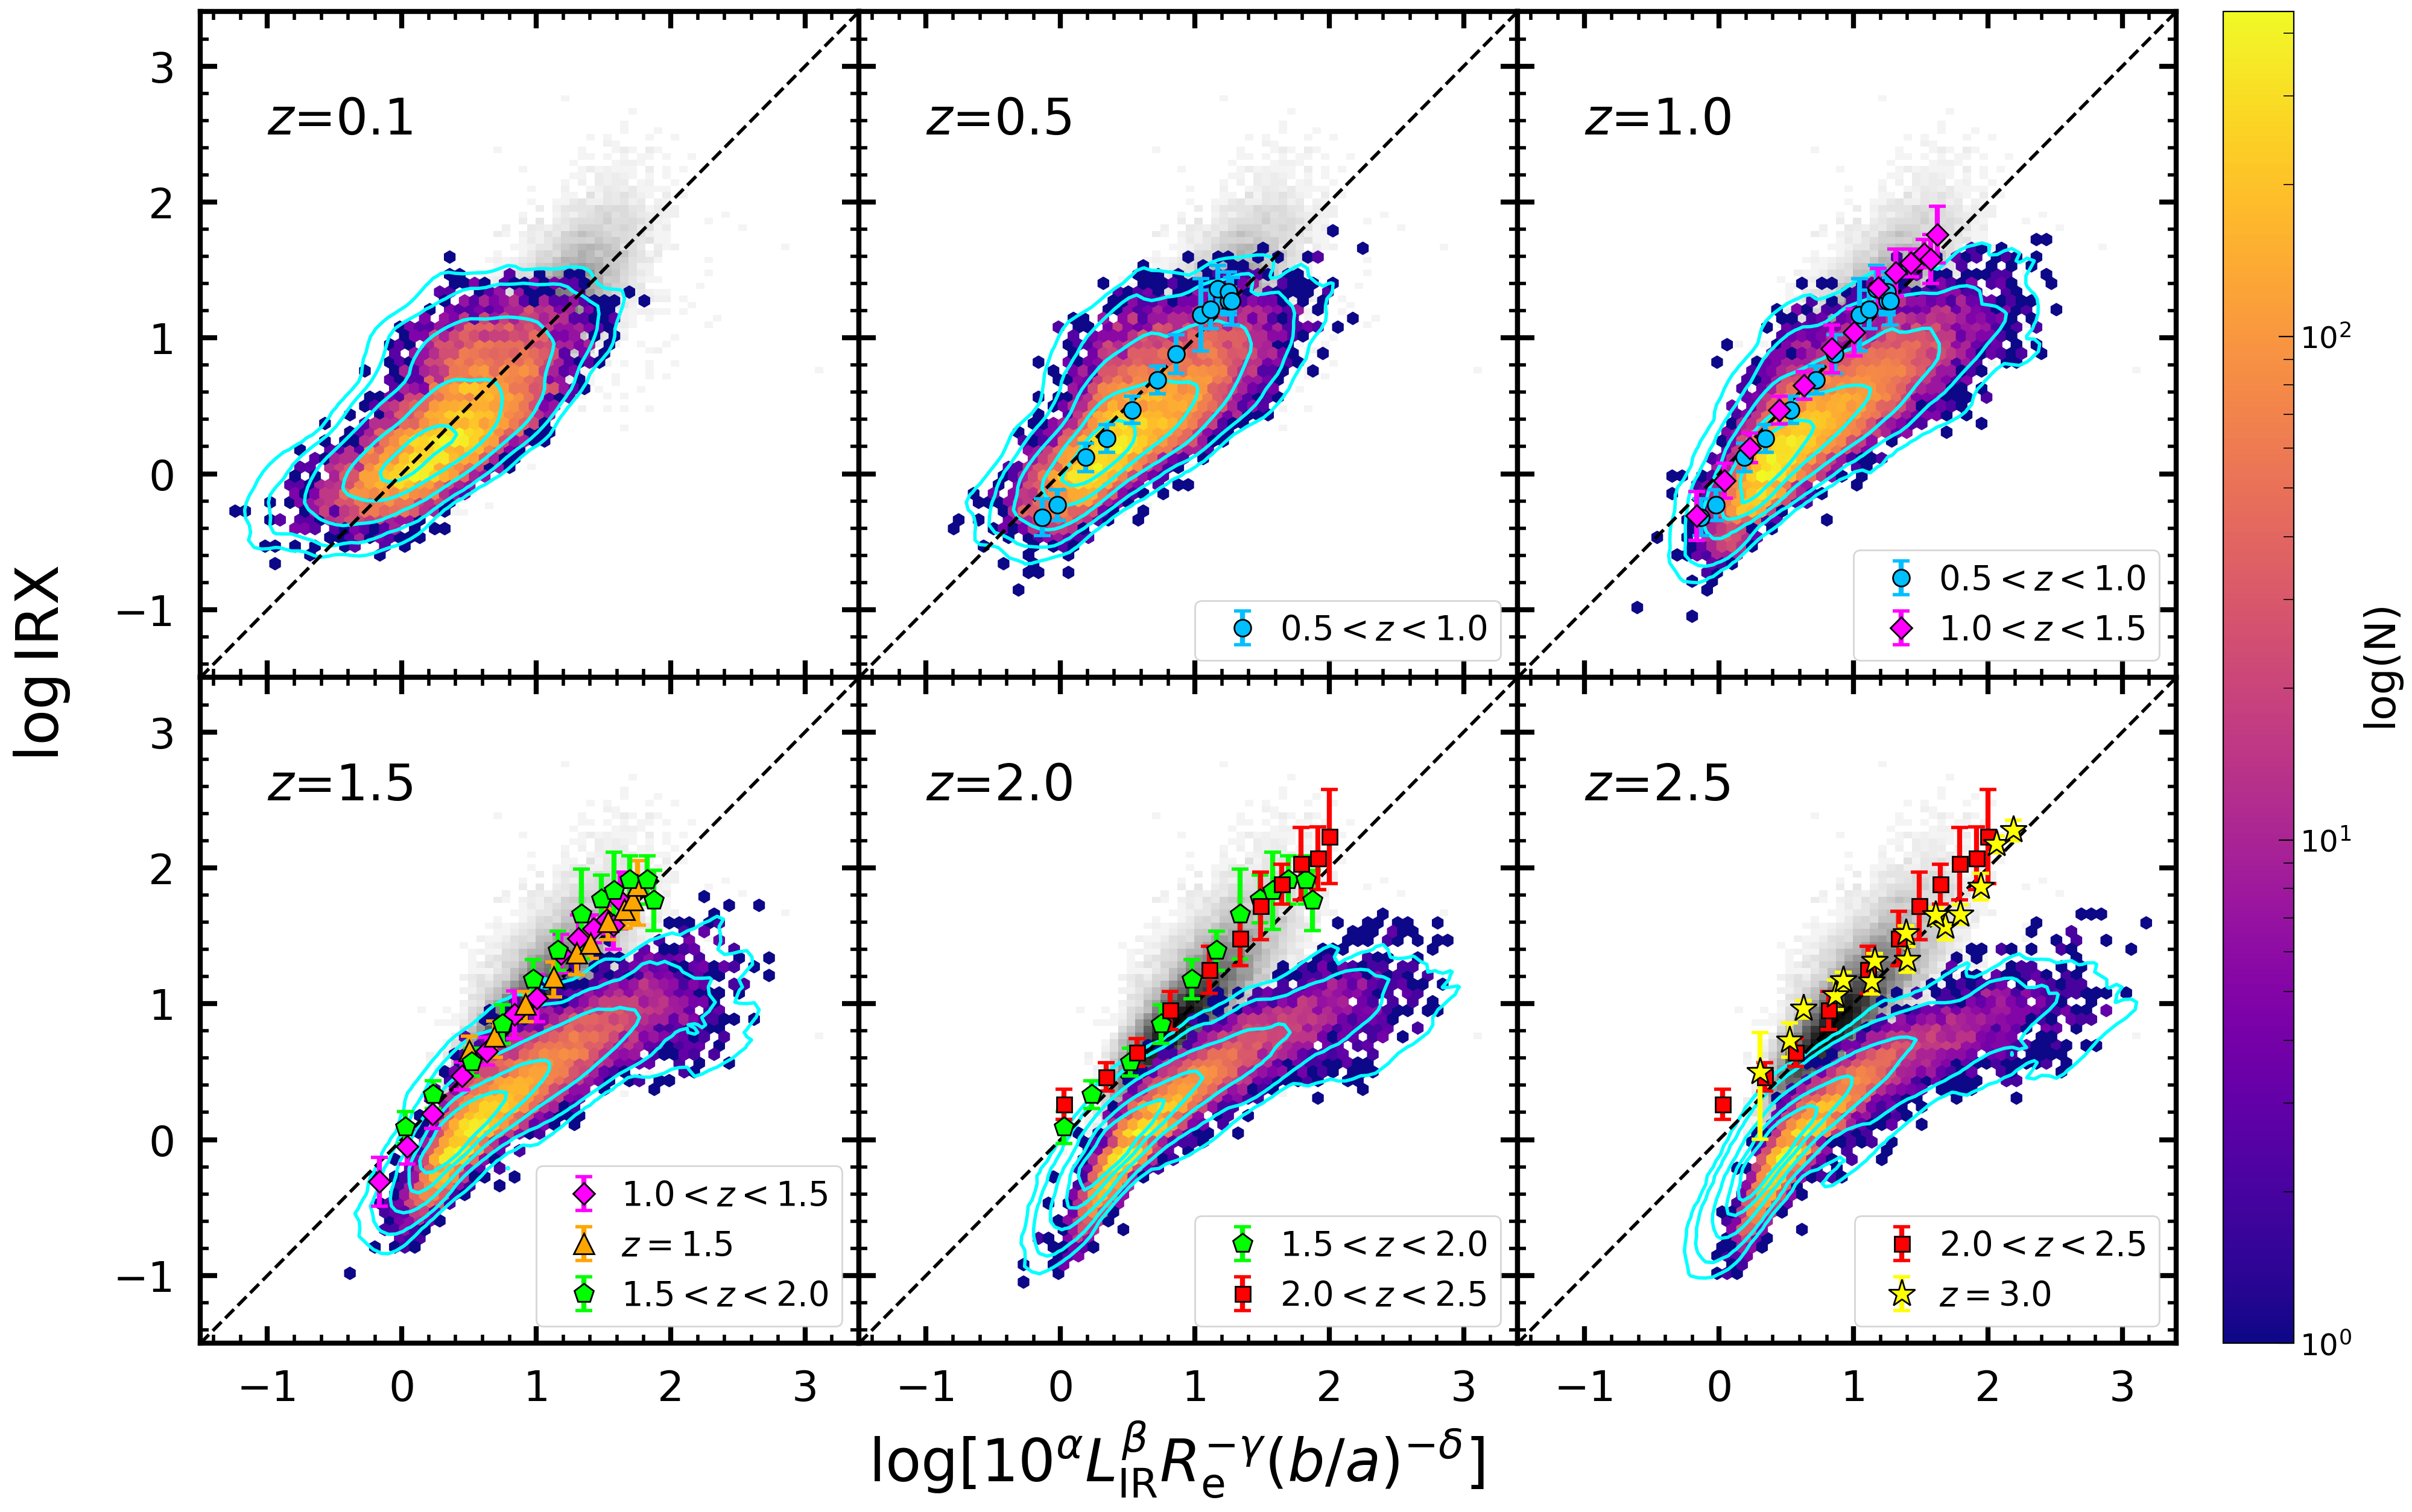
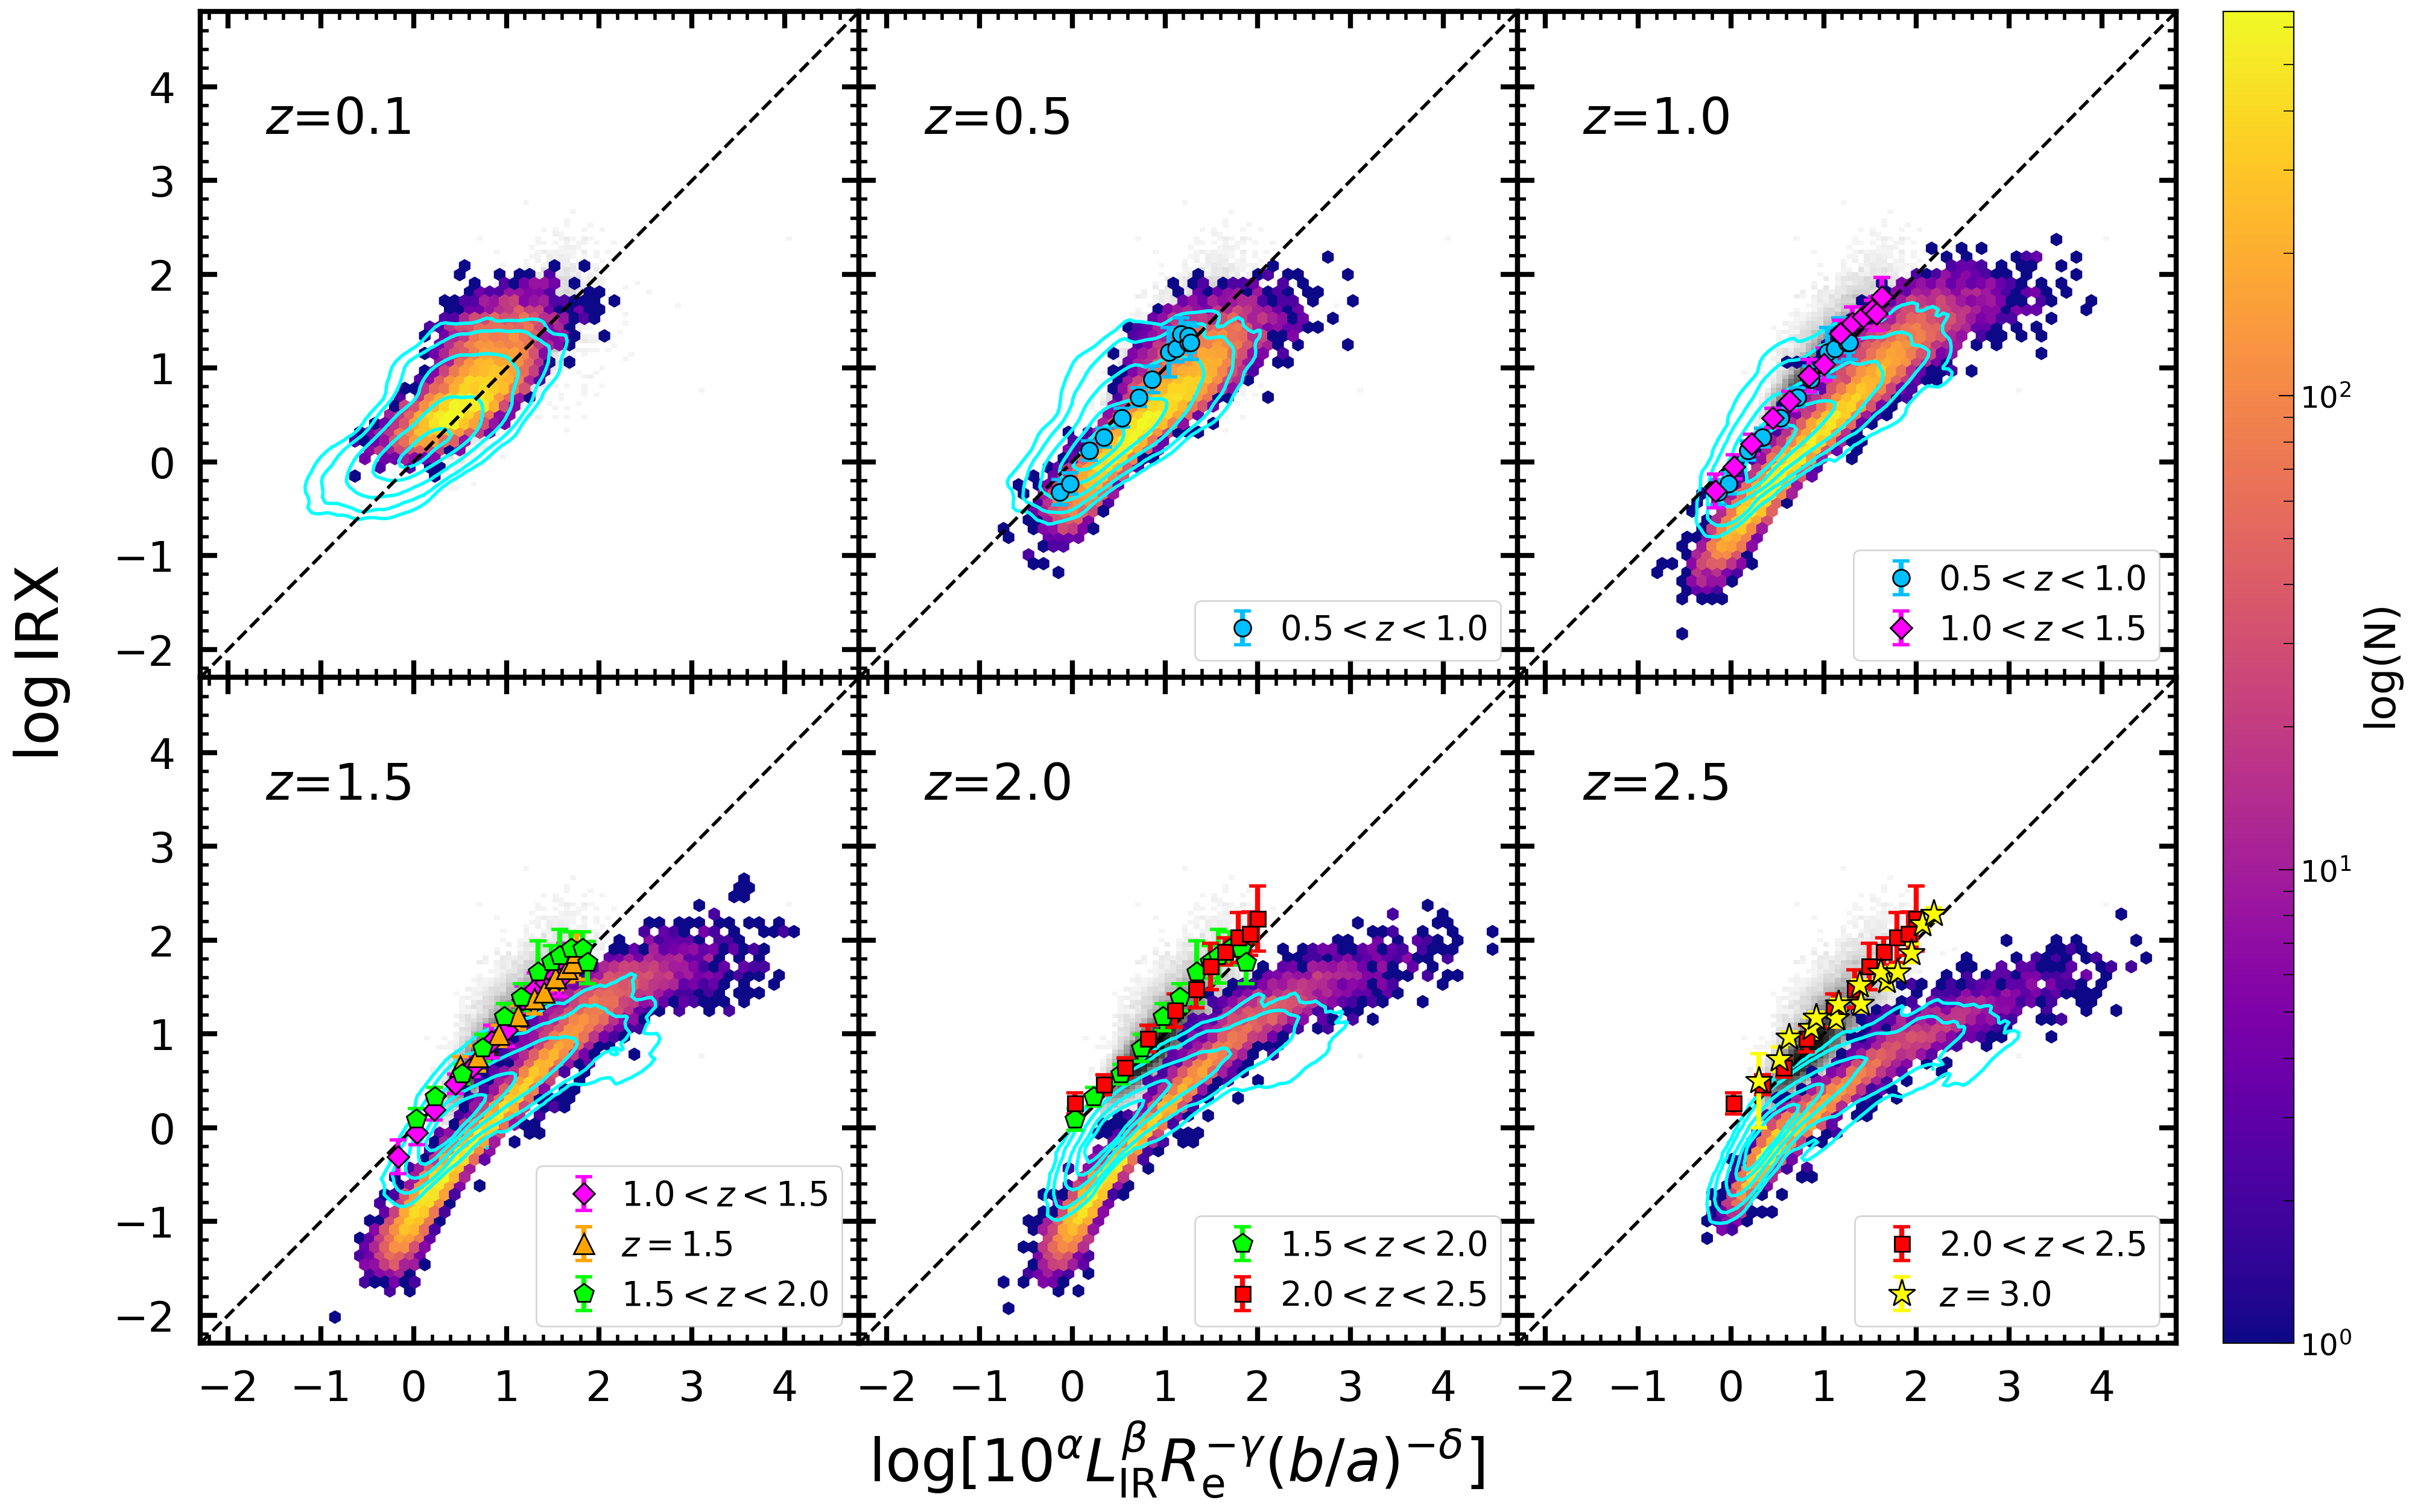
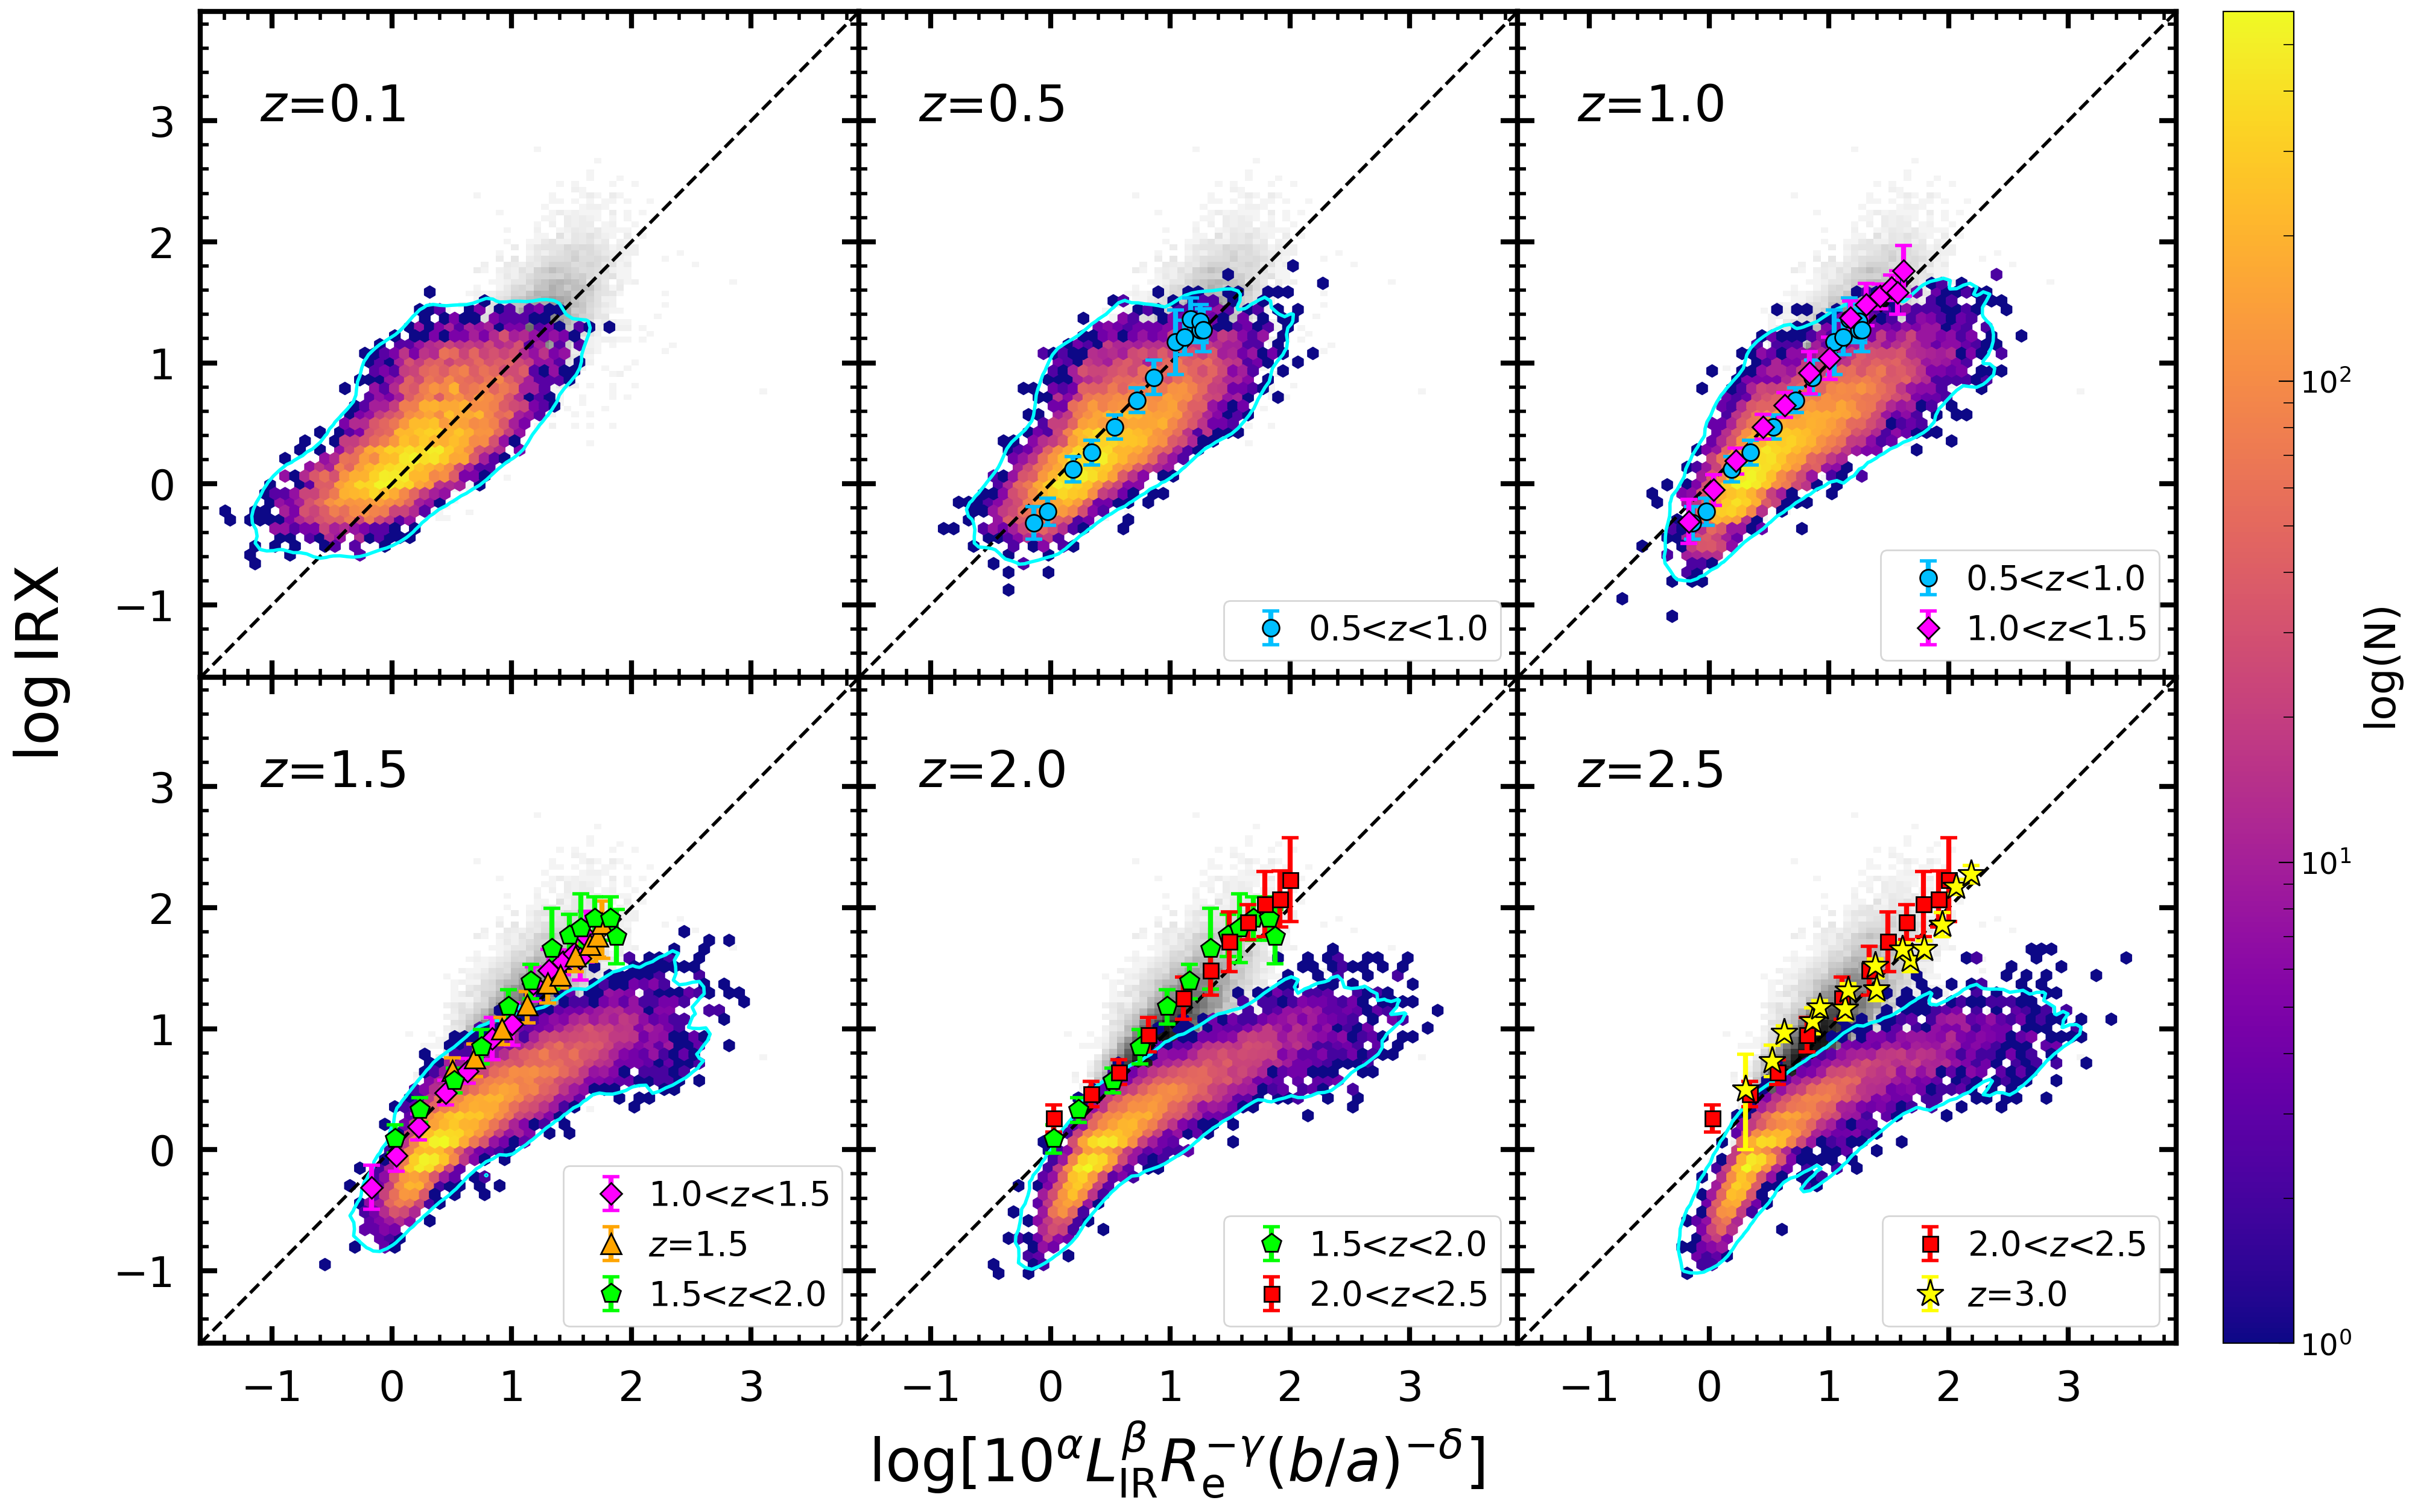
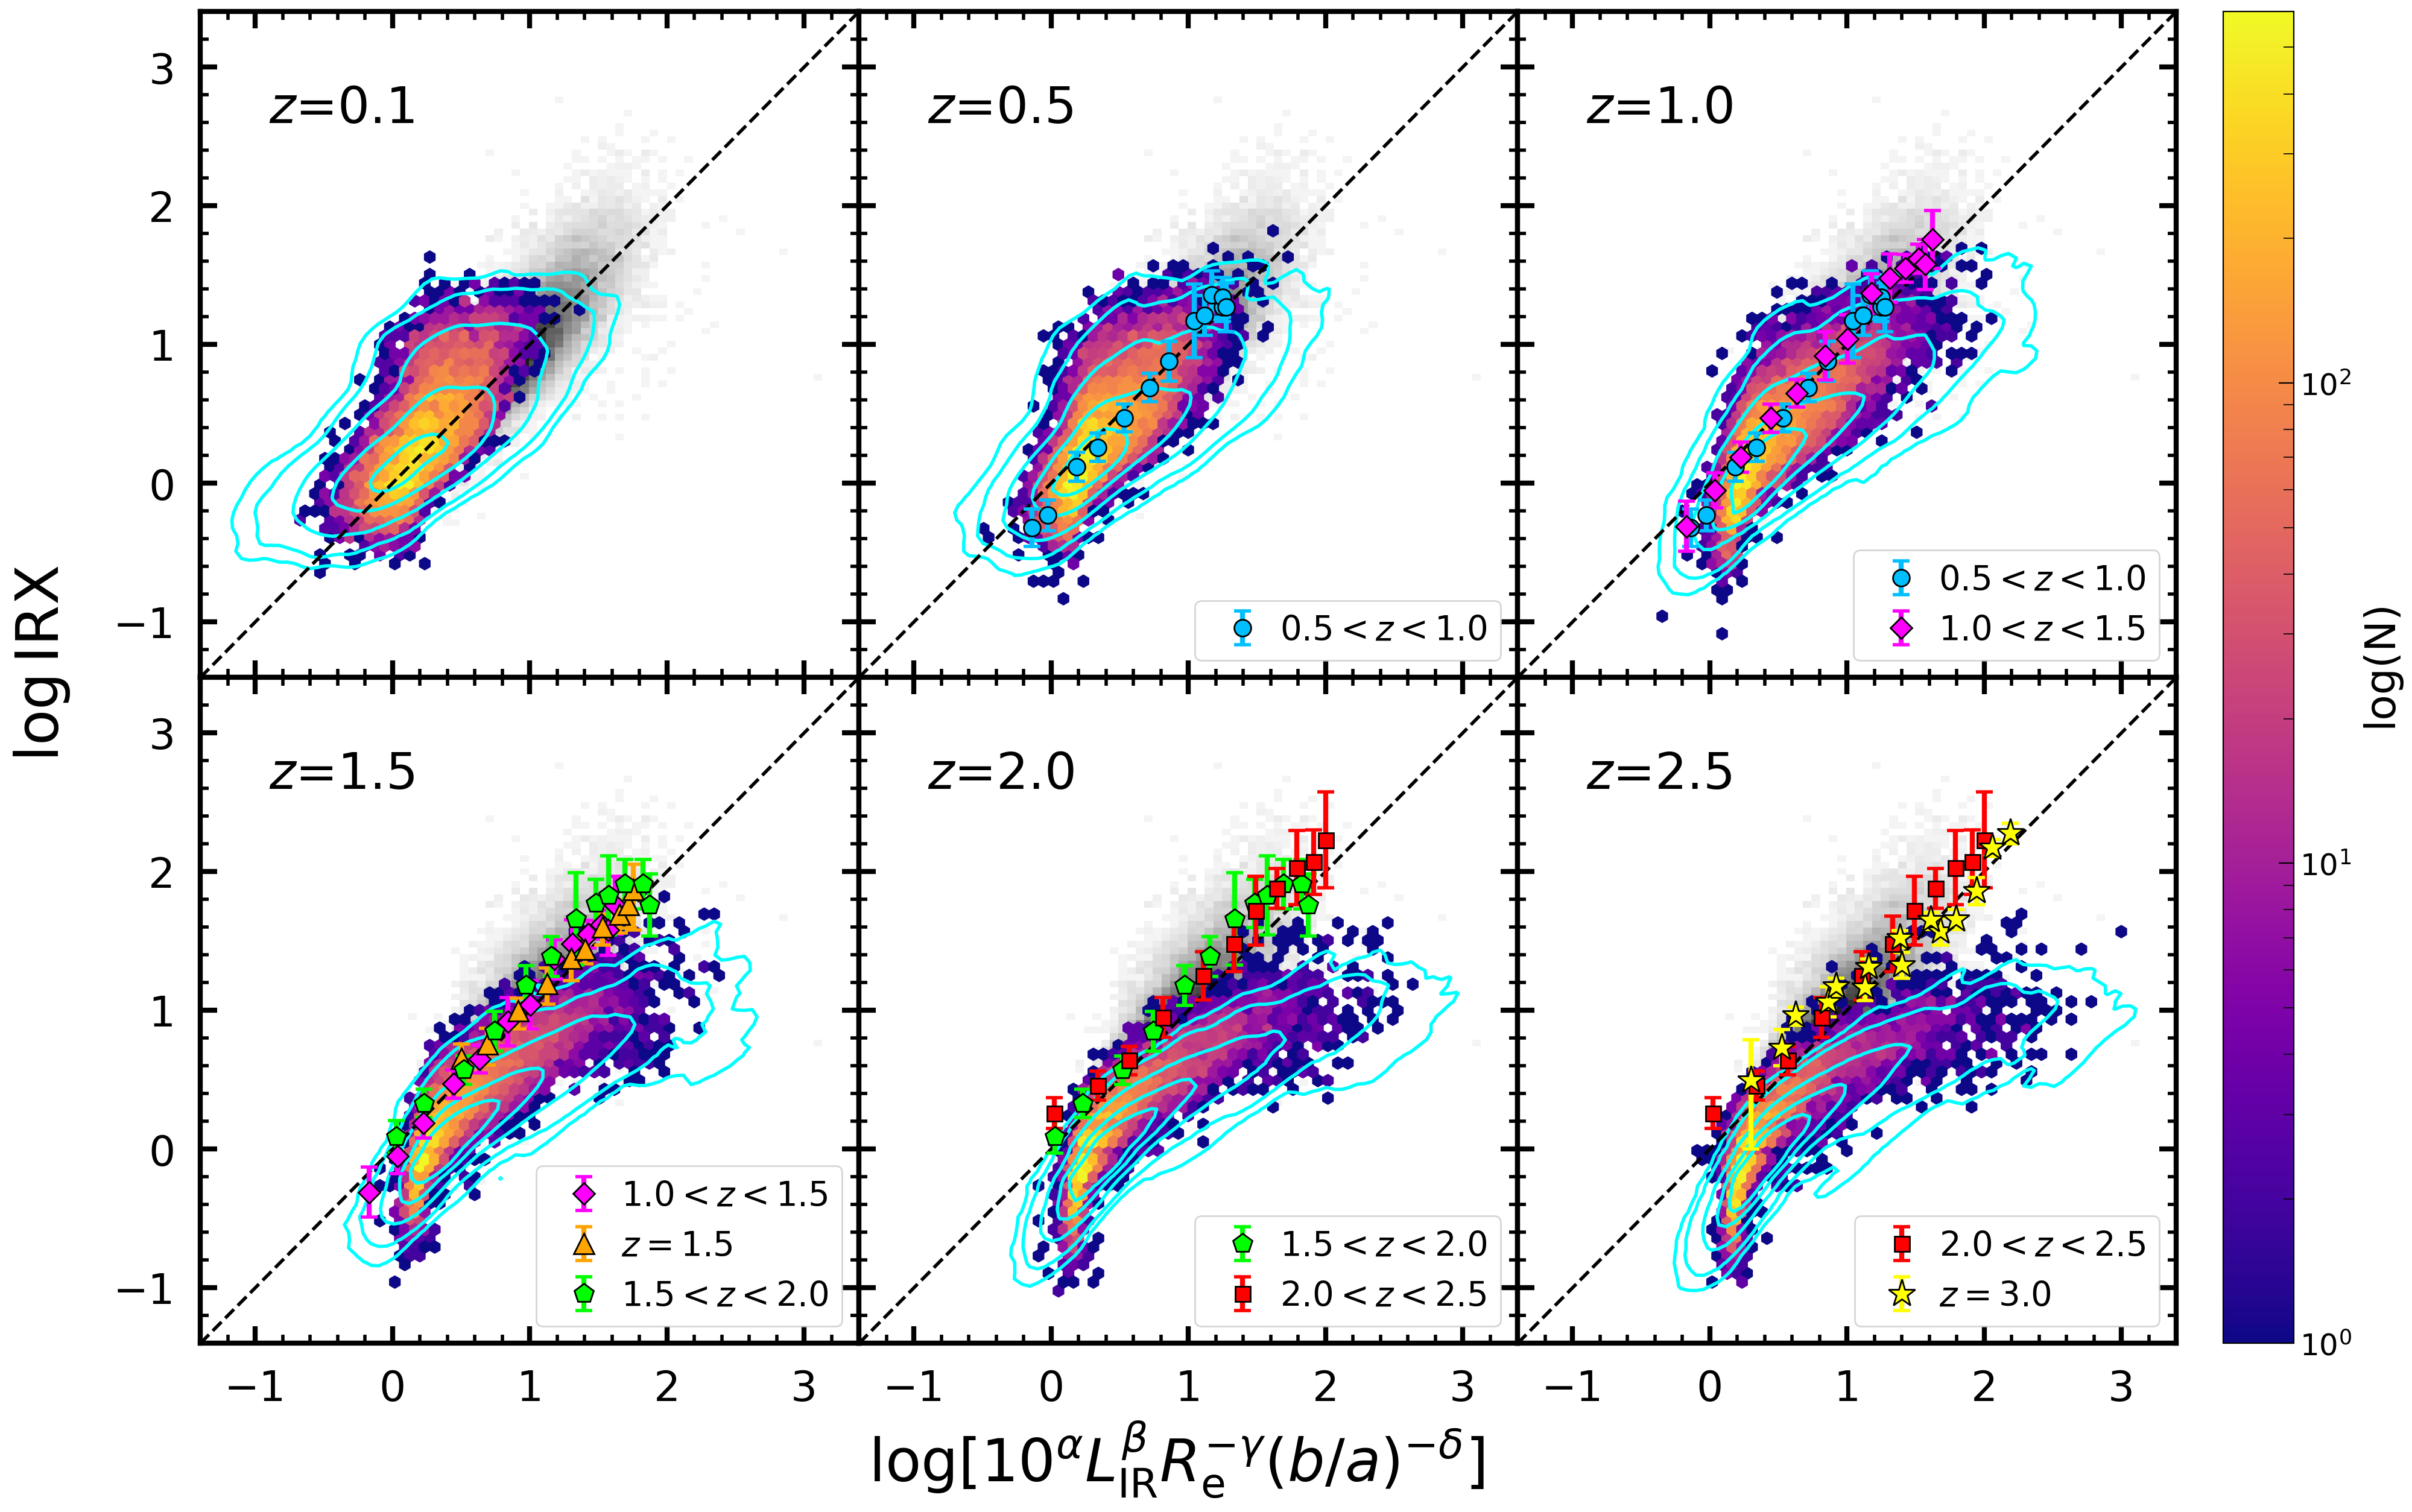
Due to the randomly distributed inclination of the EAGLE SFGs, we employ a constant value of 0.6 (Qin et al., 2019) in the following study. Using carefully calculated , , and values for our EAGLE SFGs, we derive the predicted universal IRX relation with Equation 1. Fig. 2 compares the universal IRX relation between the EAGLE simulations and the observations. In each panel, the coloured hexagonal bins represent the EAGLE SFGs in our sample, while the gray-scale image refers to the density map of local SFGs obeying the universal IRX relation from Qin et al. (2019).
At , the EAGLE SFGs follow the universal IRX relation but show a relatively larger scatter. At , the simulated SFGs in EAGLE increasingly deviate from the relation towards the right side in each panel, particularly for the high-IRX end. For instance, the Milky-Way-like galaxies with M at appear one order of magnitude lower in IRX than the inferred IRX from their parameters (, , and ). Similarly, the low-IRX SFGs in EAGLE also exhibit an increasing deviation from the universal IRX relation at increasing redshift. We point out that the deviation of our EAGLE SFGs from the observed universal IRX relation are clear at .
In the next sections we address the scaling relations of the simulated SFGs to examine what are responsible for the deviations in the predicted universal IRX relation.
3.2 Correction to Galaxy Parameters
The scaling relations from observations are used to examine physical parameters/quantities of the EAGLE SFGs, and quantify the discrepancies of the parameters/quantities at a given stellar mass. We adopt the – relation from Sanders et al. (2023), the – relation from van der Wel et al. (2014), the –SFR relation from Popesso et al. (2023), and the –IRX relation from Whitaker et al. (2014) and Qin et al. (2019) for further analysis.
3.2.1 Gas-Phase Metallicity
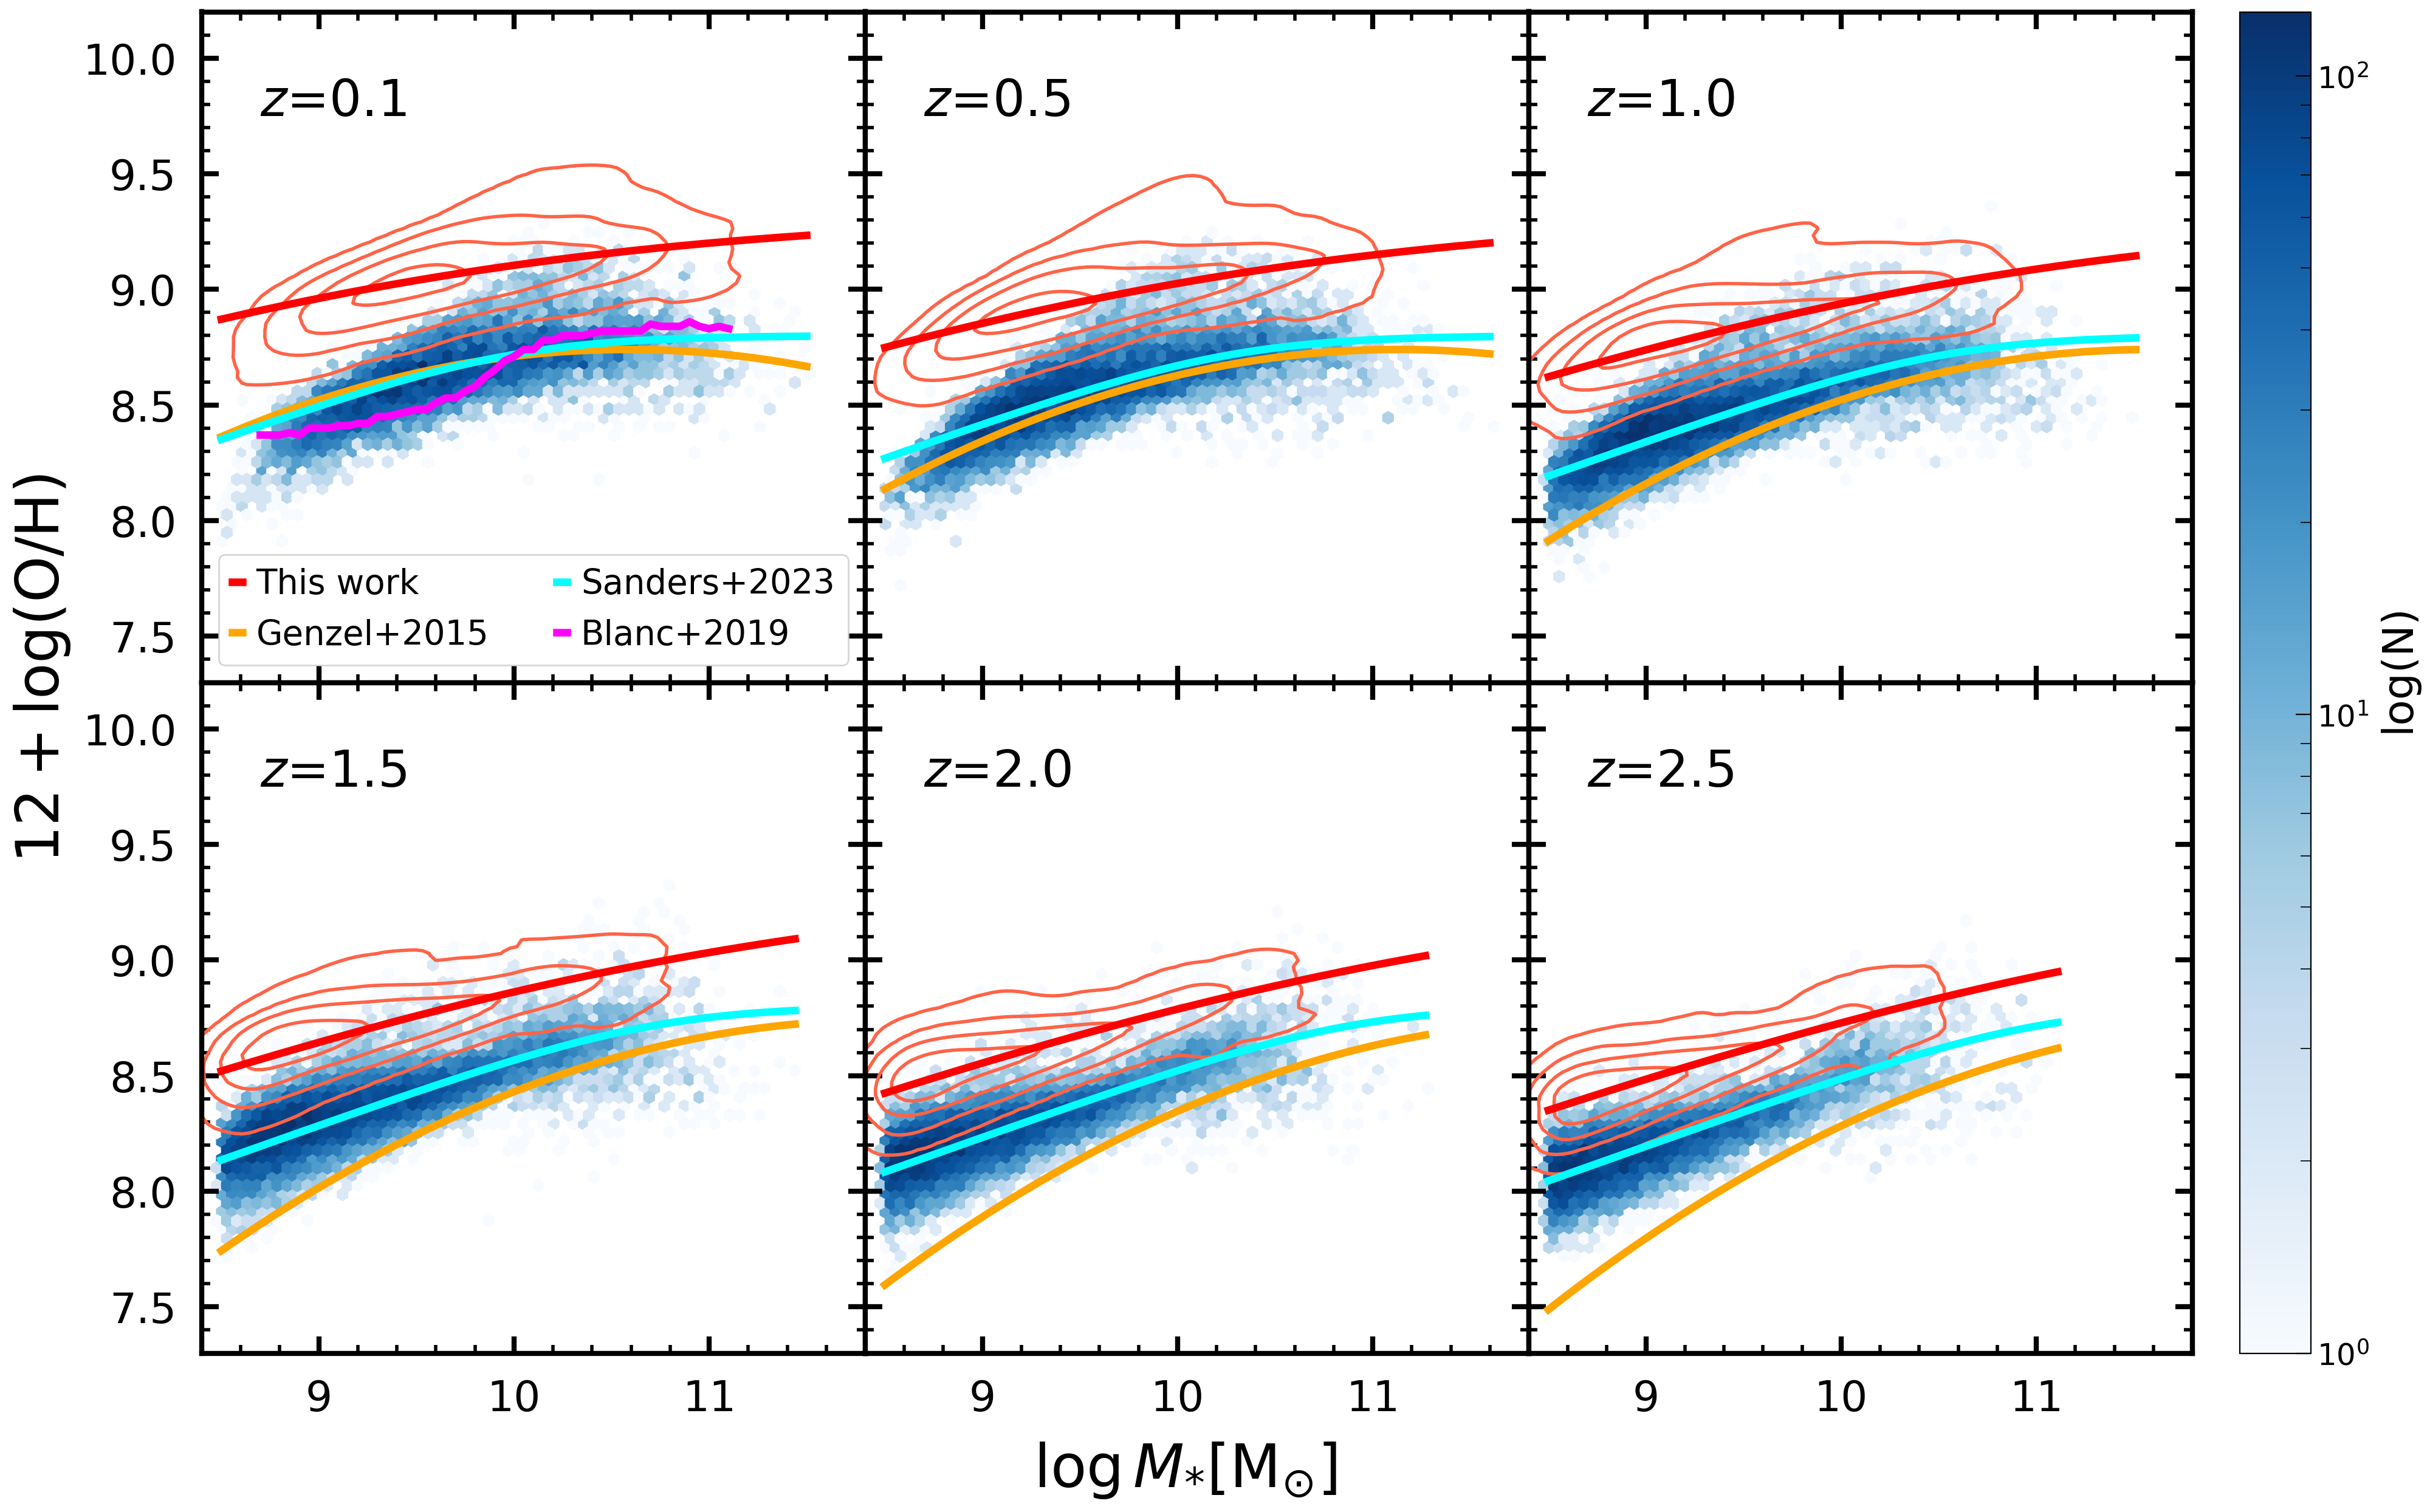
Sanders et al. (2023) determined the stellar mass–metallicity relation across cosmic time using observational data from the MOSDEF survey and the Sloan Digital Sky Survey. The – relation is parameterized using the formula
| (2) |
where is the asymptotic metallicity at the high-mass end, is the power-law index at the low-mass end, controls the sharpness of the turnover that occurs at , and and are fitting parameters. The best-fitting parameters given in Appendix B of Sanders et al. (2023) are adopted to describe the observed – relation.
Equation 2 is used to fit the EAGLE SFGs at six redshifts, yielding the best-fitting , , , and . The corresponding relation is shown in Fig. 3 via the red solid line. A constant offset in metallicity at a given stellar mass can be calculated between the observations (blue lines) and the EAGLE simulations (red lines) at each redshift. By adding the corresponding offset, the EAGLE SFGs are assigned the corrected gas-phase metallicity.
Fig. 3 shows the comparison of the – relation between the original and corrected gas-phase metallicity. Statistically speaking, the EAGLE SFGs exhibit higher metallicity than the observations at all six redshifts. The discrepancy in gas-phase metallicity between the EAGLE simulations and the observations gradually decreases with increasing redshift. Note that we extrapolated the – relation from Sanders et al. (2023) to the low-mass regime ( ), and might potentially induce some bias (Curti et al., 2020; Sanders et al., 2021). We note that the systematic offset of gas-phase metallicity in observations can reach 0.7 dex at similar due to the effect of different samples, selection criteria, apertures and, especially, metallicity calibrators (Genzel et al., 2015; De Rossi et al., 2017; Blanc et al., 2019).
3.2.2 Half-Light Radius
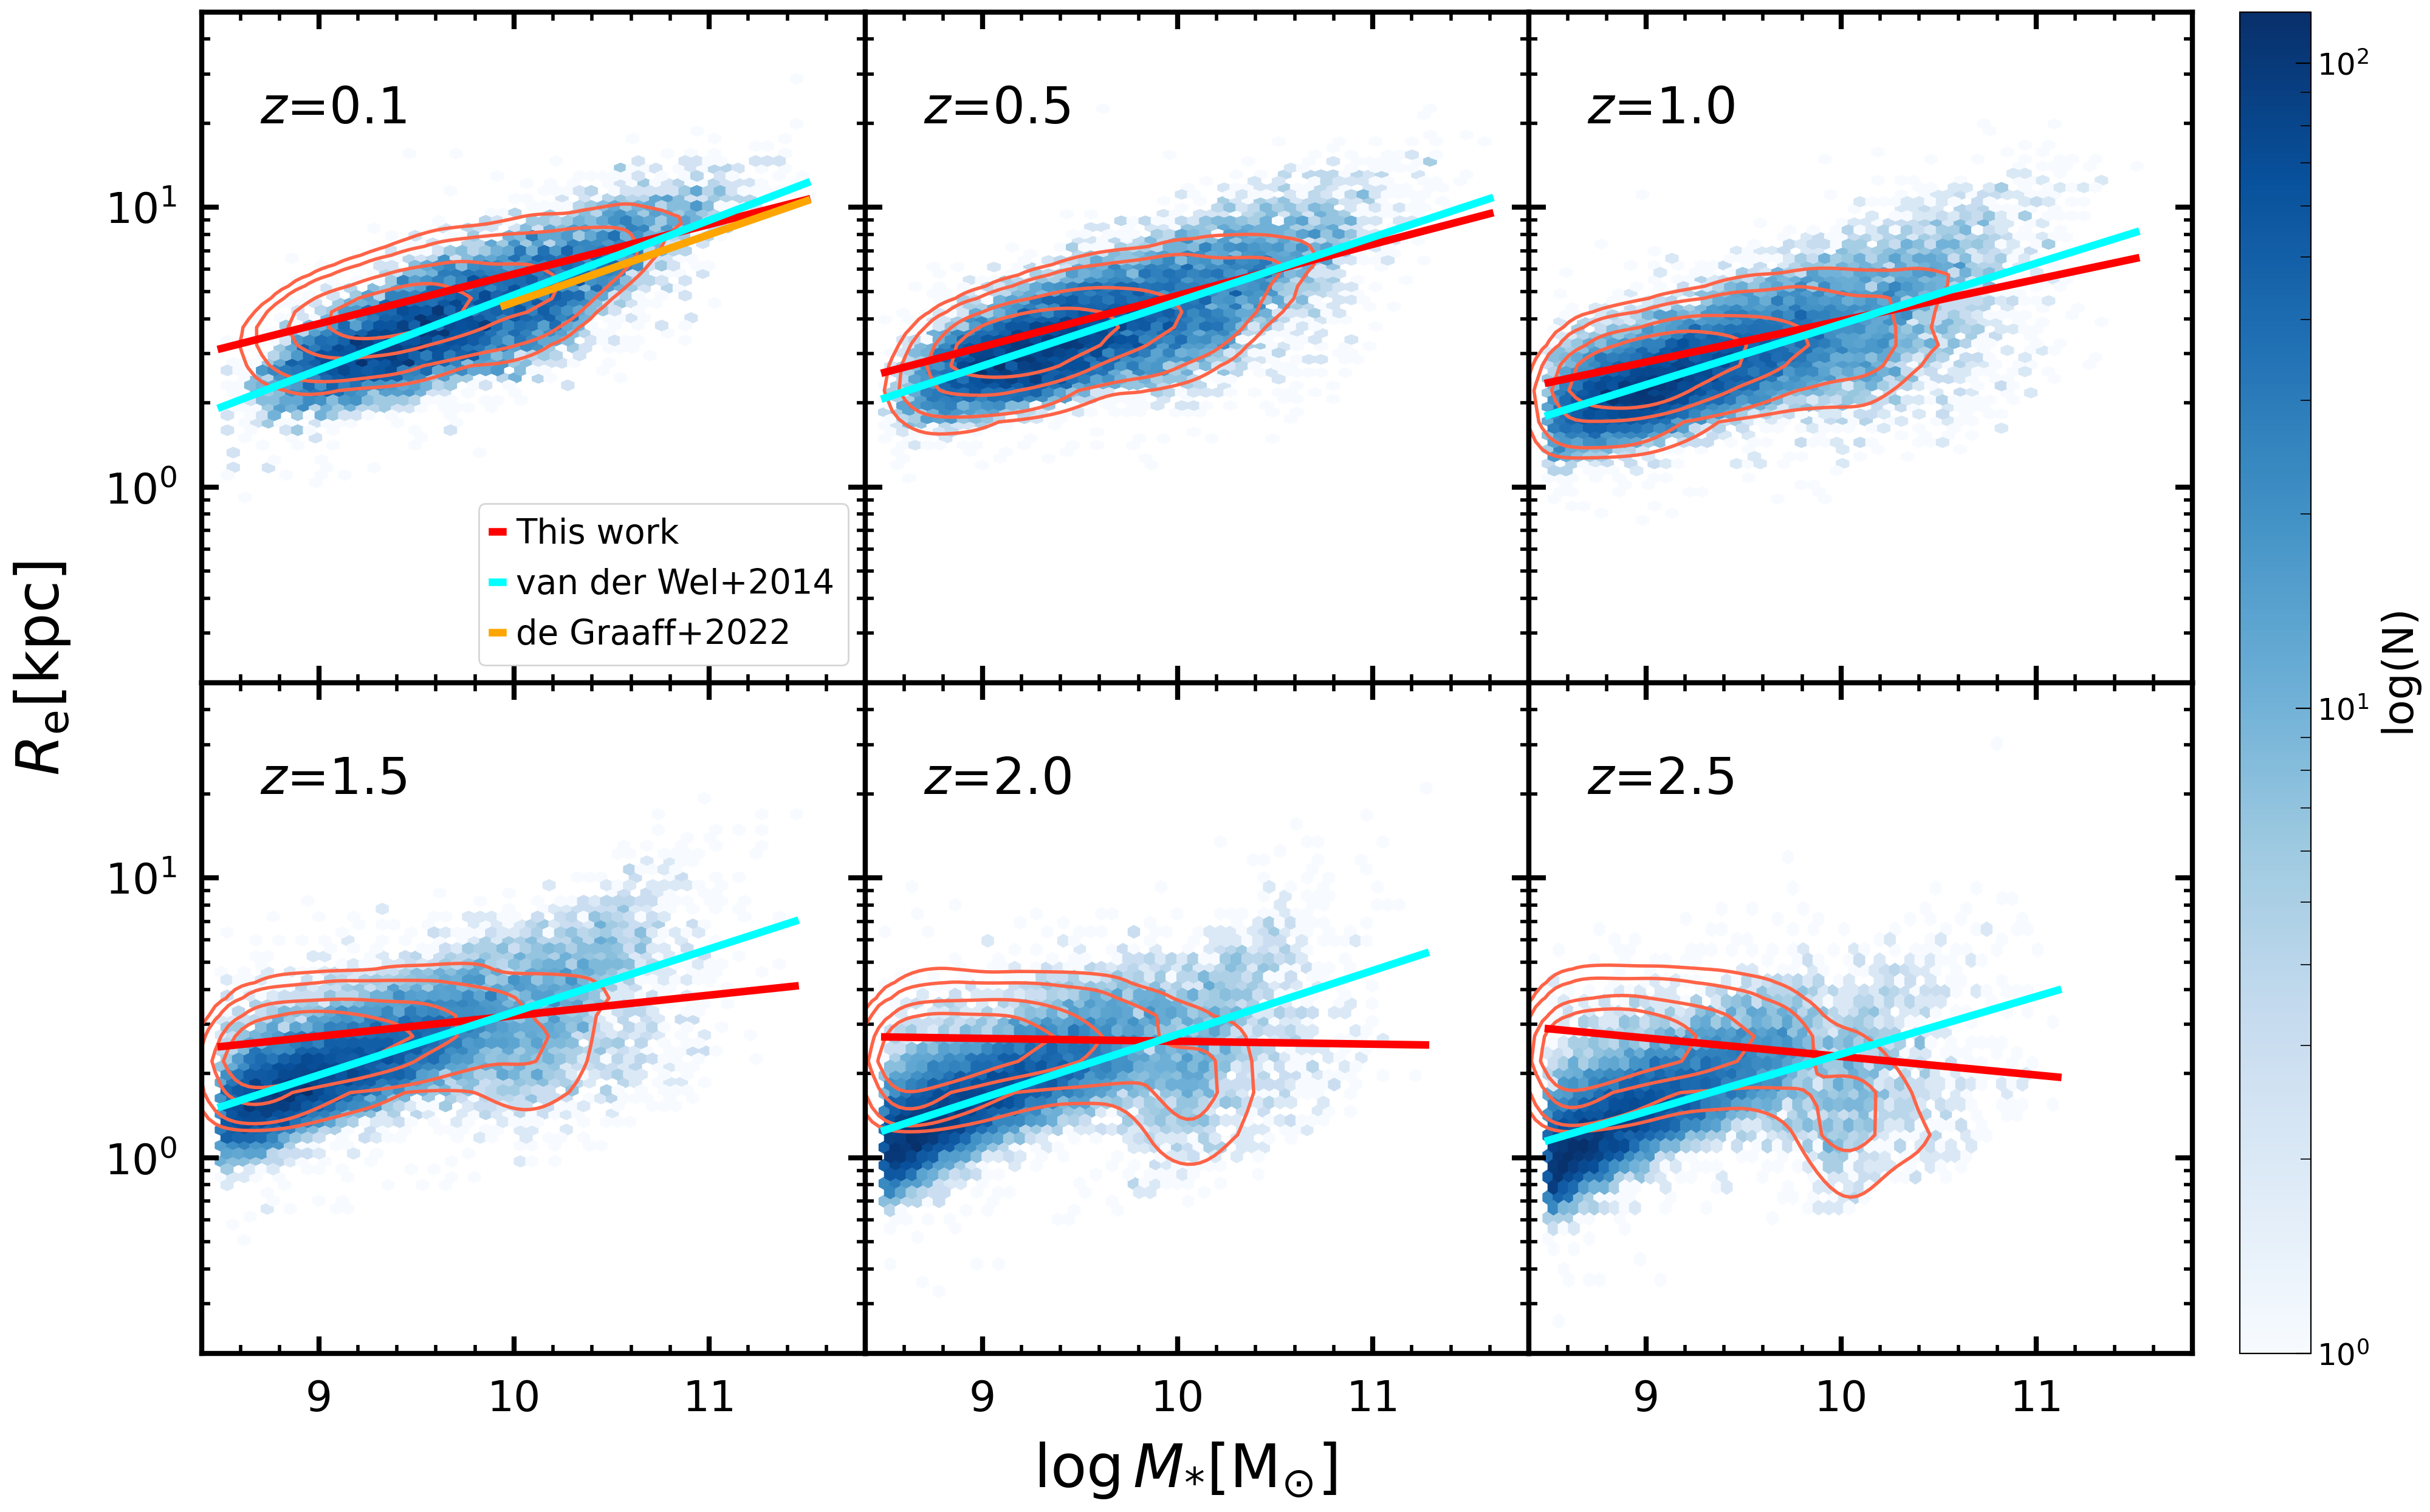
Galaxy size (i.e. half-light radius) is another important parameter in determining IRX. We use the – distribution of late-type galaxies from van der Wel et al. (2014) to calibrate our EAGLE SFGs. van der Wel et al. (2014) presented the evolution of the – relation over a wide redshift range of for galaxies with M⊙ using data from the 3D-HST/CANDELS survey. The late-type galaxies have increasing at increasing stellar mass at a given redshift, while at increasing redshift they appear to be substantially smaller than equally massive, present-day counterparts. The overall slope of the – relation shows no or little evolution. They parameterized the as a function of stellar mass at six redshift bins following Shen et al. (2003):
| (3) |
where and are free parameters to fit data points. The best-fitting results were given in the table 1 of van der Wel et al. (2014).
Because the redshift bins studies in van der Wel et al. (2014) is inconsistent with the six redshifts in our work, we use the spline interpolation method to derive the – relation at our given redshifts. Again, we extrapolate the – relation from van der Wel et al. (2014) down to M⊙. For the sake of acquiring the offset between the EAGLE simulations and the observations, we fit the – distribution of the EAGLE SFGs using Equation 3. Similar to the offset correction for metallicity, we calculate the offset for our EAGLE SFGs. The results are shown in Fig. 9. The correction is strong function of galaxy stellar mass and redshift, because the EAGLE simulations produce low-mass SFGs larger and massive SFGs smaller compared with the observations, and this deviation gradually increases at increasing redshift.
Indeed, the deviation in size is so large that the slope of the best-fitting – relation even becomes negative at for the EAGLE SFGs, opposite to the positive slope of the observed – relation at all redshifts. We point out that the conversion of from the EAGLE simulations to may cause some uncertainties, and the increasing scatter in with redshift and stellar mass might also contribute to the deviation.
3.2.3 IR Luminosity and IR Excess
The third important parameter to be corrected for our EAGLE SFGs is . Consequently IRX needs to be corrected as well. In practice, we firstly calibrate SFR, and secondly IRX. The corrections for SFR and IRX determine the correction to .
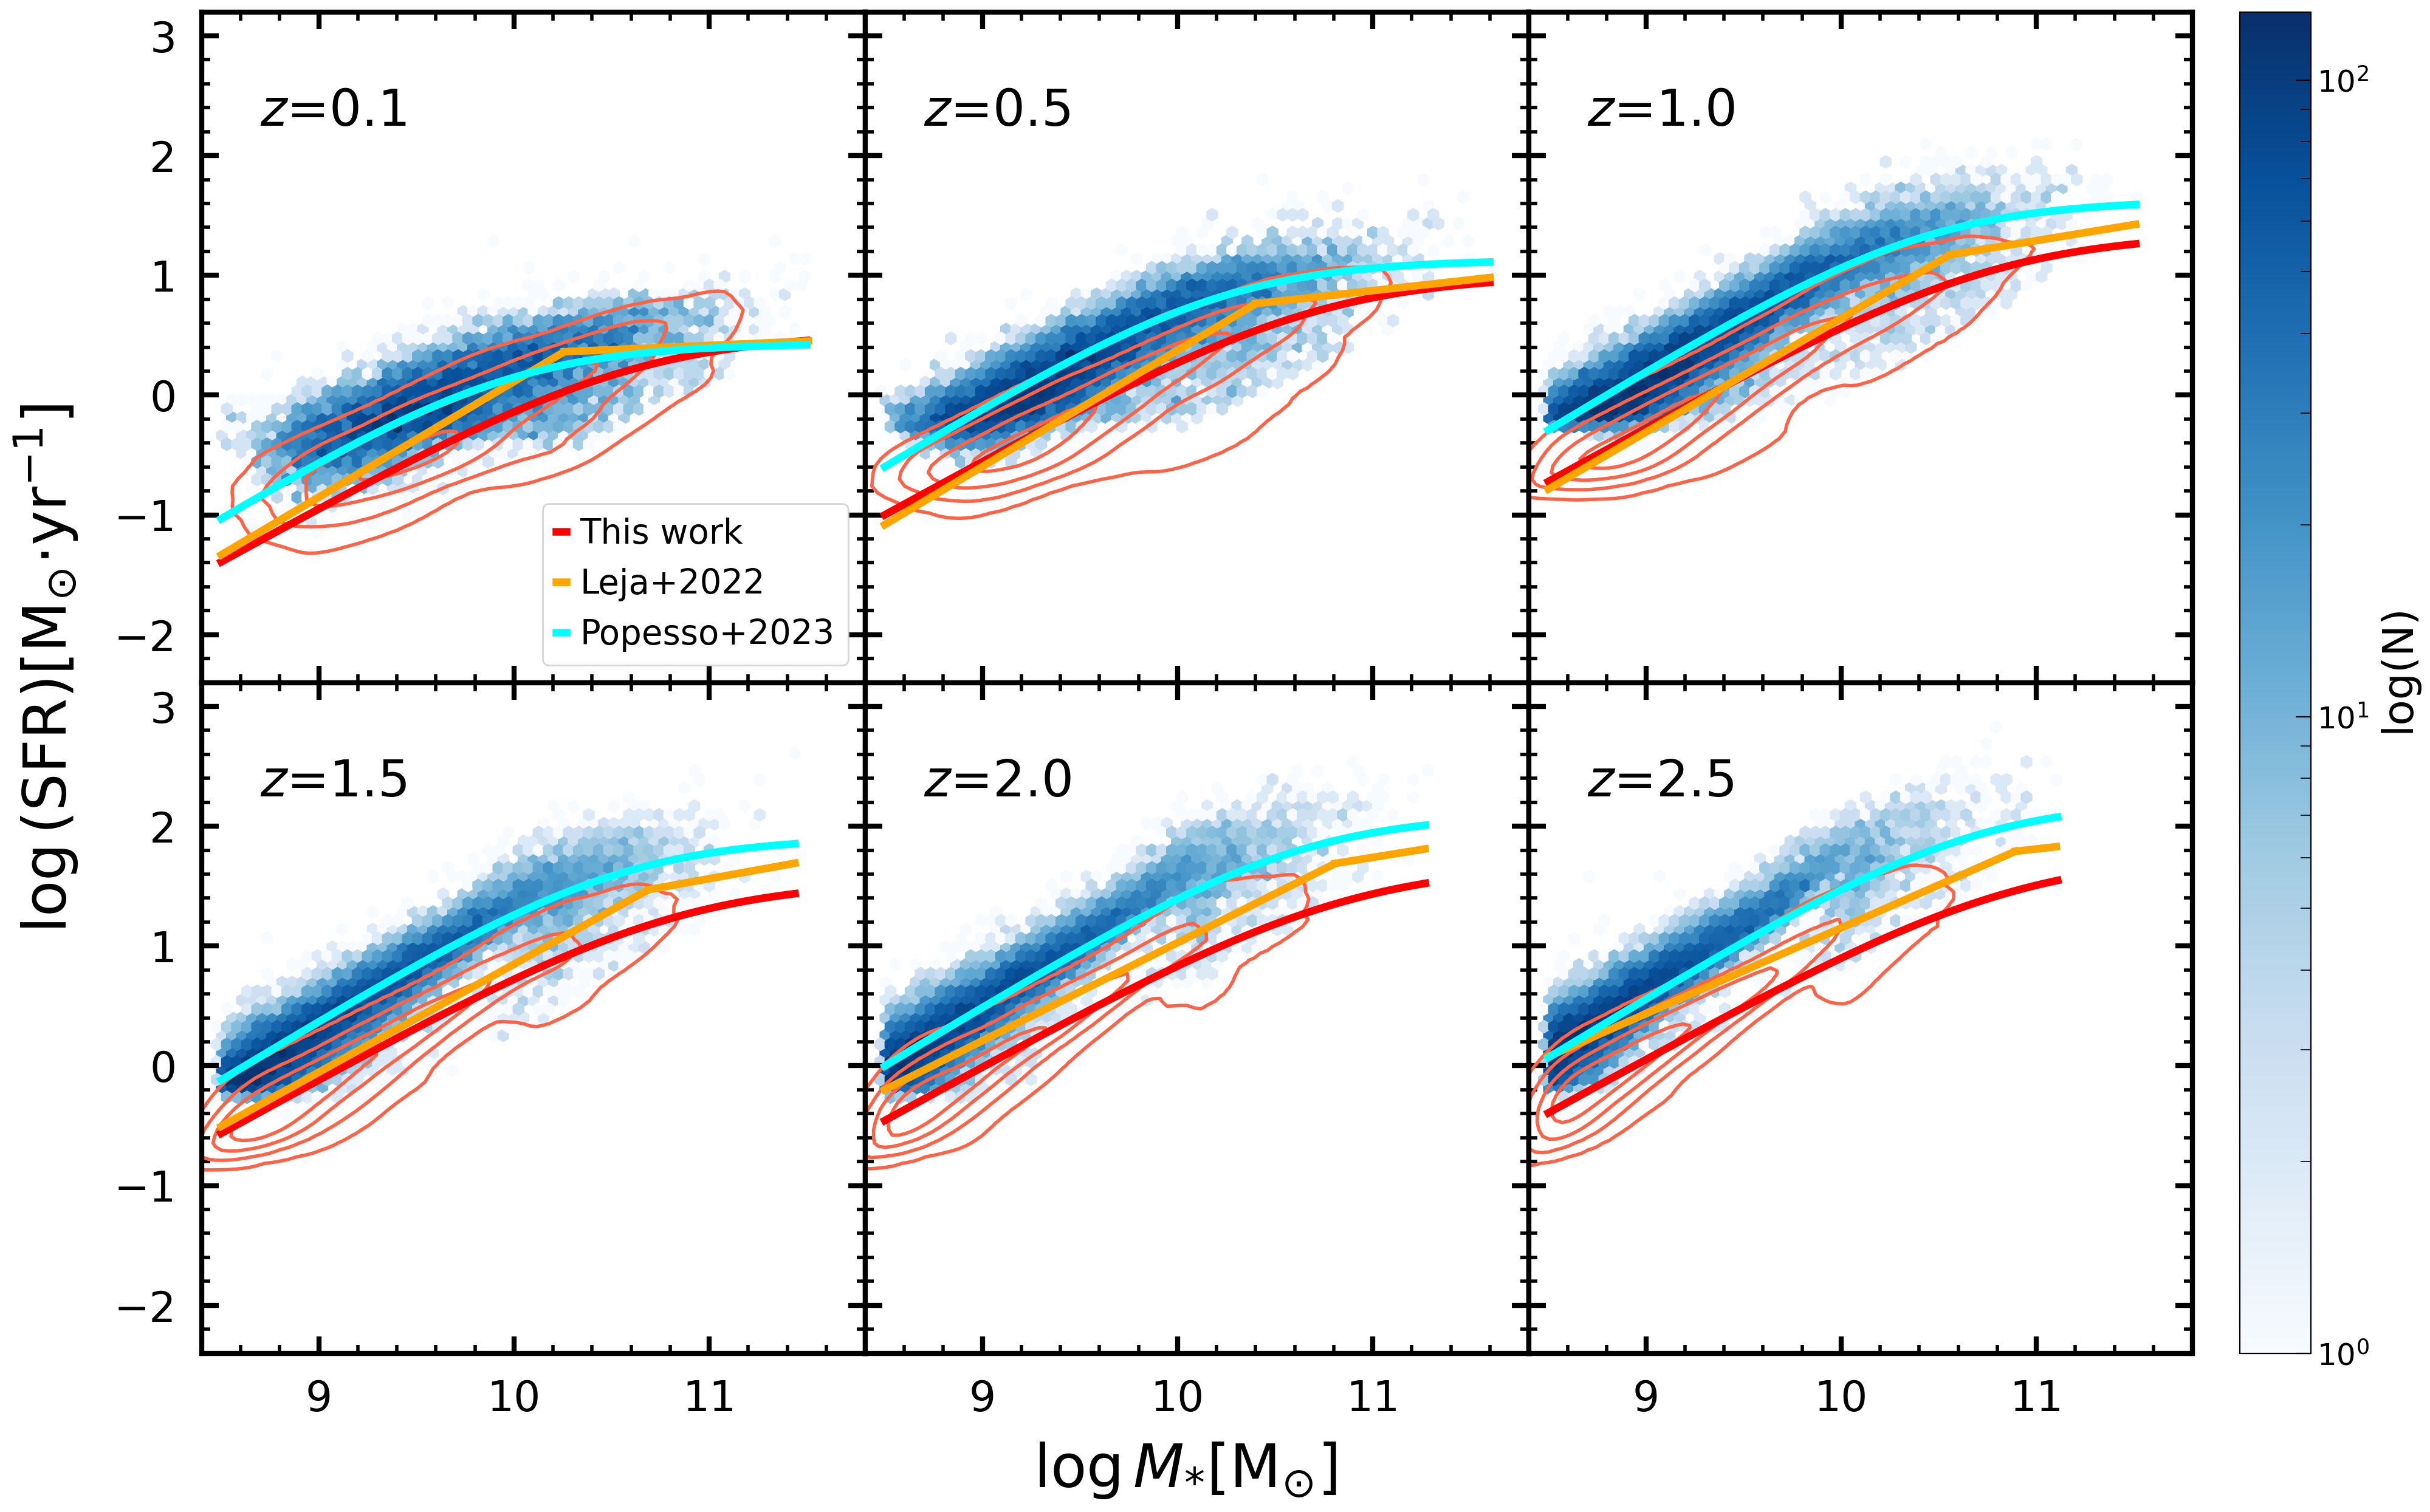
Compiling a comprehensive census of literature studies, Popesso et al. (2023) investigated the evolution of the –SFR relation of SFGs with M⊙ in the redshift range . They adopted the same form as Lee et al. (2015) to parameterize the –SFR relation:
| (4) |
where SFRmax is given in unit of M⊙ yr-1 and refers to the maximal SFR that the relation reaches at the high-mass end, is the turnover stellar mass and is the power-law slope at the low-mass end. Here SFRmax and depend on time, following:
| (5) |
The SFR relation bends at the high-mass end with the turnover mass evolving with time which is possibly a result of star formation quenching.
The best-fitting –SFR relation for the EAGLE SFGs is derived using Equation 4 and Equation 5, and shown in Fig. 10. We compare the best-fitting relation of the EAGLE SFGs with the –SFR relation from Popesso et al. (2023) to calculate the offset in SFR between the EAGLE simulations and the observations at given stellar masses and redshifts. We then correct the SFR offset for the EAGLE SFGs, and obtain the corrected SFR, as shown in Fig. 10. It is clear that the EAGLE SFGs exhibit systematically lower SFR compared to the observed SFGs across all stellar masses and redshifts. The offset between Popesso et al. (2023) and this work gradually increases from a minimum of 0 dex to a maximum of 0.6 dex at increasing redshift. Corrected for the SFR offset, the EAGLE SFGs follow the observed –SFR relation, which demonstrates the difference of the normalization between the observed and simulated relation. We note that there is strong evidence that the –SFR relation is dominated by systematics. Studies that calculated the SFR from a combination of UV+IR luminosity have overestimated normalization (Katsianis et al., 2020; Leja et al., 2022), and thus the above tension between the EAGLE simulations and the observations can be attributed to limitations of the determination of galaxy properties.
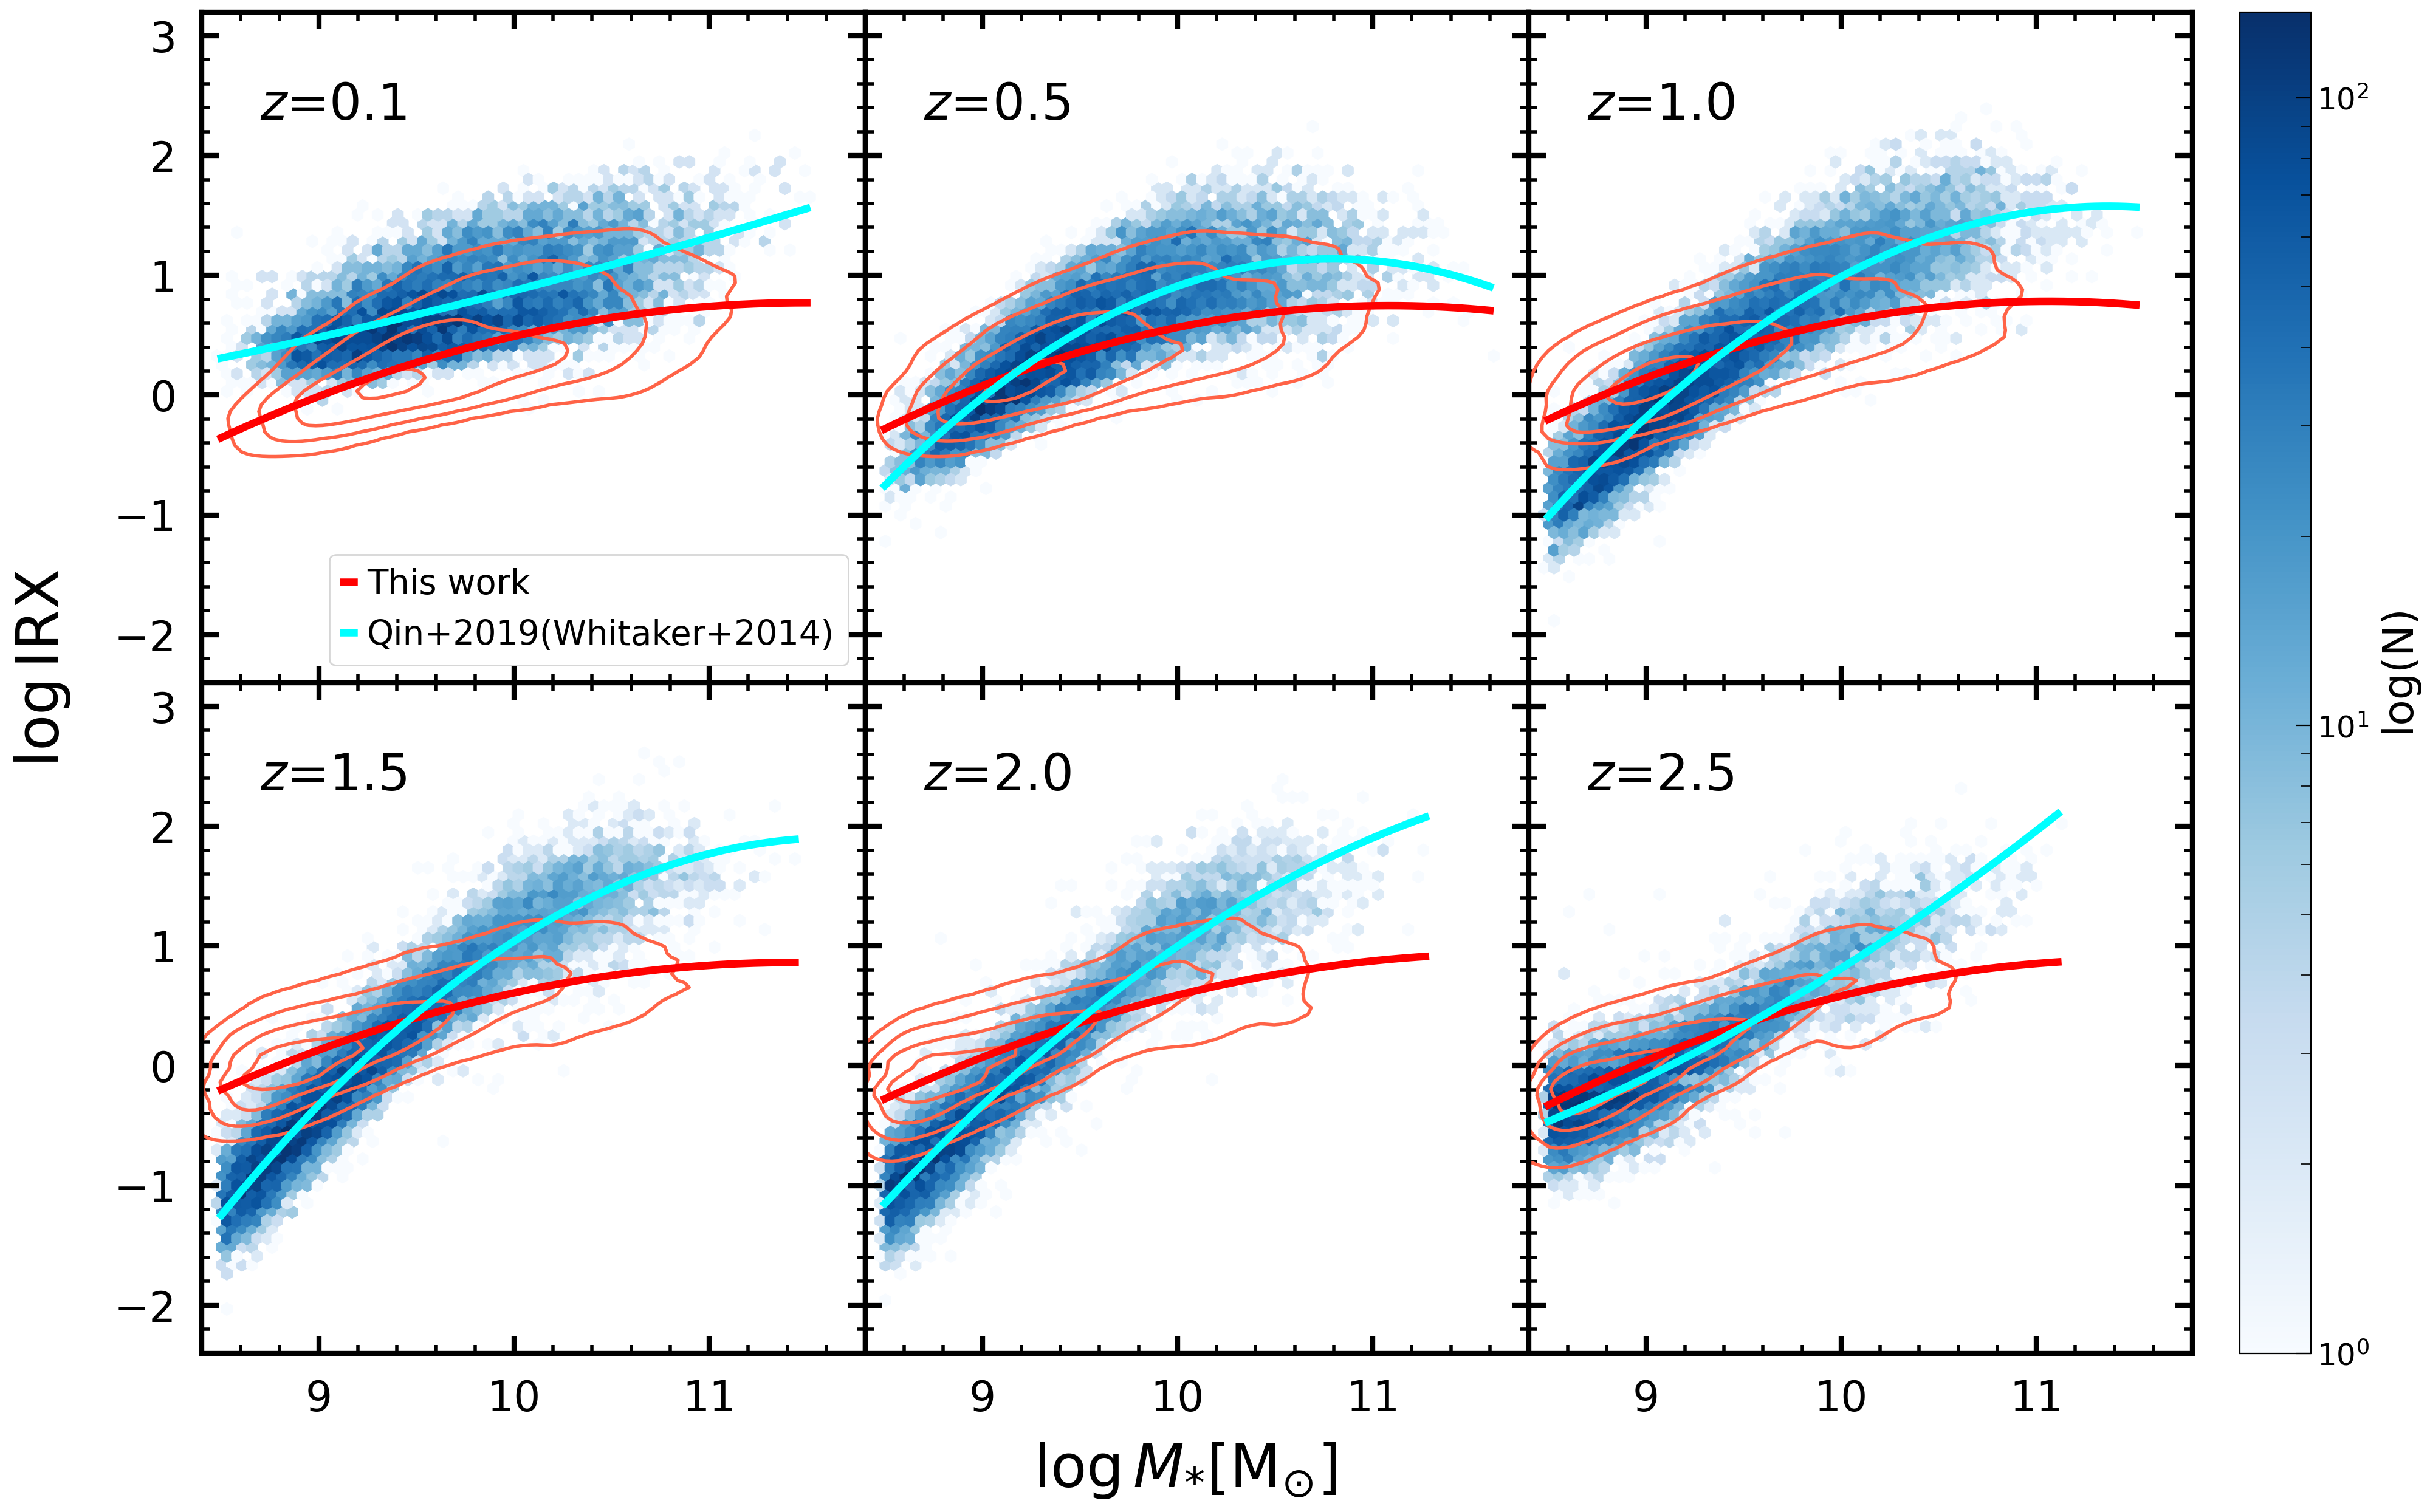
For the next step, we calibrate the IRX for our EAGLE SFGs using the –IRX relation from Whitaker et al. (2014) and Qin et al. (2019). Whitaker et al. (2014) selected 39,106 SFGs with 0.5 < < 2.5 from the 3D-HST/CANDELS survey, and performed a stacking analysis of the Spitzer/MIPS imaging data. They found that the SFGs with M showed no evolution in IRX from to for SFGs, while SFGs with /M appeared to have a higher IRX at increasing redshift. We adopt the average and measurement for subsamples in given redshift and stellar mass bins from Whitaker et al. (2014), and fit the –IRX distribution at given redshift with a second-order polynomial function as
| (6) |
And we apply the spline interpolation method to obtain the –IRX relation for our five redshifts (except ). In addition, for , we fit the data from Qin et al. (2019) to obtain the observed –IRX relation. Using Equation 6, We derive the best-fitting –IRX relation of our EAGLE SFGs at six redshifts. Doing so we calculate the IRX offset between the EAGLE simulations and the observations, and correct our EAGLE SFGs for the offset and present the correction results in Fig. 4.
It is clearly demonstrated that the EAGLE SFGs show statistically lower IRX than the observed SFGs at . However, at , the EAGLE SFGs show a trend of higher IRX at the low-mass end and lower IRX at the high-mass end compared with the observations, causing an intersection in the best-fitting relation between the EAGLE simulations and the observations, and the stellar mass corresponding to the intersection increases with increasing redshift.
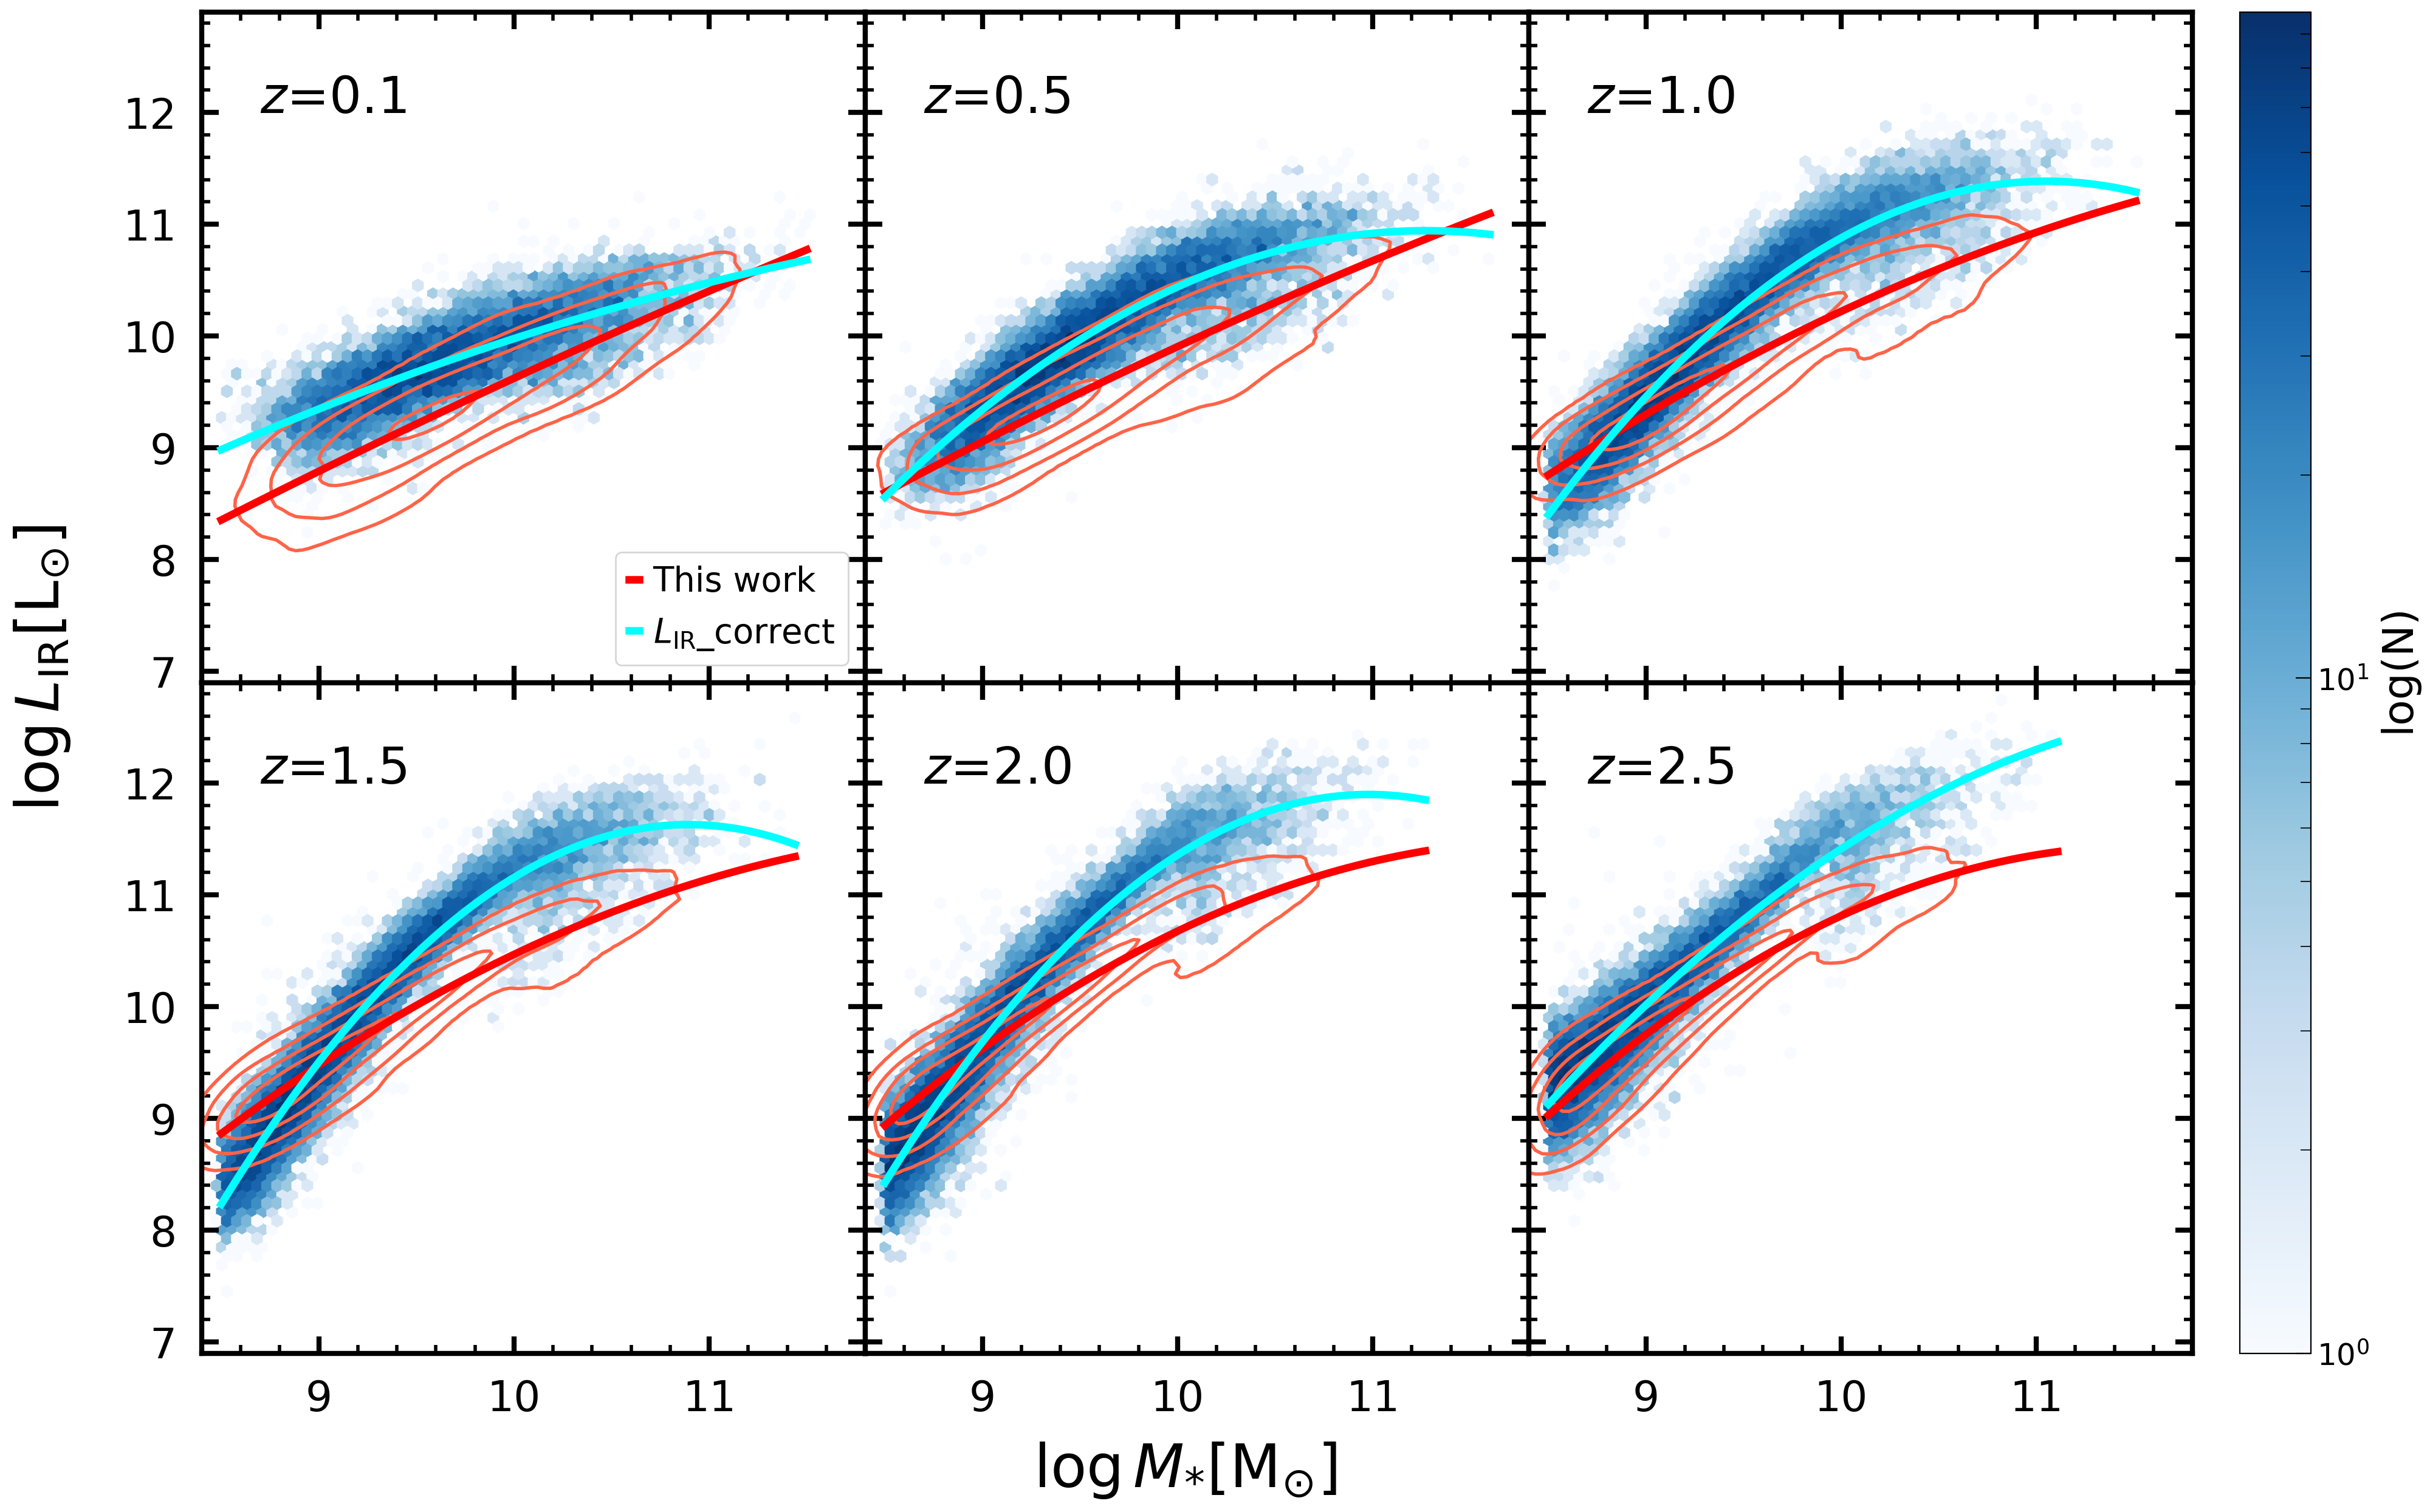
Using ) (Bell et al., 2005), we are able to obtain the expected and from the corrected SFR and corrected IRX (). Then we employ a second-order polynomial to fit the – relation for the EAGLE SFGs with original and expected (or corrected) at six redshifts, and the offset is shown in Fig. 11. It is obvious that the overall tendency of the discrepancy between the original and corrected – relation mirrors that of the IRX relation in Fig. 4.
3.3 The Predicted Universal IRX Relation with Corrected Parameters
The predicted universal IRX relation of the EAGLE SFGs based on the original galaxy parameters shows increasing deviation from the observed relation at , as shown in Fig. 2. Naturally, we intend to figure out the causes for the discrepancy between the EAGLE simulations and the observations. For this purpose, we use the scaling relations (–, –, –SFR and –IRX relation) of observed SFGs to re-calibrate the simulated galaxy parameters in order to investigate which parameters in the EAGLE SFGs significantly contribute to the discrepancy. In each of the following sections, the predicted universal IRX relation is re-examined with changes to only one parameter among metallicity, and (hence IRX).
3.3.1 The Gas-Phase Metallicity-related Correction
We firstly study the influence of on the predicted universal IRX relation. Fig. 5 shows the distribution of the EAGLE SFGs with only correction of parameter in the universal IRX relation. We notice that the EAGLE SFGs with are mostly affected by the metallicity correction, resulting in a better agreement with the observed universal IRX relation. This improvement indicates that the gas-phase metallicity is a key quantity in reproducing the observed universal IRX relation. However, for the low-IRX galaxies (), the deviation becomes larger, especially at high redshift. We argue that this increasing deviation might be biased by the correction to metallicity, because the extrapolation of the observed – relation further into the low-mass and low-metallicity regime is of relatively high uncertainty. This uncertainty could be magnified in the extrapolation to the very low-IRX end, even leading in Equation 1 to be negative, and consequently stronger deviation in the universal IRX relation.
3.3.2 The -related Correction
After considering the gas-phase metallicity, galaxy size is another parameter to be addressed. Comparison of the predicted universal IRX relation with the original parameters versus the parameters with only correction of is shown in Fig. 12. The correction to is dramatic as shown in Fig. 9. However, the predicted universal IRX relation at six redshifts all change little when replacing the original Re with the one with correction. This result suggests that the Re is not a dominant parameter responsible for the discrepancy of the universal IRX relation between the EAGLE simulations and the observations.
3.3.3 The -related and IRX-related Correction
The third parameter we examine for the predicted universal IRX relation is the IR luminosity. Because IRX contains , variation in will have obviously effect on IRX. We thus determine their impact on the predicted universal IRX relation together, and the result with corrections of and IRX are illustrated in Fig. 13. As can be seen, the positions of the EAGLE SFGs remain nearly unchanged after implementing the corrections to and IRX, and those with IRX < -0.5 show even a slightly larger discrepancy. We point out that the corrections of and IRX for the EAGLE SFGs are based on the scaling relations from observational studies, and the extrapolation to the low-mass regime might suffer from large uncertainties, similar to the situation for the gas-phase metallicity discussed in Section 3.3.1. We thus argue that the impact of and IRX on the predicted universal IRX relation is likely marginal.
3.4 Relationships between Original IRX and Galaxy Parameters
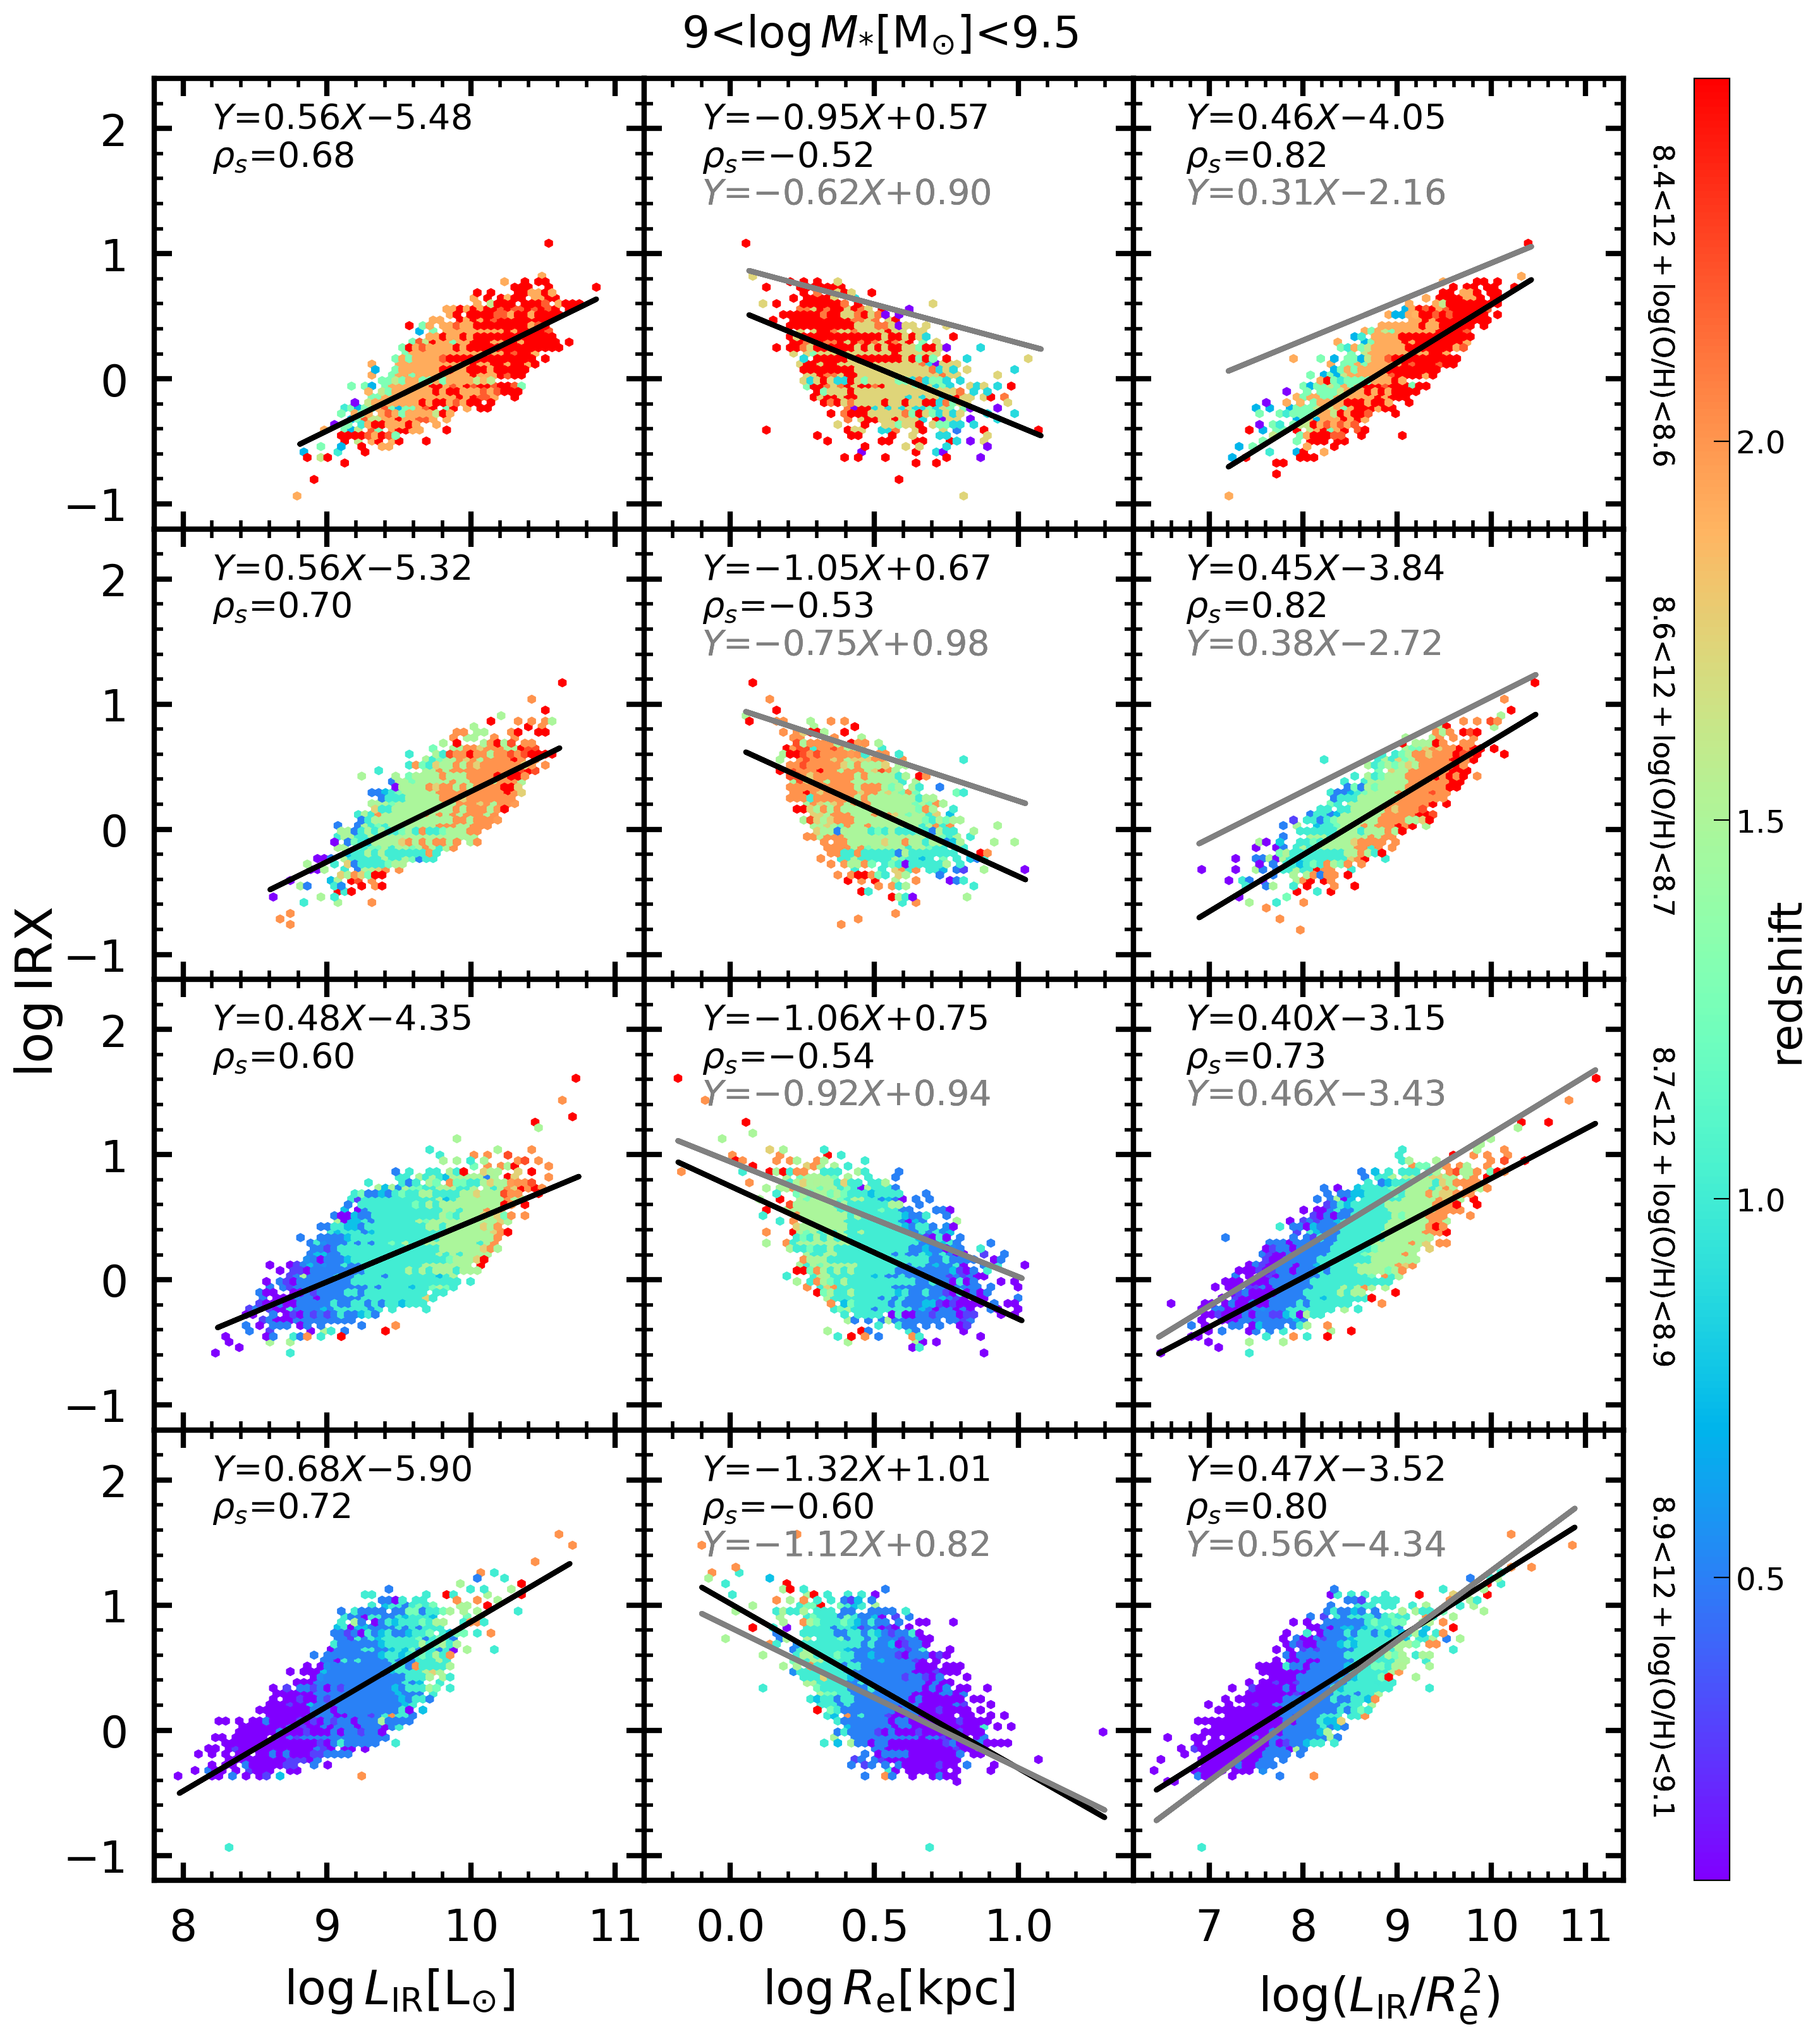
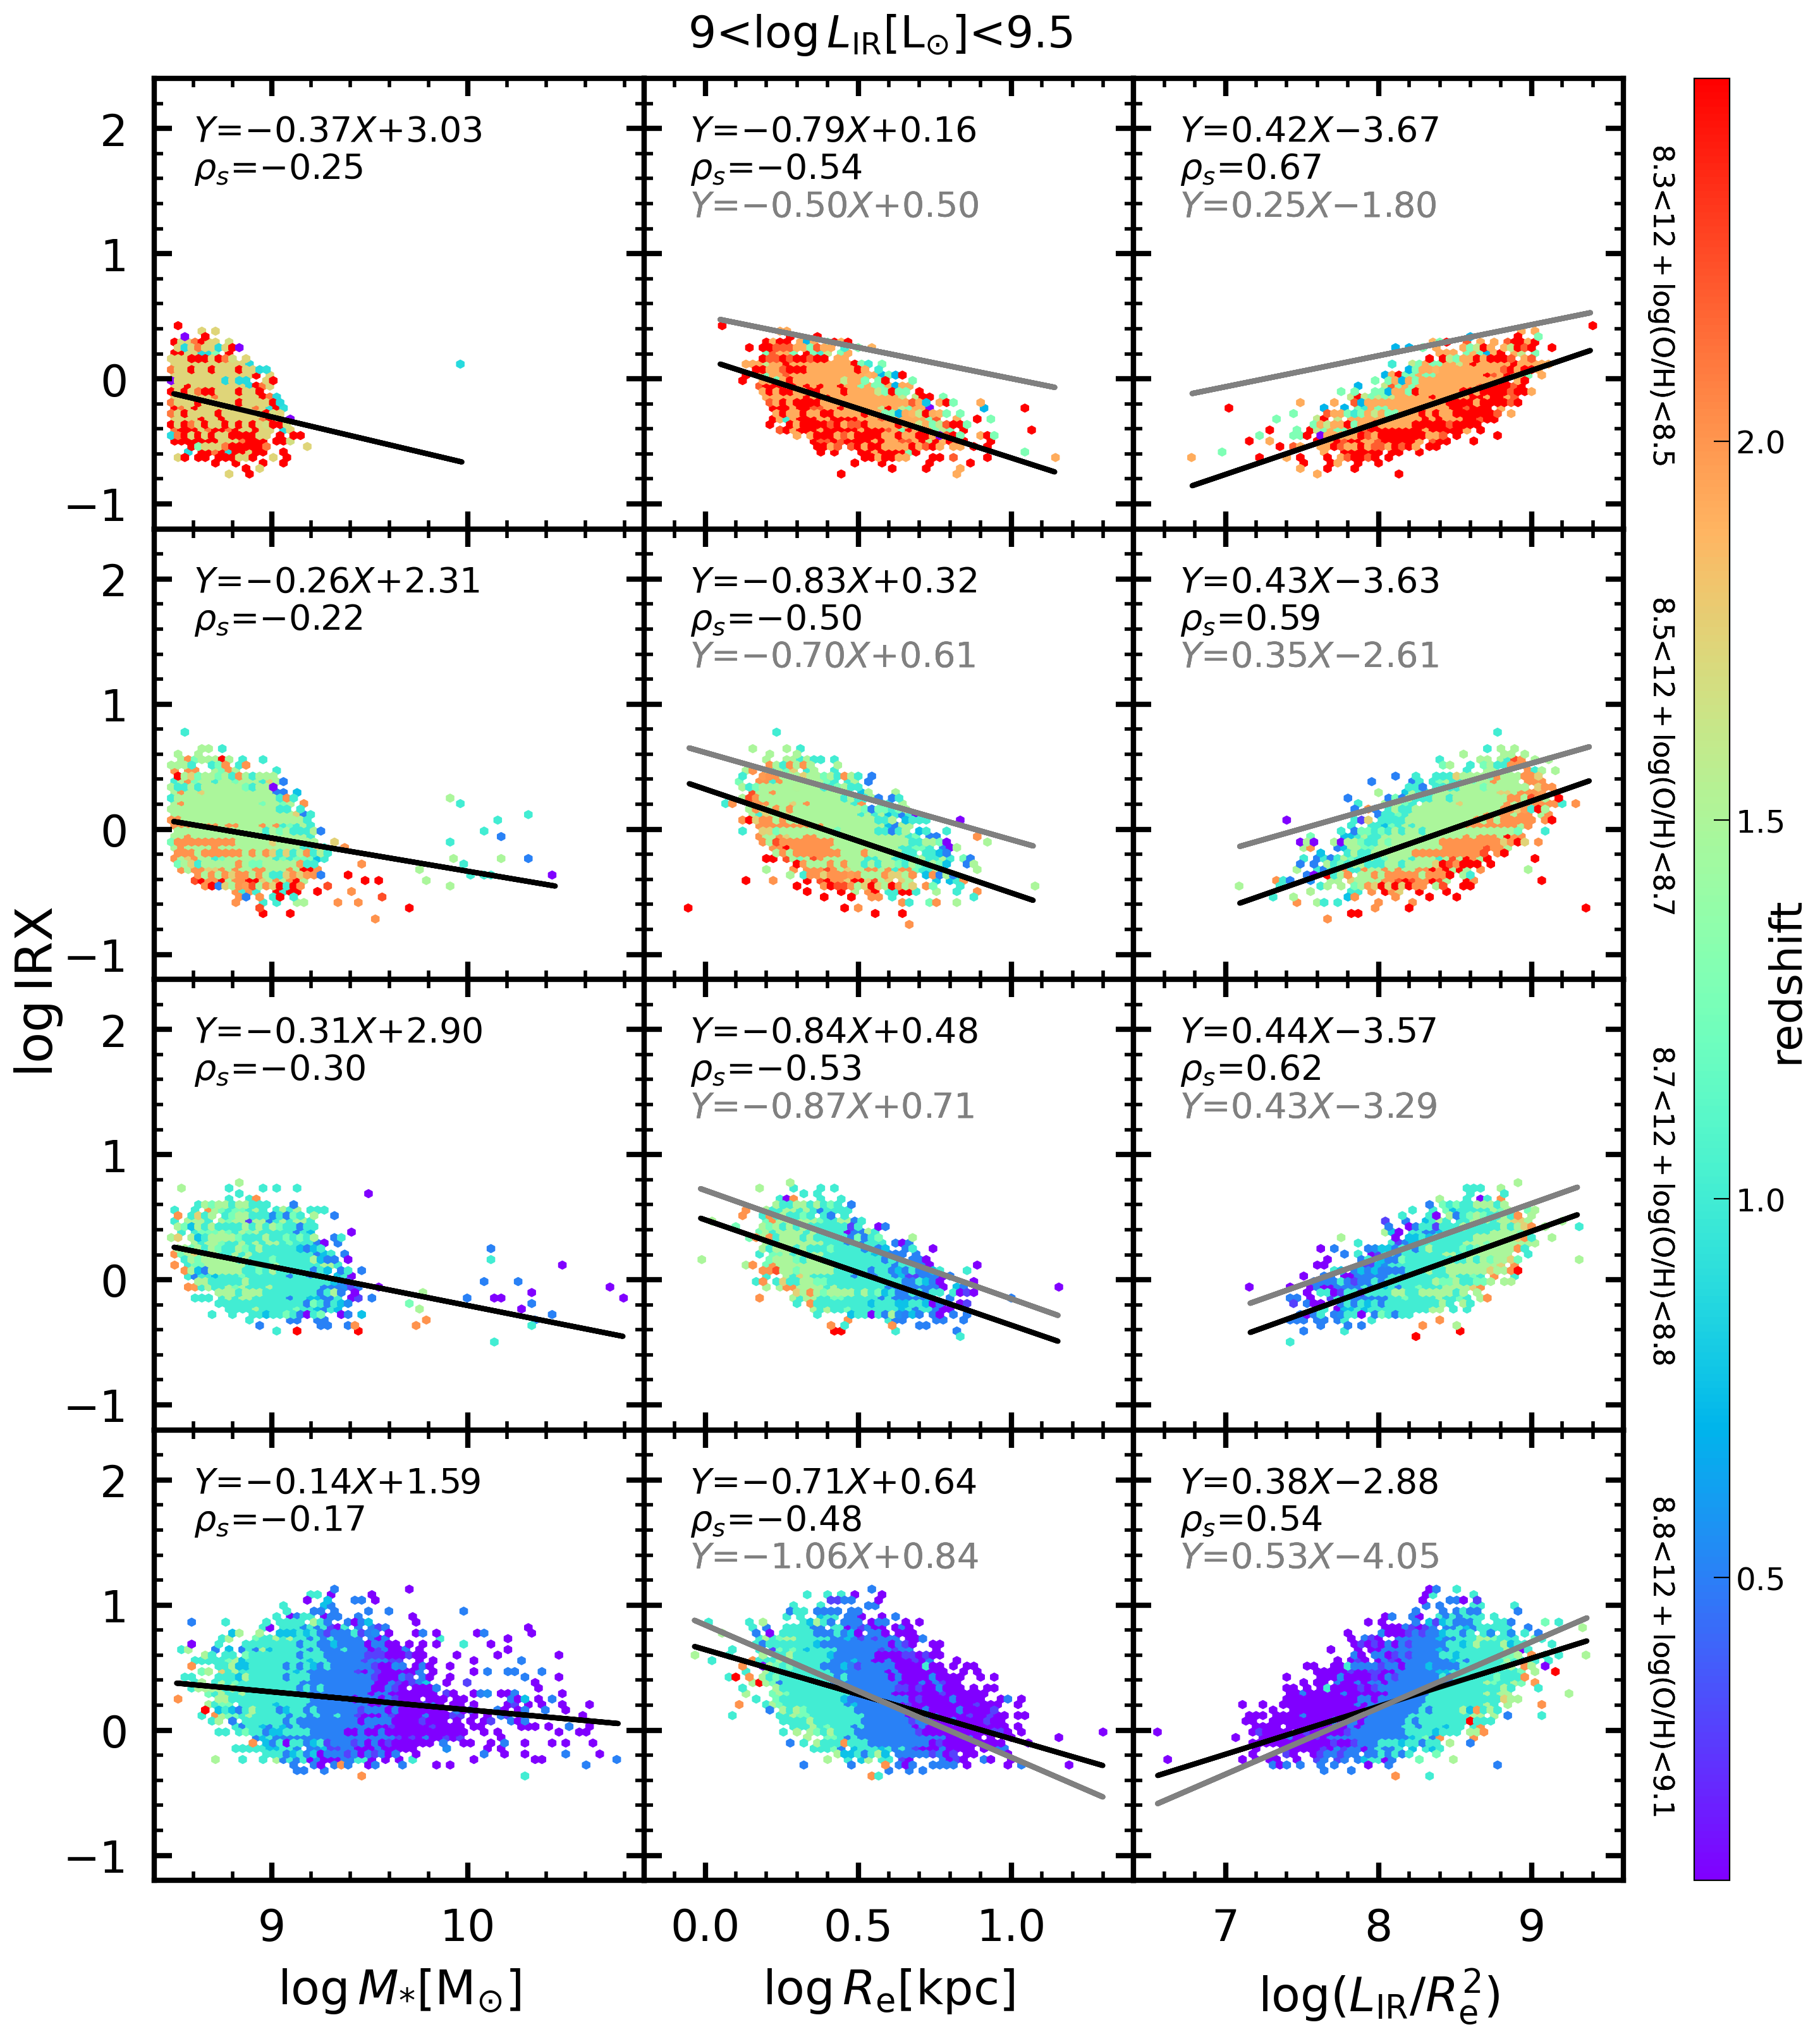
In order to understand the discrepancy of the universal IRX relation between the EAGLE simulations and the observations, we investigate the correlations between the original IRX and original galaxy parameters from the EAGLE simulations and compared these correlations with that of the observations. For the reason that , SFR, and are tightly correlated with each other, we examine the relationships between the IRX and galaxy parameters at fixed and . This approach is similar to that adopted in Qin et al. (2019).
We analyze a subsample of the EAGLE SFGs with , and divided them into four metallicity bins over . Here the range is selected to maximize the number of sample galaxies for good statistics and meanwhile to minimize the property changes with ; then the subsample is divided into four metallicity bins over to allow each bin contains a similar number of SFGs. Fig. 6 shows the correlations of IRX with , and as a function of gas-phase metallicity. Our analysis reveals that for all four metallicity bins, IRX decreases with and increases with . A rather weak anti-correlation between and IRX is presented, while in observations IRX is independent of (Qin et al., 2019). We argue that the weak dependence of IRX on is largely induced by the systematic discrepancies of galaxy parameters for the EAGLE SFGs. Additionally, for a given , or , the average IRX increases with increasing gas-phase metallicity. These findings are consistent with the results given in Qin et al. (2019). However, we see that the slope of the best-fitting relation for IRX with or does not become steeper at increasing gas-phase metallicity in the EAGLE simulations, differing from the tendency reported by Qin et al. (2019).
We also investigate the correlations between IRX and , , and while fixing and or and , as shown in Figures 14 and 15. We point out that the discrepancy in (also IRX) contributes more than that of in responsible for the bigger discrepancy of the universal IRX relation at between the EAGLE simulations and the observations. We conclude that the discrepancy between the EAGLE simulations and the observations may be due to the fact that the EAGLE simulations are not able to reproduce the slopes of the relationships between IRX and and , which increase with gas-phase metallicity.
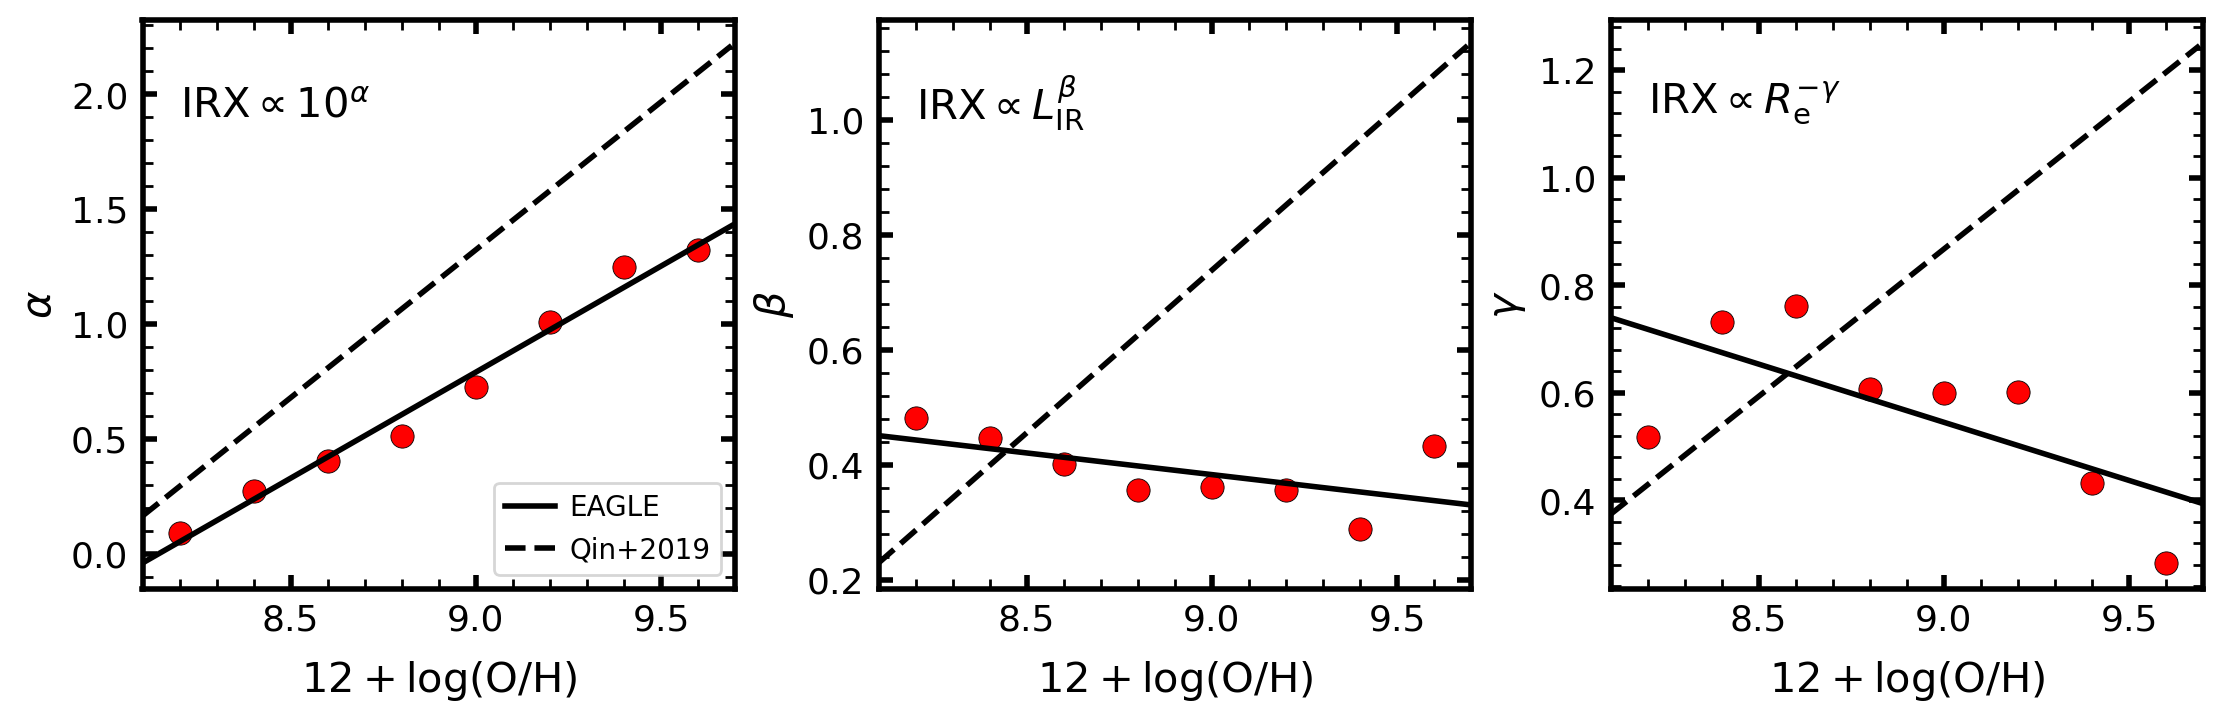
3.5 The Dependence of Power-law Indices of the Predicted Universal IRX Relation on Gas-phase Metallicity
We further investigate the slope of the power-law indices of the predicted universal IRX relation as a function of gas-phase metallicity for the EAGLE SFGs with the original galaxy parameters. The EAGLE SFGs in our sample are divided into eight continuous metallicity bins over , and fitted with the universal IRX relation described by Equation 1 in each gas-phase metallicity bin. The relations between gas-phase metallicity and power-law indices (, and ) are examined. We do not include because we set inclination angle to be constant (). Fig. 7 shows the best-fitting power-law indices as a function of gas-phase metallicity. We demonstrate that only increases with gas-phase metallicity, with a slope consistent with that from the observations, whereas and decrease with gas-phase metallicity, dramatically differing from those of the observations. These results reveal some limitations of the EAGLE simulations which are not able to reproduce the dependence of the IRX on and . Further efforts are needed to improve the simulations in reproducing the gas-phase metallicity and dust attenuation for the SFGs across cosmic time.
4 Discussion and Prospects for State-of-the-art Cosmological Simulations
Provided that the EAGLE simulations successfully captured qualitatively numerous scaling relations and the evolution of galaxy properties like the SFR and stellar mass, in our study we decide to perform comparisons of the reference model Ref-L0100N1504 with the observations in the universal IRX relation. Our study is aiming to unravel the performance of state-of-the-art simulations with respect additional observational data and uncover potential areas of discrepancy, such as gas-phase metallicity, size, infrared luminosity () and IRX.
The agreement between the EAGLE simulations and the observations in the universal IRX relation up to compliments the simulation’s capacity to replicate certain important aspects of galaxy formation and evolution, especially at low redshift. However, at the deviations between the predicted and observed universal IRX relations become pronounced, particularly for galaxies at both the low-IRX and high-IRX end.
Previous studies like Furlong et al. (2017) investigated the evolution of the half-mass radius for galaxies from to in the EAGLE simulations, and made a comparison with the half-light radius inferred from the observations of Shen et al. (2003) and van der Wel et al. (2014). The agreement for galaxies with M⊙ was within 0.1 dex at and 0.2–0.3 dex at . However, in our work we caution that the comparison of the half-mass radius with the half-light radius may introduce a systematic bias because of the presence of a colour gradient (or stellar-age gradient) in galaxies. It seems that the sizes of the EAGLE galaxies are biased in the sense that low-mass galaxies are too extended and high-mass galaxies are too compact, even leading to a negative slope for the – relation at , as shown in Fig. 9.
De Rossi et al. (2017) also discussed the correlations between the galaxy stellar mass and gas-phase metallicity in the EAGLE simulations. They argued that the gas-phase metallicity in massive galaxies ( M⊙) was mostly regulated by the AGN feedback whereas the slope of the simulated – relation was mostly determined by stellar feedback in low-mass galaxies ( M⊙). Increasing the AGN feedback heating temperature yields decrease of the gas-phase metallicity at the high-mass end, by heating the gas remaining, thereby decreasing SFR and by ejecting metal-enriched gas from galaxies. Weaker stellar feedback tends to produce higher gas-phase metallicity in low-mass galaxies. However, still the discrepancies between different observational results can reach 0.7 dex at similar redshift due to the effect of different samples, selection criteria, apertures and, especially, metallicity indicators affecting our comparison and qualitative results (De Rossi et al., 2017).
Furlong et al. (2015) studied the evolution of galaxy stellar mass and SFR in the EAGLE simulations up to , and found that sSFR of SFGs was typically 0.2–0.5 dex lower than that from the observations at all redshifts and across all stellar masses. The same results were obtained by Schaye et al. (2015) at low redshifts. Besides that the –SFR relation is subject to systematics and biases (Katsianis et al., 2020), it is suspected that insufficient bursts of star formation in the simulations leave sSFR lower for simulated galaxies, something that should be addressed. We note that star formation in simulations usually has a sophisticated metallicity-dependent density threshold, and only gas particles above this threshold are likely to form stars, determined by their pressure.
A significant result of our study is the application of the parameter corrections to the EAGLE galaxy parameters, including the gas-phase metallicity, galaxy size (), and IRX, to better align with the observational trends. Notably, the corrections related to gas-phase metallicity emerge as the primary driver of deviations in the predicted universal IRX relation. The gas-phase metallicity decides the power indices of four terms in the universal IRX relation given in Equation 1, and thus the correction to metallicity induces changes to all of the four terms. In contrast, the correction to either or only leads to change related a single term. Our results have shown that the predicted and observed IRX relations globally agree with each other at and deviation between the two becomes increasingly larger at increasing redshift. The deviation is jointly contributed by the systematic discrepancies of multiple galaxy parameters, particularly for the EAGLE SFGs at the low-IRX and high-IRX ends. There are some severe disparities in the power indices of the universal IRX relation in the EAGLE simulations and the observations. These indices hold immense promise as a valuable diagnostic tools for refining hydrodynamical cosmological simulations like EAGLE, offering the potential to resolve simultaneously issues associated with star formation rates, chemical enrichment processes, and the evolving structural characteristics of galaxies.
Looking ahead, we make suggestions for the next-generation cosmological simulations. A possibility of the discrepancies highlighted in our study is that the geometry of the dust and stars is not considered/resolved in the EAGLE simulations, a limitation that is common among current cosmological simulations performing over large volumes, although the distribution of stars and dust is to some extent resolved through the particles or resolution elements. This can be a severe limitation at low redshifts since with increasing gas-phase metallicity the molecular clouds become larger, and consequently the dust attenuation of galaxies. In contrast, SED fitting usually imposes a star-dust geometry through the choice of attenuation curves. The IRX will depend on this choice as well if the SED does not cover the infrared. Simulations with higher resolution (including a range of high resolution zoom-in simulations) may address the issue. Second, we note that models may need to generate galaxies with elevated star formation rates and low metallicities, particularly at high redshifts. More galaxy inflows and more outflows at high redshifts could lead to a decrease of the gas-phase metallicity and hence higher star formation rates. However, these changes are not trivial to implement due to the fact that there is a complex interplay between these processes (Agertz & Kravtsov, 2015; Tescari et al., 2014; Blanc et al., 2019; Jecmen & Oey, 2023). In addition, it is challenging to reproduce some key observables simultaneously. For example, by decreasing feedback at higher redshifts, higher star formation rates would be achieved and indeed a better agreement between IR derived star formation rate functions and EAGLE could exist (Katsianis et al., 2017b). However, this change if not addressed properly will affect the comparison with the stellar mass function at , which is well described by the original model (Furlong et al., 2015). Resolution effects are demonstrated to impact the results of cosmological simulations. This makes particularly challenging the implementation of sub-grid schemes and uncoupling the physics from the numerical limitations (Zhao et al., 2020). Last but not least, dust physics and dust grain evolution have not been followed in detail in the EAGLE simulations. We note that the integration of realistic dust physics and an improved understanding of dust attenuation within galaxies across a diverse array of parameters will likely be pivotal in enhancing the robustness of our simulations.
5 SUMMARY
In this study, we use the reference model Ref-L0100N1504 from the EAGLE simulations to investigate the predicted universal IRX relation in comparison with the observed one. We quantify the discrepancies of galaxy parameters between the EAGLE simulations and the observations using the observed scaling relations (–, –, –SFR and –IRX relation), and examine which parameters cause the deviation between the predicted and the observed universal IRX relation. Moreover, we also address the dependence of IRX on the gas-phase metallicity and other quantities. We arrive at the following conclusions:
-
i)
The predicted universal IRX relation by the EAGLE simulations follows the observations at , but exhibits increasing deviation at increasing redshift, particularly for SFGs at the low-IRX and high-IRX end.
-
ii)
We modify the predicted universal IRX relation from the EAGLE simulations by considering corrections to the individual galaxy parameter (, , or and IRX) related to it. We illustrates that the gas-phase metallicity holds the dominant role on the universal IRX relation, whereas the , and IRX only slightly impact the predicted universal IRX relation. This is consistent with the understanding based on the observational analysis given in Qin et al. (2019).
-
iii)
Overall, besides its successes, the EAGLE simulations are not able to describe the dependence of IRX and other galaxy parameters on the gas-phase metallicity. This results in strong deviations for the power indices in the predicted universal IRX relation. We stress that these power indices can be used as effective probes for hydrodynamical cosmological simulations like EAGLE to reconcile issues related to star formation, chemical enrichment and structural evolution of galaxies in a single/consistent framework.
The EAGLE cosmological hydrodynamical simulations successfully reproduce many aspects of galaxies and structures in the Universe. The universal IRX relation is a powerful tool to test the simulations on modeling metal enrichment of the ISM in conjunction with star formation and structure growth of galaxies. Our investigations suggest that next generation sophisticated simulations should generate galaxies with higher star formation rate and lower metallicity at high redshift. This can be addressed by adding more realistic dust physics and reproducing dust attenuation for galaxies over wide parameter ranges.
Acknowledgements
We thank the anonymous referee for her/his valuable comments and suggestions that improved this manuscript. This work is supported by the National Key Research and Development Program of China (2023YFA1608100), the National Natural Science Foundation of China (12073078, 12233005, 12173088 and 12033004), and the science research grants from the China Manned Space Project with NO. CMS-CSST-2021-A02, CMS-CSST-2021-A04 and CMS-CSST-2021-A07. AK thanks the 100 talents Program offered by the Sun Yat-sen University. We acknowledge the Virgo Consortium for making their simulation data available. The EAGLE simulations were performed using the DiRAC-2 facility at Durham, managed by the ICC, and the PRACE facility Curie based in France at TGCC, CEA, Bruyéresle-Châtel.
Data Availability
The data underlying this article are publicly available at http://www.eaglesim.org/database.php.
References
- Agertz & Kravtsov (2015) Agertz O., Kravtsov A. V., 2015, ApJ, 804, 18
- Álvarez-Márquez et al. (2016) Álvarez-Márquez J., et al., 2016, A&A, 587, A122
- Baes et al. (2011) Baes M., Verstappen J., De Looze I., Fritz J., Saftly W., Vidal Pérez E., Stalevski M., Valcke S., 2011, ApJS, 196, 22
- Baes et al. (2019) Baes M., Trčka A., Camps P., Nersesian A., Trayford J., Theuns T., Dobbels W., 2019, MNRAS, 484, 4069
- Battisti et al. (2016) Battisti A. J., Calzetti D., Chary R. R., 2016, ApJ, 818, 13
- Bell et al. (2005) Bell E. F., et al., 2005, ApJ, 625, 23
- Bellstedt et al. (2021) Bellstedt S., et al., 2021, MNRAS, 503, 3309
- Blanc et al. (2019) Blanc G. A., Lu Y., Benson A., Katsianis A., Barraza M., 2019, ApJ, 877, 6
- Boquien et al. (2019) Boquien M., Burgarella D., Roehlly Y., Buat V., Ciesla L., Corre D., Inoue A. K., Salas H., 2019, A&A, 622, A103
- Bourne et al. (2017) Bourne N., et al., 2017, MNRAS, 467, 1360
- Bouwens et al. (2016) Bouwens R. J., et al., 2016, ApJ, 833, 72
- Bruzual & Charlot (2003) Bruzual G., Charlot S., 2003, MNRAS, 344, 1000
- Calzetti (2001) Calzetti D., 2001, PASP, 113, 1449
- Calzetti et al. (2000) Calzetti D., Armus L., Bohlin R. C., Kinney A. L., Koornneef J., Storchi-Bergmann T., 2000, ApJ, 533, 682
- Camps & Baes (2015) Camps P., Baes M., 2015, Astronomy and Computing, 9, 20
- Camps et al. (2016) Camps P., Trayford J. W., Baes M., Theuns T., Schaller M., Schaye J., 2016, MNRAS, 462, 1057
- Camps et al. (2018) Camps P., et al., 2018, ApJS, 234, 20
- Casasola et al. (2020) Casasola V., et al., 2020, A&A, 633, A100
- Chabrier (2003) Chabrier G., 2003, PASP, 115, 763
- Cochrane et al. (2023) Cochrane R. K., Hayward C. C., Anglés-Alcázar D., Somerville R. S., 2023, MNRAS, 518, 5522
- Conroy (2013) Conroy C., 2013, ARA&A, 51, 393
- Crain et al. (2015) Crain R. A., et al., 2015, MNRAS, 450, 1937
- Curti et al. (2020) Curti M., Mannucci F., Cresci G., Maiolino R., 2020, MNRAS, 491, 944
- Das et al. (2023) Das A., Pandey B., Sarkar S., 2023, arXiv e-prints, p. arXiv:2303.16826
- Davé et al. (2019) Davé R., Anglés-Alcázar D., Narayanan D., Li Q., Rafieferantsoa M. H., Appleby S., 2019, MNRAS, 486, 2827
- De Rossi et al. (2017) De Rossi M. E., Bower R. G., Font A. S., Schaye J., Theuns T., 2017, MNRAS, 472, 3354
- De Vis et al. (2019) De Vis P., et al., 2019, A&A, 623, A5
- Dolag et al. (2009) Dolag K., Borgani S., Murante G., Springel V., 2009, MNRAS, 399, 497
- Draine & Li (2007) Draine B. T., Li A., 2007, ApJ, 657, 810
- Durier & Dalla Vecchia (2012) Durier F., Dalla Vecchia C., 2012, MNRAS, 419, 465
- Evans et al. (2022) Evans T. A., Fattahi A., Deason A. J., Frenk C. S., 2022, MNRAS, 516, 3861
- Furlong et al. (2015) Furlong M., et al., 2015, MNRAS, 450, 4486
- Furlong et al. (2017) Furlong M., et al., 2017, MNRAS, 465, 722
- Galliano et al. (2018) Galliano F., Galametz M., Jones A. P., 2018, ARA&A, 56, 673
- Garn & Best (2010) Garn T., Best P. N., 2010, MNRAS, 409, 421
- Genzel et al. (2013) Genzel R., et al., 2013, ApJ, 773, 68
- Genzel et al. (2015) Genzel R., et al., 2015, ApJ, 800, 20
- Groves et al. (2008) Groves B., Dopita M. A., Sutherland R. S., Kewley L. J., Fischera J., Leitherer C., Brandl B., van Breugel W., 2008, ApJS, 176, 438
- Hahn et al. (2022) Hahn C., et al., 2022, ApJ, 926, 122
- Heckman et al. (1998) Heckman T. M., Robert C., Leitherer C., Garnett D. R., van der Rydt F., 1998, ApJ, 503, 646
- Heinis et al. (2013) Heinis S., et al., 2013, MNRAS, 429, 1113
- Heinis et al. (2014) Heinis S., et al., 2014, MNRAS, 437, 1268
- Ichikawa et al. (2012) Ichikawa K., Ueda Y., Terashima Y., Oyabu S., Gandhi P., Matsuta K., Nakagawa T., 2012, ApJ, 754, 45
- Jecmen & Oey (2023) Jecmen M. C., Oey M. S., 2023, ApJ, 958, 149
- Katsianis et al. (2017a) Katsianis A., Tescari E., Blanc G., Sargent M., 2017a, MNRAS, 464, 4977
- Katsianis et al. (2017b) Katsianis A., et al., 2017b, MNRAS, 472, 919
- Katsianis et al. (2019) Katsianis A., et al., 2019, ApJ, 879, 11
- Katsianis et al. (2020) Katsianis A., et al., 2020, MNRAS, 492, 5592
- Katsianis et al. (2021a) Katsianis A., et al., 2021a, MNRAS, 500, 2036
- Katsianis et al. (2021b) Katsianis A., Yang X., Zheng X., 2021b, ApJ, 919, 88
- Katsianis et al. (2023) Katsianis A., Yang X., Fong M., Wang J., 2023, MNRAS, 523, 1538
- Keller et al. (2023) Keller B. W., Munshi F., Trebitsch M., Tremmel M., 2023, ApJ, 943, L28
- Kennicutt (1998) Kennicutt Robert C. J., 1998, ApJ, 498, 541
- Kouroumpatzakis et al. (2023) Kouroumpatzakis K., Zezas A., Kyritsis E., Salim S., Svoboda J., 2023, A&A, 673, A16
- Lee et al. (2015) Lee N., et al., 2015, ApJ, 801, 80
- Leja et al. (2022) Leja J., et al., 2022, ApJ, 936, 165
- Lewis et al. (2023) Lewis Z. J., et al., 2023, arXiv e-prints, p. arXiv:2304.12343
- Li et al. (2022) Li X., Li C., Mo H. J., Xiao T., Wang J., 2022, ApJ, 941, 48
- Lovell et al. (2022) Lovell C. C., Wilkins S. M., Thomas P. A., Schaller M., Baugh C. M., Fabbian G., Bahé Y., 2022, MNRAS, 509, 5046
- Matthee & Schaye (2019) Matthee J., Schaye J., 2019, MNRAS, 484, 915
- McAlpine et al. (2016) McAlpine S., et al., 2016, Astronomy and Computing, 15, 72
- McLure et al. (2018) McLure R. J., et al., 2018, MNRAS, 476, 3991
- Meurer et al. (1999) Meurer G. R., Heckman T. M., Calzetti D., 1999, ApJ, 521, 64
- Miller et al. (2023) Miller T. B., van Dokkum P., Mowla L., 2023, ApJ, 945, 155
- Mo et al. (2010) Mo H., van den Bosch F. C., White S., 2010, Galaxy Formation and Evolution
- Naddaf & Czerny (2022) Naddaf M. H., Czerny B., 2022, A&A, 663, A77
- Nedkova et al. (2021) Nedkova K. V., et al., 2021, MNRAS, 506, 928
- Péroux & Howk (2020) Péroux C., Howk J. C., 2020, ARA&A, 58, 363
- Petit et al. (2023) Petit Q., Ducourant C., Slezak E., Sluse D., Delchambre L., 2023, A&A, 669, A132
- Picouet et al. (2023) Picouet V., et al., 2023, arXiv e-prints, p. arXiv:2305.05504
- Popesso et al. (2023) Popesso P., et al., 2023, MNRAS, 519, 1526
- Popping et al. (2017) Popping G., Somerville R. S., Galametz M., 2017, MNRAS, 471, 3152
- Qin et al. (2019) Qin J., Zheng X. Z., Wuyts S., Pan Z., Ren J., 2019, MNRAS, 485, 5733
- Saintonge & Catinella (2022) Saintonge A., Catinella B., 2022, ARA&A, 60, 319
- Salim & Narayanan (2020) Salim S., Narayanan D., 2020, ARA&A, 58, 529
- Sanders et al. (2021) Sanders R. L., et al., 2021, ApJ, 914, 19
- Sanders et al. (2023) Sanders R. L., et al., 2023, ApJ, 942, 24
- Schaye (2004) Schaye J., 2004, ApJ, 609, 667
- Schaye & Dalla Vecchia (2008) Schaye J., Dalla Vecchia C., 2008, MNRAS, 383, 1210
- Schaye et al. (2015) Schaye J., et al., 2015, MNRAS, 446, 521
- Shapley et al. (2022) Shapley A. E., et al., 2022, ApJ, 926, 145
- Shen et al. (2003) Shen S., Mo H. J., White S. D. M., Blanton M. R., Kauffmann G., Voges W., Brinkmann J., Csabai I., 2003, MNRAS, 343, 978
- Shibuya et al. (2015) Shibuya T., Ouchi M., Harikane Y., 2015, ApJS, 219, 15
- Springel (2005) Springel V., 2005, MNRAS, 364, 1105
- Springel et al. (2001) Springel V., White S. D. M., Tormen G., Kauffmann G., 2001, MNRAS, 328, 726
- Suess et al. (2019a) Suess K. A., Kriek M., Price S. H., Barro G., 2019a, ApJ, 877, 103
- Suess et al. (2019b) Suess K. A., Kriek M., Price S. H., Barro G., 2019b, ApJ, 885, L22
- Tejos et al. (2021) Tejos N., et al., 2021, MNRAS, 507, 663
- Tescari et al. (2014) Tescari E., Katsianis A., Wyithe J. S. B., Dolag K., Tornatore L., Barai P., Viel M., Borgani S., 2014, MNRAS, 438, 3490
- Thompson et al. (2015) Thompson T. A., Fabian A. C., Quataert E., Murray N., 2015, MNRAS, 449, 147
- Thorne et al. (2021) Thorne J. E., et al., 2021, MNRAS, 505, 540
- Trayford et al. (2017) Trayford J. W., et al., 2017, MNRAS, 470, 771
- Trayford et al. (2020) Trayford J. W., Lagos C. d. P., Robotham A. S. G., Obreschkow D., 2020, MNRAS, 491, 3937
- Trčka et al. (2020) Trčka A., et al., 2020, MNRAS, 494, 2823
- Tumlinson et al. (2017) Tumlinson J., Peeples M. S., Werk J. K., 2017, ARA&A, 55, 389
- van den Bosch et al. (2002) van den Bosch F. C., Abel T., Croft R. A. C., Hernquist L., White S. D. M., 2002, ApJ, 576, 21
- Ward et al. (2022) Ward S. R., Harrison C. M., Costa T., Mainieri V., 2022, MNRAS, 514, 2936
- Whitaker et al. (2014) Whitaker K. E., et al., 2014, ApJ, 795, 104
- Wiersma et al. (2009) Wiersma R. P. C., Schaye J., Theuns T., Dalla Vecchia C., Tornatore L., 2009, MNRAS, 399, 574
- Wuyts et al. (2011) Wuyts S., et al., 2011, ApJ, 742, 96
- Wuyts et al. (2016) Wuyts E., et al., 2016, ApJ, 827, 74
- Xiao et al. (2012) Xiao T., Wang T., Wang H., Zhou H., Lu H., Dong X., 2012, MNRAS, 421, 486
- Yang et al. (2021) Yang L., Roberts-Borsani G., Treu T., Birrer S., Morishita T., Bradač M., 2021, MNRAS, 501, 1028
- Zahid et al. (2017) Zahid H. J., Kudritzki R.-P., Conroy C., Andrews B., Ho I. T., 2017, ApJ, 847, 18
- Zhao et al. (2020) Zhao P., Xu H., Katsianis A., Yang X.-H., 2020, Research in Astronomy and Astrophysics, 20, 195
- Zubko et al. (2004) Zubko V., Dwek E., Arendt R. G., 2004, ApJS, 152, 211
- de Graaff et al. (2022) de Graaff A., Trayford J., Franx M., Schaller M., Schaye J., van der Wel A., 2022, MNRAS, 511, 2544
- van der Wel et al. (2014) van der Wel A., et al., 2014, ApJ, 788, 28
Appendix A Ancillary Figures
Figures 8 to 15 present more results from our analysis to support our conclusions. Details can be found in the caption of each plot.