VoroNav: Voronoi-based Zero-shot Object Navigation
with Large Language Model
Abstract
In the realm of household robotics, the Zero-Shot Object Navigation (ZSON) task empowers agents to adeptly traverse unfamiliar environments and locate objects from novel categories without prior explicit training. This paper introduces VoroNav, a novel semantic exploration framework that proposes the Reduced Voronoi Graph to extract exploratory paths and planning nodes from a semantic map constructed in real time. By harnessing topological and semantic information, VoroNav designs text-based descriptions of paths and images that are readily interpretable by a large language model (LLM). In particular, our approach presents a synergy of path and farsight descriptions to represent the environmental context, enabling LLM to apply commonsense reasoning to ascertain waypoints for navigation. Extensive evaluation on HM3D and HSSD validates VoroNav surpasses existing benchmarks in both success rate and exploration efficiency (absolute improvement: +2.8% Success and +3.7% SPL on HM3D, +2.6% Success and +3.8% SPL on HSSD). Additionally introduced metrics that evaluate obstacle avoidance proficiency and perceptual efficiency further corroborate the enhancements achieved by our method in ZSON planning. Project page: https://voro-nav.github.io
1 Introduction
Navigation capability holds great significance for household robots, enabling these machines to effectively reach designated areas and complete various subsequent tasks. Within this context, Zero-Shot Object Navigation (ZSON) demands
that an agent have the ability to move toward a target object of an unfamiliar category by leveraging scene reasoning, a capability essential for the performance of diverse complex tasks by household robots. The core of ZSON centers on making good use of general commonsense to steer agents for exploration with minimal movement cost and accurate localization of a novel target object.
Current ZSON methods can be categorized into two types: end-to-end, network-based navigation (Majumdar et al., 2022; Park et al., 2023; Zhao et al., 2023; Chen et al., 2023a; Gadre et al., 2023); and modular, map-based navigation (Zhou et al., 2023; Gadre et al., 2023; Chen et al., 2023b). The end-to-end methods use reinforcement or imitation learning for training policy networks, and are designed for mapping directly from RGB-D images to actions. However, the end-to-end model’s output lacks interpretability and necessitates a substantial amount of training data, and exhibits serious inefficiency problems of back-and-forth redundant movement regarding the actual performance.
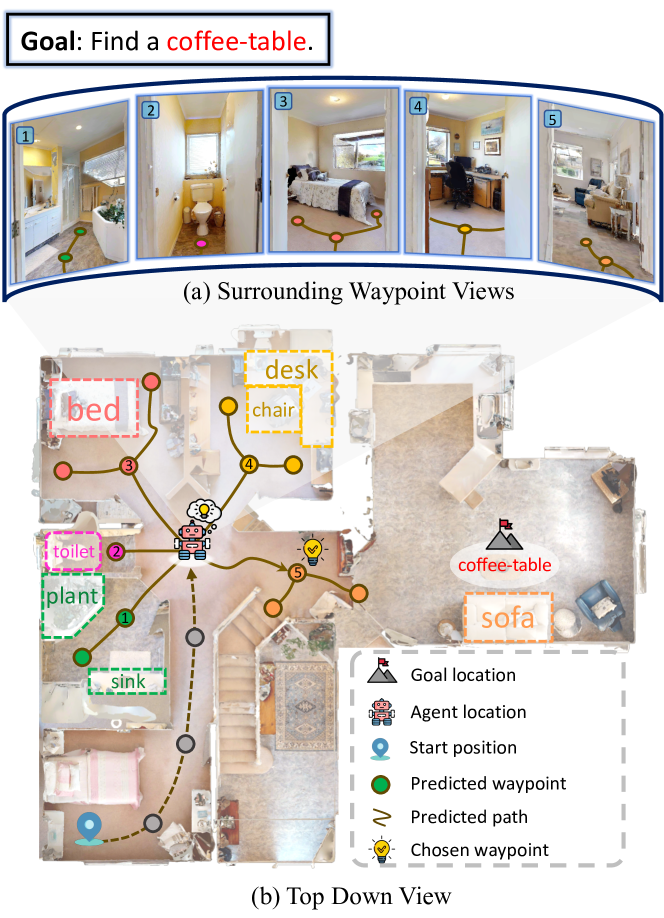
Map-based methods leverage maps to store historical topology information for planning purposes. Map-based navigation frameworks usually plan new waypoints either every predetermined number of steps or when the increment in map building reaches a specific threshold. However, the selected waypoints usually come short of optimal positions for decision-making. This occurs because the agent could arrive at an intersection with massive information and potentially uncover expansive unseen areas by just one more step from here, which can bring huge benefits to scene reasoning and task planning. Yet, such benefits may not be obtained using the traditional strategy of choosing waypoints, for they would not actively identify informative points as waypoints. Just imagine that you are looking for an object, walking down a long corridor, and encountering the scene shown in Figure 1 (b). Would you be more inclined to halt at the intersection, take a moment to observe your surroundings, and then make a thoughtful decision after comparing the adjacent areas? Therefore, this study puts insight into the positive impact of making decisions at intersections in the field of navigation, and develops a Reduced Voronoi Graph (RVG) generation approach to distill intersection points and viable pathways from the real-time built map. Utilizing graph-structured RVG, we systematize the planning process as navigation subtasks across graph nodes.
Another significant issue faced by existing navigation algorithms is the integral representation of observed scenes for subsequent planning. When presented with RGB images, network-based approaches leverage semantic embeddings to identify novel object categories and utilize recurrent policy networks to directly predict optimal actions (Khandelwal et al., 2022); Conversely, map-based methods mostly employ an open-set detector to segment RGB images, which, in conjunction with depth data and pose information, are utilized to construct a semantic map. By interpreting the representation of the semantic map, the next subgoal point is selected (Chaplot et al., 2020). Each method, however, presents distinct limitations: network-based methods struggle with low exploration efficiency and constrained planning memory that is limited by implicit scene representation and network size, whereas map-based methods only build maps within the field of view of the depth camera, thus unable to integrate information beyond the depth sensing range to plan informed waypoints. To overcome these limitations, it is essential for the agent to fuse the observations of both maps and images, comprehensively understand both modalities, and make appropriate decisions.
To provide a direct response, we adopt the large language model (LLM) as a cognitive engine for spatial reasoning to understand various scenes. The custom-designed prompts are developed to effectively integrate observations of maps and images, considering the preference of LLM. Previous studies (Zhou et al., 2023; Yu et al., 2023b) have collected objects around frontier points to depict the scenes of the exploration areas, and then employed LLMs to infer probable locations of the target. While these foundational applications established a groundwork for guiding navigation with LLM, we reimagine these principles by imitating human exploratory behaviors. Specifically, human exploration typically involves scene description from two perspectives: the egocentric view and the scenes along traversable paths. Descriptions that align analogously with human cognition ensure that the resulting prompts are closer to human corpora (Beckner et al., 2009; Lai et al., 2018), and previous works (Brown et al., 2020; Naveed et al., 2023) show that LLM typically exhibits enhanced performance when dealing with natural language problems similar to the corpora. Starting from this standpoint, we formulate the prompt by generating descriptions of paths (scenes along traversable paths) and farsight images (egocentric view), thereby promoting LLM’s understanding of the observed scenes.
The ZSON task requires the agent to find the target at the lowest path cost. The reasoning results of LLM can guide the agent in predicting the probable locations of the target, but struggle to handle the problem of exploration. So we design a hierarchical reward mechanism that combines the topological information of the map and the suggestions provided by LLM. This mechanism evaluates the exploration significance, path efficiency, and commonsense tendencies of each candidate waypoint on the RVG, thereby facilitating more informed decision-making.
Our contributions can be summarized as follows:
-
•
We introduce Voronoi-based scene graph generation for ZSON, designed to select waypoints that provide a wealth of observation data to facilitate subsequent planning processes.
-
•
We design an innovative prompting strategy of scene representation that combines both path and farsight descriptions to provide holistic scene descriptions for LLM to analyze and evaluate.
-
•
We propose a decision-making policy that necessitates deliberation among exploration, path efficiency, and commonsense tendencies to yield rational actions.
- •
2 Related Work
2.1 Zero-shot Object Navigation
In contrast to conventional object navigation, ZSON aims to locate objects of unfamiliar categories and attain high exploration efficiency. Image-based ZSON works (Majumdar et al., 2022; Al-Halah et al., 2022; Gadre et al., 2023) map the egocentric images and target object instructions to the embedding spaces, utilizing a trained policy network to predict subsequent actions. In contrast, map-based ZSON works mostly adopt hierarchical structures, integrated with zero-shot object detectors that identify target objects. These approaches make informed decisions by leveraging prior knowledge of object relationships (Chen et al., 2023b) or by employing large language models (Zhou et al., 2023; Yu et al., 2023b; Shah et al., 2023).
2.2 Scene Representation for Navigation
In the hierarchical framework of visual navigation, scene representation is used to process the received observation information into an explicit structure that can be directly utilized by subsequent decision-making. Frontier-based works (Ramakrishnan et al., 2022; Chen et al., 2023b; Gadre et al., 2023; Gervet et al., 2023) model semantic information into frontiers extracted by online grid maps to complete exploration with specific tasks. Graph-based works predict waypoints directly from RGB-D images (Krantz et al., 2020, 2021; An et al., 2023) or from sparsified maps (Li et al., 2020; Kwon et al., 2023; Liu et al., 2023a) to represent the environment as topological maps, integrating geographic and semantic information into nodes for waypoint navigation.
2.3 LLM Guided Navigation
LLMs have become a new way of prior-knowledge reasoning in navigation due to its powerful information processing and generative capabilities. For example, Zhou et al. (2023) use LLM to predict the degree of correlation with the target object at the object level and the room level to infer where is the most likely location of the target object. Yu et al. (2023b) generate clusters of unexplored areas by frontiers, and leverage LLM to infer the correlation between the target object and the objects contained within each cluster to navigate to the scene closer to the target object. Gadre et al. (2023) adopt LLM to provide prior information at the object level to assist in target object localization. Shah et al. (2023) feed chain-of-thought(CoT) into LLM for navigation that encourages exploration of areas with higher relevance while concurrently avoiding moving to areas that are unrelated to the target object. Cai et al. (2023) cluster panoramic images into scene nodes by LLM, use CoT of LLM to determine whether exploration or exploitation, select the image with the highest likelihood of finding the target object, and navigate accordingly based on the chosen image. Yu et al. (2023a) apply the decision-making of LLM for multi-robot collaborative navigation, and the LLM centrally plans the mid-term goal for each robot by extracting information such as obstacles, frontiers, object coordinates, and robot states from online maps.
3 VoroNav Approach
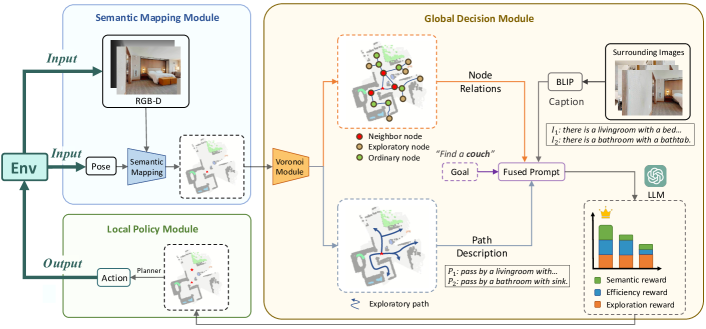
This section first introduces the task definition of ZSON (Section 3.1). Subsequently, the modules of the VoroNav framework are introduced. As shown in Figure 2, VoroNav constructs a semantic map in Semantic Mapping Module (Section 3.2), then determines the mid-term goal in Global Decision Module (Section 3.3), and finally plans local motion and selects a discrete action in Local Policy Module (Section 3.4).
3.1 Task Definition of ZSON
Traditional supervised object navigation relies on the knowledge or reward from the training data to predict the optimal action and is limited to navigating to targets within a closed set of known categories . However, the ZSON task requires neither purposeful training nor closely linked prior knowledge for navigation toward a novel set of object types . Initially, the agent is placed at a designated start point and is given the category of the target to find. The agent’s observation includes RGB-D images and the real-time pose in the environment . An effective decision-making framework needs to be developed to leverage these observed data to understand and deduce the environment, aiming to predict the likely position of the target object. The agent is required to explore the environment according to its planning module until it discovers the target, after which it should proceed toward the target. Success is achieved when the agent reaches a geodesic distance of less than meters from the target and executes a “Stop” command. Conversely, the task is deemed failed if the agent either exceeds the maximum step count without finding the target or executes the “Stop” action at a distance greater than meters from the target.
3.2 The Semantic Mapping Module
We maintain a 2D semantic map by processing RGB-D images and poses . This semantic map is structured as a grid, where denotes the dimensions of the map’s width and height, and indicates the total number of channels within the map. These channels comprise categorical maps, an obstacle map, and an explored map, which correspond to detected object regions, obstacle regions, and observed regions, respectively. Given the depth image and the agent’s pose, 3D point clouds are generated. All point clouds near the floor are assigned to the explored map representing the feasible area to travel through, whereas those at other heights are mapped into the obstacle map. Meanwhile, we predict the category masks of the RGB image by Grounded-SAM (Liu et al., 2023b; Kirillov et al., 2023) and map the masks into 3D semantic point clouds using the depth information and the agent’s pose. The 3D point clouds with categorical information are correspondingly mapped to categorical map channels.
3.3 The Global Decision Module
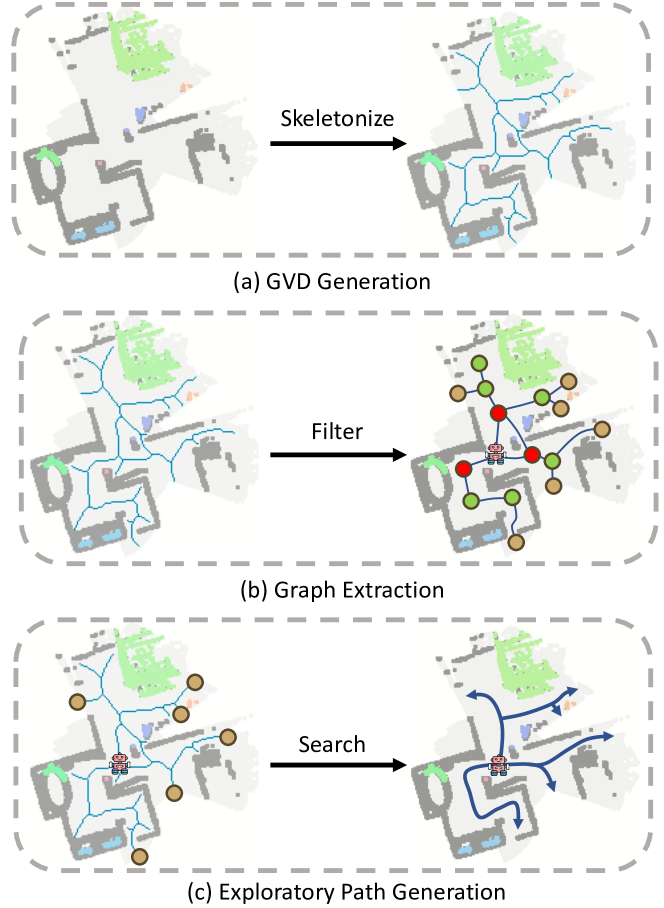
Graph Extraction. The Generalized Voronoi Diagram (GVD) of a map depicts a set of points that are equidistant from the two closest obstacle points, representing the medial-axis pathway of unoccupied space outside the obstacles of arbitrary shape. Let be the map space and denote the area occupied by obstacles on the map. The point set of GVD can be represented as follows:
| (1) |
where represents any point within the obstacles , the function denotes the Euclidean distance between two points, while signifies the positive Euclidean Signed Distance Field (ESDF), which is defined as follows:
| (2) |
where indicates the boundary of the obstacles.
Given the obstacle and explored maps, we can obtain the GVD points from these maps and construct RVG to represent the observed spaces111The process for generating RVG is detailed in Section A.1 . We then classify the RVG nodes into four categories based on the node positions: agent nodes, neighbor nodes, exploratory nodes, and ordinary nodes. Specifically, the node closest to the agent is designated as the agent node, representing the agent’s current decision-making position; The nodes directly connected to the agent node are considered neighbor nodes for subsequent planning; The nodes adjacent to unexplored areas with a single connecting edge are classified as exploratory nodes. All the other nodes are categorized as ordinary nodes.
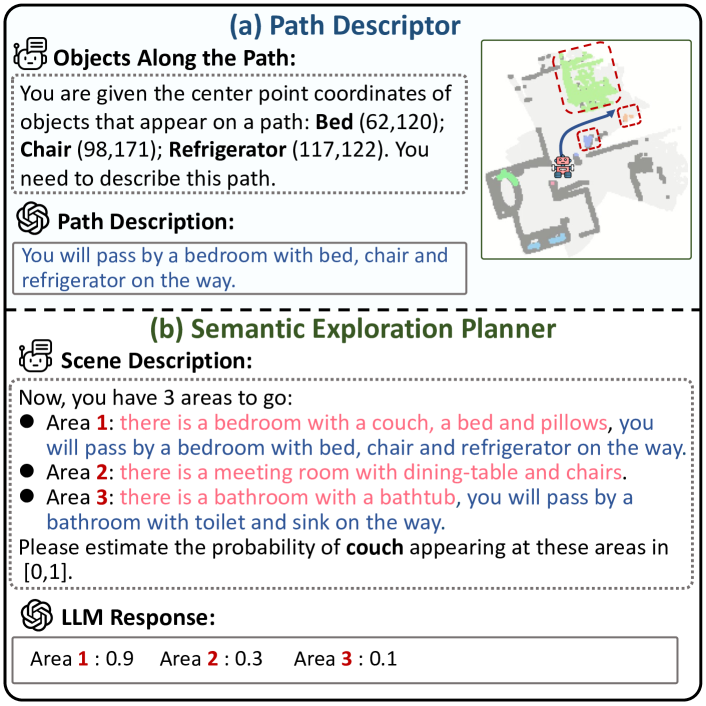
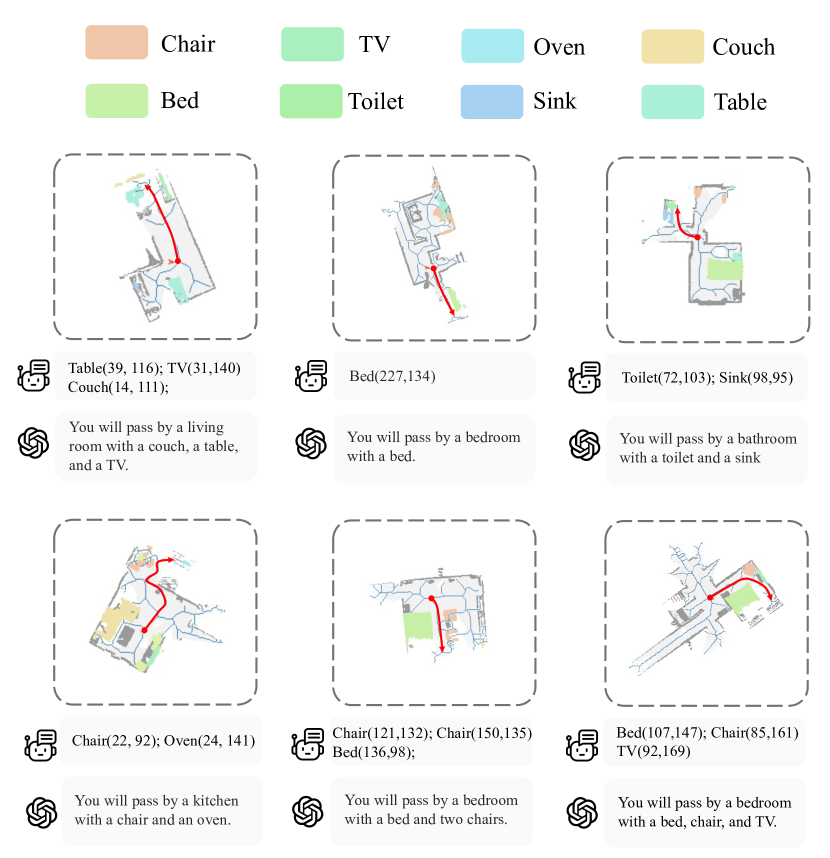
Path Description. We generate navigable paths formed by RVG edges and create text descriptions that embody the scene along each path, as shown in Figure 3 (a). To be specific, given exploratory nodes, we leverage the Wavefront Propagation method (Kalra et al., 2009) to obtain the shortest path from the agent node to the exploratory node on the GVD and compile all the paths into a set , as shown in Figure 6 (c). To generate the semantic description of each path , we gather from the semantic map the occurrence of objects along the exploratory path and the objects’ central locations . Assuming paths within the set all pass through the neighbor node , prompts of the form Template are generated for the neighbor node , by collecting and summarizing the semantic information along the paths in . The function Template processes the input data, converting it into the textual form and integrating it with predefined templates to create a format conducive to conversational interactions with LLM (refer to Figure 3 (a): Objects Along the Path). Afterward, to distill the fragmented and unstructured path information into a coherent format, we employ GPT-3.5 (Ouyang et al., 2022), which possesses robust comprehension and generative capabilities, for creating the scene descriptions along paths that traverse each neighbor node (refer to Figure 3 (a): Path Description). Similarly, assuming there involve neighbor nodes, we describe the scenes of the paths each neighbor node leads to and compile the path descriptions into a set . This process textualizes the scenarios the agent will encounter along possible navigable paths after reaching each neighbor node.
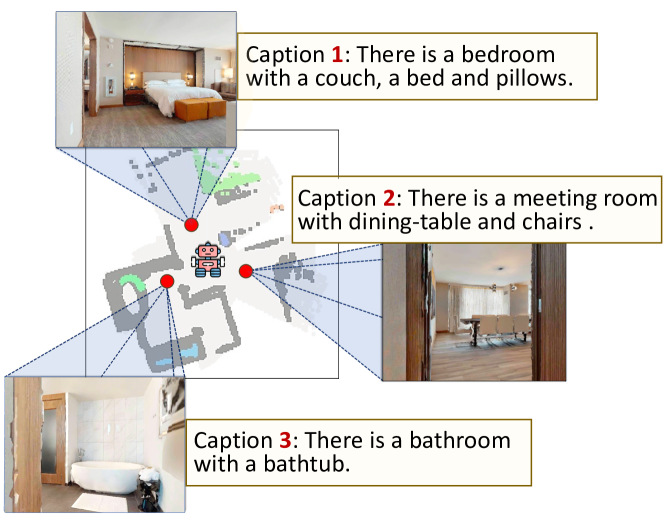
Farsight Description. Path description generation is the process of converting the semantic map into scene descriptions of path form; however, the semantic map is constrained by the depth camera’s limited range, precluding the incorporation of map information beyond its scope. Consequently, semantic descriptions of RGB images of unexplored areas add crucial complementary context for robot navigation. As shown in Figure 4, at the onset of the ZSON task or upon reaching an RVG node, the agent executes a full rotation to capture panoramic images. We then determine the ray on the map that extends from the agent’s current node (agent node) to each neighbor node . The RGB image collected from the full rotation (a full rotation includes turns), whose central Line of Sight (LoS) exhibits the least angular deviation from the ray , is identified as the one () oriented towards the corresponding neighbor node . Let be the central LoS set of , the process of matching images with each neighbor node can be defined as follows:
| (3) |
where the function indicates the angle between two rays on the map. The BLIP model (Li et al., 2022) is then employed to generate descriptions for those images facing different neighbor nodes .
Planning with LLM. We select the mid-term target points by considering three distinct factors: exploration objective, locomotion efficiency (traversed path length), and alignment with typical scene layouts. The rewards for exploration and efficiency are space reasoning results stemming from spatial topology. To encourage the agent to explore the environment, we design a binary exploration reward vector to indicate if there exists an exploratory path from the agent node to each exploratory node that traverses through neighbor nodes. Considering exploration efficiency, we design an efficiency reward vector and assess whether each neighbor node lies within the previously traversed area.
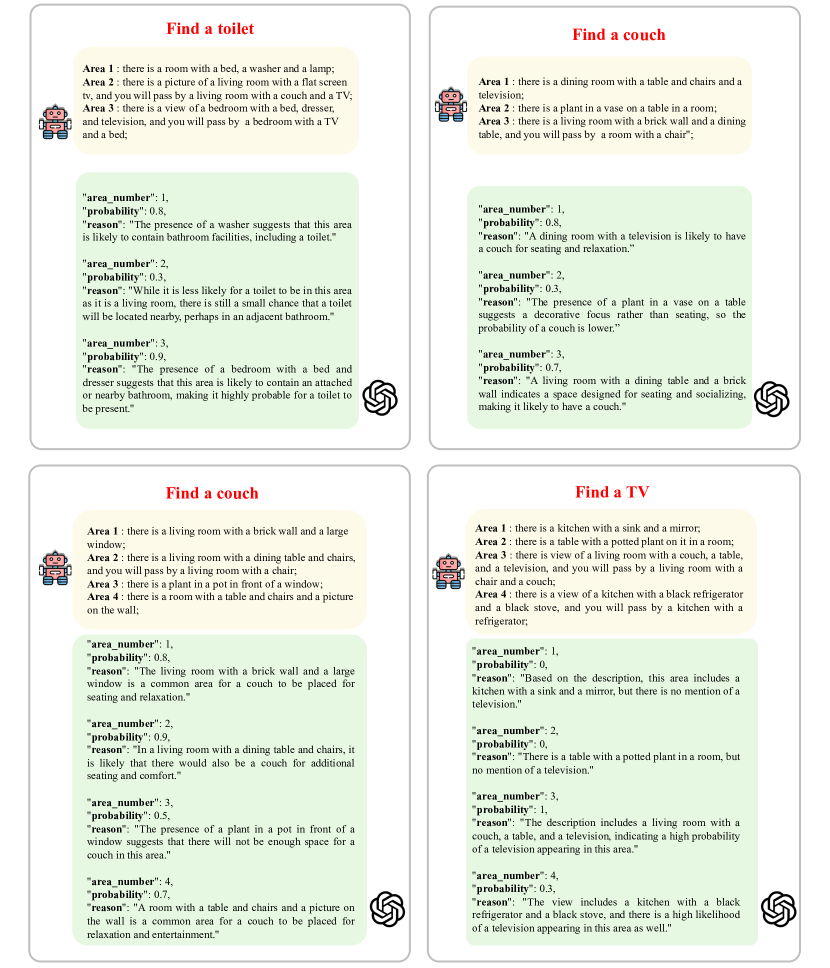
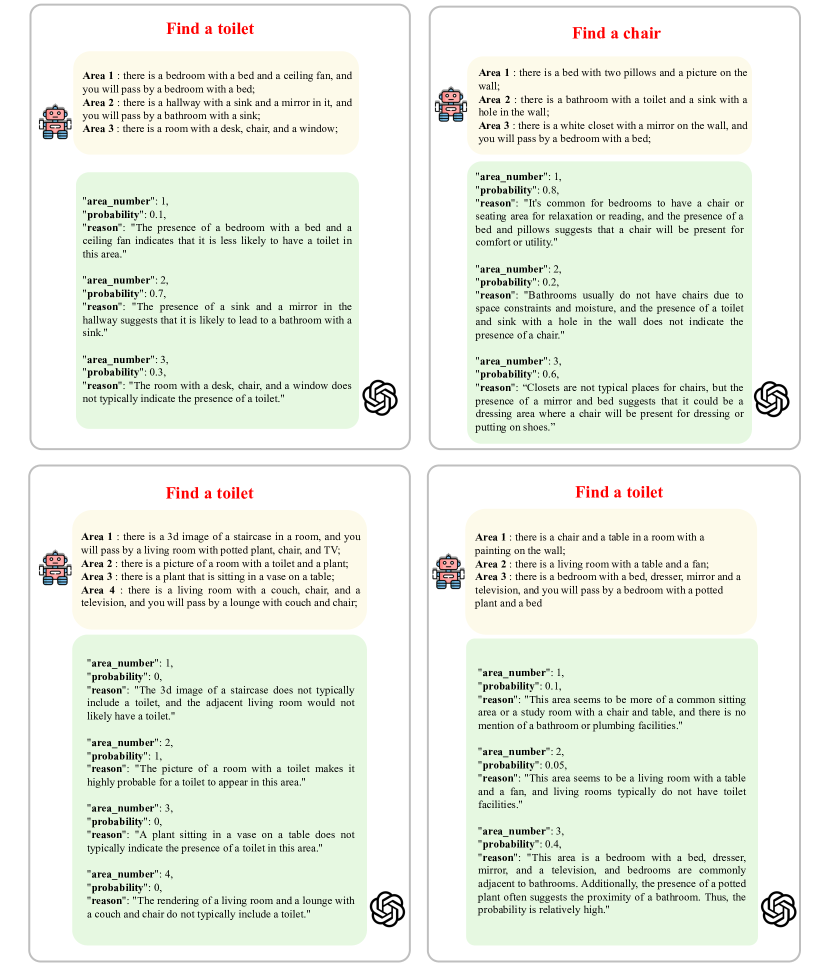
Semantic rewards are reasoning feedback grounded in empirical knowledge and commonsense. The Global Decision Module utilizes the commonsense reasoning capabilities of the large language model, GPT-3.5, to select the most promising goal node for finding or approaching the target object among all neighbor nodes. To this end, we combine the path and farsight descriptions of each neighbor node to generate a specially designed form of prompt that is amenable for GPT-3.5. This enables the LLM to more accurately estimate the probability of the target object’s presence on each neighbor node by detailed prompts, as illustrated in Figure 3 (b). The probabilities given by the LLM’s response are compiled into a semantic reward vector and serve as varying levels of semantic incentive to navigate towards neighbor nodes.
When the agent simultaneously considers exploration, efficiency, and semantic aspects of decision-making, balancing the priority among these factors becomes challenging. To mitigate potential conflicts, we have implemented a hierarchical structure within the reward system. Assuming there are a total of neighbor nodes, the cumulative reward vector is the sum of exploration reward vector , efficiency reward vector and semantic reward vector . The next navigation point selection can be formulated as follows:
| (4) |
where is the standard orthogonal basis composed of n-dimensional coordinate vectors. The decision variable if neighbor node is selected for next navigation waypoint. The reward vectors are defined as follows:
| (5) |
where the dimensional component of is the semantic score of the neighbor node provided by LLM within the interval . The binary coefficient stands for whether the neighbor node is traversed through by exploratory paths () or not (), and denotes whether the neighbor node is covered by historical trajectories () or not (). We establish the hierarchy of priorities for each aspect by assigning different reward weights of the reward vectors as shown in Equation 5 ( Exploration; Efficiency; Semantic).
We select the neighbor node that offers the highest cumulative reward as the next target waypoint for navigation. If the agent’s vision model identifies the target object while exploring, the Semantic Mapping module will map the target’s point cloud onto the existing map , enabling direct path planning toward the target’s location.
3.4 The Local Policy Module
Given the agent’s pose, obstacle map, and target point, we use the Fast Marching Method (Sethian, 1996) to find the shortest path from the current position to the target, which is composed of a sequence of discrete points in the map. The nearest coordinate on this shortest path is selected as an immediate navigation objective for executing actions such as moving forward or turning. Once arriving at a Voronoi node, the agent will rotate and repeat the selection of the mid-term goal.
4 Experiments
| Method | Planner | Training-free | LLM | HM3D | HSSD | ||
|---|---|---|---|---|---|---|---|
| Success | SPL | Success | SPL | ||||
| Random Exploration∗ | Random | - | 26.5 | 9.2 | 30.2 | 12.7 | |
| Frontier (Yamauchi, 1997)∗ | Topological | - | 33.7 | 15.3 | 36.0 | 17.7 | |
| Voronoi∗ | - | 38.7 | 23.3 | 40.3 | 22.2 | ||
| L3MVN (Yu et al., 2023b)∗ | Semantic | GPT-2 | 35.2 | 16.5 | 38.4 | 19.4 | |
| Pixel-Nav (Cai et al., 2023) | × | GPT-4 | 37.9 | 20.5 | - | - | |
| ESC (Zhou et al., 2023) | GPT-3.5 | 39.2 | 22.3 | - | - | ||
| VoroNav (Ours) | GPT-3.5 | 42.0 | 26.0 | 41.0 | 23.2 | ||
In order to assess the navigation capability and exploration efficiency of VoroNav, we carry out extensive experiments on two representative datasets: HM3D and HSSD datasets.
4.1 Baselines and Metrics
Datasets. The HM3D dataset provides high-fidelity reconstructions of entire buildings and contains K validation episodes for object navigation tasks. The HSSD dataset provides high-quality synthetic scenes and contains K validation episodes for object navigation.
Metrics. We adopt Success rate (Success) and Success weighted by Path Length (SPL) as the evaluation metrics (Anderson et al., 2018), which are defined as follows:
-
•
Success represents the percentage of successful episodes to the total number of episodes.
-
•
SPL quantifies the agent’s mobility efficiency in goal-oriented navigation by calculating the inverse ratio of the actual path length traversed to the optimal path length weighted by success rate.
Baselines. We conduct comparative evaluations of VoroNav and several representative baseline planners, including:
-
•
Random Exploration drives the robot to march to randomly sampled points in unexplored areas.
-
•
Frontier (Yamauchi, 1997) is an exploration method that selects the nearest boundary points of unexplored areas and unoccupied areas as the mid-term goals.
-
•
Voronoi corresponds to VoroNav but without considering the semantic reward.
-
•
L3MVN (Yu et al., 2023b) is a region-oriented navigation method that leverages LLM to select the optimal mid-term waypoint by evaluating regions clustered by the frontier points.
-
•
Pixel-Nav (Cai et al., 2023) is image-based zero-shot navigation that analyzes panoramic images and utilizes LLM to determine optimal pixel for exploration.
-
•
ESC (Zhou et al., 2023) is a pioneering method employing an LLM to determine the mid-term goal from the frontier points during exploration.
Note that Random Exploration, Frontier, and Voronoi methods only utilize topological information of the map for planning, while L3MVN, Pixel-Nav, and ESC additionally require semantic information.
4.2 Results and Analysis
4.2.1 Comparison with SOTA Methods
As shown in Table 1, our approach outperforms the best-performing competitor (+2.8% Success and +3.7% SPL on HM3D, +2.6% Success and +3.8% SPL on HSSD). As expected, the Random Exploration method suffers from the blind exploration strategy, resulting in a high likelihood of targeting the wrong areas and walking back and forth during exploration. The Frontier method consistently pursues the closest unexplored boundary, resulting in a more rapid exploration compared to the Random Exploration. Yet, the Frontier method suffers from relatively low efficiency as it fails to prioritize rapidly locating the target at the perception level. The Voronoi method shares similarities with the Frontier method in search for the nearest unexplored point. However, Voronoi enhances the navigation process by proceeding to informative neighbor nodes along the RVG paths, thereby pursuing to uncover larger areas with very few steps. Both L3MVN and ESC adopt the frontier exploration strategy and leverage an LLM to select appropriate frontier points, whereas Pixel-Nav makes decisions after a fixed number of steps, utilizing LLMs to predict the direction with the highest probability of leading to the target, and subsequently employing an RGB-based policy to plan a route and navigate accordingly. These three semantic planning methods uniformly make decisions at predetermined intervals, which can lead to agents determining the mid-term goal in suboptimal positions with insufficient observations, thereby failing to fully unleash the reasoning power of LLM. Our VoroNav method further improves the navigation process while using scene descriptions of broader observations to assist LLM in reasoning and decision-making, thereby achieving better performance.
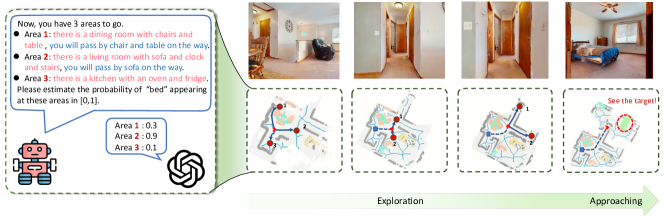
Figure 5 illustrates a successful episode of VoroNav navigating to the target with the help of the RVG and LLM. It visualizes the observations and the environments at four key global decisions in this episode, and the details of a representative LLM decision-making process.
4.2.2 Ablation Study
To manifest the contribution of each module, we compare VoroNav with three ablation models on both HM3D and HSSD datasets. The Voronoi method keeps the same settings as in Section 4.1. The Voro-path method omits the farsight descriptions in VoroNav and depends entirely on the path descriptions, whereas the Voro-farsight method excludes the path descriptions in VoroNav and depends merely on the farsight descriptions for decision-making. As indicated in Table 2, both Voro-path and Voro-farsight show higher Success and SPL than Voronoi, indicating the benefits of integrating semantic information to augment navigation capabilities. Furthermore, VoroNav exhibits superior performance compared to all ablation models, demonstrating the positive outcomes of integrating both path and farsight descriptions to enhance the performance of LLM’s reasoning.
| Method | HM3D | HSSD | ||
|---|---|---|---|---|
| Success | SPL | Success | SPL | |
| Voronoi | 38.7 | 23.3 | 40.3 | 22.2 |
| Voro-path | 40.0 | 24.2 | 40.6 | 23.0 |
| Voro-farsight | 41.2 | 25.2 | 40.8 | 22.7 |
| VoroNav | 42.0 | 26.0 | 41.0 | 23.2 |
4.2.3 Planning Study
To verify that Voronoi-based methods are more suitable for visual navigation compared to Frontier-based methods, we introduce two metrics to evaluate the planning effect of each method: the Success weighted by Collision Avoidance (SCA) and the Success weighted by Explored Area (SEA).
The metric SCA quantifies the proportion of non-collision steps to the total number of agent forward steps weighted by success rate, manifesting the tendency of obstacle avoidance in navigation, which is defined as follows:
| (6) |
where is the total number of episodes, the binary variable indicates whether the episode is successful () or not (). The discount factor is predetermined and varies across datasets. We set in HM3D and in HSSD. The variables and represent the number of collisions and forward steps in the episode.
The metric SEA measures the normalized ratio of the observed region to the path length weighted by success rate, denoting the efficiency of perceiving the surrounding environment, which is defined as follows:
| (7) |
where and signify the area of the explored region and path length in the episode, respectively. The discount factor is also predetermined, and we set in HM3D and in HSSD.
As demonstrated in Table 3, we find that the SCA and SEA of Voronoi-based methods (Voronoi and VoroNav) significantly surpass those of Frontier-based methods (Frontier and L3MVN). The higher SCA score suggests that, throughout the exploration process, the mid-term goals of the Voronoi-based methods are typically chosen at intersections within unoccupied regions, which are less likely to be in proximity to obstacles, thereby reducing the incidence of collisions compared to the frontier-based methods. Specifically, if the agent gets too close to obstacles during navigation, it is easy to encounter blind spots in perceiving the surrounding environment, which can lead to collisions with undetected obstacles that lie within these blind spots during subsequent movement. In contrast, our method involves less movement near obstacles during exploration, allowing for wider unobstructed views and thus more comprehensive observations, resulting in safer navigation. Similarly, a higher SEA score indicates that the Voronoi-based methods favor intersections rich in information, enabling broader areas to be observed with minimal movement. The enhanced perceptual range increases the probability of the agent discovering the target directly. Meanwhile, this strategy yields potentially more valuable scene hints generated by comprehensive perception to inform LLM’s decision-making, thus heightening the chances of locating the target object.
| Method | HM3D | HSSD | ||
|---|---|---|---|---|
| SCA | SEA | SCA | SEA | |
| Frontier | 24.2 | 17.4 | 35.5 | 16.5 |
| Voronoi | 29.4 | 17.9 | 40.2 | 18.6 |
| L3MVN | 27.5 | 17.7 | 37.6 | 16.6 |
| VoroNav | 39.8 | 20.9 | 40.9 | 19.3 |
5 Conclusion
We have presented the VoroNav framework that explores a novel form of graph representation for navigation space and substantially enhances ZSON by using a structured graph-based exploration strategy. Our approach circumvents the limitations of traditional end-to-end and map-based methods by generating informative waypoints and representing the environment with an innovative fusion of text information. The RVG generation module, together with the use of GPT-3.5 for decision-making, leads to more strategic navigation and efficient exploration. By making use of LLM and topologically structured scene graphs, VoroNav sets a new benchmark for ZSON and opens up new pathways for intelligent robotic systems to interact with environments.
Impact Statements
VoroNav, in addressing the challenges of autonomous navigation in robotics, has profound implications for the future of household robotics and AI-driven navigation systems. By leveraging the synergy of semantic mapping and LLMs, it promises enhanced efficiency and effectiveness in robotic navigation tasks, potentially transforming how machines interact with and understand their environments. VoroNav enhances the navigation process with an explicit reasoning process during navigation, using a Reduced Voronoi Graph integrated with LLMs. Ethically, VoroNav represents a stride in responsible AI application, balancing technological advancement with the need for safe, reliable, and intuitive robot behavior in domestic settings. To address safety and ethical concerns, our experiments are conducted in controlled, simulated environments using open-source datasets. This ensures the predictability and safety of the agent’s behaviors. However, the reliability of generative models in practical applications remains an area for future research. Key to this advancement is improving the LLMs’ accuracy and precision in planning and sequential action prediction, crucial for ensuring safety in real-world deployment.
References
- Al-Halah et al. (2022) Al-Halah, Z., Ramakrishnan, S. K., and Grauman, K. Zero experience required: Plug & play modular transfer learning for semantic visual navigation. In Proceedings of the IEEE/CVF Conference on Computer Vision and Pattern Recognition, pp. 17031–17041, 2022.
- An et al. (2023) An, D., Wang, H., Wang, W., Wang, Z., Huang, Y., He, K., and Wang, L. Etpnav: Evolving topological planning for vision-language navigation in continuous environments. arXiv preprint arXiv:2304.03047, 2023.
- Anderson et al. (2018) Anderson, P., Chang, A., Chaplot, D. S., Dosovitskiy, A., Gupta, S., Koltun, V., Kosecka, J., Malik, J., Mottaghi, R., Savva, M., et al. On evaluation of embodied navigation agents. arXiv preprint arXiv:1807.06757, 2018.
- Beckner et al. (2009) Beckner, C., Blythe, R., Bybee, J., Christiansen, M. H., Croft, W., Ellis, N. C., Holland, J., Ke, J., Larsen-Freeman, D., and Schoenemann, T. Language is a complex adaptive system: Position paper. Language Learning, 59:1–26, 2009.
- Brown et al. (2020) Brown, T., Mann, B., Ryder, N., Subbiah, M., Kaplan, J. D., Dhariwal, P., Neelakantan, A., Shyam, P., Sastry, G., Askell, A., Agarwal, S., Herbert-Voss, A., Krueger, G., Henighan, T., Child, R., Ramesh, A., Ziegler, D., Wu, J., Winter, C., Hesse, C., Chen, M., Sigler, E., Litwin, M., Gray, S., Chess, B., Clark, J., Berner, C., McCandlish, S., Radford, A., Sutskever, I., and Amodei, D. Language models are few-shot learners. In Larochelle, H., Ranzato, M., Hadsell, R., Balcan, M., and Lin, H. (eds.), Advances in Neural Information Processing Systems, volume 33, pp. 1877–1901. Curran Associates, Inc., 2020. URL https://proceedings.neurips.cc/paper_files/paper/2020/file/1457c0d6bfcb4967418bfb8ac142f64a-Paper.pdf.
- Cai et al. (2023) Cai, W., Huang, S., Cheng, G., Long, Y., Gao, P., Sun, C., and Dong, H. Bridging zero-shot object navigation and foundation models through pixel-guided navigation skill. arXiv preprint arXiv:2309.10309, 2023.
- Chaplot et al. (2020) Chaplot, D. S., Gandhi, D. P., Gupta, A., and Salakhutdinov, R. R. Object goal navigation using goal-oriented semantic exploration. Advances in Neural Information Processing Systems, 33:4247–4258, 2020.
- Chen et al. (2023a) Chen, H., Xu, R., Cheng, S., Vela, P. A., and Xu, D. Zero-shot object searching using large-scale object relationship prior, 2023a.
- Chen et al. (2023b) Chen, J., Li, G., Kumar, S., Ghanem, B., and Yu, F. How to not train your dragon: Training-free embodied object goal navigation with semantic frontiers, 2023b.
- Gadre et al. (2023) Gadre, S. Y., Wortsman, M., Ilharco, G., Schmidt, L., and Song, S. Cows on pasture: Baselines and benchmarks for language-driven zero-shot object navigation. In Proceedings of the IEEE/CVF Conference on Computer Vision and Pattern Recognition, pp. 23171–23181, 2023.
- Gervet et al. (2023) Gervet, T., Chintala, S., Batra, D., Malik, J., and Chaplot, D. S. Navigating to objects in the real world. Science Robotics, 8(79):eadf6991, 2023.
- Gupta et al. (2018) Gupta, A., Murali, A., Gandhi, D. P., and Pinto, L. Robot learning in homes: Improving generalization and reducing dataset bias. Advances in neural information processing systems, 31, 2018.
- Kalra et al. (2009) Kalra, N., Ferguson, D., and Stentz, A. Incremental reconstruction of generalized voronoi diagrams on grids. Robotics and Autonomous Systems, 57(2):123–128, 2009.
- Khandelwal et al. (2022) Khandelwal, A., Weihs, L., Mottaghi, R., and Kembhavi, A. Simple but effective: Clip embeddings for embodied ai. In Proceedings of the IEEE/CVF Conference on Computer Vision and Pattern Recognition, pp. 14829–14838, 2022.
- Khanna et al. (2023) Khanna, M., Mao, Y., Jiang, H., Haresh, S., Shacklett, B., Batra, D., Clegg, A., Undersander, E., Chang, A. X., and Savva, M. Habitat synthetic scenes dataset (hssd-200): An analysis of 3d scene scale and realism tradeoffs for objectgoal navigation, 2023.
- Kirillov et al. (2023) Kirillov, A., Mintun, E., Ravi, N., Mao, H., Rolland, C., Gustafson, L., Xiao, T., Whitehead, S., Berg, A. C., Lo, W.-Y., Dollár, P., and Girshick, R. Segment anything. arXiv:2304.02643, 2023.
- Krantz et al. (2020) Krantz, J., Wijmans, E., Majumdar, A., Batra, D., and Lee, S. Beyond the nav-graph: Vision-and-language navigation in continuous environments. In Computer Vision–ECCV 2020: 16th European Conference, Glasgow, UK, August 23–28, 2020, Proceedings, Part XXVIII 16, pp. 104–120. Springer, 2020.
- Krantz et al. (2021) Krantz, J., Gokaslan, A., Batra, D., Lee, S., and Maksymets, O. Waypoint models for instruction-guided navigation in continuous environments. In Proceedings of the IEEE/CVF International Conference on Computer Vision, pp. 15162–15171, 2021.
- Kwon et al. (2023) Kwon, O., Park, J., and Oh, S. Renderable neural radiance map for visual navigation. In Proceedings of the IEEE/CVF Conference on Computer Vision and Pattern Recognition, pp. 9099–9108, 2023.
- Lai et al. (2018) Lai, H.-L., Chui, K., Sah, W.-H., Chung, S.-F., and Liu, C.-L. Language communities, corpora, and cognition. Big Data in Computational Social Science and Humanities, pp. 195–206, 2018.
- Li et al. (2022) Li, J., Li, D., Xiong, C., and Hoi, S. Blip: Bootstrapping language-image pre-training for unified vision-language understanding and generation. In International Conference on Machine Learning, pp. 12888–12900. PMLR, 2022.
- Li et al. (2020) Li, L., Zuo, X., Peng, H., Yang, F., Zhu, H., Li, D., Liu, J., Su, F., Liang, Y., and Zhou, G. Improving autonomous exploration using reduced approximated generalized voronoi graphs. Journal of Intelligent & Robotic Systems, 99:91–113, 2020.
- Liu et al. (2023a) Liu, J., Guo, J., Meng, Z., and Xue, J. Revolt: Relational reasoning and voronoi local graph planning for target-driven navigation. arXiv preprint arXiv:2301.02382, 2023a.
- Liu et al. (2023b) Liu, S., Zeng, Z., Ren, T., Li, F., Zhang, H., Yang, J., Li, C., Yang, J., Su, H., Zhu, J., et al. Grounding dino: Marrying dino with grounded pre-training for open-set object detection. arXiv preprint arXiv:2303.05499, 2023b.
- Majumdar et al. (2022) Majumdar, A., Aggarwal, G., Devnani, B. S., Hoffman, J., and Batra, D. ZSON: Zero-shot object-goal navigation using multimodal goal embeddings. In Oh, A. H., Agarwal, A., Belgrave, D., and Cho, K. (eds.), Advances in Neural Information Processing Systems, 2022. URL https://openreview.net/forum?id=VY1dqOF2RjC.
- Naveed et al. (2023) Naveed, H., Khan, A. U., Qiu, S., Saqib, M., Anwar, S., Usman, M., Barnes, N., and Mian, A. A comprehensive overview of large language models. arXiv preprint arXiv:2307.06435, 2023.
- Ouyang et al. (2022) Ouyang, L., Wu, J., Jiang, X., Almeida, D., Wainwright, C. L., Mishkin, P., Zhang, C., Agarwal, S., Slama, K., Ray, A., Schulman, J., Hilton, J., Kelton, F., Miller, L., Simens, M., Askell, A., Welinder, P., Christiano, P., Leike, J., and Lowe, R. Training language models to follow instructions with human feedback, 2022.
- Park et al. (2023) Park, J., Yoon, T., Hong, J., Yu, Y., Pan, M., and Choi, S. Zero-shot active visual search (zavis): Intelligent object search for robotic assistants. In 2023 IEEE International Conference on Robotics and Automation (ICRA), pp. 2004–2010, 2023. doi: 10.1109/ICRA48891.2023.10161345.
- Ramakrishnan et al. (2021) Ramakrishnan, S. K., Gokaslan, A., Wijmans, E., Maksymets, O., Clegg, A., Turner, J., Undersander, E., Galuba, W., Westbury, A., Chang, A. X., et al. Habitat-matterport 3d dataset (hm3d): 1000 large-scale 3d environments for embodied ai. arXiv preprint arXiv:2109.08238, 2021.
- Ramakrishnan et al. (2022) Ramakrishnan, S. K., Chaplot, D. S., Al-Halah, Z., Malik, J., and Grauman, K. Poni: Potential functions for objectgoal navigation with interaction-free learning. In Computer Vision and Pattern Recognition (CVPR), 2022 IEEE Conference on. IEEE, 2022.
- Sethian (1996) Sethian, J. A. A fast marching level set method for monotonically advancing fronts. proceedings of the National Academy of Sciences, 93(4):1591–1595, 1996.
- Shah et al. (2023) Shah, D., Equi, M., Osinski, B., Xia, F., Ichter, B., and Levine, S. Navigation with large language models: Semantic guesswork as a heuristic for planning. In 7th Annual Conference on Robot Learning, 2023. URL https://openreview.net/forum?id=PsV65r0itpo.
- Van der Walt et al. (2014) Van der Walt, S., Schönberger, J. L., Nunez-Iglesias, J., Boulogne, F., Warner, J. D., Yager, N., Gouillart, E., and Yu, T. scikit-image: image processing in python. PeerJ, 2:e453, 2014.
- Yadav et al. (2022) Yadav, K., Ramakrishnan, S. K., Turner, J., Gokaslan, A., Maksymets, O., Jain, R., Ramrakhya, R., Chang, A. X., Clegg, A., Savva, M., Undersander, E., Chaplot, D. S., and Batra, D. Habitat challenge 2022. https://aihabitat.org/challenge/2022/, 2022.
- Yamauchi (1997) Yamauchi, B. A frontier-based approach for autonomous exploration. In Proceedings 1997 IEEE International Symposium on Computational Intelligence in Robotics and Automation CIRA’97.’Towards New Computational Principles for Robotics and Automation’, pp. 146–151. IEEE, 1997.
- Yu et al. (2023a) Yu, B., Kasaei, H., and Cao, M. Co-navgpt: Multi-robot cooperative visual semantic navigation using large language models, 2023a.
- Yu et al. (2023b) Yu, B., Kasaei, H., and Cao, M. L3mvn: Leveraging large language models for visual target navigation. arXiv preprint arXiv:2304.05501, 2023b.
- Zhao et al. (2023) Zhao, Q., Zhang, L., He, B., Qiao, H., and Liu, Z. Zero-shot object goal visual navigation. In 2023 IEEE International Conference on Robotics and Automation (ICRA), pp. 2025–2031, 2023. doi: 10.1109/ICRA48891.2023.10161289.
- Zhou et al. (2023) Zhou, K., Zheng, K., Pryor, C., Shen, Y., Jin, H., Getoor, L., and Wang, X. E. Esc: Exploration with soft commonsense constraints for zero-shot object navigation. arXiv preprint arXiv:2301.13166, 2023.
Appendix A Method Details
A.1 RVG Generation
Given the obstacle and explored maps, we can obtain the unoccupied map by logically subtracting the obstacle map from the explored map, representing the traversable areas within the observed regions. We then preprocess the unoccupied map by using the morphology methods (Van der Walt et al., 2014) to fill holes and smooth boundaries. To obtain the GVD, we extract a set of Voronoi points by skeletonizing the unoccupied map (Figure 6 (a)). Subsequently, to manifest the connectivity and accessibility of the unoccupied map, the GVD can be processed into RVG , a graph form with nodes and edges (Figure 6 (b)). The nodes correspond to GVD points that are either at intersections or on the endpoint of GVD, while the segments directly connecting two adjacent nodes are identified as edges. The raw graph is then preprocessed through operations such as merging proximate nodes and eliminating trivial forks.
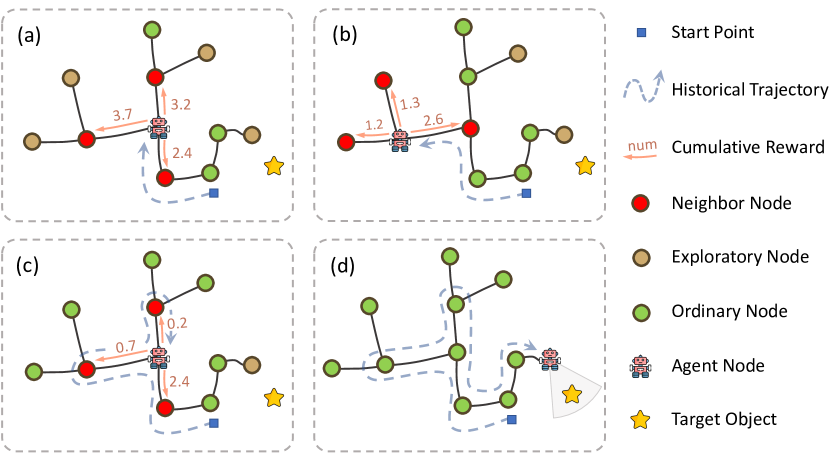
A.2 Reward Roles
To illustrate the robustness of VoroNav in various challenging scenarios and the roles played by distinct reward vectors, we have visualized a worst-case navigation example and the details of cumulative rewards, as shown in Figure 7. For exploration purposes, only neighbor nodes traversed along the exploratory path indicate its heading toward unexplored areas, which is foremost for the exploration process (refer to Figure 7 (c)); Concerning efficiency, we rely on the agent’s historical decisions, considering the current agent node as the optimal choice from previous decisions and discouraging turning back. If there is one or more extensions from the agent node leading to unexplored areas, the agent is inclined to continue its ongoing exploration (refer to Figure 7 (a)). Conversely, if no extension offers exploratory paths, it indicates that unexplored regions exist elsewhere, and historically traversed nodes will be revisited, prompting the agent to return to previously traveled paths (refer to Figure 7 (b)). Thus, the agent prioritizes exploration and efficiency from topological perspectives in the navigation. In cases where multiple nodes hold equivalent exploration and efficiency rewards, the agent will proceed to the neighbor node where the target object is more likely to be found, as indicated by the higher predicted semantic probability (refer to Figure 7 (a)).
A.3 Navigation Process
A complete process of a navigation episode is illustrated in Algorithm 1. The code snippet of the LookAround procedure, as presented in Algorithm 1, is further elaborated in Algorithm 2. At the beginning of each episode, the subgoal is initially empty. At each step, the agent updates the semantic map of its surroundings and the RVG accordingly (Line 4-8). If the agent detects the target object at any time, it will immediately plan a direct route to approach the object (Line 9-10). Conversely, if the target remains undetected, the agent performs a complete rotation to establish a preliminary RVG scene representation (Line 13, Algorithm 2). The agent then navigates to the closest RVG node (Line 14). Upon reaching the RVG node or the mid-term goal(Line 16), the agent rotates a full circle again (Line 17, Algorithm 2), derives the exploratory paths (Line 18) and surrounding images (Line 19), generates corresponding descriptions of paths (Line 20-21) and farsight (Line22) integrated with the respective neighbor nodes. A large language model is then employed to evaluate the fused descriptions of each neighbor node, obtaining semantic rewards based on the results of scene reasoning (Line 23). Concurrently, the agent acquires exploration rewards (Line 24) and efficiency rewards (Line 25) on the neighbor nodes by analyzing the layout of unexplored areas and historical trajectories. The neighbor node with the highest cumulative reward will be selected as the optimal mid-term goal point for exploration (Line 26). Finally, low-level motion planning is utilized to devise a sequence of actions targeting the mid-term goal (Line 29). If the agent reaches the vicinity of the identified target or takes actions surpassing the maximum number of steps, it will immediately issue a “Stop” action and the episode ends.
Appendix B Experiment Details
B.1 Experiment Setup
Evaluations on HM3D follow settings outlined in the Habitat ObjectNav challenge 2022 (Yadav et al., 2022). Evaluations on HSSD adopt the same validation parameters utilized in (Khanna et al., 2023). In both datasets, the agent is a LoCoBot (Gupta et al., 2018) with a base radius of 0.18m, outfitted with an RGB-D camera mounted at a height of 0.88 meters and a pose sensor that provides accurate localization. The camera has a Horizontal Field of View (HFoV) and frame dimensions of pixels. The agent’s action space is {Stop, MoveForward, TurnLeft, TurnRight, LookUp, LookDown}, with a discrete movement increment of and discrete rotations of . The object goal categories in episodes include “bed”, “chair”, “sofa”, “tv”, “plant”, and “toilet”.
| Method | HM3D | HSSD | ||
|---|---|---|---|---|
| Success | SPL | Success | SPL | |
| Frontier | 63.5 | 33.0 | 51.2 | 20.6 |
| Voronoi | 67.3 | 37.4 | 57.2 | 32.7 |
| L3MVN | 65.5 | 36.5 | 58.0 | 28.0 |
| VoroNav | 67.6 | 40.5 | 59.7 | 34.1 |
B.2 Failure Case Study
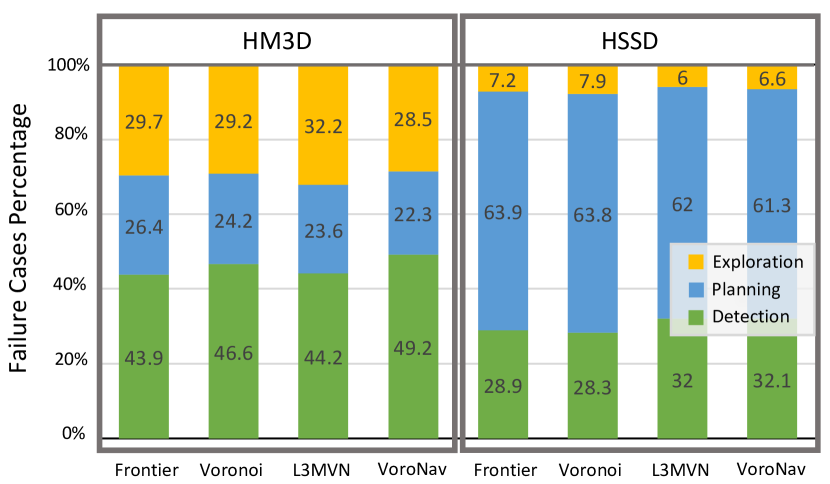
We have collected the reasons and frequencies of failures across all episodes, categorizing them into detection failures, planning failures, and exploration failures. Detection failure occurs when the agent mistakenly identifies non-target items as targets or overlooks the actual targets within the agent’s field of view. Planning failure arises when the agent gets stuck or fails to navigate to the target location despite having accurately detected the target. Exploration failure is attributed to the situation where the agent has not encountered the target within the assigned maximum number of steps. As shown in Figure 8, we find that most failures are caused by incorrect detection in HM3D and by abnormal planning in HSSD.
B.3 Ground-truth Vision Experiments
To eliminate the impact of detection errors during navigation and analyze the planning and exploration effects of navigation methods, we uniformly replace the RGB images across all methods with ground-truth semantic images. As shown in Table 4, when semantic priors of reasoning and planning are absent, the Voronoi method exhibits considerably superior performance in terms of both Success and SPL compared to the Frontier method. This enhancement in performance proves that within the topological domain, the Voronoi planning approach is more suitable for goal-oriented navigation than the Frontier exploration method. With the guidance of LLM, VoroNav outperforms L3MVN by a large margin, further demonstrating that VoroNav’s information processing and decision-making are more effective for robot navigation with lower step cost and a higher success rate compared to L3MVN.
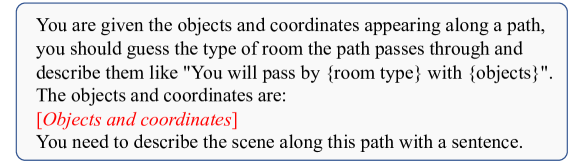
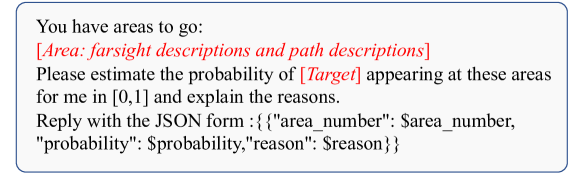
B.4 Prompt Template
In Figure 9 and Figure 10, we present the specific prompt templates for path description generation and decision-making. The red font in the prompt templates refers to the parts that vary according to different scenarios.
B.5 Examples of LLM Conversation
We show supplemental examples of path description generation in Figure 11. LLM decision examples are shown in Figure 12 and Figure 13.