A New Population of Mid-Infrared-Selected Tidal Disruption Events: Implications for Tidal Disruption Event Rates and Host Galaxy Properties
Abstract
Most tidal disruption events (TDEs) are currently found in time-domain optical and soft X-ray surveys, both of which are prone to significant obscuration. The infrared (IR), however, is a powerful probe of dust-enshrouded environments, and hence, we recently performed a systematic search of NEOWISE mid-IR data for nearby, obscured TDEs within roughly 200 Mpc. We identified 18 TDE candidates in galactic nuclei, using difference imaging to uncover nuclear variability amongst significant host galaxy emission. These candidates were selected based on the following IR light curve properties: (1) erg s-1 at peak, (2) fast rise, followed by a slow, monotonic decline, (3) no significant prior variability, and (4) no evidence for AGN activity in WISE colors. The majority of these sources showed no variable optical counterpart, suggesting that optical surveys indeed miss numerous obscured TDEs. Using narrow line ionization levels and variability arguments, we identified 6 sources as possible underlying AGN, yielding a total of 12 TDEs in our gold sample. This gold sample yields a lower limit on the IR-selected TDE rate of galaxy-1 year-1 ( Mpc-3 year-1), which is comparable to optical and X-ray TDE rates. The IR-selected TDE host galaxies do not show a green valley overdensity nor a preference for quiescent, Balmer strong galaxies, which are both overrepresented in optical and X-ray TDE samples. This IR-selected sample represents a new population of dusty TDEs that have historically been missed by optical and X-ray surveys and helps alleviate tensions between observed and theoretical TDE rates and the so-called missing energy problem.
1 Introduction
Tidal disruption events (TDEs; Rees, 1988; Gezari, 2021), which occur when a star winds up so close to a supermassive black hole (SMBH) that the tidal forces exceed the star’s self-gravity, provide a means by which to study the properties of previously dormant SMBHs (e.g. mass and spin; Kesden, 2012; Mockler et al., 2019; Pasham et al., 2019; Wen et al., 2022) and their nuclear environments (Alexander et al., 2020). A sizeable fraction of the disrupted star becomes bound to the SMBH, leading to a short-lived episode of accretion that is revealed via emission across the electromagnetic spectrum. Historically, the first TDEs were discovered as luminous, soft X-ray flares with the ROSAT all-sky X-ray survey in the 1990s (e.g. Bade et al., 1996; Komossa & Greiner, 1999; Komossa & Bade, 1999; Donley et al., 2002), with this transient soft X-ray emission likely coming from the formation of an accretion disk. A decade later, transient UV emission, also thought to be associated with the formation of an accretion disk, was discovered with the GALEX satellite, revealing a handful of TDEs (Gezari et al., 2006, 2008, 2009).
The discovery of optical emission from TDEs (e.g. van Velzen et al., 2011; Gezari et al., 2012; Arcavi et al., 2014; Chornock et al., 2014; Holoien et al., 2014), however, has led to an explosion in the TDE discovery rate. Optical emission in TDEs does not come directly from the formation of an accretion disk, but is instead thought to be associated either with the reprocessing of UV/X-ray emission from the accretion disk in surrounding optically thick material (Guillochon & Ramirez-Ruiz, 2013; Roth et al., 2016) or with shocks from the intersection of stellar debris streams (Piran et al., 2015). With increasing cadence and depth, optical surveys like the All-Sky Automated Survey for Supernovae (ASAS-SN; Shappee et al., 2014), Asteroid Terrestrial-impact Last Alert System (ATLAS; Tonry et al., 2018), and the Zwicky Transient Facility (ZTF; Bellm et al., 2019) now serve as the primary discovery method for TDEs, finding on the order of ten TDEs per year. In addition, SRG/eROSITA (Predehl et al., 2021), the first all-sky survey in the X-rays since ROSAT, has also been used to discover numerous new TDE candidates (Sazonov et al., 2021; Malyali et al., 2021, 2023a, 2023b; Liu et al., 2023). Future surveys, including the Legacy Survey of Space and Time (LSST) at the Vera Rubin Observatory (Ivezić et al., 2019), are expected to increase this discovery rate to on the order of hundreds to thousands of TDEs per year (e.g. Bricman & Gomboc, 2020).
Both optical and X-ray surveys have brought TDEs into the era of demographic and population studies (e.g. Sazonov et al., 2021; van Velzen et al., 2021b; Hammerstein et al., 2023; Yao et al., 2023). One notable finding of these population studies is that the optical TDEs are preferentially found in E+A or quiescent Balmer-strong galaxies, which are a relatively rare type of galaxy characterized by no ongoing star formation, but with evidence for a recent burst of star formation less than 1 Gyr ago (Arcavi et al., 2014; French et al., 2016). Likewise, optical and X-ray TDEs are also often found in the so-called “green valley” of the galaxy color-mass diagram (Law-Smith et al., 2017; Hammerstein et al., 2021; Sazonov et al., 2021; van Velzen et al., 2021b; Hammerstein et al., 2023; Yao et al., 2023), which is proposed to be a transitional region between star forming and passive (e.g. Martin et al., 2007), although the exact way in which galaxies transition is still debated (e.g. Schawinski et al., 2014). These findings, together with a preference for centrally-concentrated TDE host galaxies (Law-Smith et al., 2017; Graur et al., 2018; French et al., 2020; Hammerstein et al., 2021), have been used to argue that TDEs occur preferentially in galaxies which have undergone a recent merger (e.g. Pfister et al., 2019; Hammerstein et al., 2021). On the contrary, Roth et al. (2021) argued that dust obscuration can explain the lack of TDEs from ZTF in star-forming galaxies, suggesting that the above findings could be affected by biased selection with optical surveys. Thus, to assess the true demographics of TDEs, it is crucial to probe and select TDEs in other wavebands, like the infrared (IR), that do not miss events due to heavy dust obscuration.
Another puzzle arising from population studies of optical and X-ray selected TDEs is that the observed rate seems to be systematically lower than what is expected based on loss-cone dynamics (e.g. Wang & Merritt, 2004; Stone & Metzger, 2016). The first observed TDE rates fell roughly an order of magnitude lower than the expected theoretical rate of 10-4 galaxy-1 year-1 (Donley et al., 2002; Gezari et al., 2009; van Velzen & Farrar, 2014). While the latest measurements are getting closer to the theoretically expected rate, the most recent flux-limited sample from ZTF still suggests roughly a factor of 3 discrepancy, finding an average rate of galaxy-1 year-1 (Yao et al., 2023). There is, however, some uncertainty on the theoretical rates, as recent works have suggested that effects such as scattering and collisions can decrease the expected rate to match that of optical and X-ray selected TDEs (e.g. Teboul et al., 2024). That said, the observed rates and SMBH mass functions constructed from TDEs have important implications for black hole spin distributions (e.g. Kesden, 2012), particularly around high-mass SMBHs as only the most rapidly spinning SMBHs above can disrupt a Sun-like star. Likewise, the observed rates of TDEs can help constrain the low-mass SMBH occupation fraction (e.g. Stone & Metzger, 2016), which is currently poorly constrained by other methods. Therefore, a full census of TDEs across the entire electromagnetic spectrum is vital to our ability to use TDEs as probes of SMBH demographics.
To that end, the variable IR sky is one thus-far under-utilized way to search for previously missing TDEs. IR follow-up of optically-discovered TDEs has shown the presence of numerous luminous IR flares (e.g. Dou et al., 2016; Jiang et al., 2016; van Velzen et al., 2016; Newsome et al., 2023), thought to be associated with the reprocessing of optical, UV, and X-ray emission by circumnuclear dust (Lu et al., 2016; van Velzen et al., 2021a). The majority of optical TDEs with a dust echo have been shown to have a relatively low dust covering factor (1%; van Velzen et al., 2016; Jiang et al., 2021a). However, if the dust covers a sizable fraction of the sky and our sight line to the intrinsic flare emission, then we may only see reprocessed IR emission. A population of IR-only TDEs has significant implications for TDE demographics, including affecting the observed rates and potentially explaining the lack of optical and X-ray selected TDEs in dusty, star-forming galaxies.
Several past works have attempted to find this population of obscured TDEs, using a variety of methods. Recent efforts targeting dust-obscured supernovae in galactic nuclei revealed a few TDEs (e.g. Mattila et al., 2018; Kool et al., 2020), but these studies probe TDE demographics in rare environments. Other efforts, most notably the Mid-InfraRed Outbursts in Nearby Galaxies (MIRONG) sample from Jiang et al. (2021b); Wang et al. (2022a), have focused on searching in known spectroscopic galaxies for large amplitude flares ( mag) in the integrated mid-IR luminosity reported in the NEOWISE survey source catalogs. While this approach has revealed a number of potential TDE candidates, it is prone to missing events due to nuclear variability being diluted by the stellar light in integrated photometry. Additionally, the MIRONG sample is also restricted to Sloan Digital Sky Survey (SDSS) galaxies within and is agnostic to the existence of an active galactic nucleus (AGN), thereby restricting the search area significantly and potentially introducing a significant number of AGN flares into the sample.
In this work, we aim to produce a less biased sample of IR-selected TDEs by utilizing novel difference imaging techniques for candidate selection and a less restrictive cross-matching process that covers the entire sky. This new selection process has revealed a total of 18 IR TDE candidates, including the closest TDE discovered to date, located in a star-forming galaxy at 42 Mpc (Panagiotou et al., 2023). We present the selection of TDEs from the WISE survey in Section 2 and provide details of our multi-wavelength follow-up efforts in Section 3. The details of the IR flares, energetics, and multi-wavelength evidence for dust-enshrouded accretion flows are given in Section 5, and the host galaxy properties of this sample are explored and compared to optical and X-ray samples in Section 6. We discuss potential sample contaminants, including AGN and supernovae (SNe) in Section 4, and present rates of IR-selected TDEs from this sample in Section 7. Finally, we discuss our findings in Section 8 and summarize them in Section 9. Throughout this work, we assume , , and km s-1 Mpc-1. Unless otherwise noted, quoted uncertainties represent 90% confidence intervals. All reported magnitudes are in the AB system and have been corrected for Galactic extinction using the Schlafly & Finkbeiner (2011) dust maps and the Cardelli et al. (1989) extinction curves.
2 Selecting Infrared TDE Candidates with WISE
The Wide-field Infrared Survey Explorer (WISE; Wright et al., 2010) satellite was launched in 2009 and completed its primary mission in 2010, after surveying the entire mid-IR sky once in each of its four bands. In 2013, NASA re-activated the spacecraft as the NEOWISE mission (Mainzer et al., 2014), with the goal of studying near-Earth objects (NEOs) by continuing to survey the entire IR sky every six months in only the two shortest wavelength bands. Thanks to this continued survey, numerous long-duration IR transients, like dust echoes around optical and X-ray TDEs, have been discovered (e.g. Dou et al., 2016; Jiang et al., 2016; van Velzen et al., 2016; Jiang et al., 2021a; Newsome et al., 2023). In this work, we utilize NEOWISE data to identify dust-obscured TDEs that were missed at other wavelengths.
We carried out a systematic search of the NEOWISE survey data for transients by performing image subtraction directly on the time-resolved, coadded W1 (3.4 m) and W2 (4.6 m) data released as part of the unWISE project (Lang, 2014; Meisner et al., 2018). We used a customized code (De et al., 2020), which is based on the ZOGY algorithm (Zackay et al., 2016) to perform the image subtraction. A visual representation of the difference imaging process can be seen in Figure 1 of Panagiotou et al. (2023). Each epoch of unWISE stacks of NEOWISE data consist of 12 exposures acquired at the same sky position over a duration of day for most of the sky. Each NEOWISE exposure is 7.7 sec, amounting to a total exposure time of s for most of the sky (the effective exposure is higher near the ecliptic poles). WISE images are frequently affected by scattered light (e.g. from the moon), producing time-varying artifacts that appear in the difference images. With empirical tests while creating the pipeline, we established that these artifacts dominate the source catalog at the level. Therefore, to avoid being overwhelmed by artifacts, we chose to adopt a threshold for WISE transients. Further details of this pipeline will be presented in K. De et al. (in preparation), but importantly we note that we used the full-depth unWISE coadds from 2010-2011 as the reference images for this search.
To identify nuclear transients, we cross-matched our WISE transient sample to the CLU-compiled catalog, which contains spectroscopically-confirmed galaxies within roughly 200 Mpc compiled from numerous existing databases. For more details on the CLU-compiled catalog, we refer the reader to Section 5.3 of Cook et al. (2019). Specifically, we required the WISE transient to occur within 2″ of the nucleus of a CLU galaxy. The accuracy with which we can centroid a source is much better than the PSF (which is ″ for WISE W1 and W2), and hence, we expect to be able to reach on the order of 1″ localization for WISE detections. Thus, we chose a cross-matching radius of 2″ to be relatively conservative and account for potential variability of the WISE PSF across different epochs.
In total, this cross-matching yielded 2333 mid-IR nuclear transients. Many of these sources were clearly AGN that showed long-term variability or short-duration transients like supernovae that showed flares that lasted for only one or two WISE sky passes. Thus, to obtain the cleanest sample of TDEs, we implemented the following selection criteria: (1) the transient must reach a IR luminosity of erg s-1 at 4.6 m111Throughout the rest of this work, we refer to at 4.6m as ., (2) the source must be detected in both the W1 and W2 bands for at least 5 WISE epochs (2.5 years222Although this timescale is longer than most dust echoes around optical TDEs (see e.g. van Velzen et al., 2016; Jiang et al., 2021a), this selection criterion was chosen to minimize the number of supernovae sample contaminants.), with a light curve that shows a fast rise, followed by a slow, monotonic decay, (3) the WISE light curves should show no significant stochastic variability prior to the flare333Stochastically variable AGN would be expected to show up as both positive and negative detections in difference imaging, whereas our TDEs are only expected to show positive detections. Hence, we required that sources not show any significant negative detections., and (4) the pre-flare WISE colors must not exceed W1 - W2 0.8 (Stern et al., 2012) and the source must not have been detected in the ROSAT all-sky X-ray survey, both of which would indicate an underlying AGN. There are examples in the literature of candidate TDEs occurring in AGN (e.g. Merloni et al., 2015; Blanchard et al., 2017; Ricci et al., 2020, 2021; Cannizzaro et al., 2022; Masterson et al., 2022), but these are much rarer than AGN flares that would overwhelm our sample if included. The first two criteria primarily rule out most SNe, while the last two primarily remove AGN. In total, these selection criteria yielded 20 transients, from which we removed 2 previously-identified SNe. Beyond these cuts, we further address sample contaminants and create a gold sample of sources which we are most confident are TDEs in Section 4.1.
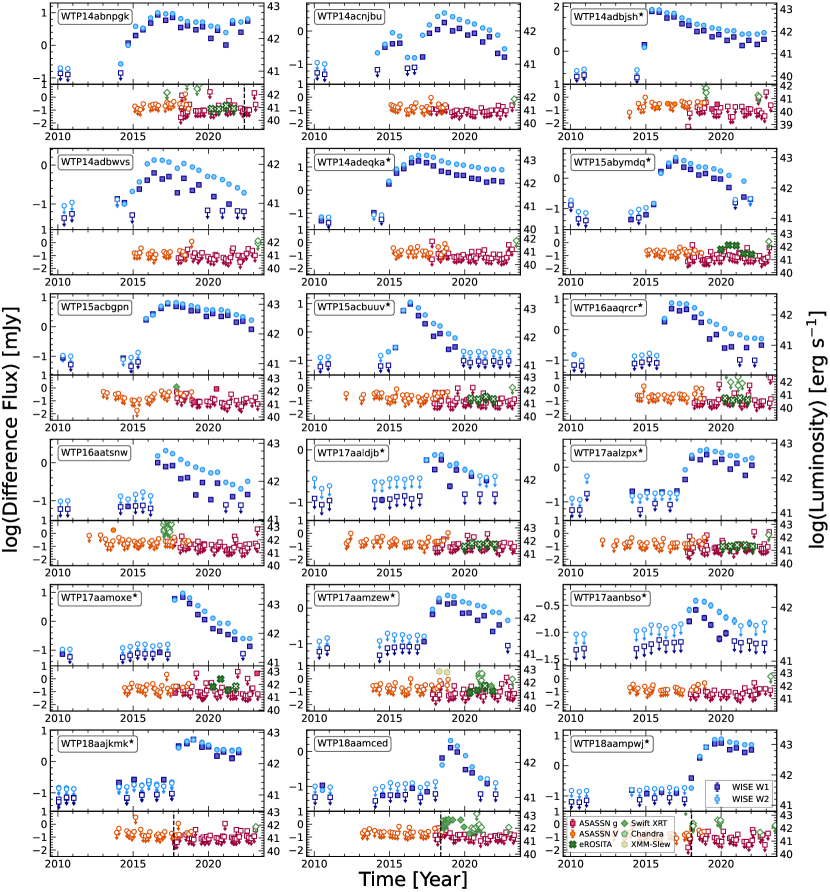
This search resulted in a total of 18 IR-selected TDE candidates, which constitute the WISE TDE sample we present in this paper. It is important to note that this is not a statistically complete sample, and there may be IR-emitting TDEs which do not exhibit the chosen selection criteria. However, this work represents the first systematic search for TDEs in the IR band with minimal sample contamination. The WISE light curves for the 18 sources are shown in Figure 1, with multi-wavelength coverage shown in the bottom panels for each source. These events span a turn-on time in the IR from 2014-2018 and show little evidence for any variable optical counterparts. The brightest and closest object in our sample, WTP 14adbjsh444Each source identified by the WISE Transient Pipeline (WTP; K. De et al. 2023, in preparation) is given a WTP name. This name consists of two letters that designate the year in which the transient was first detected in difference imaging, followed by 6 letters that indicate the order of detection (akin to the TNS naming scheme). Throughout this paper we will refer to sources by their WTP name., was recently published in Panagiotou et al. (2023). Of the remaining 17 sources, 6 were detected in the MIRONG sample of IR nuclear transients (Dai et al., 2020; Jiang et al., 2021b; Wang et al., 2022a), 2 show optical flares that were detected by other groups (Falco et al., 2018; Frederick et al., 2019), and 9 are reported here for the first time. The details of our sample are given in Table 1, and in Section C of the Appendix, we describe their individual properties in detail. Follow-up for the sources was coordinated using the fritz astronomical data platform (van der Walt et al., 2019).
| ID | WTP Name | TNS Name$a$$a$footnotemark: | RA | Dec. | Redshift$b$$b$footnotemark: | $c$$c$footnotemark: | $d$$d$footnotemark: | First Presented |
|---|---|---|---|---|---|---|---|---|
| (deg.) | (deg.) | (Mpc) | (MJD) | |||||
| 1 | WTP 14abnpgk | AT 2022mim | 251.477888 | -23.451942 | 0.02035 | 89.3 | 56901 | This work |
| 2 | WTP 14acnjbu | 264.328943 | 19.292112 | 0.026 | 112.8 | 57823 | This work | |
| 3 | WTP 14adbjsh | 342.953459 | -20.608018 | 0.0106 | 41.0 | 57070 | Panagiotou et al. (2023) | |
| 4 | WTP 14adbwvs | 198.748944 | 51.272774 | 0.02489 | 111.1 | 56996 | Dai et al. (2020) | |
| 5 | WTP 14adeqka | 297.353597 | 63.509271 | 0.01895 | 80.2 | 57131 | This work | |
| 6 | WTP 15abymdq | 57.219702 | -55.426525 | 0.03742 | 164.3 | 57303 | This work | |
| 7 | WTP 15acbgpn | 166.258054 | 59.684626 | 0.03369 | 150.2 | 57310 | Jiang et al. (2021b); Wang et al. (2022a) | |
| 8 | WTP 15acbuuv | 154.672586 | -13.001884 | 0.03059 | 139.5 | 57277 | This work | |
| 9 | WTP 16aaqrcr | 280.829573 | -62.112048 | 0.01509 | 65.0 | 57429 | This work | |
| 10 | WTP 16aatsnw | 254.844458 | 20.8298 | 0.04513 | 200.0 | 57495 | Jiang et al. (2021b); Wang et al. (2022a) | |
| 11 | WTP 17aaldjb | 197.064964 | 4.485906 | 0.04832 | 219.4 | 57765 | Jiang et al. (2021b); Wang et al. (2022a) | |
| 12 | WTP 17aalzpx | 50.856858 | -2.046782 | 0.03725 | 161.6 | 57972 | This work | |
| 13 | WTP 17aamoxe | 317.242691 | -56.475355 | 0.042 | 183.6 | 57934 | This work | |
| 14 | WTP 17aamzew | 146.2357 | 31.097848 | 0.03465 | 156.4 | 57944 | Jiang et al. (2021b); Wang et al. (2022a) | |
| 15 | WTP 17aanbso | 180.909755 | 58.986509 | 0.04692 | 210.4 | 57934 | Jiang et al. (2021b); Wang et al. (2022a) | |
| 16 | WTP 18aajkmk | 40.099143 | -2.728314 | 0.0287 | 122.3 | 57991 | This work | |
| 17 | WTP 18aamced | AT 2018dyk | 233.283417 | 44.535533 | 0.03672 | 162.9 | 58275 | Arcavi et al. (2018); Frederick et al. (2019) |
| 18 | WTP 18aampwj | AT 2018gn | 26.676815 | 32.508168 | 0.0375 | 161.2 | 58324 | Falco et al. (2018); This work |
3 Multi-Wavelength Follow-Up Observations
3.1 Optical Spectroscopy
We obtained optical spectroscopic follow-up for all of the sources in our sample, with goals of identifying spectral changes and assessing the likelihood of an underlying AGN in each source. We observed two sources (WTP 14adbjsh and WTP 18aampwj) with the Goodman High Throughput Spectrograph (GHTS; Clemens et al., 2004) on the SOuthern Astrophysical Research telescope (SOAR, Program 2022B-005, 2023A007; PI: K. De) in November 2022, the first of which was presented in Panagiotou et al. (2023). Eleven of our sources were observed with the Low Dispersion Survey Spectrograph (LDSS3) on the Magellan/Clay Telescope in early 2023 and one source was observed with the Gemini Multi-Object Spectrograph (GMOS) on Gemini-S (Program GS-2023A-Q-205; PI: K. De). The remaining four sources without post-flare optical spectroscopy were observed with the FLOYDS spectrograph on the Faulkes Telescope North (FTN) and South (FTS), which are part of the Las Cumbres Observatory Global Telescope Network (Brown et al., 2013). The exposure times, slit widths, and further details of the new observations included in this work are given in Table 3. In all observations, the long slit was centered at the position of the galaxy nucleus. All optical spectra from SOAR/GHTS, Magellan/LDSS3, and Gemini/GMOS were reduced and flux calibrated using the pypeit software (Prochaska et al., 2020) and observations of a nearby spectroscopic standard on the same night. Optical spectra taken with FLOYDS/Las Cumbres were subsequently reduced using the floydsspec pipeline555https://github.com/svalenti/FLOYDS_pipeline/, which performs flux and wavelength calibration, cosmic-ray removal, and final spectrum extraction and is described in Valenti et al. (2014).
3.2 Near-Infrared Spectroscopy
For a limited number of sources in our sample, we were also able to obtain near-IR spectroscopic observations. The advantage of these observations over optical spectroscopic follow-up is that the near-IR is less affected by heavy dust obscuration and therefore allows us to potentially peer deeper into the nucleus to look for broad spectral features. We obtained near-IR spectra from both the Folded Port Infrared Echellette (FIRE; Simcoe et al., 2013) instrument (Echelle mode) on Magellan/Baade Telescope and SpeX instrument (SXD mode; Rayner et al., 2003) on the NASA Infrared Telescope Facility (IRTF), as part of program 2023A070 and 2023B046 (PI: De). In all observations, the long slit was centered at the position of the galaxy nucleus and the total exposure time was accumulated in a series of ABBA dither sequences. We also obtained observations of a telluric standard star spatially close to the science target and temporally close to the science exposures. The FIRE observations were again reduced and flux calibrated using the pypeit software (Prochaska et al., 2020) and observations of a nearby telluric standard. The IRTF data were reduced and extracted using the spextool package (Cushing et al., 2004), followed by telluric correction and flux calibration using the xtellcor package (Vacca et al., 2003). Further details on these observations are given in Table 3 in the Appendix.
3.3 Optical Photometry
For a comparison to optical surveys, we utilize a combination of ASAS-SN, ATLAS, and ZTF data. ASAS-SN is an all-sky survey and has the longest baseline, which allows us to probe all of the IR flares in our sample and most for a significant time before the IR flare. Despite these strengths, ASAS-SN is the shallowest of the three surveys, reaching down to 17 mag ( 0.6 mJy) in a single visit (Kochanek et al., 2017). By stacking observations, we can reach comparable fluxes to WISE ( 0.1 mJy), and since the majority of dust echoes around optically-selected TDEs are dimmer than the observed optical flare (see e.g. van Velzen et al., 2016; Jiang et al., 2021a), this provides sufficient constraints on the optical counterparts to these IR-selected events. We obtain forced difference photometry through the ASAS-SN SkyPatrol service (Shappee et al., 2014; Kochanek et al., 2017), and stack the resulting ASAS-SN data on 60 day timescales, using an inverse variance weighted average with iterative sigma-clipping (at the 3 level) for outlier rejection. For the first five sources (those starting with WTP 14), ASAS-SN turned on roughly around the beginning of the IR flare, so we also verified that the ASAS-SN integrated photometry showed no signs of optical variability.
To compliment the ASAS-SN data and probe dimmer optical transients, we also searched ATLAS and ZTF data for corresponding optical transients. ATLAS, which reaches down to roughly 19-20 mag in the - and -bands, has surveyed the northern sky (dec. -50∘) every two days since 2015, and has complimentary coverage of the southern sky starting in 2022. We obtained ATLAS data for all of our transients using the ATLAS Forced Photometry Service666https://fallingstar-data.com/forcedphot/queue/ (Tonry et al., 2018; Smith et al., 2020; Shingles et al., 2021). ZTF has surveyed the northern sky every three days since 2018, reaching down to mag. Given the limited temporal coverage, ZTF is only useful for our three most recent transients, but provides the deepest coverage for these sources. We obtained ZTF data using the ZTF Forced Photometry Service (Masci et al., 2019, 2023). Throughout the rest of this work, we utilize the optical survey with the deepest limits and sufficient temporal coverage for each transient. Only 4 of our 18 sources show any hint of an optical transient (WTP 14abnpgk, WTP 18aajkmk, WTP 18aamced, WTP 18aampwj); we show these optical transients in more detail in Section C of the Appendix.
3.4 X-ray Observations
Finally, we also performed at least one X-ray observation for each of our sources after the IR flare was discovered. We utilized data from the German half of the eROSITA all-sky survey that ran from 2019-2022, and for any source not in that footprint or that did not have any archival X-ray observations, we obtained at least one Swift snapshot to estimate the late-time X-ray flux.
3.4.1 eROSITA
Of the 18 sources in our sample, 8 are in the German half of the eROSITA sky. Of these 8 sources, 3 were detected during at least one eROSITA visit between 2019-2022. The eROSITA fluxes were obtained by cross-matching () the IR positions with the X-ray positions from the eROSITA_DE source catalogues for four full all-sky surveys (eRASS1-eRASS4) and a part of a fifth scan eRASS5 (eRASS1: Merloni et al. 2023; eRASS2-4: unpublished, ver.221031 and eRASS5: unpublished, ver. 221101). The fluxes and corresponding luminosity are given in 0.2-2.3 keV band, and the flux conversion factor is calculated using a power-law model with and cm-2. The eROSITA spectra were extracted using the eROSITA Science Analysis Software (eSASS) task SRCTOOL (version eSASSusers_211214; Brunner et al., 2022) centred on the corresponding eRASS position. We applied SRCTOOL in AUTO mode, which determines the optimal sizes of source and background regions based on the source extension and brightness, background properties and PSF at the source position. For the non-detections, we calculated upper limits at the IR detection positions in 0.2-2.3 keV assuming the same absorbed power-law model with and cm-2 (a detailed description will be presented in I. Grotova et al. in prep.).
3.4.2 Swift
Many of our sources were observed with Swift (Gehrels et al., 2004) at some point after their flare, either due to targeted follow-up or serendipitous observation. In addition, for any source in our sample that was not observed with other X-ray telescopes after the IR flare, we obtained one Swift Target of Opportunity observation to probe the late-time X-ray emission. With roughly 2 ks and at the distances of these transients, this allowed us to rule out any strong X-ray flux down to a limit of few erg cm-2 s-1. All Swift XRT observations were reduced using the online XRT products generator777https://www.swift.ac.uk/user_objects/ (Evans et al., 2007, 2009). We extracted fluxes and upper limits for each Swift observation, assuming a spectrum to convert from counts to flux.
3.4.3 Chandra
Two sources in our sample, WTP 15acbgpn and WTP 16aatsnw, were observed with the Chandra X-ray Observatory during the last 12 years. We reduced these data using CIAO (v4.12; Fruscione et al., 2006) and CALDB (v4.9.2.1). We followed standard data reduction procedures, including running chandra_repro to process the data and extracting fluxes with the srcflux command, assuming a spectrum. WTP 15acbgpn was detected in 2011, more than 4 years prior to its IR flare, which suggests that this is instead an AGN, as suggested by its optical spectrum (see Section 4.1 for more details). Despite having AGN-like ionization levels, WTP 16aatsnw was not detected in either 2010 or 2017 with Chandra, with relatively strict X-ray flux limits of erg cm-2 s-1 in each observation, respectively. Ultimately, both of these sources were ruled out of our gold sample due to their likely AGN nature.
3.4.4 XMM-Newton
XMM-Newton performed two pointed observations of one the sources in our sample, WTP 18aamced, which have been extensively studied in previous works (Frederick et al., 2019; Huang et al., 2023). Additionally, WTP 17aamzew was detected twice in 2018 during the in the XMM Slew Survey (Saxton et al., 2008). We obtained the XMM-Slew fluxes from the High-Energy Light-Curve Generator888http://xmmuls.esac.esa.int/hiligt/ (König et al., 2022; Saxton et al., 2022), assuming a power-law to convert from count rate to fluxes in the 0.2-2 keV band. The source was not detected in the 2-12 keV band, but the exposures were extremely short (10s).
4 Potential Sample Contaminants
To further remove potential sample contaminants and establish the cleanest possible sample of IR-selected TDEs, we break the sample into two, a gold sample, which contains the sources that we are most confident are TDEs, and a silver sample, which contains sources for which an AGN nature cannot be ruled out. In total, we find 6 sources with potential AGN contamination, which we place in the silver sample, and 12 sources which have a high likelihood of being TDEs and thereby constitute the gold sample. The designation for each source is given in Table 2, and the details of ruling out non-TDE contamination in our gold sample are given below.
4.1 Contamination from AGN
With ongoing accretion and often large amounts of dust, AGN are a natural contaminant in our sample. While AGN and TDEs are not mutually exclusive phenomena (see e.g. Merloni et al., 2015; Blanchard et al., 2017; Ricci et al., 2020, 2021; Cannizzaro et al., 2022; Masterson et al., 2022), AGN also often show flares that are not associated with TDEs and would therefore overwhelm our sample if we did not remove them. Hence, to produce the purest sample of TDEs, we utilize optical spectroscopy to identify and remove AGN contaminants. Spectra from before WISE flares are most useful for this exercise, as they preclude the TDEs from producing the accretion-driven emission lines. Seven sources in our sample have SDSS spectra that were taken prior to the WISE flares. For the remaining sources in our sample, we utilize our follow-up spectra from Magellan, Las Cumbres, SOAR, or Gemini to rule out AGN contribution. However, in these sources, the presence of AGN-like emission lines is difficult to disentangle from transient emission lines associated with the TDE.
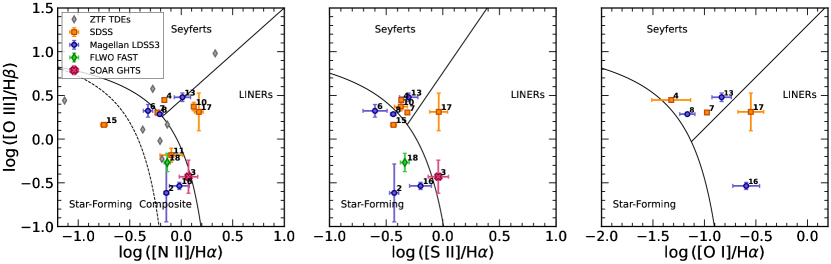
To accurately measure the line ratios, we first removed the stellar continuum by fitting each spectrum with penalized pixel fitting routine (pPXF; Cappellari & Emsellem, 2004; Cappellari, 2017, 2023) using the MILES stellar library (Falcón-Barroso et al., 2011). We mask the key emission line regions, including the H, H, [O III], [O I], [N II], and [S II] regions, when fitting with pPXF. Using the residuals of the pPXF fit, we fit each emission line of interest with a Gaussian model to estimate the line flux and velocity dispersions. Uncertainties on each fit parameter were determined by adding simulated noise to the spectrum, re-fitting, and repeating this process 1000 times. The noise is scaled to the root-mean-square of the residuals from pPXF fitting. In the majority of sources, we only see narrow emission lines, which are not resolvable with the resolution of the Magellan LDSS3 instrument. The relative line intensity ratios of these narrow lines are used to place the sources on various BPT diagrams (Baldwin et al., 1981), using three different line ratios with boundaries between star-forming, Seyfert, LINER, and composite ionization sources taken from large samples of SDSS galaxies (e.g. Kewley et al., 2001; Kauffmann et al., 2003; Kewley et al., 2006; Schawinski et al., 2007). Figure 2 shows the resulting BPT diagrams, with the sources labeled based on the IDs given in Table 1. Note that only the sources that showed strong emission lines are shown in each panel. We also show a comparison to optically-selected TDEs from ZTF (Hammerstein et al., 2021); the 7 sources with significant emission lines are consistent show a similar distribution in the BPT diagrams to the IR-selected sample. Likewise, 8 of the 13 X-ray selected TDEs from eROSITA (Sazonov et al., 2021) show significant emission lines, and at least 2 of these sources are also in the LINER/Seyfert part of BPT diagrams.
We find that many of our sources do not show Seyfert or LINER ionization levels, indicating that the likelihood of previous AGN activity is low. Only 5 sources show any significant Seyfert or LINER ionization – WTP 14adbwvs, WTP 15acbgpn, WTP 16aatsnw, WTP 18aamced, WTP 17aamoxe. The first four of these sources were classified as AGN in SDSS with spectra taken before the IR flares, and we therefore place these sources in our silver sample, as we are less confident in their pure TDE nature. On the other hand, the spectrum of WTP 17aamoxe used for this analysis was taken after the IR flare and hence may be contaminated by ionization from the underlying TDE. An archival spectrum from before the flare shows no AGN-driven lines, suggesting that the Seyfert-like nature of WTP 17aamoxe may be a result of the TDE. It is important to note though that the archival spectrum was taken with larger fibers, and thus, nuclear emission lines may be diluted by host galaxy light (see Section 5.3 for more details). However, as there are no other indicators of AGN activity in WTP 17aamoxe, we place this source in our gold sample.
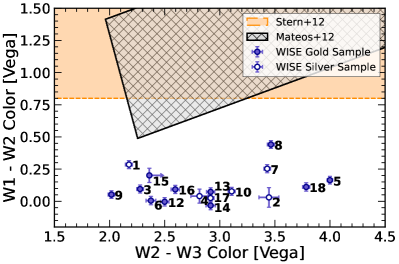
In addition to optical spectroscopic classification, IR colors are a useful indicator of AGN activity, as they can naturally distinguish between a stellar blackbody spectrum that peaks around 1.6 m and an AGN dust spectrum that is a power law in the near-IR (Stern et al., 2005). Having a separate indicator of AGN activity is useful, as recently there have been “optically quiescent quasars” found, which show no narrow emission lines indicative of AGN behavior, but which show AGN WISE colors (potentially due to full covering obscuring material; e.g. Greenwell et al., 2021). As is shown in Figure 3, all of the sources in our sample sit far from various different WISE color cuts for AGN, including W1-W2 0.8 from Stern et al. (2012) and a combination of W1-W2 and W2-W3 colors from Mateos et al. (2012). The fact that most of our sample sits far from these boundaries indicates that there is not significant concern for strong AGN contamination in the majority of the sample.
Lastly, we exclude two more sources, WTP 14abnpgk and WTP 14acnjbu, from our gold sample, as their WISE light curves show more activity than a single flare. In particular, WTP 14abnpgk appears to be rising again in the latest WISE data, and is actually a recent ZTF nuclear transient999https://www.wis-tns.org/object/2022mim with broad redshifted H and H emission (see Section C in the Appendix for more details on this source). Similarly, WTP 14acnjbu shows an initial small flare before the main flare. Such activity is suggestive of an underlying AGN, and thus, we conservatively place these two sources in our silver sample, despite the fact that their optical spectra and WISE colors do not indicate AGN activity. Additionally, the host galaxy properties of IR transients have recently been used to discriminate AGN from TDEs in the MIRONG sample (Dodd et al., 2023), although our sample suggests that IR-selected TDEs have a more diverse range of host galaxy properties than previously seen (see Section 6 and Section 8.1 for more details).
4.2 Contamination from SNe
As some SNe also show late-time IR excesses associated either with a dust echo or newly formed dust (e.g. Fox et al., 2010; Meikle et al., 2011; Szalai et al., 2011; Helou et al., 2013; Ergon et al., 2015), they are another potential contaminant to our sample. However, there are a number of reasons that SNe are not a significant contributor to our population. First, the majority of the mid-IR-detected SNe are much dimmer than what we find in our sample (e.g Fox et al., 2011; Tinyanont et al., 2016), and many SNe detected in the mid-IR emit for less than three years in the MIR (especially Type Ia SNe; e.g Tinyanont et al., 2016). In the MIRONG sample, which was agnostic to event type, Jiang et al. (2021b) found that the four SNe in their sample all had peak mid-IR luminosities of erg s-1, which would not have been included in our sample. Additionally, very few SNe can produce the large amounts of energy radiated by the events in our sample ( erg for most events; see Table 2 and Section 5.1 for more details). This lower bound on the radiated energy exceeds the standard values expected for typical SNe (e.g. Sukhbold & Woosley, 2016). More energy can be radiated in the sub-class of superluminous SNe (SLSNe; for a recent review, see Gal-Yam, 2019), but a recent study of SLSNe in the MIR suggests that these sources are still dimmer in the MIR than accretion driven flares ( few erg s-1; Sun et al., 2022). Likewise, these events are relatively rare compared to TDEs (e.g Quimby et al., 2013; Frohmaier et al., 2021) and they occur primarily in low mass and low metallicity galaxies (e.g. Leloudas et al., 2015; Perley et al., 2016). None of our TDE candidates reside in the type of galaxies expected to host SLSNe (see Section 6.2 and the left panel of Figure 10). Hence, we believe that there are no SLSNe contaminating our sample.
4.3 A Clean Sample of TDEs
We have taken care to exclude AGN and SNe from our gold sample of TDEs, through a combination of selection criteria, optical spectroscopic analysis, WISE colors, and WISE evolution. Based on energy, rate, and host galaxy arguments, we find that there are no clear SNe in our sample. We find a few sources which have AGN-like narrow emission line ionization states before the flare, but we note that none of these sources have WISE colors indicative of AGN and the majority sit very close to the composite region parameter space. After removing these potential weak AGN, we have a total of 12 remaining TDEs in our gold sample, which represents the purest sample of IR-selected TDEs to date. All but one of these gold sample TDEs show no evidence for any optical counterpart, indicating that this sample represents a previously missed population of dust-enshrouded TDEs. Table 2 gives the gold/silver designation for the entire sample, along with highlighting important criteria that went into this designation. Throughout the rest of this work, we will show both the silver and gold sample, but designate gold sources with filled markers (or mark them with ★) and silver sources with open markers. To reduce bias from potential AGN contamination, we only utilize the gold sample when discussing collective sample properties.
| ID | WTP Name | AGN/LINER from BPT? | X-rays | Transient Lines | ( erg) | Sample Designation |
|---|---|---|---|---|---|---|
| 1 | WTP 14abnpgk | 4.3 | Silver | |||
| 2 | WTP 14acnjbu | 1.7 | Silver | |||
| 3 | WTP 14adbjsh | 3.7 | Gold | |||
| 4 | WTP 14adbwvs | 0.8 | Silver | |||
| 5 | WTP 14adeqka | 9.4 | Gold | |||
| 6 | WTP 15abymdq | 4.2 | Gold | |||
| 7 | WTP 15acbgpn | 7.7 | Silver | |||
| 8 | WTP 15acbuuv | 4.0 | Gold | |||
| 9 | WTP 16aaqrcr | 0.9 | Gold | |||
| 10 | WTP 16aatsnw | 2.8 | Silver | |||
| 11 | WTP 17aaldjb | 1.3 | Gold | |||
| 12 | WTP 17aalzpx | 3.2 | Gold | |||
| 13 | WTP 17aamoxe | 6.4 | Gold$\dagger$$\dagger$footnotemark: | |||
| 14 | WTP 17aamzew | 1.9 | Gold | |||
| 15 | WTP 17aanbso | 0.4 | Gold | |||
| 16 | WTP 18aajkmk | 2.9 | Gold | |||
| 17 | WTP 18aamced | 1.9 | Silver | |||
| 18 | WTP 18aampwj | 7.0 | Gold |
5 Flare Properties & Evidence for Dust-Enshrouded Accretion
5.1 IR Flare Evolution & Energetics
In Figure 1, we show each IR flare from WISE, with the corresponding multi-wavelength coverage plotted in the bottom panels. As per our selection criteria, these TDE candidates show a sharp rise followed by a smooth, slow decline back to the baseline flux. They span over an order of magnitude in peak IR luminosity ( = 1042– erg s-1), and most are still IR bright in the latest WISE epoch (second half of 2022), despite it being more than 5 years since disruption for all sources.
The exact energetics of the flares depend on the shape of the dust SED, which depends on the dust composition, temperature, and size of the grains. Given that we only have access to two photometric bands with WISE, we have very limited knowledge of the IR spectral shape and hence, cannot disentangle different dust emission models. Therefore, we fit the WISE data with both a simple, single temperature blackbody and a modified blackbody, or “gray body” (e.g. Draine & Lee, 1984), with , as in van Velzen et al. (2016) for graphite dust grains with a grain size of m. From these fits we derive both the temperature and integrated IR luminosity, which we can then use to infer the emitting radius of the dust (see Figure 5). Following Panagiotou et al. (2023), we adopt a 10% systematic uncertainty on the WISE fluxes to account for the changing PSF of the telescope across different visits. To assess the uncertainty on the fit parameters, we resample the WISE data points from within their respective uncertainties and fit these new data points, repeating this process 1000 times to create a distribution of best-fit temperatures and normalizations that are consistent with the data. The majority of our sources show a very similar temperature evolution; the initial part of the flare is relatively hot ( K for the blackbody model, with the modified blackbody giving temperatures that are on average 300 K lower), followed by cooling to lower temperatures ( K for the blackbody). This behavior can also be seen qualitatively by the increase in the W2 to W1 flux ratio during the evolution of the flares in Figure 1.
With the best-fit blackbody, we estimate the cumulative amount of energy released in the IR by each flare. The flares emit from – erg, with no correlation between the time since the flare and the emitted energy, indicating that we are not missing a significant fraction of energy from the flares that began later. The value of from the blackbody fit for each flare is reported in Table 2. However, it is important to note that these estimates are lower bounds on the total radiated energy because there may be energy emitted in other bands that is not absorbed and reprocessed by the dust (e.g. hard X-rays) and the dust may not cover the entire sky and thereby only re-emit a portion of the intrinsic optical/UV/soft X-ray flare. The covering factor is usually estimated by measuring the ratio of the intrinsic flare emission to the dust reprocessing flare, but we do not see the intrinsic flare in many of these events. However, the sharpness of the light curves imply relatively small radii, comparable to the radii from blackbody models, thereby suggesting relatively high covering factors, which we address further in the following subsection.
We find that the majority of the TDE candidates in our sample show little observable transient emission outside of the mid-IR flare identified by WISE. In particular, only three sources were detected by optical surveys – WTP 14abnpgk (identified as a nuclear transient by ZTF during its secondary rise in 2022), WTP 18aampwj (identified by ASAS-SN and originally classified as a SN; Falco et al., 2018), and WTP 18aamced (identified as a new changing-look LINER by ZTF; Frederick et al., 2019). Upon investigation of the ATLAS data for all 18 transients, we also identified a possible optical transient in WTP 18aajkmk that is temporally coincident with the WISE flare. The transient is not seen in ZTF, but this could be due to timing relative to when the ZTF reference images were taken. Further details of the optical counterparts and a detailed description of each source are given in Section C of the Appendix (see also Figure 17). The lack of optical counterparts in the majority of the events in our sample and the relatively dim nature of the detected optical transients relative to the IR peak suggests that the optical flux is highly attenuated in these systems.
5.2 Dust Distributions
The WISE light curves encode information about the location of the emitting dust. Specifically, the rise time is set by the distance from the central irradiating source, as more distant dust leads to a longer rise time set by the extended light travel time to the far side of the dust distribution. We can therefore estimate the location of the dust with respect to the central irradiating source by modeling the WISE light curves with a simple spherical shell model for the dust, the details of which are given in van Velzen et al. (2016). In short, the IR light curve can be written as the convolution between a response function of the dust, , and the intrinsic light curve, , which is given by
| (1) |
where is the delay as a function of the polar angle (). For a simple spherical shell model for the dust, the response function is a top-hat in , uniform from to and 0 elsewhere. We also need to assume an underlying optical/UV flare to model the WISE light curves. As the majority of our flares have no observable optical/UV flare, we assume that the underlying flare follows a power law decline, given by
| (2) |
as is commonly used in modeling of the optical flares of TDEs (e.g. van Velzen et al., 2021b; Hammerstein et al., 2023; Yao et al., 2023). As the majority of the TDEs in our sample do not show a strong optical flare, we set the constant of normalization, , to be 1 and fit for the amplitude of the resulting IR flare. This yields a model with four free parameters – the radius of the dust shell, amplitude of the IR flare, peak time, , and the fall-back time, .
We fit both the W1 and W2 light curves simultaneously with this spherical shell model, with all parameters tied across the two bands. As this simple model cannot account for changing temperature, we fix the ratio between the W1 and W2 fluxes to that from a blackbody with the temperature fixed at the average across the entire flare. This provides a sufficient fit to the two bands, as there is only mild temperature evolution in these flares. Full radiative transfer is needed to account for temperature evolution, which is beyond this scope of this work, but will be explored in the future. We fit the model using the emcee package (Foreman-Mackey et al., 2013) to implement Markov Chain Monte Carlo (MCMC) fitting routines with the likelihood in Equation (21) of van Velzen et al. (2016) and uniform priors across all parameters. The chains contained 32 walkers and were initialized based on a maximum likelihood fit. For each walker, we burned the first 500 chain steps and then ran the chain for 5000 more steps, enough to have well-sampled and stable chains. The majority of sources showed relatively well-behaved chains, but some sources exhibited mild degeneracy between the radius and amplitude parameters, likely arising from the sparsely-sampled WISE light curves. For the purposes of this work, however, this does not pose a significant issue, as we capture the mild degeneracies in our parameter uncertainties. We show the best-fitting model, along with the model from a random sample of 100 MCMC steps, overplotted on the WISE data in Figure 4.
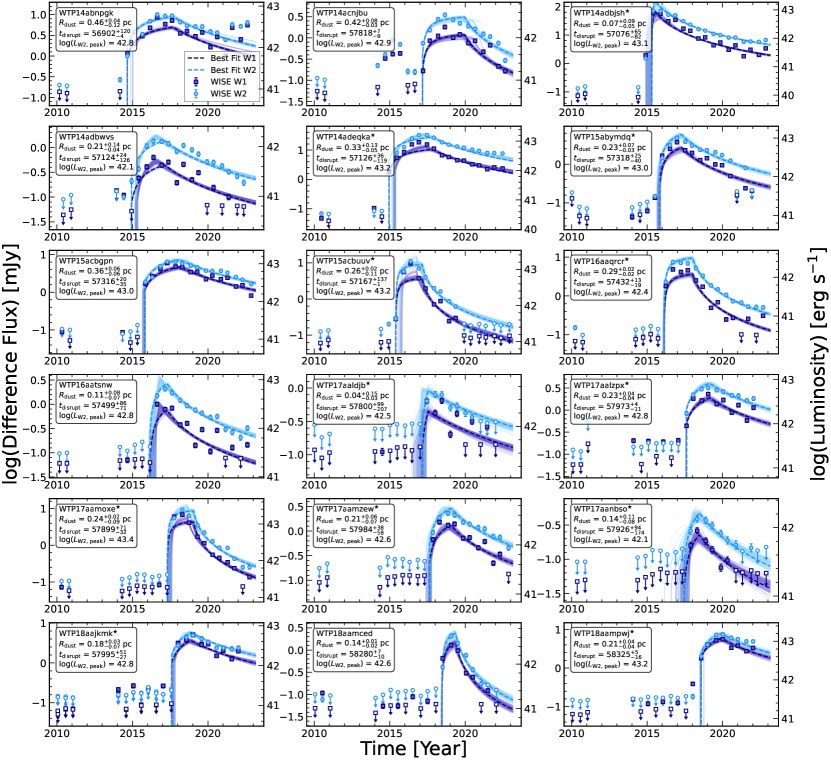
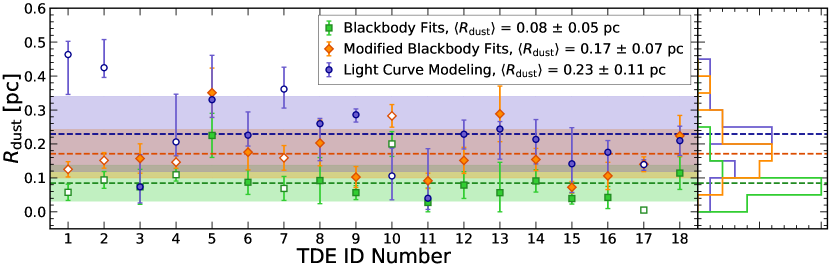
The dust radii span from 0.05 to 0.46 pc with an average of pc, which corresponds to a range of light travel times between 60 and 550 days. It is important to note that by selecting sources whose IR light curves showed fast rise, slow decline behavior, we implicitly restricted our sample to sources where the dust was located relatively close to the nucleus as the IR rise time is set by the distance to the dust. Figure 5 shows the derived radii for each TDE candidate from our light curve modeling, compared with the radius estimated from both a standard and modified blackbody (i.e. ) at the peak of the IR outburst. The radius estimates from the blackbody fits are systematically smaller than the estimates based on the light curve modeling. This is expected, as a blackbody is the most efficient radiation mechanism and thereby provides an absolute lower limit on the radius. However, the radius estimates from the modified blackbody fits are between the light curve and blackbody estimates, and these estimates are often close to or within uncertainty of the light curve modeling estimates. This general agreement between the radii suggests that the covering factor is high () in these systems since the observed blackbody and modified blackbody luminosities are dependent on the covering factor. This is much higher than what is typically seen in optically-selected TDEs, where the covering factor, which can be directly measured as the IR to optical flux at peak, is on the order of 1% (Jiang et al., 2021a). A comparably high covering factor () has also been seen in the recent discovery of a bright MIR flare ( erg s-1) around an optical and X-ray emitting TDE (Wang et al., 2022b). We caution that an exact measurement of the covering factor is not possible in these IR-selected TDEs, given that the optical flare is not observed in most of these systems. Estimating the covering factor from the IR light curve alone requires significant assumptions about the dust temperature, size, and composition that can lead to over an order of magnitude uncertainty. However, this analysis corroborates the idea that this sample of IR-only emitting TDEs are highly dust obscured TDEs.
5.3 Transient Emission Lines in the Optical and Near-IR
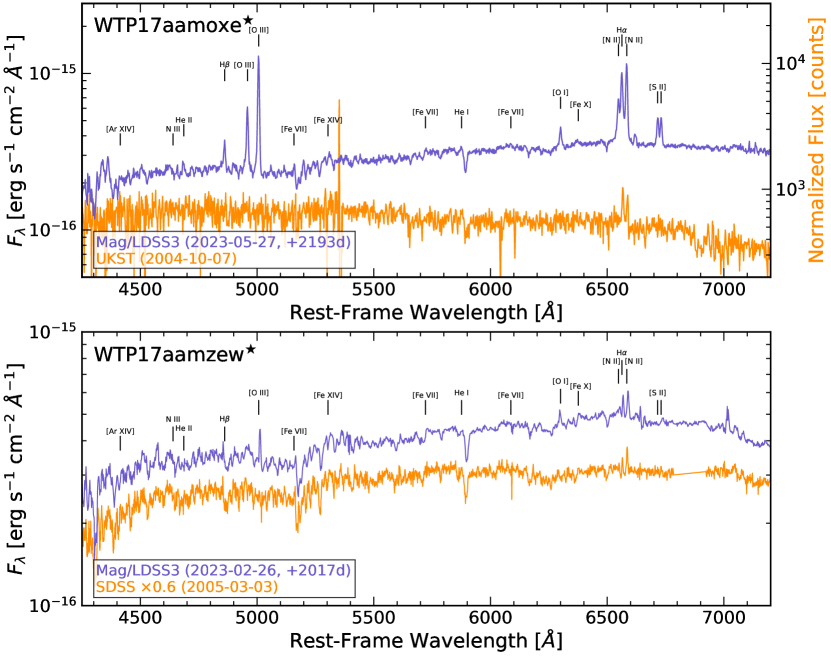
With our follow-up spectroscopy program, we identified a few sources that showed evidence of spectral changes on timescales of months to years. Two sources, WTP 17aamzew and WTP 17aamoxe, showed the potential appearance of forbidden narrow lines commonly associated with accretion, which is highlighted in Figure 6. The SDSS spectrum from 2005 of WTP 17aamzew did not show significant emission lines from [O III], [O I], or [S II]. However, our 2023 spectrum showed that both narrow [O III] and [O I] emission lines has appeared at 5 significance and with strengths suggesting LINER-like ionization. The flux has increased from erg s-1 cm-2 Å-1 in the 2005 SDSS spectrum to erg s-1 cm-2 Å-1 in the 2023 spectrum. These lines were detected 6 years after the initial IR flare, which, if they arise from the ionization from the TDE, implies that the gas is on the order of a few parsecs from the SMBH. Similarly fast variability in narrow lines is not that common, but it has been seen in at least one AGN with high-cadence spectral monitoring (Peterson et al., 2013) as well as in extreme coronal line emitters, which are thought to be associated with TDEs in gas-rich environments (Yang et al., 2013; Clark et al., 2023). Another source that potentially shows a similar evolution is WTP 17aamoxe, with an archival spectrum from the 6dF galaxy redshift survey (Jones et al., 2004, 2009). The 6dF spectrum, taken on the UK Schmidt Telescope (UKST) in 2004, does not show strong emission lines from [O III], [O I], or [S II]. However, our 2023 spectrum shows strong [O III], [O I], and [S II] features with Seyfert-like ionization levels, suggesting a recent increase in ionization levels, potentially associated with the TDE. We caution, however, that direct comparison of the narrow lines in these different spectra is complicated by the use of different telescopes, spectrographs, and seeing conditions. In particular, the 6dF survey was performed with 6.7″ fibers, and thus any nuclear emission lines in the 2004 spectrum of WTP 17aamoxe could be diluted by a significant contribution from the host galaxy light. Further monitoring of these sources is necessary to search for continued changes to the optical spectra.
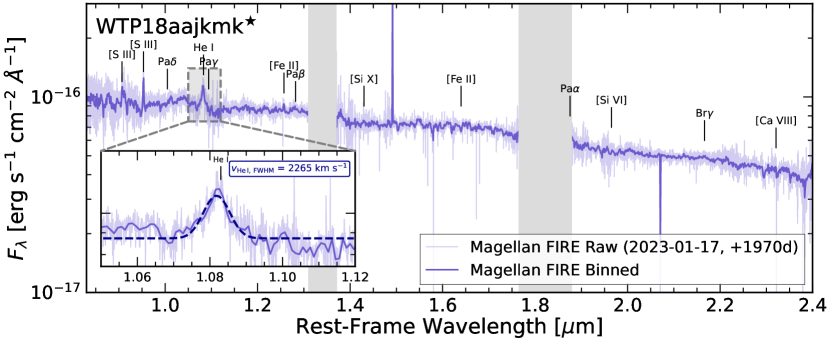
Two sources in our sample show broad emission lines, which are commonly seen in optical and X-ray selected TDEs (e.g. van Velzen et al., 2021b; Hammerstein et al., 2023). Figure 7 shows the optical and near-IR spectra for these two sources. In the near-IR, WTP 18aajkmk shows the appearance of a broad ( km s-1) He I line at 1.083 m in 2023, which could arise from the scattering of this emission by polar dust into our line of sight (e.g. Kool et al., 2020). Although we do not have archival spectroscopic observations in the near-IR of this source, the lack of other broad emission lines in the near-IR is unusual for an AGN (Landt et al., 2008). Interestingly, this spectrum was taken nearly 5 years after the initial flare, and the optical spectrum of WTP 18aajkmk taken around the same time shows no evidence for any broad emission lines. We suggest that this could be due to decreasing flux of the broad H line with time, combined with a significant amount of host galaxy H light (e.g. from star formation) that can easily drown out the broadened emission. Additionally, WTP 18aampwj, one of the few sources in our sample which has an optical counterpart in ZTF, shows a broad ( km s-1) H line shortly after its initial detection in the optical. However, a recent spectrum taken in July 2023, reveals that the broad H line has faded in the last 5 years, consistent with most optical TDEs which show fading broad lines over the course of a few years. This is also consistent with the idea that the broad Balmer lines become increasingly more difficult to detect compared to near-IR lines at late times.
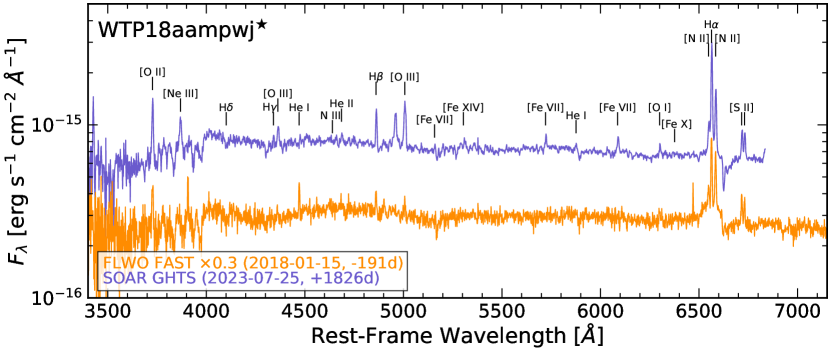
The recent spectrum of WTP 18aampwj also shows the formation of narrow coronal emission lines associated with highly ionized iron, which have also been seen in late-time spectra of two optical TDEs (Onori et al., 2022; Short et al., 2023). The most prominent lines are [Fe VII] 5721 and [Fe VII] 6087, which have an ionization potential (IP) of nearly 100 eV, suggesting that there must be a FUV/soft X-ray ionizing source. However, there is no evidence for higher ionization species like [Fe X] or [Fe XIV], which require IP = 235, 360 eV, respectively. Given the gap in spectral coverage from 2018-2023, we are not able to determine when the coronal lines turned on in this source, but continued monitoring will allow us to determine whether they are increasing or decreasing in flux. In addition to the coronal lines, the new spectrum of WTP 18aampwj also shows increased strength in the various narrow forbidden lines, including [O III] and [O I], similar to WTP 17aamoxe and WTP 17aamzew. Thus, we suspect that the strengthening of these lines and the appearance of coronal lines are the result of reprocessing of the initial TDE flare in more distant material, akin to the narrow line region in AGN.
With the exception of WTP 14abnpgk, which is a recent optical transient amid a secondary rise in the WISE light curves (see Section C in the Appendix), the remainder of our sources show no clear evidence for transient, accretion-induced emission line changes. This could be due to the fact that many are heavily dust obscured and the majority of our follow-up efforts have been with optical spectroscopy. However, we observed six additional sources in the near-IR and found no evidence for any broad lines associated with the Paschen series or He I. Importantly, the timescales we are probing are much longer than the typical timescales studied in optical and X-ray selected TDEs, which are often tracked for up to 1-2 years. Typically, the broad lines in optical and X-ray selected TDEs fade on these 1-2 year timescales. Hence, our follow-up campaign, which ranges from 5-9 years after the IR flare, may lack spectral changes simply due to the different timescales probed. However, the appearance of accretion-induced narrow lines at 5 years since the initial flare motivates further spectroscopic follow-up of all TDEs to longer timescales.
5.4 Late-Time X-ray Emission
Strong X-ray emission from the nucleus of a galaxy is an indication of ongoing accretion, either from a TDE or an underlying AGN. AGN tend to have X-ray spectra with a power-law arising primarily from inverse Compton scattering of accretion disk photons by a hot, optically thin plasma called the corona (e.g. Ricci et al., 2017). The observed spectrum is often modified by various effects, like dust and gas attenuation, disk outflows, and reflected emission, but these components can often be disentangled from one another with spectral models. TDEs, on the other hand, exhibit far less standardized X-ray emission, with some TDEs showing no X-ray emission, some showing only soft, thermal emission from the accretion disk, and others showing a late-time hardening of their X-ray spectrum, suggesting the formation of a corona (Saxton et al., 2020; Guolo et al., 2023). It is still poorly understood why there is such a range of X-ray properties in TDEs. Besides a potential dependence on the viewing angle (Dai et al., 2018), the SMBH accretion history can also influence the observed properties. Hence, understanding the X-ray emission in this sample of IR-selected TDEs is two-fold: it first provides convincing evidence for ongoing accretion in some of these systems, and second, allows us to probe the X-ray properties of a potentially new population of TDEs to compare to optically-selected samples.
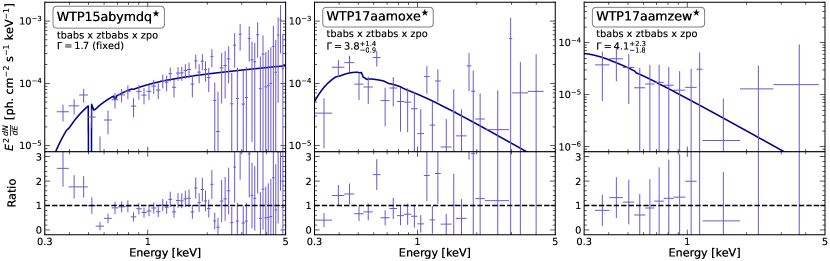
Three of the eight sources (WTP 15abymdq, WTP 17aamoxe, WTP 17aamzew) in the German half of the eROSITA sky show significant X-ray detections, all in more than one eRASS epoch. All three detected sources show significant variability between the eRASS epochs, suggesting that the X-ray emission is indeed associated with accretion. As in optical and X-ray selected TDEs, their X-ray spectra show a wide range of spectral shapes and qualities. To model the eROSITA spectra, we use XSPEC (v12.12.1; Arnaud, 1996) and group the spectra with the Kaastra & Bleeker (2016) optimal binning technique with a minimum of 1 count per bin. We fit in the 0.3-5 keV range and employ Cash statistics (Cash, 1979) when fitting, given the low count nature of these spectra. In Figure 8, we show the best fitting eROSITA spectrum with all of the detections combined into a single spectrum and the average model parameters from all epochs.
5.4.1 WTP 15abymdq
WTP 15abymdq was detected with eROSITA in all five eRASS epochs with a 0.2-2.3 keV luminosity ranging between erg s-1. The X-ray spectrum is quite hard, with a best-fit photon index ranging from across the five eRASS epochs when no obscuration is included. Such low photon indices are often indicative of significant obscuration, and indeed, we can obtain comparable fit statistics when fitting with the photon index fixed at and including neutral obscuration with a variable column density across the five eRASS epochs. The required column densities in each epoch span from cm-2 on the low end, up to cm-2 on the high end. The data can also be fit with a constant neutral and ionized absorber; in this scenario, the best fitting model has a photon index of and a neutral column density of cm-2. Given the low flux of this source and the soft nature of the eROSITA response, we cannot distinguish between these two models. However, both suggest that the underlying X-ray spectrum can be a standard Comptonized emission and low levels of obscuration. Such hard X-ray emission is rather uncommon in TDEs, but has been observed in late-time X-ray follow-up of some TDEs, often when the accretion rate has dropped considerably (e.g. Chakraborty et al., 2021; Wevers et al., 2021; Yao et al., 2022). Further deep monitoring in the X-ray band is needed to probe whether this source continues to be X-ray bright and AGN-like or whether the X-rays fade, as expected for a TDE when it runs out of fuel.
5.4.2 WTP 17aamoxe
WTP 17aamoxe was detected with eROSITA in the first of four eRASS scans, with a 0.2-2.3 keV luminosity that ranged from erg s-1. On the contrary to WTP 15abymdq, WTP 17aamoxe shows a relatively soft X-ray spectrum. When we fit all three eRASS epochs in which WTP 17aamoxe was detected simultaneously with an absorbed power law model, the best-fit photon index is , with negligible neutral obscuration required. A similarly good fit can be found by assuming a blackbody model, which gives a best-fit temperature of keV. This is still relatively hot for standard accretion disks around supermassive black holes, but is comparable to many of the X-ray spectra in the eROSITA TDE sample (Sazonov et al., 2021). Allowing the temperature to vary across the observations does not provide significant improvement to the fit, but interestingly, the brightest epoch actually is slightly cooler than the two dimmer observations. Such a soft X-ray spectrum is unlike most AGN X-ray spectra (Ricci et al., 2017), but is seen rather often in optical and X-ray selected TDEs (Saxton et al., 2020).
5.4.3 WTP 17aamzew
WTP 17aamzew was detected with eROSITA in the first, second, and fourth eRASS scans, with a 0.2-2.3 keV luminosity that stayed roughly constant around erg s-1. However, WTP 17aamzew was also detected by the XMM-Newton Slew Survey twice in 2018, where the X-ray luminosity was much larger ( erg s-1). As with the other two sources, the variable nature of the X-ray emission points to an accretion-driven origin of the X-ray emission. The eROSITA spectrum of WTP 17aamzew is extremely soft, even more so than that of WTP 17aamoxe. With a simultaneous fit to the three eRASS epochs in which WTP 17aamzew was detected, we find that an absorbed power law fits well with with negligible absorption required. As with WTP 17aamoxe, the data is equally well fit by a blackbody, which gives a best fit temperature of keV. This is again comparable to the temperatures of other eROSITA X-ray spectra of TDEs (Sazonov et al., 2021), and relatively consistent with what is seen in TDE X-ray spectra (Saxton et al., 2020).
6 Host Galaxy Properties
6.1 Galaxy Morphology
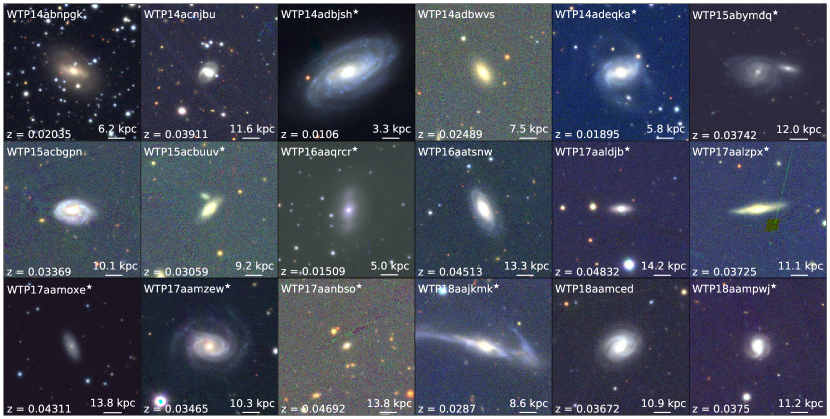
In Figure 9, we show the host galaxy color images of the 18 TDE candidates. There is a wide range of host galaxy morphology across the sample, including numerous galaxies with clear spiral structure and a few disturbed or merging galaxies, both of which are not usually seen in optical TDE searches. For comparison with optical TDE searches, we refer the reader to Figure 4 of van Velzen et al. (2021b) and Figure 2 of Hammerstein et al. (2023), which show the host galaxy color cutouts for the TDEs identified in first ZTF survey. We caution, though, that the ZTF sample and our WISE-selected sample probe very different redshift ranges, with the majority of the ZTF TDEs being found at a redshift of , whereas all of our sources are at .
6.2 SED Modeling
For a quantitative assessment of the host galaxy properties of these TDE candidates, we model the spectral energy distribution (SED) of each host galaxy using pre-flare broad-band photometry. All photometry was obtained from existing catalogs and is corrected for Galactic extinction. We utilized archival GALEX photometry (Martin et al., 2005) for both the NUV and FUV bands, including only detections. For the optical, we obtained SDSS model magnitudes (Stoughton et al., 2002) where available, PanSTARRS Kron magnitudes (Chambers et al., 2016) for those galaxies not in the SDSS footprint, and SkyMapper petro magnitudes (Wolf et al., 2018) for the three southern-most sources, which are in neither the SDSS or PanSTARRS footprints. Finally, we include pre-flare, profile-fit photometry from the 2MASS extended source catalog (Skrutskie et al., 2006) and the AllWISE catalog (Wright et al., 2010) in the near- and mid-IR, respectively.
To allow for direct comparison with the literature on optical and X-ray selected TDEs, we model the SEDs using the same methodology as past work (see e.g. Sazonov et al., 2021; van Velzen et al., 2021b; Hammerstein et al., 2023; Yao et al., 2023). In short, we use the prospector software (Johnson et al., 2021) to fit the flexible stellar population synthesis (FSPS; Conroy et al., 2009; Conroy & Gunn, 2010) models assuming a delayed, exponentially declining star formation history with a Chabrier initial mass function (Chabrier, 2003). This model has a total of five free parameters: the galaxy stellar mass, characteristic age of the stellar population, e-folding timescale of the star formation history, metallicity, and dust optical depth, assuming the extinction law from Calzetti et al. (2000). To estimate uncertainties on the parameters, we ran MCMC samplers using the emcee package (Foreman-Mackey et al., 2013). The chains contained 100 walkers and were initially populated based on a maximum likelihood fit. We utilized a conservative burn length of 500 chain steps per walker and then ran the chain for 1000 steps per walker, which was enough for all candidates to have well-sampled and stable chains. We show the resulting SED fits with the photometry in Section B of the Appendix.
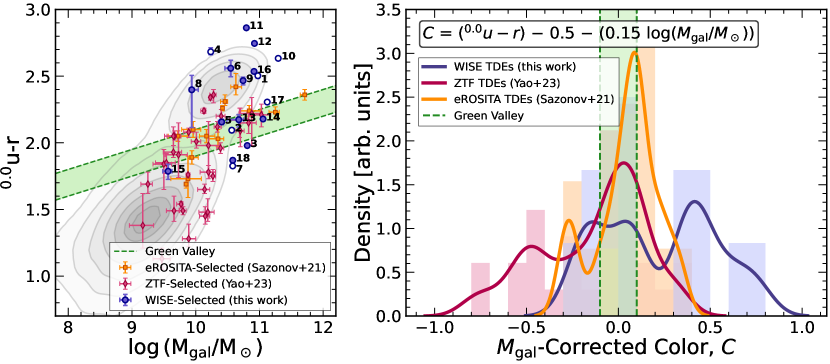
From the MCMC fits, we estimate the rest-frame color (denoted ) and the stellar mass of the host galaxy101010For consistency with past work, we report the surviving stellar mass (i.e. the total stellar mass times the fraction of mass which survives to present day and is not lost due to stellar winds or supernovae) for the stellar mass of the host galaxy.. The resulting values are shown in the left panel Figure 10, with a sample of SDSS galaxies in the same local volume () from Mendel et al. (2014) shown in grey contours. Past works have found that the optical and X-ray selected TDEs have a strong overdensity in the green valley (e.g. Sazonov et al., 2021; van Velzen et al., 2021b; Hammerstein et al., 2023; Yao et al., 2023), which can be seen in the optical and X-ray selected TDE populations shown in orange squares and red diamonds, respectively, in Figure 10. From a simple visual examination, it is evident that the IR TDEs in our sample occupy a different part of the color-mass parameters space. For a quantitative assessment, we compute the mass-corrected color, (which is the distance from the green valley, as defined in Yao et al., 2023), and compare our gold sample to the optical and X-ray selected samples using the two-sample Anderson-Darling test. We find that the optical population from ZTF (Yao et al., 2023) is different from the IR-selected population with a p-value of 0.002, but the p-value between the X-ray population from eROSITA (Sazonov et al., 2021) and the IR population is just 0.107. However, the combined sample of both optical and X-ray populations is different from the gold IR-selected population with a p-value of 0.002, suggesting that the IR-selected TDEs in our sample represent a different population of TDE host galaxies. In the right panel of Figure 10, we show the distributions of this mass-corrected color from the WISE, ZTF, and eROSITA samples. The solid lines show a Gaussian-smoothed histogram for each sample, which highlights that our IR-selected sample from WISE does not show a strong green valley overdensity and instead has a flatter distribution in color space.
Our IR-selected TDEs appear to be biased towards redder and more massive systems than the optical and X-ray selected TDEs. Naively, these findings appear inconsistent with star-forming galaxies, which are often thought of as less massive and bluer than their passive, elliptical counterparts. However, the bias towards massive systems is likely the result of only selecting the brightest IR flares due to our choice of selection criteria and the limited sensitivity of WISE. This high luminosity threshold leads to preferentially selecting more massive black holes (assuming that TDEs accrete at some roughly constant fraction of the Eddington limit) and thereby more massive host galaxies. We note that the MIRONG sample, which also uses the WISE photometry, shows a similar mass bias compared to optical TDEs (Jiang et al., 2021b), although they probe nuclear transients out to a higher redshift, which can influence the sample bias as well. Importantly, the host galaxies of the IR-selected TDEs are not too massive to host SMBHs that can disrupt Sun-like stars (; see Section 8.3 for approximate SMBH mass estimates from scaling relations using host galaxy mass).
Moreover, the redder colors of the host galaxies of the WISE TDEs could be due either to heavy dust reddening or older stellar populations. Disentangling these two factors requires more sophisticated modeling, as the current single dust attenuation screen and simple parametric star formation history predicts extremely high ages (near the maximum allowed value of 12.5 Gyr for the majority of the sources). We investigated the correlation between these two parameters in our SED modeling by fixing the age at 6 Gyr and found the same qualitative results that the IR-selected TDEs are generally redder and more massive. This did lead to a slight decrease in the masses (0.15 dex on average), but produced consistent colors on average. We also tried fixing the dust optical depth at the value that can be derived using the Balmer decrement from the optical spectra. These spectra are taken from the nucleus, however, and yielded poor fits to the photometric data of the host galaxy as a whole. This suggests that the dust content of these galaxies is highly spatially variable and that more sophisticated modeling of the dust, rather than a simple single screen, is necessary to learn more about more about the host galaxies from their SEDs. This is beyond the scope of this initial sample paper, but will be explored in follow-up work.
6.3 Spectroscopic Classification
In addition to a green valley overdensity, optically-selected TDEs have also been found to preferentially occur in quiescent Balmer-strong, E+A, or post-starburst galaxies (e.g. Arcavi et al., 2014; French et al., 2016; Law-Smith et al., 2017; Graur et al., 2018; Hammerstein et al., 2021). These systems are characterized by low H equivalent width (EW), which indicates very little active star formation, coupled with a strong H absorption index, which traces the amount of A type stars and thus indicates significant star formation in the last 1 Gyr. French et al. (2016) found that the majority of optical TDEs from SDSS, ASAS-SN, Palomar Transient Facility, and PanSTARRS fell into this class of post-starburst galaxies. Recent works with larger samples of both optical and X-ray selected TDEs, albeit with somewhat more relaxed criteria for what qualifies as a TDE, have found that this overrepresentation exists but is not as strong as in the initial sample (Law-Smith et al., 2017; Graur et al., 2018; Hammerstein et al., 2021). As with the green valley overdensity of TDE hosts, the prevalence of post-starburst systems has been potentially linked to a temporary enhancement in the TDE rate in post-merger systems, which tend to be more centrally concentrated.
For those sources in our sample with coverage in the H part of the optical spectrum ( = 4102 Å), we compute the H EW and the H absorption index to compare to optical and X-ray selected TDEs. Following past studies, we remove the stellar absorption contribution in the H region before fitting for the EW (see Section 4.1 for more details on the removal of the stellar continuum). For those sources in SDSS, we adopt the H absorption indices from the MPA-JHU catalog (Brinchmann et al., 2004). We also utilize the SOAR GHTS blue-sided spectrum of WTP 14adbjsh, the Gemini GMOS observation of WTP 17aamoxe, and the archival FLWO FAST observation of WTP 18aampwj, both of which have spectral coverage in the H portion of the spectrum. For these objects, we follow the procedure and bandpasses outlined in Worthey & Ottaviani (1997) for computing H. We caution, however, that for sources in the silver sample or sources with spectral measurements from more than 5 years after the IR flare (e.g. WTP17aamoxe, #13), there may be contamination of the H line from accretion-driven excitation, thereby complicating a direct use of H as a proxy for star-formation.
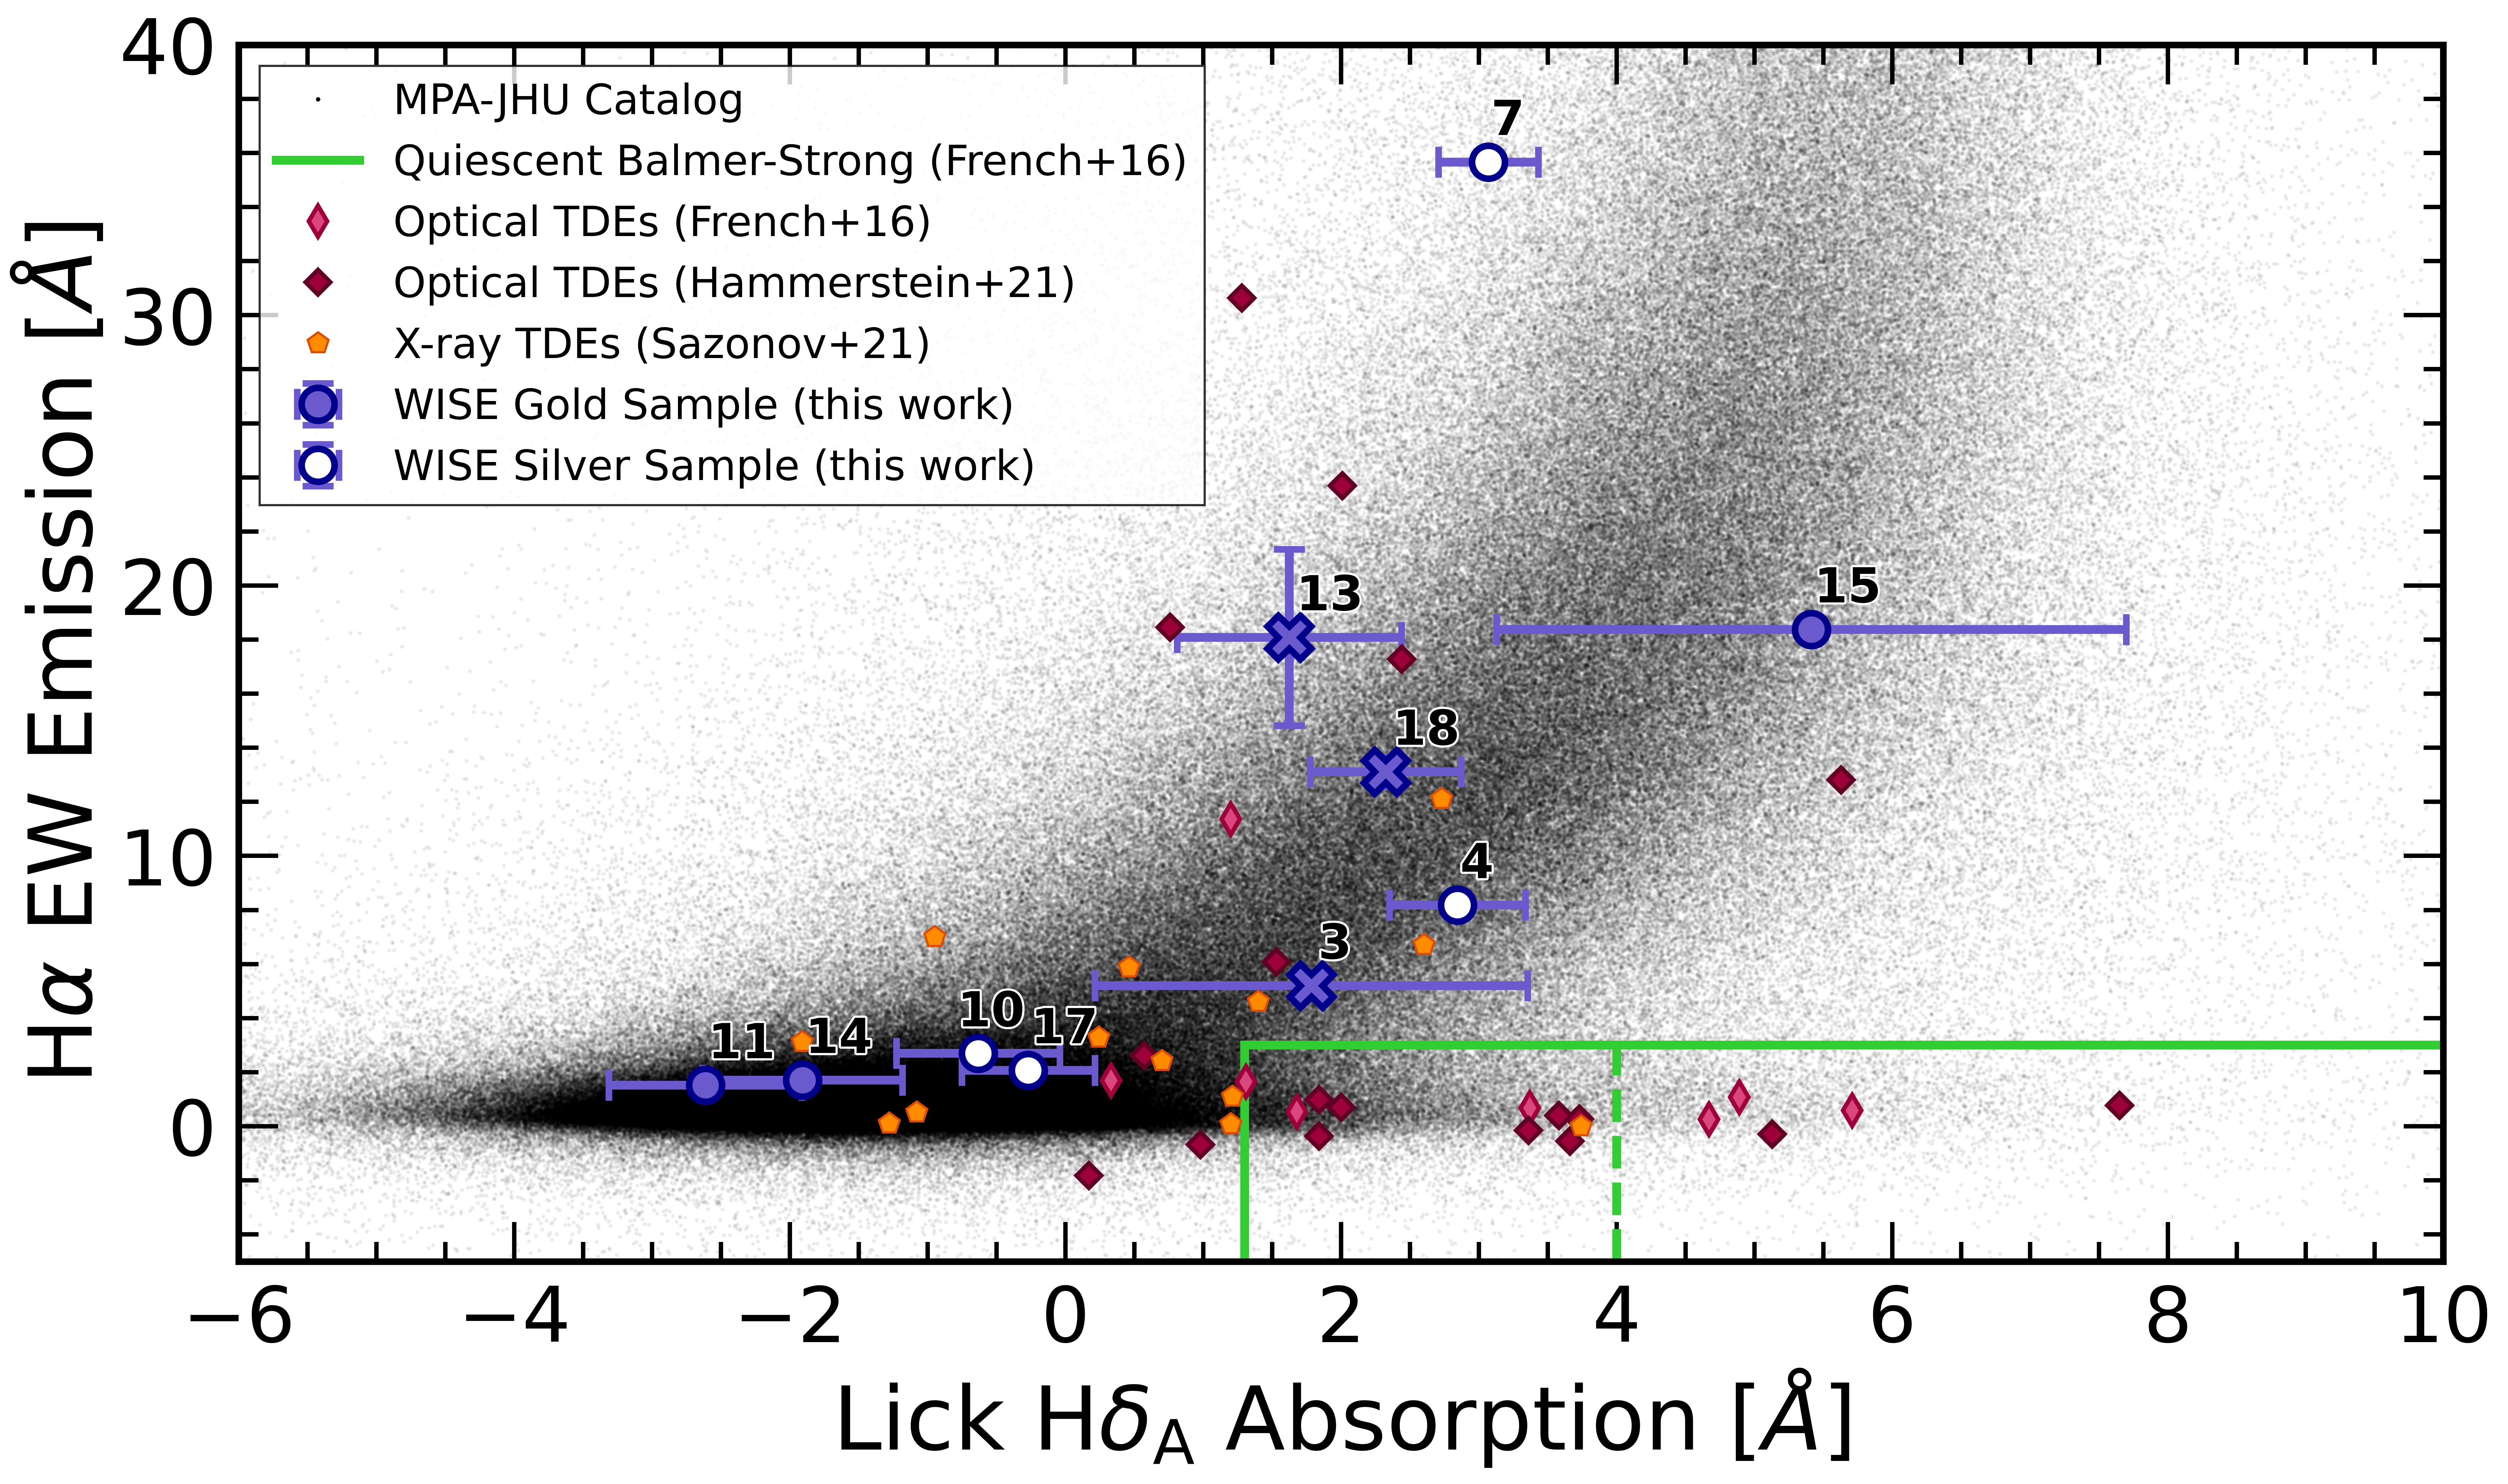
None of our sources sit in the post-starburst regime, defined by French et al. (2016) as having H EW 3 Å and either H Å or H Å, for the weak and strong post-starburst classification respectively. We show the 10 sources in our sample with H measurements in Figure 11, along with the optical and X-ray selected TDEs for comparison. While the remaining 8 sources in our sample do not have sufficient coverage to allow us to compute the H absorption index, many of these sources show strong H emission EW, indicating that there is active star formation going on in many of these systems. To test whether the 6 gold sources were drawn from the underlying population, we utilized a 2D implementation of the Kolmogorov-Smirnov (KS) test, with re-sampling of the underlying MPA-JHU sample to compute the p-value. We find a p-value of 0.52, indicating that the WISE TDE sample is consistent with arising from the full MPA-JHU catalog. Hence, this IR-selected TDE sample does not have the same overrepresentation of post-starburst galaxies compared to optically-selected populations.
7 A Mid-IR View of TDE Rates
This new population of IR-selected TDEs seems to be hidden from typical detection methods, like optical and X-ray surveys, and has been unaccounted thus far in TDE demographics. Therefore, this sample has important implications for the overall rate of TDEs in the local universe, which we estimate in this section. For this, we utilize only the gold sample, which was defined in Section 4.3 and is given in Table 2.
The observed rate of TDEs can be easily computed, using
| (3) |
where is the number of TDEs we detected in our sample (12 for the gold sample), is the total number of galaxies we cross-matched the WISE sample against ( for the CLU sample), and is the time period we are sensitive to with our search (5 years for the case of this survey). This yields a rate for our gold sample of galaxy-1 year-1. However, this simplistic rate fails to account for numerous biases, including the fact that galaxy samples are incomplete at even the relatively low redshifts probed in this sample (Fremling et al., 2020) and that the cadence and depth of the WISE survey means we may have missed some transients.
We account for missing events due to the cadence and depth of the WISE survey by computing the detection efficiency (DE) using simulated light curves. For each source, we simulated 103 light curves based on the best-fitting dust model detailed in Section 5.2. We then computed the probability that the source was detected in each of the simulations by applying the following detection criteria: the source must be detected at a peak IR luminosity of erg s-1, be detected in difference imaging for at least 5 WISE epochs (2.5 years), and not saturate the WISE detectors. The Malmquist bias is accounted for in these simulations by allowing the redshift of each simulated light curve to vary, assuming a uniform number density, such that the number of sources scales as with due to the increasing volume. The majority of the sources in our sample have a detection efficiency that is very close to 1, indicating that we detected most of the WISE TDEs with erg s-1 in the galaxies in this sample. Only the sources with the lowest peak luminosity have significantly lower detection efficiencies, which primarily arise because they would not be detected in 5 WISE epochs.
To account for the incompleteness of the CLU galaxy catalog, we utilized the redshift completeness fraction (RCF) from Fremling et al. (2020), which estimates the probability that a given nearby galaxy will have a spectroscopic redshift. The RCF is a function of both redshift and the W1 absolute magnitude (i.e. a proxy for stellar mass). Hence, as with the detection efficiency, we compute the RCF for each of our TDEs with their respective redshift and W1 magnitude.
The detection efficiency and galaxy completeness factors are then used as weights for each TDE in our sample. The true rate is then given by
| (4) |
where and . This yields a total rate of mid-IR TDEs of galaxy-1 year-1, where the uncertainty here accounts for the uncertainty on both the detection efficiency and galaxy completeness, as well as the Poisson uncertainty. The detection efficiency and galaxy completeness contribute roughly equally to the total correction to the rate, and the dominant source of uncertainty is the Poisson uncertainty, given the relatively low number of sources in our sample. The corresponding volumetric rate of IR TDEs of Mpc-3 year-1, assuming we probe out to Mpc. We caution that the rate derived for this sample should be interpreted as a lower limit on the total number of IR TDEs, as our sample is not complete and may miss sources with lower covering factors (and therefore lower IR luminosities), shorter IR flares, and the rare, highly luminous flares that require a larger volume to be probed.
In Figure 12, we show the corresponding luminosity function (LF) for the IR TDE sample and compare to the optical and X-ray selected LFs presented in Yao et al. (2023) and Sazonov et al. (2021), respectively. We find that the IR LF show tentative evidence for a decreasing rate with increasing luminosity, similar to what is found in optical and X-ray selected samples. When fit with a single power law model, given by
| (5) |
we find Mpc-3 year-1 and . The power law index is somewhat shallower than the optical LF from ZTF and X-ray LF from eROSITA, likely due to our relatively small sample volume. Our small sample volumes means that we only probe up to a moderate peak W2 luminosity of . Therefore, we do not capture the relatively rare, luminous events that constrain the high end of the TDE LF, and hence, we cannot see the significant rate suppression at high luminosities due to stars being captured before disruption around massive black holes (; e.g. van Velzen, 2018). Both the optical and X-ray samples probe out to significantly higher redshifts (; Sazonov et al., 2021; Yao et al., 2023), hence hampering our ability to directly compare the LFs. Likewise, a direct comparison of the different LFs is affected by the different luminosities probed with different selection methods, especially as the observed IR luminosity is directly related to the covering factor and may underestimate the intrinsic flare luminosity. If the covering factor is anything less than 1, then the intrinsic luminosities are indeed higher than what we observe, shifting the LF to the higher luminosities. However, the lack of a sharp turn over in the observed IR LF implies that the covering factor cannot be too small (), as we do not see a suppression in the high luminosity rate from massive black holes. This is consistent with the findings from the dust modeling presented in Section 5.2.
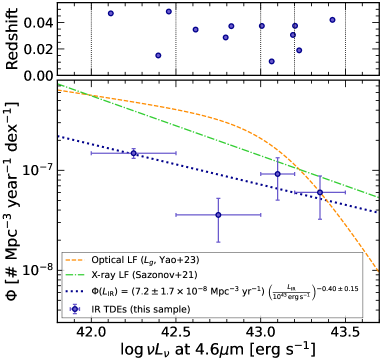
8 Discussion
8.1 Implications for TDE Host Galaxies
One of the main drivers for conducting this survey was to look for TDEs in dusty, star-forming galaxies, which appear to be underrepresented when using optical and X-ray detection methods. Interestingly, the majority of the host galaxies in our sample show spiral morphology in their color cutouts, but have colors which are redder than the typical blue cloud. However, while elliptical galaxies almost exclusively occupy the red cloud in color-mass space, spiral galaxies are known to show a wide range of colors, including both the red cloud and blue sequence in color-mass space (see Figures 8 and 12 of Blanton & Moustakas, 2009). In particular, the more bulge-dominated and earlier type spirals tend to show significantly redder colors and be more massive than their later type counterparts. Hence, the color-mass diagram alone is insufficient for diagnosing the nature of these host galaxies; the red colors and high masses we find do not rule out a star-forming nature of the host galaxies of these IR TDEs. The morphology and the significant H emission seen in the majority of sources actually suggest that the majority of our host galaxies are indeed star-forming systems.
We also do not see a comparable overdensity in the green valley of color-mass space compared to optical and X-ray searches. However, given the complexities of interpreting the color-mass location, especially when dealing with star-forming systems, we also approached the nature of the IR TDE hosts from a spectroscopic standpoint. Namely, the IR-selected TDEs do not appear to be concentrated in post-starburst or quiescent, Balmer-strong galaxies, which was previously found for the host galaxies of optical TDEs (e.g. French et al., 2016; Hammerstein et al., 2021). Instead the IR-selected TDE sample appears to be more representative of the underlying population of SDSS galaxies, suggesting that the overabundance of optical TDEs in post-starburst is at least partially driven by selection effects. This suggests that the use of host galaxy properties to select TDEs requires caution and may miss dusty TDEs in particular.
8.2 Implications for TDE Rates
One of the holy grails in the field of TDEs is to use the observed TDE LF to measure fundamental properties of black holes, like mass and spin (Kesden, 2012). However, there are known caveats and complications to this, including degeneracies in the LF with the age of the stellar populations (Huang & Lu, 2024) and delayed disk formation (Wong et al., 2022). It is thus crucial to probe the entire population of TDEs to understand the underlying LF and TDE properties. Therefore, by finding a new population of TDEs that have different host galaxy properties and also probe the high end of the mass distribution, we become closer to achieving the ultimate goal of using TDE rates and LFs to probe black hole demographics.
In Section 7, we derived a rate of IR TDEs of galaxy-1 year-1, with a corresponding volumetric rate of Mpc-3 year-1. These rates are comparable, but slightly smaller than those from optical and X-ray TDE samples, with the most recent flux-limited sample of ZTF TDEs suggesting rates of galaxy-1 year-1 ( Mpc-3 year-1; Yao et al. 2023) and the eROSITA sample of TDEs given rates of galaxy-1 year-1 ( Mpc-3 year-1; Sazonov et al. 2021). Given that most optical TDEs are X-ray faint, most X-ray TDEs are optically faint, and the majority of our sample shows no transient optical or X-ray flare, the total TDE rate is likely close to the sum of these three rates. This implies a total TDE rate on the order of galaxy-1 year-1, which is much closer to the typical theoretical prediction of galaxy-1 year-1 (Wang & Merritt, 2004; Stone & Metzger, 2016), although there are also sizable uncertainties in the predicted rate (e.g. Pfister et al., 2020).
It is important to note that the IR rates from our sample are likely an underestimate of the true IR TDE rate. In particular, we are sensitive only to relatively bright IR echoes ( erg s-1) and require the TDEs in our sample to be long-lived ( 2.5 years). Both of these points are required given the limited cadence and depth of WISE, in an effort to minimize sample contamination from SNe. Dust echoes around optical and X-ray TDEs are often shorter-lived and dimmer, likely due to a lower dust covering factor than what we see in our sources (for a recent comprehensive analysis of optical TDE dust echoes see Jiang et al., 2021a). It is possible that TDEs with moderate dust covering factors are missed by both surveys, evading our selection by having low luminosity and hence not being detectable for as long. Future time-domain IR surveys with deeper limits and higher cadence are necessary to search for this population.
The rate we derive for IR-selected TDEs is smaller than that of the MIRONG sample by a factor of ( galaxy-1 year-1; Jiang et al., 2021b). We suspect that this discrepancy is due to the different selection criteria of the MIRONG sample, which only required a brightening of 0.5 mag in either W1 or W2. This allowed for a number of sources in their sample that were dimmer than our peak luminosity requirement, which could contribute to the difference in rates. Likewise, as the MIRONG sample was agnostic to underlying AGN activity, their rate may be higher due to contamination from AGN. Interestingly, when we include the silver tier events in our sample, we find a rate of galaxy-1 year-1, which is consistent with the MIRONG rate within uncertainties. Even this silver tier sample has some measure of filtering for AGN activity (WISE colors, no extraneous WISE variability), unlike the MIRONG sample, which could imply that the consistency with the MIRONG rate is due to difference imaging techniques revealing more events than the standard PSF photometry techniques used in the WISE catalogs.
8.3 IR TDEs & The Missing Energy Problem
Another long-standing discrepancy among TDE observations and theory concerns the total energy budget of TDEs. If roughly half of a Sun-like star becomes bound and is accreted onto the black hole when a TDE occurs, then the expected energy released should total around erg. Yet, usually only about 1% ( erg) of this emission is seen in either optical or X-ray TDE searches. There have been a number of proposed solutions to this problem, including photon trapping or significant outflows in super-Eddington accretion flows at early times (Begelman, 1979; Abramowicz et al., 1988; Strubbe & Quataert, 2009; Coughlin & Begelman, 2014; Metzger & Stone, 2016), low radiative efficiency in eccentric accretion flows (e.g. Svirski et al., 2017), and off-axis relativistic jets (although this scenario is disfavored based on radio observations of non-relativistic TDEs; e.g. Lu & Kumar, 2018).
Another suggestion for solving the missing energy problem is to have the majority of the radiation released in the extreme UV (EUV), which is inaccessible to our current suite of telescopes (Lu & Kumar, 2018). This has been supported by recent simulations of super-Eddington accretion flows from TDEs, where when the output spectra were fit with a blackbody in either the X-ray or optical, only 1-10% of the total output energy was captured (Thomsen et al., 2022). Dust, however, is an efficient reprocessor of EUV radiation, and hence, looking at the output energy in the IR can help us probe the underlying bolometric energy output of TDEs to test this theory. Past work on individual IR flares in ultra-luminous IR galaxies (ULIRGs) have found some evidence for this missing energy, with more than erg radiated during these outburst in the IR alone (Dou et al., 2017; Tadhunter et al., 2017; Mattila et al., 2018), although both of these sources show evidence for pre-flare AGN activity.
The integrated energy in the IR for our sources totals between erg, which is shown in Figure 13 versus black hole mass (estimated using the scaling relation with galaxy stellar mass from Reines & Volonteri, 2015). These energies are slightly larger than the output in the optical, UV, and X-ray TDEs, but are not large enough to immediately resolve the missing energy puzzle. However, they should be considered a lower bound on the total radiated energy, as a covering factor less than 1 reduces the observed luminosity. While we cannot accurately estimate the covering factor with the lack of optical flares, we constrain the covering factor to be on the order of , which can allow the integrated IR energy to be somewhere between the observed value and one order of magnitude higher. For the majority of the sources in our sample, this is comparable with the expected 1052-53 erg, although there are a few sources that would still be lower than this theoretical expectation. It is also important to note that our sample only probes an extremely small volume () and therefore misses many of the rare, higher luminosity IR TDEs. This motivates further studies of IR TDEs to larger volumes to probe the missing energy problem in the most luminous IR events. We will be able to probe larger volumes with WISE in future studies, as our current sample is limited by our choice of galaxy survey for cross-matching, rather than the WISE sensitivity. In summary, our nearby sample pushes closer to the expected theoretical values for the total radiated energy in TDEs and allows for a comparison to samples of nearby optical and X-ray selected TDEs.
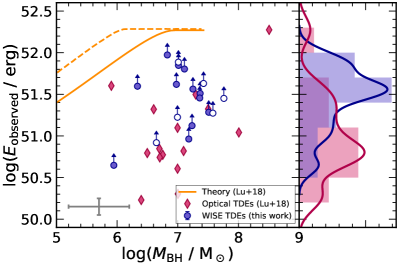
8.4 Comparison to Optical and X-ray Selected TDEs
Numerous optical and X-ray selected TDEs have shown dust echoes detected with the WISE satellite (Dou et al., 2016; Jiang et al., 2016; van Velzen et al., 2016; Jiang et al., 2021a; Sazonov et al., 2021; Hinkle, 2022). A comprehensive analysis of 10 years of optical TDEs by Jiang et al. (2021a) revealed that the TDEs with detected dust echoes had typical covering factors of only and typical peak IR luminosities of only erg s-1. By definition, our sample includes only brighter IR echoes than this, hence why our sample contains no previously-known optical TDEs. Through dust modeling, we found that the covering factor in these sources is , significantly higher than the 1% number derived for optical TDEs. As expected, this implies that the IR TDEs originate in much dustier environments than optical TDEs. Probing the existence of an intermediate sample of TDEs with covering factors on the order of would require different sample selection criteria, namely not requiring such large luminosities and lengthy flares.
Interestingly, the dust echo in the sample of optical TDEs which resembles our sample the most is ASASSN-15lh, which has the longest-lived dust echo of any of the optical TDEs (Jiang et al., 2021a). The nature of this source has been highly debated, with both a SN origin (e.g. Dong et al., 2016; Godoy-Rivera et al., 2017) and a TDE origin (e.g. Leloudas et al., 2016; Krühler et al., 2018; Mummery & Balbus, 2020) being argued. The primary difference between ASASSN-15lh and our sample is the strong optical flare seen in ASASSN-15lh; while our sources show a strong IR flare with either no or very weak optical flares, ASASSN-15lh shows a strong optical flare with , still suggesting a relatively low covering factor like other optical TDEs.
Our findings suggest that the IR TDEs we have found are in dust-rich galactic nuclei. Similarly, transient coronal lines have recently been seen in numerous sources, and have been suggested to be light echoes of TDEs in gas-rich environments (e.g. Komossa et al., 2008; Wang et al., 2012; Clark et al., 2023; Hinkle et al., 2023). Coronal lines are high ionization lines (ionization potentials (IP) 100 eV), which were named such due to their existence in the hot solar corona. Interestingly, Clark et al. (2023) recently studied the long-term evolution of some extreme coronal line emitters (ECLEs) and found that the mid-IR WISE light curves showed long and steady declines, similar to what we see in our WISE TDE sample. Additionally, some optical/UV TDEs (and one ambiguous nuclear transient, AT 2019avd) have shown transient coronal lines, and all of these sources show a strong IR flare (Malyali et al., 2021; Onori et al., 2022; Short et al., 2023). Only one of our sources (WTP 18aampwj) shows the formation of coronal lines nearly 5 years after the initial transient, but only [Fe VII] lines (IP 99 eV) are present in the spectrum. The remaining sources in our sample do not show transient coronal lines, although we do see transient forbidden lines commonly associated with accretion-driven ionization, including narrow [O III] and [O I] in WTP 17aamoxe and WTP 17aamzew (see Figure 6). Potentially the lack of evidence for coronal lines in our sample could be due to the timescales probed with optical spectra; in particular, many of the early disruptions in our sample only have follow-up nearly 8-9 years after the initial disruption. This link between the IR and coronal emission lines suggests a common origin – TDEs in gas- and dust-rich environments.
A rather surprisingly large number of our IR TDEs show evidence for X-ray emission from eROSITA. Of the eight sources in the German half of the sky, three of them show late-time ( 2 yrs), low-luminosity ( erg s-1) X-ray emission, with a variety of spectral shapes. Two sources show a relatively soft X-ray spectrum (WTP 17aamoxe and WTP 17aamzew; or keV), and one source shows a relatively hard X-ray spectrum (WTP 15abymdq; ). While soft X-ray emission associated with the inner accretion disk is often what is dominant in most X-ray-bright TDEs, harder X-ray emission, often associated with the formation of an X-ray corona, is not unheard of, especially at late times (e.g. Saxton et al., 2017; Kara et al., 2018; Chakraborty et al., 2021; Yao et al., 2022). In our sources, the presence of soft X-ray emission is somewhat puzzling, as obscuration by gas along our line of sight should primarily attenuate the soft X-ray band. This could suggest that the nucleus has been unveiled at late times due to a patchy or clumpy obscuring medium. Such a picture is also consistent with the rare occurrence of optical counterparts in a few of our sources. Interestingly, the three sources in our sample with eROSITA detections are X-ray bright for three or more eRASS epochs and all are detected more than five years since the initial disruption, thus motivating further late-time X-ray follow-up of optically-selected TDEs (see e.g. Jonker et al., 2020, for recent work on this topic).
It is important to note that due to the lack of an sensitive, all-sky X-ray survey until eROSITA came online in 2019 and the rarity of optical flares in the WISE TDEs, we lack sufficient X-ray coverage during the peak of most of the WISE flares. Hence, while eROSITA allows us to study the late-time X-ray properties of our sample, we cannot claim an absence of X-ray counterparts in other sources which are undetected in late-time X-ray observations. Future work, either with WISE-detected IR flares from 2019 onward (i.e. after eROSITA came online) or with more rapid detection of IR flares with Roman for example, will be crucial to probing the prompt X-ray emission in IR-selected TDEs.
8.5 No Evidence for Neutrino Counterparts
Recent advances in the detection of high-energy astrophysical neutrinos with the IceCube Observatory have opened a new window into the multi-messenger sky. In recent years, a few TDE candidates have been claimed to have a spatially and temporally coincident high-energy neutrino (e.g. Stein et al., 2021; Jiang et al., 2023), leading to the suggestion that TDEs could contribute a sizeable fraction of the cosmic high-energy neutrino flux (van Velzen et al., 2021c). Interestingly, the detected TDE/neutrino sources all showed strong IR dust echoes, suggesting a potential link between the accretion flare and surrounding medium, although the underlying mechanisms are still poorly understood (e.g. Winter & Lunardini, 2023). Our sample of IR-selected TDEs is thus a natural place to search for coincident neutrinos. We cross-matched between the gold WISE TDEs and the gold candidate neutrinos ( 50% probability of being astrophysical) from the most recent IceCube catalog (IceCat-1; Abbasi et al., 2023). We found no spatially and temporally coincident neutrinos using the 90% uncertainty regions given by IceCube. However, given the low number of TDEs in our gold sample and the relatively low number of gold neutrinos, we cannot statistically rule out that the IR-emitting TDEs are sources of high-energy neutrinos. We plan to explore the statistical significance and theoretical interpretation of these findings further in future work.
9 Summary & Conclusions
We have presented a new sample of IR-selected TDEs, using difference photometry from the WISE satellite to identify transient mid-IR emission in the nuclei of spectroscopically confirmed galaxies within roughly 200 Mpc (). We identified 18 TDE candidates, which showed: (1) peak IR emission above erg s-1, (2) WISE light curves with a fast rise, followed by a slow, monotonic decline, (3) no significant prior IR variability, and (4) no AGN-like WISE colors or previous ROSAT X-ray detection. To further remove potential AGN contaminants, we excluded any source with narrow line ratios in optical spectroscopy indicative of AGN ionization processes. After these cuts to remove sample contaminants, our final gold sample contains 12 high-confidence TDEs.
This work represents the cleanest sample of IR-selected TDEs to date. As such, it presents new insights into TDE demographics in the local universe, and allows us to probe the properties of a previously overlooked class of TDEs. Our main findings with this sample of 12 IR-selected TDEs are summarized below:
-
•
This new sample of IR-selected TDEs shows very few optical counterparts, with only one of our 12 TDEs showing a weak optical flare. The lack of an optical counterpart, coupled with such a strong IR flare, suggests that these sources are a new population of obscured TDEs that were missed by other surveys.
-
•
We modeled the IR flares with a spherical shell model for the dust to derive properties such as the dust radius and disruption time. The average dust radius is pc, with a range from 0.05-0.46 pc among all sources. The small range of dust radii is a natural consequence of the fast rise, slow decline light curve shape required in our selection criteria. Together with blackbody modeling of the WISE data, we constrain the covering factor in these sources to be , which is in stark contrast to the roughly 1% covering factor seen in optical TDEs.
-
•
Four sources showed transient accretion-driven emission lines, including the appearance and disappearance of a broad H line in one source, the appearance of a broad He I time in another, and the appearance of coronal lines in one source and forbidden lines like [O III] and [O I] in others.
-
•
A surprisingly high fraction of sources (3/8) in the German half of the eROSITA sky were detected in the X-ray band in numerous epochs. As with other late-time X-ray constraints of TDEs, these sources showed a variety of X-ray spectral shapes, ranging from rather hard () to rather soft ().
-
•
The TDEs all radiate between - erg in the IR alone, which is pushing the limits on the IR emission from SNe. When combined with evidence for transient line emission and X-ray emission, this suggests that these events are driven by accretion power.
-
•
We derive a lower limit on the rate of these IR TDEs, finding a rate of galaxy-1 year-1 and a corresponding volumetric rate of Mpc-3 year-1. This rate is comparable to both the optical and X-ray TDE rate in the local universe, suggesting that dust obscured TDEs are about as common as optical and X-ray TDEs. Together, these three populations are inching closer to the theoretically predicted rate of galaxy-1 year-1.
-
•
Our host galaxy analysis reveals that the IR TDEs do not show the same green valley or post-starburst overdensity that is often seen in optical and X-ray TDEs. This highlights potential differences in host galaxy selection effects of TDE searches at different wavelengths.
We thank the anonymous referee for their insightful comments. We thank Brad Cenko and the Swift team for approving the numerous ToO requests associated with this sample. We thank Mansi Kasliwal, Josh Bloom, and the SkyPortal team for assistance with using the data platform for this project. We thank Yuhan Yao for discussions about host galaxy SED fitting, Morgan MacLeod for discussions on partial covering of the accretion regions, and Collin Lewin for discussions on transfer function modeling. K. D. was supported by NASA through the NASA Hubble Fellowship grant #HST-HF2-51477.001 awarded by the Space Telescope Science Institute, which is operated by the Association of Universities for Research in Astronomy, Inc., for NASA, under contract NAS5-26555. I. A. acknowledges support from the European Research Council (ERC) under the European Union’s Horizon 2020 research and innovation program (grant agreement number 852097), from the Israel Science Foundation (grant number 2752/19), and from the United States - Israel Binational Science Foundation (BSF). A. M. acknowledges support by DLR under the grant 50 QR 2110 (XMM_NuTra).
This publication makes use of data products from the Wide-field Infrared Survey Explorer and NEOWISE, which are joint projects of the University of California, Los Angeles, and the Jet Propulsion Laboratory/California Institute of Technology, funded by the National Aeronautics and Space Administration. This paper includes data gathered with the 6.5 meter Magellan Telescopes located at Las Campanas Observatory, Chile. This work makes use of observations from the Las Cumbres Observatory global telescope network. This work is based on observations obtained at the Southern Astrophysical Research (SOAR) telescope, which is a joint project of the Ministério da Ciência, Tecnologia e Inovações (MCTI/LNA) do Brasil, the US National Science Foundation’s NOIRLab, the University of North Carolina at Chapel Hill (UNC), and Michigan State University (MSU). Visiting Astronomer at the Infrared Telescope Facility, which is operated by the University of Hawaii under contract 80HQTR19D0030 with the National Aeronautics and Space Administration. This paper employs a list of Chandra datasets, obtained by the Chandra X-ray Observatory, contained in https://doi.org/10.25574/cdc.183 (catalog DOI: 10.25574).
This work is based on data from eROSITA, the soft X-ray instrument aboard SRG, a joint Russian-German science mission supported by the Russian Space Agency (Roskosmos), in the interests of the Russian Academy of Sciences represented by its Space Research Institute (IKI), and the Deutsches Zentrum für Luftund Raumfahrt (DLR). The SRG spacecraft was built by Lavochkin Association (NPOL) and its subcontractors and is operated by NPOL with support from the Max Planck Institute for Extraterrestrial Physics (MPE). The development and construction of the eROSITA X-ray instrument were led by MPE, with contributions from the Dr. Karl Remeis Observatory Bamberg & ECAP (FAU Erlangen-Nuernberg), the University of Hamburg Observatory, the Leibniz Institute for Astrophysics Potsdam (AIP), and the Institute for Astronomy and Astrophysics of the University of Tübingen, with the support of DLR and the Max Planck Society. The Argelander Institute for Astronomy of the University of Bonn and the Ludwig Maximilians Universität Munich also participated in the science preparation for eROSITA.
| ID | WTP Name | Date | Telescope | Instrument | Wavelength Range (Å) | Slit Width (″) | Exp. Time (s) |
|---|---|---|---|---|---|---|---|
| 1 | WTP 14abnpgk | 2023-05-27 | Magellan Clay | LDSS3 | 4250-10000 | 0.75 | 1800 |
| 2023-06-24 | IRTF | SpeX | 8000-25000 | 0.5 | 2160 | ||
| 2 | WTP 14acnjbu | 2023-05-27 | Magellan Clay | LDSS3 | 4250-10000 | 0.75 | 1800 |
| 2023-06-24 | IRTF | SpeX | 8000-25000 | 0.5 | 2880 | ||
| 3 | WTP 14adbjsh | 2022-07-04 | Magellan Baade | FIRE (Echelle) | 8000-25000 | 0.6 | 1800 |
| 2022-11-11 | SOAR | GHTS (red) | 6300-8930 | 1.0 | 1200 | ||
| 2022-11-14 | SOAR | GHTS (blue) | 3500-7000 | 1.0 | 600 | ||
| 4 | WTP 14adbwvs | 2022-05-09 | FTN | FLOYDS | 3500-10000 | 2.0 | 1800 |
| 2023-08-25 | IRTF | SpeX | 8000-25000 | 0.5 | 2880 | ||
| 5 | WTP 14adeqka | 2022-04-06 | FTN | FLOYDS | 3500-10000 | 2.0 | 1800 |
| 2023-06-24 | IRTF | SpeX | 8000-25000 | 0.5 | 2160 | ||
| 6 | WTP 15abymdq | 2023-02-26 | Magellan Clay | LDSS3 | 4250-10000 | 0.75 | 1800 |
| 7 | WTP 15acbgpn | 2023-04-06 | FTN | FLOYDS | 3500-10000 | 2.0 | 1800 |
| 8 | WTP 15acbuuv | 2023-02-26 | Magellan Clay | LDSS3 | 4250-10000 | 0.75 | 1800 |
| 9 | WTP 16aaqrcr | 2023-05-27 | Magellan Clay | LDSS3 | 4250-10000 | 0.75 | 1800 |
| 10 | WTP 16aatsnw | 2023-05-27 | Magellan Clay | LDSS3 | 4250-10000 | 0.75 | 1800 |
| 2023-08-25 | IRTF | SpeX | 8000-25000 | 0.5 | 2880 | ||
| 11 | WTP 17aaldjb | 2023-05-27 | Magellan Clay | LDSS3 | 4250-10000 | 0.75 | 1800 |
| 2023-06-24 | IRTF | SpeX | 8000-25000 | 0.5 | 2880 | ||
| 12 | WTP 17aalzpx | 2023-02-26 | Magellan Clay | LDSS3 | 4250-10000 | 0.75 | 1800 |
| 13 | WTP 17aamoxe | 2023-05-27 | Magellan Clay | LDSS3 | 4250-10000 | 0.75 | 1800 |
| 2023-05-27 | Gemini-S | GMOS | 3600-10300 | 1.0 | 1050 | ||
| 14 | WTP 17aamzew | 2023-02-26 | Magellan Clay | LDSS3 | 4250-10000 | 0.75 | 1800 |
| 2023-03-21 | IRTF | SpeX | 8000-25000 | 0.5 | 1440 | ||
| 15 | WTP 17aanbso | 2023-04-06 | FTN | FLOYDS | 3500-10000 | 2.0 | 1800 |
| 16 | WTP 18aajkmk | 2023-02-26 | Magellan Clay | LDSS3 | 4250-10000 | 0.75 | 1800 |
| 2023-01-17 | Magellan Baade | FIRE | 8000-25000 | 0.6 | 300 | ||
| 18 | WTP 18aampwj | 2023-07-25 | SOAR | GHTS (blue) | 3500-7000 | 1.0 | 600 |
| 2023-08-25 | IRTF | SpeX | 8000-25000 | 0.5 | 2880 |
Appendix A Spectroscopic Follow-Up
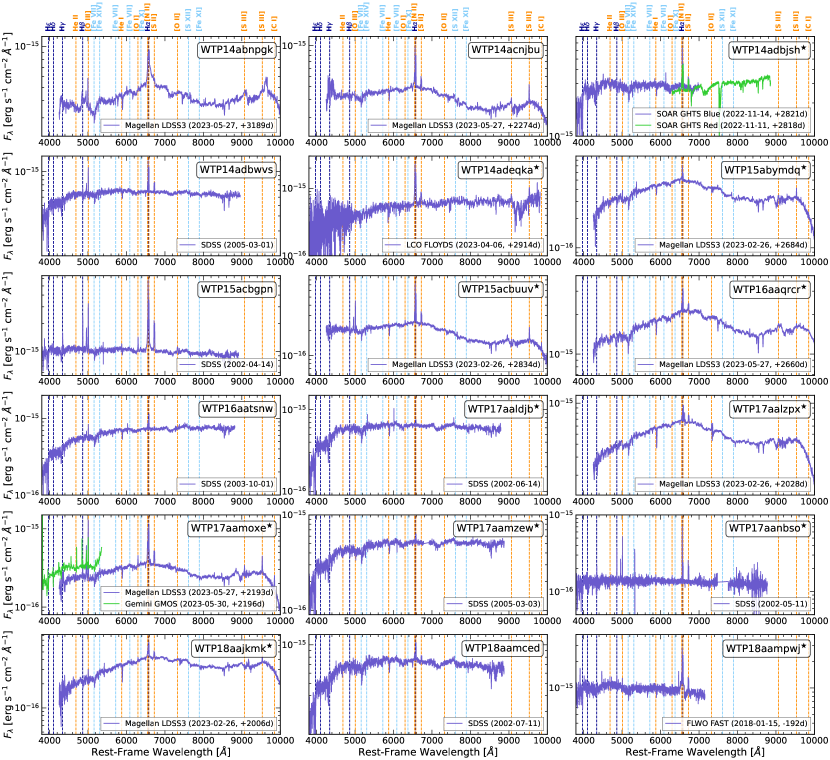
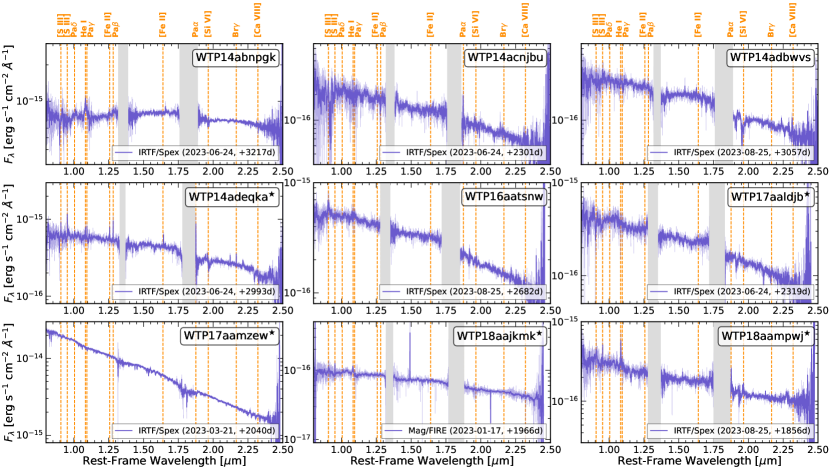
In Table 3, we list the details of the optical and near-IR spectroscopic follow-up observations we performed of the sources in our sample. We also present an optical spectrum for each source in Figure 14. For any source where an archival SDSS spectrum exists, we present this spectrum as it is best for ruling out AGN contamination. Additionally, for the nine sources with near-IR spectroscopic follow-up, we present these spectra in Figure 15.
Appendix B Host Galaxy SED Fits
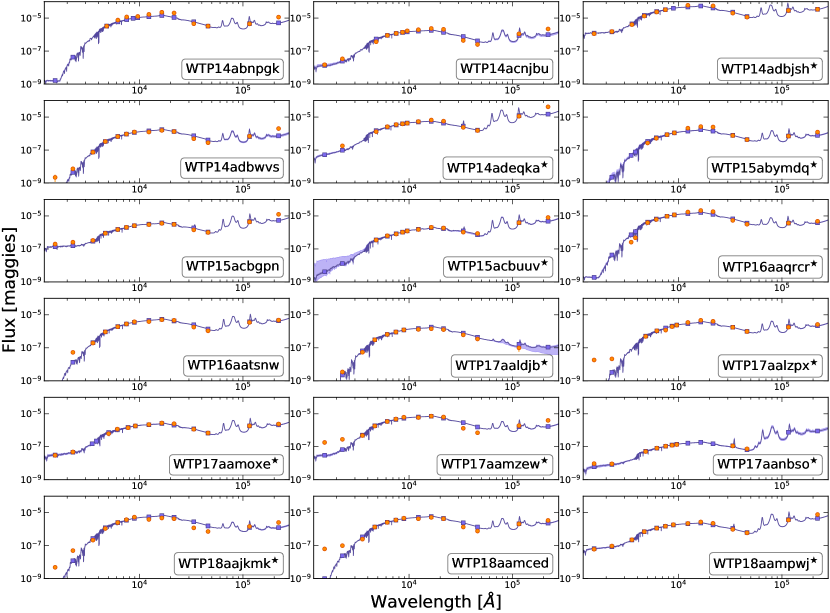
Appendix C Comments on Individual Sources
In this Section, we provide individual details on each source, as well as our reasoning for classifying it in either the gold or silver sample.
C.1 WTP 14abnpgk
WTP 14abnpgk showed a strong and relatively smooth IR flare, but has recently shown a secondary rise in both W1 and W2 in the last three WISE epochs. Interestingly, both ZTF and ATLAS detected an optical transient in this source in 2022, around the same time as the second rise is seen in WISE. The optical transients was reported to TNS as a nuclear transient (AT 2022mim111111https://www.wis-tns.org/object/2022mim). The ATLAS and ZTF light curves, shown in Figure 17, do not look like typical optical TDE light curves and instead resemble the more stochastic variability often seen in AGN. In addition, an optical spectrum taken with the LDSS3 instrument on the Magellan Clay telescope revealed a broad H line with a significant red wing and diminished blue wing, as well as a similar line structure in the H profile. Additional near-IR follow-up showed a broad He I line at 1.083 m, although there is potential blending with the Pa line. These broad lines are also suggestive that the source is an AGN, although it is also possible that this is a partial TDE. A double dust echo has not been reported in repeated TDEs previously, but repeated optical and X-ray flares have been both been used to claim partial TDEs (e.g. Payne et al., 2021; Liu et al., 2023; Wevers et al., 2023). As there are no public archival optical spectra of this source, we cannot probe the evolution of the broad emission lines. Hence, further monitoring is necessary to disentangle the exact nature of this source. To be conservative, we place this source in our silver sample, due to the potential indications of AGN activity.
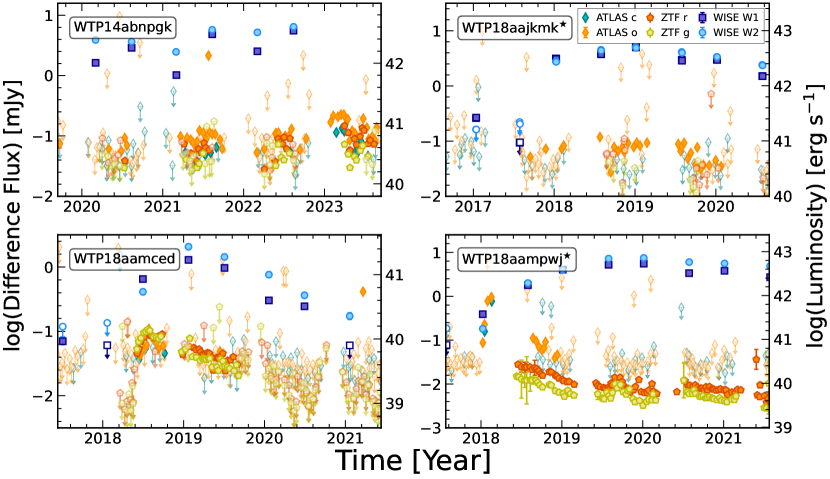
C.2 WTP 14acnjbu
WTP 14acnjbu has the most peculiar WISE light curve of any source in our sample, showing a slight rise before the TDE-like flare. With the LDSS3 spectrum from 2023, we find that the source sits in either the star-forming or composite region of BPT parameter space. However, to be conservative, we place this source in our silver sample, as the double peaked light curve could be indicative of veiled AGN activity.
C.3 WTP 14adbjsh
WTP 14adbjsh, the brightest and closest source in our sample, was already presented in detail in Panagiotou et al. (2023). In short, we find no optical/near-IR spectral lines associated with accretion, which suggests that the IR flare is not driven by an AGN. Late-time X-ray observations with Swift and NuSTAR revealed no significant X-ray emission. We place WTP 14adbjsh in our gold sample. WTP 14adbjsh occurred in a star-forming galaxy and is one of the closest TDEs discovered to date, despite being entirely missed by optical and X-ray searches.
C.4 WTP 14adbwvs
WTP 14adbwvs is classified as an AGN, based on its location in the BPT diagrams from archival SDSS spectroscopy. We obtained a recent spectrum with FLOYDS and found no evidence for any spectral changes. The source does not have strong X-ray emission, nor is its WISE color indicative of AGN activity. However, out of an abundance of caution, we place this source in our silver sample.
C.5 WTP 14adeqka
WTP 14adeqka is one of the strongest and smoothest flares in our sample, reaching a peak luminosity around erg s-1. The host galaxy of WTP 14adeqka shows no evidence for significant AGN-like ionization (e.g. [O III], [O I], [S II]) when we observed the source in 2023 with FLOYDS. The spectral resolution of FLOYDS leaves us unable to resolve the H + [N II] complex, but no broad lines are observed. We also find no evidence for broad lines in a near-IR spectrum taken with IRTF/SpeX, but this spectrum does show evidence for some forbidden narrow lines (e.g. [S III] 9530Å, [Fe II] 1.257m, 1.64m). However, other sources have shown late-time evidence for forbidden narrow lines associated with the TDE (i.e. no such lines existed before the IR flare). Hence, the existence of forbidden lines alone does not suggest AGN-drive behavior. Given that there are no other indicators of an underlying AGN, we place WTP 14adeqka in our gold sample.
C.6 WTP 15abymdq
WTP 15abymdq shows no strong evidence for an AGN in the optical spectrum we obtained with LDSS3 in 2023, sitting in the star-forming or composite region of parameter space for various BPT diagrams. This source was one of the three that we detected with eROSITA, and the spectrum was relatively hard, showing a power-law X-ray spectrum with . There is evidence for neutral absorption with a variable column density on the order of cm-2 (see Section 3.4 for more details). Although this is a relatively standard AGN-like X-ray spectrum, the X-ray spectra of TDEs are not uniform enough for us to use this to rule out this source as a TDE. Hence, we place WTP 15abymdq in our gold sample, given that there are no other indications of underlying AGN activity in this source.
C.7 WTP 15acbgpn
WTP 15acbgpn is a clear AGN with a broad H line apparent in the SDSS spectrum from 2002. It was also detected with Chandra in 2010, with an X-ray flux of erg cm-2 s-1. Thus, given the clear AGN nature, we place this source in our silver sample. We note that we did observe this source with FLOYDS in 2023 and found that the spectrum was consistent with the SDSS spectrum, albeit with lower spectral resolution.
C.8 WTP 15acbuuv
WTP 15acbuuv sits in the star-forming or composite region of BPT parameter space, although there is significant [O III] emission in this spectrum. A past spectrum from 6dF (Jones et al., 2004, 2009) shows little evolution from the LDSS3 spectrum we took in 2023. This source was also one of the eROSITA sources, and showed no evidence for any X-ray emission during any of the eRASS epochs. Given the lack of significant evidence for AGN behavior, we place this source in our gold sample.
C.9 WTP 16aaqrcr
WTP 16aaqrcr shows no clear indications of any previous AGN activity. An optical spectrum from LDSS3 in 2023 shows no evidence of [O III] emission, consistent with star-forming ionization. The source was also never detected in the eROSITA survey. Hence, we place WTP 16aaqrcr in our gold sample.
C.10 WTP 16aatsnw
WTP 16aatsnw is another potential AGN/LINER interloper in our sample, based on its location in the BPT diagrams from archival SDSS spectroscopy. We obtained a spectrum with LDSS3 in 2023 and found no evidence for significant spectral changes. The source does not have strong X-ray emission, nor is its WISE color indicative of AGN activity. However, out of an abundance of caution, we place this source in our silver sample, given the pre-flare AGN-like ionization levels.
C.11 WTP 17aaldjb
WTP 17aaldjb has an archival SDSS spectrum which shows no evidence of AGN activity, with only very weak emission lines visible in the spectrum. Likewise, our LDSS3 spectrum from 2023 was very similar, showing little evolution. We also obtained a near-IR spectrum of this source with IRTF/SpeX in 2023 and found similarly negligible emission features, strengthening our confidence that this is not an veiled AGN. The source was also not detected with eROSITA. Hence, we place this source in our gold sample.
C.12 WTP 17aalzpx
WTP 17aalzpx showed no strong [O III] emission in the LDSS3 spectrum from 2023, indicating likely star-forming ionization. The source was also not detected with eROSITA. Hence, this source does not show any strong evidence for AGN activity, and thus we place it in our gold sample.
C.13 WTP 17aamoxe
WTP 17aamoxe showed very strong, AGN-like narrow emission lines in the optical spectrum with obtained with LDSS3 in 2023. However, the archival spectrum from 2004 with the 6dF survery (Jones et al., 2004, 2009) shows no significant [O III], [O I], or [S II] emission, indicating that there has likely been a significant change to the spectral lines in this source (see Section 5.3). WTP 17aamoxe is also one of the three sources that we detected with eROSITA, showing a relatively soft X-ray spectrum () in the three eRASS epochs in which it was detected (see Section 3.4). Such a soft X-ray spectrum is highly unusual for AGN, but is often seen in TDEs. Hence, we place this source in our gold sample, but note that further follow-up to monitor the X-ray and optical spectral changes is necessary to rule out a turn-on AGN.
C.14 WTP 17aamzew
WTP 17aamzew is another one of our three detected eROSITA sources, again showing a soft X-ray spectrum (). This source has an archival SDSS spectrum from 2005, which shows no evidence for AGN-driven line emission. However, our LDSS3 spectrum from 2023 shows significant spectral changes, including the formation of both [O III] and [O I], which are often associated with accretion. We suspect that these narrow lines were induced by the TDE. Hence, we place WTP 17aamzew in our gold sample.
C.15 WTP 17aanbso
WTP 17aanbso shows strong emission lines in its archival SDSS spectrum, but the line ratios suggest a purely star-forming nature. We obtained an FLOYDS spectrum in 2023, but found no significant evidence for spectral changes. Hence, as there is no evidence for underlying AGN activity, we place WTP 17aanbso in our gold sample.
C.16 WTP 18aajkmk
WTP 18aajkmk shows no clear evidence for ongoing AGN activity, falling primarily in the star-forming or composite region of BPT parameter space. The [O I] line from our 2023 LDSS3 spectrum does show LINER ionization levels, but there are other sources with significant narrow line changes and we have no pre-outburst optical spectrum. Hence, we cannot rule out that this line is driven by the TDE. Additionally, we do see broad He I line at 1.083 m in a FIRE near-IR spectrum taken in 2023, which we believe is likely associated with the TDE. Interestingly, this source is clearly an extremely disturbed system (see Figure 9), thereby potentially suggesting a merger-driven accretion episode. WTP 18aajkmk also shows potential evidence for an optical transient in the ATLAS -band data (see top left of Figure 17). No transient is detected in the -band data, which could be due to the reddening from a dusty environment. ZTF does not detect a significant optical transient in this system, although this could be a result of a transient occurring around the time of reference images being taken. Given the lack of any evidence for AGN activity, we classify this source as a likely TDE, and place it in our gold sample.
C.17 WTP 18aamced
WTP 18aamced is one of the few sources in our sample with a clear optical counterpart, first detected by the the ZTF team121212https://www.wis-tns.org/object/2018dyk. We show the ZTF and ATLAS light curves for this source with its WISE light curve in the bottom left panel of Figure 17. The ZTF source was relatively faint compared to other TDEs, and extensively optical and UV spectroscopic follow-up showed that this source transitioned from a LINER (based on the archival SDSS spectrum) to a narrow-line Seyfert 1 with broad Balmer lines and strong Fe and He coronal lines (Frederick et al., 2019). Like many narrow-line Seyfert 1s, the source shows a relatively soft X-ray spectrum (), but is still harder than the two other soft sources in our sample (Frederick et al., 2019). It has recently been argued, however, that this source is a TDE in a LINER galaxy with a dusty nuclear environment (Huang et al., 2023). For detailed studies of this source, we refer the reader to Frederick et al. (2019) and Huang et al. (2023). As the source shows clear LINER ionization levels before the flare, we place it in our silver sample.
C.18 WTP 18aampwj
WTP 18aampwj was first discovered by the ASAS-SN team131313https://www.wis-tns.org/object/2018gn as a candidate Type II SN (Falco et al., 2018), after an optical spectrum revealed a broad H line (see Figure 7). The optical transient was also clearly detected in the deeper ATLAS and ZTF surveys, although the optical flare occurred when the ZTF reference images were being taken complicating a direct measurement of the transient flux. We show the ATLAS and ZTF data together with the WISE flare for this source in the bottom right panel of Figure 17, which resemble those of typical optically-selected TDEs. Spectroscopically, the broad H line in the classification spectrum did not show a strong blue absorption wing and P-Cygni profile that is commonly seen in spectra of Type II SNe (Gutiérrez et al., 2017). Our 2023 spectrum also showed the formation of [Fe VII] coronal lines five years after the transient discovery, which has been seen in some TDEs in gas-rich environments (e.g. Onori et al., 2022; Short et al., 2023), but is rare in Type II SNe (e.g. SN2005ip; Smith et al., 2009). Another argument for the TDE nature of WTP18aampwj is that the total radiated energy in the IR alone exceeds erg already and is still ongoing. Likewise, the peak W1 luminosity exceeds what is seen in typical SNe (Thévenot, 2020). Thus, we suggest that this source is indeed a TDE rather than a supernova, as was also suggested in recent works based on the integrated IR luminosity (Thévenot, 2020; Thévenot et al., 2021). As the optical spectrum shows no evidence for AGN-like ionization levels, we place this source in our gold sample.
References
- Abbasi et al. (2023) Abbasi, R., Ackermann, M., Adams, J., et al. 2023, ApJS, 269, 25, doi: 10.3847/1538-4365/acfa95
- Abbott et al. (2018) Abbott, T. M. C., Abdalla, F. B., Allam, S., et al. 2018, ApJS, 239, 18, doi: 10.3847/1538-4365/aae9f0
- Abramowicz et al. (1988) Abramowicz, M. A., Czerny, B., Lasota, J. P., & Szuszkiewicz, E. 1988, ApJ, 332, 646, doi: 10.1086/166683
- Alexander et al. (2020) Alexander, K. D., van Velzen, S., Horesh, A., & Zauderer, B. A. 2020, Space Sci. Rev., 216, 81, doi: 10.1007/s11214-020-00702-w
- Arcavi et al. (2014) Arcavi, I., Gal-Yam, A., Sullivan, M., et al. 2014, ApJ, 793, 38, doi: 10.1088/0004-637X/793/1/38
- Arcavi et al. (2018) Arcavi, I., Burke, J., French, K. D., et al. 2018, The Astronomer’s Telegram, 11953, 1
- Arnaud (1996) Arnaud, K. A. 1996, in Astronomical Society of the Pacific Conference Series, Vol. 101, Astronomical Data Analysis Software and Systems V, ed. G. H. Jacoby & J. Barnes, 17
- Astropy Collaboration et al. (2022) Astropy Collaboration, Price-Whelan, A. M., Lim, P. L., et al. 2022, ApJ, 935, 167, doi: 10.3847/1538-4357/ac7c74
- Bade et al. (1996) Bade, N., Komossa, S., & Dahlem, M. 1996, A&A, 309, L35
- Baldwin et al. (1981) Baldwin, J. A., Phillips, M. M., & Terlevich, R. 1981, PASP, 93, 5, doi: 10.1086/130766
- Begelman (1979) Begelman, M. C. 1979, MNRAS, 187, 237, doi: 10.1093/mnras/187.2.237
- Bellm et al. (2019) Bellm, E. C., Kulkarni, S. R., Graham, M. J., et al. 2019, PASP, 131, 018002, doi: 10.1088/1538-3873/aaecbe
- Blanchard et al. (2017) Blanchard, P. K., Nicholl, M., Berger, E., et al. 2017, ApJ, 843, 106, doi: 10.3847/1538-4357/aa77f7
- Blanton & Moustakas (2009) Blanton, M. R., & Moustakas, J. 2009, ARA&A, 47, 159, doi: 10.1146/annurev-astro-082708-101734
- Bricman & Gomboc (2020) Bricman, K., & Gomboc, A. 2020, ApJ, 890, 73, doi: 10.3847/1538-4357/ab6989
- Brinchmann et al. (2004) Brinchmann, J., Charlot, S., White, S. D. M., et al. 2004, MNRAS, 351, 1151, doi: 10.1111/j.1365-2966.2004.07881.x
- Brown et al. (2013) Brown, T. M., Baliber, N., Bianco, F. B., et al. 2013, PASP, 125, 1031, doi: 10.1086/673168
- Brunner et al. (2022) Brunner, H., Liu, T., Lamer, G., et al. 2022, A&A, 661, A1, doi: 10.1051/0004-6361/202141266
- Calzetti et al. (2000) Calzetti, D., Armus, L., Bohlin, R. C., et al. 2000, ApJ, 533, 682, doi: 10.1086/308692
- Cannizzaro et al. (2022) Cannizzaro, G., Levan, A. J., van Velzen, S., & Brown, G. 2022, MNRAS, 516, 529, doi: 10.1093/mnras/stac2014
- Cappellari (2017) Cappellari, M. 2017, MNRAS, 466, 798, doi: 10.1093/mnras/stw3020
- Cappellari (2023) —. 2023, MNRAS, 526, 3273, doi: 10.1093/mnras/stad2597
- Cappellari & Emsellem (2004) Cappellari, M., & Emsellem, E. 2004, PASP, 116, 138, doi: 10.1086/381875
- Cardelli et al. (1989) Cardelli, J. A., Clayton, G. C., & Mathis, J. S. 1989, ApJ, 345, 245, doi: 10.1086/167900
- Cash (1979) Cash, W. 1979, ApJ, 228, 939, doi: 10.1086/156922
- Chabrier (2003) Chabrier, G. 2003, PASP, 115, 763, doi: 10.1086/376392
- Chakraborty et al. (2021) Chakraborty, J., Kara, E., Masterson, M., et al. 2021, ApJ, 921, L40, doi: 10.3847/2041-8213/ac313b
- Chambers et al. (2016) Chambers, K. C., Magnier, E. A., Metcalfe, N., et al. 2016, arXiv e-prints, arXiv:1612.05560, doi: 10.48550/arXiv.1612.05560
- Chornock et al. (2014) Chornock, R., Berger, E., Gezari, S., et al. 2014, ApJ, 780, 44, doi: 10.1088/0004-637X/780/1/44
- Clark et al. (2023) Clark, P., Graur, O., Callow, J., et al. 2023, arXiv e-prints, arXiv:2307.03182, doi: 10.48550/arXiv.2307.03182
- Clemens et al. (2004) Clemens, J. C., Crain, J. A., & Anderson, R. 2004, in Society of Photo-Optical Instrumentation Engineers (SPIE) Conference Series, Vol. 5492, Ground-based Instrumentation for Astronomy, ed. A. F. M. Moorwood & M. Iye, 331–340, doi: 10.1117/12.550069
- Conroy & Gunn (2010) Conroy, C., & Gunn, J. E. 2010, ApJ, 712, 833, doi: 10.1088/0004-637X/712/2/833
- Conroy et al. (2009) Conroy, C., Gunn, J. E., & White, M. 2009, ApJ, 699, 486, doi: 10.1088/0004-637X/699/1/486
- Cook et al. (2019) Cook, D. O., Kasliwal, M. M., Van Sistine, A., et al. 2019, ApJ, 880, 7, doi: 10.3847/1538-4357/ab2131
- Coughlin & Begelman (2014) Coughlin, E. R., & Begelman, M. C. 2014, ApJ, 781, 82, doi: 10.1088/0004-637X/781/2/82
- Cushing et al. (2004) Cushing, M. C., Vacca, W. D., & Rayner, J. T. 2004, PASP, 116, 362, doi: 10.1086/382907
- Dai et al. (2020) Dai, B. B., Shu, X. W., Jiang, N., et al. 2020, ApJ, 896, L27, doi: 10.3847/2041-8213/ab97ac
- Dai et al. (2018) Dai, L., McKinney, J. C., Roth, N., Ramirez-Ruiz, E., & Miller, M. C. 2018, ApJ, 859, L20, doi: 10.3847/2041-8213/aab429
- De et al. (2020) De, K., Hankins, M. J., Kasliwal, M. M., et al. 2020, PASP, 132, 025001, doi: 10.1088/1538-3873/ab6069
- Dodd et al. (2023) Dodd, S. A., Nukala, A., Connor, I., et al. 2023, arXiv e-prints, arXiv:2307.05670, doi: 10.48550/arXiv.2307.05670
- Dong et al. (2016) Dong, S., Shappee, B. J., Prieto, J. L., et al. 2016, Science, 351, 257, doi: 10.1126/science.aac9613
- Donley et al. (2002) Donley, J. L., Brandt, W. N., Eracleous, M., & Boller, T. 2002, AJ, 124, 1308, doi: 10.1086/342280
- Dou et al. (2017) Dou, L., Wang, T., Yan, L., et al. 2017, ApJ, 841, L8, doi: 10.3847/2041-8213/aa7130
- Dou et al. (2016) Dou, L., Wang, T.-g., Jiang, N., et al. 2016, ApJ, 832, 188, doi: 10.3847/0004-637X/832/2/188
- Draine & Lee (1984) Draine, B. T., & Lee, H. M. 1984, ApJ, 285, 89, doi: 10.1086/162480
- Drlica-Wagner et al. (2016) Drlica-Wagner, A., Bechtol, K., Allam, S., et al. 2016, ApJ, 833, L5, doi: 10.3847/2041-8205/833/1/L5
- Ergon et al. (2015) Ergon, M., Jerkstrand, A., Sollerman, J., et al. 2015, A&A, 580, A142, doi: 10.1051/0004-6361/201424592
- Evans et al. (2007) Evans, P. A., Beardmore, A. P., Page, K. L., et al. 2007, A&A, 469, 379, doi: 10.1051/0004-6361:20077530
- Evans et al. (2009) —. 2009, MNRAS, 397, 1177, doi: 10.1111/j.1365-2966.2009.14913.x
- Falco et al. (2018) Falco, E., Calkins, M., Prieto, J. L., & Stanek, K. Z. 2018, Transient Name Server Classification Report, 2018-81, 1
- Falcón-Barroso et al. (2011) Falcón-Barroso, J., Sánchez-Blázquez, P., Vazdekis, A., et al. 2011, A&A, 532, A95, doi: 10.1051/0004-6361/201116842
- Foreman-Mackey et al. (2013) Foreman-Mackey, D., Hogg, D. W., Lang, D., & Goodman, J. 2013, PASP, 125, 306, doi: 10.1086/670067
- Fox et al. (2010) Fox, O. D., Chevalier, R. A., Dwek, E., et al. 2010, ApJ, 725, 1768, doi: 10.1088/0004-637X/725/2/1768
- Fox et al. (2011) Fox, O. D., Chevalier, R. A., Skrutskie, M. F., et al. 2011, ApJ, 741, 7, doi: 10.1088/0004-637X/741/1/7
- Frederick et al. (2019) Frederick, S., Gezari, S., Graham, M. J., et al. 2019, ApJ, 883, 31, doi: 10.3847/1538-4357/ab3a38
- Fremling et al. (2020) Fremling, C., Miller, A. A., Sharma, Y., et al. 2020, ApJ, 895, 32, doi: 10.3847/1538-4357/ab8943
- French et al. (2016) French, K. D., Arcavi, I., & Zabludoff, A. 2016, ApJ, 818, L21, doi: 10.3847/2041-8205/818/1/L21
- French et al. (2020) French, K. D., Arcavi, I., Zabludoff, A. I., et al. 2020, ApJ, 891, 93, doi: 10.3847/1538-4357/ab7450
- Frohmaier et al. (2021) Frohmaier, C., Angus, C. R., Vincenzi, M., et al. 2021, MNRAS, 500, 5142, doi: 10.1093/mnras/staa3607
- Fruscione et al. (2006) Fruscione, A., McDowell, J. C., Allen, G. E., et al. 2006, in Society of Photo-Optical Instrumentation Engineers (SPIE) Conference Series, Vol. 6270, Society of Photo-Optical Instrumentation Engineers (SPIE) Conference Series, ed. D. R. Silva & R. E. Doxsey, 62701V, doi: 10.1117/12.671760
- Gal-Yam (2019) Gal-Yam, A. 2019, ARA&A, 57, 305, doi: 10.1146/annurev-astro-081817-051819
- Gehrels et al. (2004) Gehrels, N., Chincarini, G., Giommi, P., et al. 2004, ApJ, 611, 1005, doi: 10.1086/422091
- Gezari (2021) Gezari, S. 2021, ARA&A, 59, 21, doi: 10.1146/annurev-astro-111720-030029
- Gezari et al. (2006) Gezari, S., Martin, D. C., Milliard, B., et al. 2006, ApJ, 653, L25, doi: 10.1086/509918
- Gezari et al. (2008) Gezari, S., Basa, S., Martin, D. C., et al. 2008, ApJ, 676, 944, doi: 10.1086/529008
- Gezari et al. (2009) Gezari, S., Heckman, T., Cenko, S. B., et al. 2009, ApJ, 698, 1367, doi: 10.1088/0004-637X/698/2/1367
- Gezari et al. (2012) Gezari, S., Chornock, R., Rest, A., et al. 2012, Nature, 485, 217, doi: 10.1038/nature10990
- Godoy-Rivera et al. (2017) Godoy-Rivera, D., Stanek, K. Z., Kochanek, C. S., et al. 2017, MNRAS, 466, 1428, doi: 10.1093/mnras/stw3237
- Graur et al. (2018) Graur, O., French, K. D., Zahid, H. J., et al. 2018, ApJ, 853, 39, doi: 10.3847/1538-4357/aaa3fd
- Greenwell et al. (2021) Greenwell, C., Gandhi, P., Stern, D., et al. 2021, MNRAS, 503, L80, doi: 10.1093/mnrasl/slab019
- Guillochon & Ramirez-Ruiz (2013) Guillochon, J., & Ramirez-Ruiz, E. 2013, ApJ, 767, 25, doi: 10.1088/0004-637X/767/1/25
- Guolo et al. (2023) Guolo, M., Gezari, S., Yao, Y., et al. 2023, arXiv e-prints, arXiv:2308.13019, doi: 10.48550/arXiv.2308.13019
- Gutiérrez et al. (2017) Gutiérrez, C. P., Anderson, J. P., Hamuy, M., et al. 2017, ApJ, 850, 89, doi: 10.3847/1538-4357/aa8f52
- Hammerstein et al. (2021) Hammerstein, E., Gezari, S., van Velzen, S., et al. 2021, ApJ, 908, L20, doi: 10.3847/2041-8213/abdcb4
- Hammerstein et al. (2023) Hammerstein, E., van Velzen, S., Gezari, S., et al. 2023, ApJ, 942, 9, doi: 10.3847/1538-4357/aca283
- Helou et al. (2013) Helou, G., Kasliwal, M. M., Ofek, E. O., et al. 2013, ApJ, 778, L19, doi: 10.1088/2041-8205/778/1/L19
- Hinkle (2022) Hinkle, J. T. 2022, arXiv e-prints, arXiv:2210.15681, doi: 10.48550/arXiv.2210.15681
- Hinkle et al. (2023) Hinkle, J. T., Shappee, B. J., & Holoien, T. W. S. 2023, arXiv e-prints, arXiv:2303.05525, doi: 10.48550/arXiv.2303.05525
- Holoien et al. (2014) Holoien, T. W. S., Prieto, J. L., Bersier, D., et al. 2014, MNRAS, 445, 3263, doi: 10.1093/mnras/stu1922
- Huang & Lu (2024) Huang, H.-T., & Lu, W. 2024, MNRAS, 527, 1865, doi: 10.1093/mnras/stad3269
- Huang et al. (2023) Huang, S., Jiang, N., Lin, Z., Zhu, J., & Wang, T. 2023, MNRAS, 525, 4057, doi: 10.1093/mnras/stad2541
- Ivezić et al. (2019) Ivezić, Ž., Kahn, S. M., Tyson, J. A., et al. 2019, ApJ, 873, 111, doi: 10.3847/1538-4357/ab042c
- Jiang et al. (2016) Jiang, N., Dou, L., Wang, T., et al. 2016, ApJ, 828, L14, doi: 10.3847/2041-8205/828/1/L14
- Jiang et al. (2021a) Jiang, N., Wang, T., Hu, X., et al. 2021a, ApJ, 911, 31, doi: 10.3847/1538-4357/abe772
- Jiang et al. (2023) Jiang, N., Zhou, Z., Zhu, J., Wang, Y., & Wang, T. 2023, ApJ, 953, L12, doi: 10.3847/2041-8213/acebe3
- Jiang et al. (2021b) Jiang, N., Wang, T., Dou, L., et al. 2021b, ApJS, 252, 32, doi: 10.3847/1538-4365/abd1dc
- Johnson et al. (2021) Johnson, B. D., Leja, J., Conroy, C., & Speagle, J. S. 2021, ApJS, 254, 22, doi: 10.3847/1538-4365/abef67
- Jones et al. (2004) Jones, D. H., Saunders, W., Colless, M., et al. 2004, MNRAS, 355, 747, doi: 10.1111/j.1365-2966.2004.08353.x
- Jones et al. (2009) Jones, D. H., Read, M. A., Saunders, W., et al. 2009, MNRAS, 399, 683, doi: 10.1111/j.1365-2966.2009.15338.x
- Jonker et al. (2020) Jonker, P. G., Stone, N. C., Generozov, A., van Velzen, S., & Metzger, B. 2020, ApJ, 889, 166, doi: 10.3847/1538-4357/ab659c
- Kaastra & Bleeker (2016) Kaastra, J. S., & Bleeker, J. A. M. 2016, A&A, 587, A151, doi: 10.1051/0004-6361/201527395
- Kara et al. (2018) Kara, E., Dai, L., Reynolds, C. S., & Kallman, T. 2018, MNRAS, 474, 3593, doi: 10.1093/mnras/stx3004
- Kauffmann et al. (2003) Kauffmann, G., Heckman, T. M., Tremonti, C., et al. 2003, MNRAS, 346, 1055, doi: 10.1111/j.1365-2966.2003.07154.x
- Kesden (2012) Kesden, M. 2012, Phys. Rev. D, 85, 024037, doi: 10.1103/PhysRevD.85.024037
- Kewley et al. (2001) Kewley, L. J., Dopita, M. A., Sutherland, R. S., Heisler, C. A., & Trevena, J. 2001, ApJ, 556, 121, doi: 10.1086/321545
- Kewley et al. (2006) Kewley, L. J., Groves, B., Kauffmann, G., & Heckman, T. 2006, MNRAS, 372, 961, doi: 10.1111/j.1365-2966.2006.10859.x
- Kochanek et al. (2017) Kochanek, C. S., Shappee, B. J., Stanek, K. Z., et al. 2017, PASP, 129, 104502, doi: 10.1088/1538-3873/aa80d9
- Komossa & Bade (1999) Komossa, S., & Bade, N. 1999, A&A, 343, 775, doi: 10.48550/arXiv.astro-ph/9901141
- Komossa & Greiner (1999) Komossa, S., & Greiner, J. 1999, A&A, 349, L45, doi: 10.48550/arXiv.astro-ph/9908216
- Komossa et al. (2008) Komossa, S., Zhou, H., Wang, T., et al. 2008, ApJ, 678, L13, doi: 10.1086/588281
- König et al. (2022) König, O., Saxton, R. D., Kretschmar, P., et al. 2022, Astronomy and Computing, 38, 100529, doi: 10.1016/j.ascom.2021.100529
- Kool et al. (2020) Kool, E. C., Reynolds, T. M., Mattila, S., et al. 2020, MNRAS, 498, 2167, doi: 10.1093/mnras/staa2351
- Krühler et al. (2018) Krühler, T., Fraser, M., Leloudas, G., et al. 2018, A&A, 610, A14, doi: 10.1051/0004-6361/201731773
- Landt et al. (2008) Landt, H., Bentz, M. C., Ward, M. J., et al. 2008, ApJS, 174, 282, doi: 10.1086/522373
- Lang (2014) Lang, D. 2014, AJ, 147, 108, doi: 10.1088/0004-6256/147/5/108
- Law-Smith et al. (2017) Law-Smith, J., Ramirez-Ruiz, E., Ellison, S. L., & Foley, R. J. 2017, ApJ, 850, 22, doi: 10.3847/1538-4357/aa94c7
- Leloudas et al. (2015) Leloudas, G., Schulze, S., Krühler, T., et al. 2015, MNRAS, 449, 917, doi: 10.1093/mnras/stv320
- Leloudas et al. (2016) Leloudas, G., Fraser, M., Stone, N. C., et al. 2016, Nature Astronomy, 1, 0002, doi: 10.1038/s41550-016-0002
- Liu et al. (2023) Liu, Z., Malyali, A., Krumpe, M., et al. 2023, A&A, 669, A75, doi: 10.1051/0004-6361/202244805
- Lu & Kumar (2018) Lu, W., & Kumar, P. 2018, ApJ, 865, 128, doi: 10.3847/1538-4357/aad54a
- Lu et al. (2016) Lu, W., Kumar, P., & Evans, N. J. 2016, MNRAS, 458, 575, doi: 10.1093/mnras/stw307
- Mainzer et al. (2014) Mainzer, A., Bauer, J., Cutri, R. M., et al. 2014, ApJ, 792, 30, doi: 10.1088/0004-637X/792/1/30
- Malyali et al. (2021) Malyali, A., Rau, A., Merloni, A., et al. 2021, A&A, 647, A9, doi: 10.1051/0004-6361/202039681
- Malyali et al. (2023a) Malyali, A., Liu, Z., Merloni, A., et al. 2023a, MNRAS, 520, 4209, doi: 10.1093/mnras/stad046
- Malyali et al. (2023b) Malyali, A., Liu, Z., Rau, A., et al. 2023b, MNRAS, 520, 3549, doi: 10.1093/mnras/stad022
- Martin et al. (2005) Martin, D. C., Fanson, J., Schiminovich, D., et al. 2005, ApJ, 619, L1, doi: 10.1086/426387
- Martin et al. (2007) Martin, D. C., Wyder, T. K., Schiminovich, D., et al. 2007, ApJS, 173, 342, doi: 10.1086/516639
- Masci et al. (2019) Masci, F. J., Laher, R. R., Rusholme, B., et al. 2019, PASP, 131, 018003, doi: 10.1088/1538-3873/aae8ac
- Masci et al. (2023) —. 2023, arXiv e-prints, arXiv:2305.16279, doi: 10.48550/arXiv.2305.16279
- Masterson et al. (2022) Masterson, M., Kara, E., Ricci, C., et al. 2022, ApJ, 934, 35, doi: 10.3847/1538-4357/ac76c0
- Mateos et al. (2012) Mateos, S., Alonso-Herrero, A., Carrera, F. J., et al. 2012, MNRAS, 426, 3271, doi: 10.1111/j.1365-2966.2012.21843.x
- Mattila et al. (2018) Mattila, S., Pérez-Torres, M., Efstathiou, A., et al. 2018, Science, 361, 482, doi: 10.1126/science.aao4669
- Meikle et al. (2011) Meikle, W. P. S., Kotak, R., Farrah, D., et al. 2011, ApJ, 732, 109, doi: 10.1088/0004-637X/732/2/109
- Meisner et al. (2018) Meisner, A. M., Lang, D., & Schlegel, D. J. 2018, AJ, 156, 69, doi: 10.3847/1538-3881/aacbcd
- Mendel et al. (2014) Mendel, J. T., Simard, L., Palmer, M., Ellison, S. L., & Patton, D. R. 2014, ApJS, 210, 3, doi: 10.1088/0067-0049/210/1/3
- Merloni et al. (2015) Merloni, A., Dwelly, T., Salvato, M., et al. 2015, MNRAS, 452, 69, doi: 10.1093/mnras/stv1095
- Metzger & Stone (2016) Metzger, B. D., & Stone, N. C. 2016, MNRAS, 461, 948, doi: 10.1093/mnras/stw1394
- Mockler et al. (2019) Mockler, B., Guillochon, J., & Ramirez-Ruiz, E. 2019, ApJ, 872, 151, doi: 10.3847/1538-4357/ab010f
- Mummery & Balbus (2020) Mummery, A., & Balbus, S. A. 2020, MNRAS, 497, L13, doi: 10.1093/mnrasl/slaa105
- Newsome et al. (2023) Newsome, M., Arcavi, I., Howell, D. A., et al. 2023, arXiv e-prints, arXiv:2305.03767, doi: 10.48550/arXiv.2305.03767
- Onori et al. (2022) Onori, F., Cannizzaro, G., Jonker, P. G., et al. 2022, MNRAS, 517, 76, doi: 10.1093/mnras/stac2673
- Panagiotou et al. (2023) Panagiotou, C., De, K., Masterson, M., et al. 2023, ApJ, 948, L5, doi: 10.3847/2041-8213/acc02f
- Pasham et al. (2019) Pasham, D. R., Remillard, R. A., Fragile, P. C., et al. 2019, Science, 363, 531, doi: 10.1126/science.aar7480
- Payne et al. (2021) Payne, A. V., Shappee, B. J., Hinkle, J. T., et al. 2021, ApJ, 910, 125, doi: 10.3847/1538-4357/abe38d
- Perley et al. (2016) Perley, D. A., Quimby, R. M., Yan, L., et al. 2016, ApJ, 830, 13, doi: 10.3847/0004-637X/830/1/13
- Peterson et al. (2013) Peterson, B. M., Denney, K. D., De Rosa, G., et al. 2013, ApJ, 779, 109, doi: 10.1088/0004-637X/779/2/109
- Pfister et al. (2019) Pfister, H., Bar-Or, B., Volonteri, M., Dubois, Y., & Capelo, P. R. 2019, MNRAS, 488, L29, doi: 10.1093/mnrasl/slz091
- Pfister et al. (2020) Pfister, H., Volonteri, M., Dai, J. L., & Colpi, M. 2020, MNRAS, 497, 2276, doi: 10.1093/mnras/staa1962
- Piran et al. (2015) Piran, T., Svirski, G., Krolik, J., Cheng, R. M., & Shiokawa, H. 2015, ApJ, 806, 164, doi: 10.1088/0004-637X/806/2/164
- Predehl et al. (2021) Predehl, P., Andritschke, R., Arefiev, V., et al. 2021, A&A, 647, A1, doi: 10.1051/0004-6361/202039313
- Prochaska et al. (2020) Prochaska, J., Hennawi, J., Westfall, K., et al. 2020, The Journal of Open Source Software, 5, 2308, doi: 10.21105/joss.02308
- Quimby et al. (2013) Quimby, R. M., Yuan, F., Akerlof, C., & Wheeler, J. C. 2013, MNRAS, 431, 912, doi: 10.1093/mnras/stt213
- Rayner et al. (2003) Rayner, J. T., Toomey, D. W., Onaka, P. M., et al. 2003, PASP, 115, 362, doi: 10.1086/367745
- Rees (1988) Rees, M. J. 1988, Nature, 333, 523, doi: 10.1038/333523a0
- Reines & Volonteri (2015) Reines, A. E., & Volonteri, M. 2015, ApJ, 813, 82, doi: 10.1088/0004-637X/813/2/82
- Ricci et al. (2017) Ricci, C., Trakhtenbrot, B., Koss, M. J., et al. 2017, ApJS, 233, 17, doi: 10.3847/1538-4365/aa96ad
- Ricci et al. (2020) Ricci, C., Kara, E., Loewenstein, M., et al. 2020, ApJ, 898, L1, doi: 10.3847/2041-8213/ab91a1
- Ricci et al. (2021) Ricci, C., Loewenstein, M., Kara, E., et al. 2021, ApJS, 255, 7, doi: 10.3847/1538-4365/abe94b
- Roth et al. (2016) Roth, N., Kasen, D., Guillochon, J., & Ramirez-Ruiz, E. 2016, ApJ, 827, 3, doi: 10.3847/0004-637X/827/1/3
- Roth et al. (2021) Roth, N., van Velzen, S., Cenko, S. B., & Mushotzky, R. F. 2021, ApJ, 910, 93, doi: 10.3847/1538-4357/abdf50
- Saxton et al. (2020) Saxton, R., Komossa, S., Auchettl, K., & Jonker, P. G. 2020, Space Sci. Rev., 216, 85, doi: 10.1007/s11214-020-00708-4
- Saxton et al. (2008) Saxton, R. D., Read, A. M., Esquej, P., et al. 2008, A&A, 480, 611, doi: 10.1051/0004-6361:20079193
- Saxton et al. (2017) Saxton, R. D., Read, A. M., Komossa, S., et al. 2017, A&A, 598, A29, doi: 10.1051/0004-6361/201629015
- Saxton et al. (2022) Saxton, R. D., König, O., Descalzo, M., et al. 2022, Astronomy and Computing, 38, 100531, doi: 10.1016/j.ascom.2021.100531
- Sazonov et al. (2021) Sazonov, S., Gilfanov, M., Medvedev, P., et al. 2021, MNRAS, 508, 3820, doi: 10.1093/mnras/stab2843
- Schawinski et al. (2007) Schawinski, K., Thomas, D., Sarzi, M., et al. 2007, MNRAS, 382, 1415, doi: 10.1111/j.1365-2966.2007.12487.x
- Schawinski et al. (2014) Schawinski, K., Urry, C. M., Simmons, B. D., et al. 2014, MNRAS, 440, 889, doi: 10.1093/mnras/stu327
- Schlafly & Finkbeiner (2011) Schlafly, E. F., & Finkbeiner, D. P. 2011, ApJ, 737, 103, doi: 10.1088/0004-637X/737/2/103
- Shappee et al. (2014) Shappee, B. J., Prieto, J. L., Grupe, D., et al. 2014, ApJ, 788, 48, doi: 10.1088/0004-637X/788/1/48
- Shingles et al. (2021) Shingles, L., Smith, K. W., Young, D. R., et al. 2021, Transient Name Server AstroNote, 7, 1
- Short et al. (2023) Short, P., Lawrence, A., Nicholl, M., et al. 2023, MNRAS, 525, 1568, doi: 10.1093/mnras/stad2270
- Simcoe et al. (2013) Simcoe, R. A., Burgasser, A. J., Schechter, P. L., et al. 2013, PASP, 125, 270, doi: 10.1086/670241
- Skrutskie et al. (2006) Skrutskie, M. F., Cutri, R. M., Stiening, R., et al. 2006, AJ, 131, 1163, doi: 10.1086/498708
- Smith et al. (2020) Smith, K. W., Smartt, S. J., Young, D. R., et al. 2020, PASP, 132, 085002, doi: 10.1088/1538-3873/ab936e
- Smith et al. (2009) Smith, N., Silverman, J. M., Chornock, R., et al. 2009, ApJ, 695, 1334, doi: 10.1088/0004-637X/695/2/1334
- Stein et al. (2021) Stein, R., van Velzen, S., Kowalski, M., et al. 2021, Nature Astronomy, 5, 510, doi: 10.1038/s41550-020-01295-8
- Stern et al. (2005) Stern, D., Eisenhardt, P., Gorjian, V., et al. 2005, ApJ, 631, 163, doi: 10.1086/432523
- Stern et al. (2012) Stern, D., Assef, R. J., Benford, D. J., et al. 2012, ApJ, 753, 30, doi: 10.1088/0004-637X/753/1/30
- Stone & Metzger (2016) Stone, N. C., & Metzger, B. D. 2016, MNRAS, 455, 859, doi: 10.1093/mnras/stv2281
- Stoughton et al. (2002) Stoughton, C., Lupton, R. H., Bernardi, M., et al. 2002, AJ, 123, 485, doi: 10.1086/324741
- Strubbe & Quataert (2009) Strubbe, L. E., & Quataert, E. 2009, MNRAS, 400, 2070, doi: 10.1111/j.1365-2966.2009.15599.x
- Sukhbold & Woosley (2016) Sukhbold, T., & Woosley, S. E. 2016, ApJ, 820, L38, doi: 10.3847/2041-8205/820/2/L38
- Sun et al. (2022) Sun, L., Xiao, L., & Li, G. 2022, MNRAS, 513, 4057, doi: 10.1093/mnras/stac1121
- Svirski et al. (2017) Svirski, G., Piran, T., & Krolik, J. 2017, MNRAS, 467, 1426, doi: 10.1093/mnras/stx117
- Szalai et al. (2011) Szalai, T., Vinkó, J., Balog, Z., et al. 2011, A&A, 527, A61, doi: 10.1051/0004-6361/201015624
- Tadhunter et al. (2017) Tadhunter, C., Spence, R., Rose, M., Mullaney, J., & Crowther, P. 2017, Nature Astronomy, 1, 0061, doi: 10.1038/s41550-017-0061
- Teboul et al. (2024) Teboul, O., Stone, N. C., & Ostriker, J. P. 2024, MNRAS, 527, 3094, doi: 10.1093/mnras/stad3301
- Thévenot (2020) Thévenot, M. 2020, Research Notes of the American Astronomical Society, 4, 243, doi: 10.3847/2515-5172/abd415
- Thévenot et al. (2021) Thévenot, M., Gantier, J. M., Kabatnik, M., Schümann, J., & Gramaize, L. 2021, Research Notes of the American Astronomical Society, 5, 58, doi: 10.3847/2515-5172/abf120
- Thomsen et al. (2022) Thomsen, L. L., Kwan, T. M., Dai, L., et al. 2022, ApJ, 937, L28, doi: 10.3847/2041-8213/ac911f
- Tinyanont et al. (2016) Tinyanont, S., Kasliwal, M. M., Fox, O. D., et al. 2016, ApJ, 833, 231, doi: 10.3847/1538-4357/833/2/231
- Tonry et al. (2018) Tonry, J. L., Denneau, L., Heinze, A. N., et al. 2018, PASP, 130, 064505, doi: 10.1088/1538-3873/aabadf
- Vacca et al. (2003) Vacca, W. D., Cushing, M. C., & Rayner, J. T. 2003, PASP, 115, 389, doi: 10.1086/346193
- Valenti et al. (2014) Valenti, S., Sand, D., Pastorello, A., et al. 2014, MNRAS, 438, L101, doi: 10.1093/mnrasl/slt171
- van der Walt et al. (2019) van der Walt, S., Crellin-Quick, A., & Bloom, J. 2019, The Journal of Open Source Software, 4, 1247, doi: 10.21105/joss.01247
- van Velzen (2018) van Velzen, S. 2018, ApJ, 852, 72, doi: 10.3847/1538-4357/aa998e
- van Velzen & Farrar (2014) van Velzen, S., & Farrar, G. R. 2014, ApJ, 792, 53, doi: 10.1088/0004-637X/792/1/53
- van Velzen et al. (2016) van Velzen, S., Mendez, A. J., Krolik, J. H., & Gorjian, V. 2016, ApJ, 829, 19, doi: 10.3847/0004-637X/829/1/19
- van Velzen et al. (2021a) van Velzen, S., Pasham, D. R., Komossa, S., Yan, L., & Kara, E. A. 2021a, Space Sci. Rev., 217, 63, doi: 10.1007/s11214-021-00835-6
- van Velzen et al. (2011) van Velzen, S., Farrar, G. R., Gezari, S., et al. 2011, ApJ, 741, 73, doi: 10.1088/0004-637X/741/2/73
- van Velzen et al. (2021b) van Velzen, S., Gezari, S., Hammerstein, E., et al. 2021b, ApJ, 908, 4, doi: 10.3847/1538-4357/abc258
- van Velzen et al. (2021c) van Velzen, S., Stein, R., Gilfanov, M., et al. 2021c, arXiv e-prints, arXiv:2111.09391, doi: 10.48550/arXiv.2111.09391
- Wang & Merritt (2004) Wang, J., & Merritt, D. 2004, ApJ, 600, 149, doi: 10.1086/379767
- Wang et al. (2012) Wang, T.-G., Zhou, H.-Y., Komossa, S., et al. 2012, ApJ, 749, 115, doi: 10.1088/0004-637X/749/2/115
- Wang et al. (2022a) Wang, Y., Jiang, N., Wang, T., et al. 2022a, ApJS, 258, 21, doi: 10.3847/1538-4365/ac33a6
- Wang et al. (2022b) —. 2022b, ApJ, 930, L4, doi: 10.3847/2041-8213/ac6670
- Wen et al. (2022) Wen, S., Jonker, P. G., Stone, N. C., Zabludoff, A. I., & Cao, Z. 2022, ApJ, 933, 31, doi: 10.3847/1538-4357/ac70c5
- Wevers et al. (2021) Wevers, T., Pasham, D. R., van Velzen, S., et al. 2021, ApJ, 912, 151, doi: 10.3847/1538-4357/abf5e2
- Wevers et al. (2023) Wevers, T., Coughlin, E. R., Pasham, D. R., et al. 2023, ApJ, 942, L33, doi: 10.3847/2041-8213/ac9f36
- Winter & Lunardini (2023) Winter, W., & Lunardini, C. 2023, ApJ, 948, 42, doi: 10.3847/1538-4357/acbe9e
- Wolf et al. (2018) Wolf, C., Onken, C. A., Luvaul, L. C., et al. 2018, PASA, 35, e010, doi: 10.1017/pasa.2018.5
- Wong et al. (2022) Wong, T. H. T., Pfister, H., & Dai, L. 2022, ApJ, 927, L19, doi: 10.3847/2041-8213/ac5823
- Worthey & Ottaviani (1997) Worthey, G., & Ottaviani, D. L. 1997, ApJS, 111, 377, doi: 10.1086/313021
- Wright et al. (2010) Wright, E. L., Eisenhardt, P. R. M., Mainzer, A. K., et al. 2010, AJ, 140, 1868, doi: 10.1088/0004-6256/140/6/1868
- Yang et al. (2013) Yang, C.-W., Wang, T.-G., Ferland, G., et al. 2013, ApJ, 774, 46, doi: 10.1088/0004-637X/774/1/46
- Yao et al. (2022) Yao, Y., Lu, W., Guolo, M., et al. 2022, ApJ, 937, 8, doi: 10.3847/1538-4357/ac898a
- Yao et al. (2023) Yao, Y., Ravi, V., Gezari, S., et al. 2023, ApJ, 955, L6, doi: 10.3847/2041-8213/acf216
- Zackay et al. (2016) Zackay, B., Ofek, E. O., & Gal-Yam, A. 2016, ApJ, 830, 27, doi: 10.3847/0004-637X/830/1/27