How Does Connecting Online Activities to Advertising Inferences Impact Privacy Perceptions?
Abstract.
Data dashboards are designed to help users manage data collected about them. However, prior work showed that exposure to some dashboards, notably Google’s My Activity dashboard, results in significant decreases in perceived concern and increases in perceived benefit from data collection, contrary to expectations. We theorize that this result is due to the fact that data dashboards currently do not sufficiently “connect the dots” of the data food chain, that is, by connecting data collection with the use of that data. To evaluate this, we designed a study where participants assigned advertising interest labels to their own real activities, effectively acting as a behavioral advertising engine to “connect the dots.” When comparing pre- and post-labeling task responses, we find no significant difference in concern with Google’s data collection practices, which indicates that participants’ priors are maintained after more exposure to the data food chain (differing from prior work), suggesting that data dashboards that offer deeper perspectives of how data collection is used have potential. However, these gains are offset when participants are exposed to their true interest labels inferred by Google. Concern for data collection dropped significantly as participants viewed Google’s labeling as generic compared to their own more specific labeling. This presents a possible new paradox that must be overcome when designing data dashboards, the generic paradox, which occurs when users misalign individual, generic inferences from collected data as benign compared to the totality and specificity of many generic inferences made about them.
1. Introduction
Google provides multiple dashboards for customers to review and manage activity data collection and advertising personalization. The My Activity interface provides a canonical list of all activities linked to a Google account, e. g., web searches, watched YouTube videos, or map interactions. The Ad Settings dashboard allowed consumers to review the ad interests inferred or assigned based on these activities (following the completion of our study, the service was revised to My Ad Center (Google, Inc., 2022)). Prior work on dashboards (Zimmermann et al., 2014; Fischer-Hübner et al., 2016; Raschke et al., 2017; Herder and van Maaren, 2020) suggests that they can increase understanding of data collection and online advertising (Ur et al., 2012; Rader, 2014; Chanchary and Chiasson, 2015; Tschantz et al., 2018; Dolin et al., 2018; Weinshel et al., 2019; Rader et al., 2020; Wei et al., 2020).
However, our previous work (Farke et al., 2021) indicates that dashboards can have a surprising, inverse effect. Exposure to Google’s My Activity dashboard led to a significant decrease in perceived concern and an increase in the perceived benefit of data collection. At the time, we suggested that the disconnect between what data is collected and how that data may be used could be responsible for the dramatic shift in concern and benefit before and after viewing the dashboard. In this work, we seek to explore this disconnect between data collection and usage. We theorize that dashboards, which remain disconnected from the data food chain (Nissenbaum, 2019) by not demonstrating to users how their activities are used, are a key contributor to this observation. Nissenbaum’s data food chain metaphor is a conceptual framework that illustrates the flow of personal information through a hierarchy of stages of processing and usage, from the initial collection of raw data to the generation of actionable insights.
We evaluate this theory to determine if “connecting the dots” in the data food chain, i. e., connecting activities to advertising interests, stabilizes perceived benefit of and concern for online data collection. We conducted an interactive online study with participants who installed a browser extension to review a selection of their actual Google activities, such as those from Search, YouTube, and Maps, across recent to 18-month-old interactions. Participants then assigned ad interests they believed Google learned from those activities, effectively “reenacting” the task of Google’s behavioral advertising algorithms. Using a pre- and post-study design, we questioned participants about their concerns and perceived benefits of Google’s data collection before and after they completed assigning advertising labels to their online activities. This approach provided insight into changes in attitudes towards data privacy due to direct engagement with the data that informs ad personalization. Through this methodology, we sought to answer the following research questions:
-
RQ1
[Understanding of Ad Interests] How well do people understand inferred ad interests based on assigning interests to their real activities?
-
RQ2
[Impact on Benefit/Concern] How do people’s concerns and impressions about the benefits of Google’s data collection change after assigning interests to their real activities?
-
RQ3
[Reactions to Ad Interests] How do people react to the actual interests Google assigns to them?
In answering RQ1, participants assigned interest labels very differently compared to their Ad Settings page: only % of assigned interests occurred in Ad Settings. Those not in Ad Settings were often overly specific interests (e. g., a specific sports team), while Ad Settings interests were more general (e. g., “sports”). This expected specificity, which contrasts the generic labels on the Ad Settings page, greatly impacts perceptions of concern and benefit when answering RQ2. Participants were asked Likert questions about Google’s data collection before and after the labeling task, and similar to our previous work (Farke et al., 2021), there was a significant increase (small effect) in benefit following the labeling task but no significant difference with respect to concern, differing from prior work. This difference suggests that exposure to the data food chain in data dashboards can maintain priors, at least with respect to the participants’ concerns about data collection. However, we find that there is a significant decrease (moderate effect) after participants viewed their actual Google-assigned advertising interests, while the perceived benefit from Google’s data collection remains unchanged. In answering RQ3, most participants found these interests at least somewhat accurate. Many felt they were too generic to be a concern, which is in line with the work by Radar et al. (Rader et al., 2020). These results provide insights that may be applicable to various advertisement preference managers, including those offered by Facebook (Meta, 2023), X (formerly Twitter) (X Corporation, 2023), Microsoft (Microsoft Corporation, 2023), LinkedIn (LinkedIn Corporation, 2023), and Amazon (Amazon, 2023), whose platforms similarly aim to give users control over their collected activity data and the personalized ads based thereon.
While there are opportunities for data dashboards to better connect to the data food chain, there may also be a new paradox to overcome. We describe a new, potentially observed one as the generic paradox, where the perceived generality of data collection and its usage counteracts the combined specificity and privacy impact of multiple generic inferences. For data dashboards to be most effective in assisting users, they should both provide connections to the data food chain and combat the generic paradox, such as offering examples of how seemingly generic combinations of labels are actually quite specific. For example, while a single ad interest presented to the user in the Google Ad Settings interface is generic, Google and advertisers could aggregate these interests and infer a more detailed picture of a user than any single interest can on its own.
2. Related Work and Background
Related Work
There is a rich body of related work, but we mostly focus on two specific areas. First is research that investigates users’ understandings of the online behavioral advertising ecosystem (Rader et al., 2020; Warshaw et al., 2016; Barbosa et al., 2021; Weinshel et al., 2019), e.g., by conducting a survey of the topic or letting users interact with their own labels. Our study builds upon this line of work as we are also concerned with how users perceive this ecosystem; however, we apply a different method. In particular, we ask participants to not only observe the labels applied to them by advertisers but also to imagine generating said labels. The second major area focuses on measurements within the advertising ecosystem (Sabir et al., 2022; Wills and Tatar, 2012; Datta et al., 2015; Andreou et al., 2019; Reitinger et al., 2023), such as its accuracy and the frequency in which the inferences are updated or individualized. Our work builds on this line of research as well by observing directly how users expect labels to be applied compared to how they are actually applied as a proxy measurement of the accuracy of the labels.
Most of all, our research is motivated by the findings of our previous study (Farke et al., 2021). There we conducted a study with participants to examine the impact of Google’s My Activity dashboard on participants’ concerns and benefits of Google’s data collection. Surprisingly, interacting with the dashboard led to a decrease in concern and an increase in perceived benefits, and we discussed the possibility that such an effect could be mitigated by providing more context for how the data is used in the dashboard. Our work builds on that conjecture through our survey methodology, namely the labeling task as the primary task in a pre-post study design.
In the rest of this section, we describe in more detail the prior work we build upon. Rader et al. (Rader et al., 2020) investigated people’s reactions to Google’s and Facebook’s ad interests and found that understandings are bounded by past online behaviors and self-perceptions of interests. To investigate inference literacy through interviews, Warshaw et al. (Warshaw et al., 2016) found that few believed companies can make the type of deep personal inferences that are nowadays common and that inferences are based largely on directly gathered demographic data or via straightforward processing of online behavioral data. Barbosa et al. (Barbosa et al., 2021) built a tool to help individuals engage with automatically constructed profiles by displaying in-the-moment notifications of the profile construction. They found that this increased visibility and understanding of how particular actions can lead to specific ads. To understand how visualizing inference-level information about online tracking impacts people’s knowledge, perceptions, and attitudes, Weinshel et al. (Weinshel et al., 2019) built a browser extension to conduct a longitudinal field study, finding that after participants viewed visualized examples, they had a more accurate perception of tracking and were more likely to take action. Sabir et al. (Sabir et al., 2022) explored how Facebook generates ad interests and found that even minor activity, such as scrolling through a page, can lead to an inference. But interests can often be inaccurate with explanations that are too generalized and/or misleading.
Datta et al. (Datta et al., 2015) created “AdFisher” to explore how individual behaviors impact Google’s ads and inferences. Rather than providing transparency, Ad Settings was opaque about some features of a person’s profile, and visiting certain websites could change the ads but not the reported inferences. Wills & Tatar (Wills and Tatar, 2012) used controlled browsing and also found cases in which ads were shown to people but did not appear as categories. To determine what advertisers infer about individuals and their accuracy, Bashir et al. (Bashir et al., 2019) studied four ad preference managers from Google, Facebook, Oracle BlueKai, and Nielsen eXelate by gathering full interest profiles and asking participants if they were actually interested in these topics. They found that participants were strongly interested in only of the interests in their profiles and that browsing history only explains a small percentage of interests. Andreou et al. (Andreou et al., 2019) measured the Facebook advertising ecosystem and found that the median number of interests inferred for a person is and that a significant number of advertisers employ targeting strategies that could be either invasive or opaque. Finally, recent work by Reitinger et al. (Reitinger et al., 2023) conducted a longitudinal measurement study showing that the inferred interests on Google Ad Settings are frequently updated, accurate, and often individualized. Confirming their findings, we discuss the dangers of combining inferences in Section 5.
Google’s Advertising Interests
Google offers targeted advertising as a tool for advertisers to display their ads to selected audiences based on a profile of “interests,” “purchase intentions,” or “behaviors.” Google determines these profiles based on user interactions with Google’s “free” services, e. g., Chrome, Google Search, Google Maps, and YouTube, where, for example, watching Star Wars leads to the interest Science Fiction & Fantasy Films to appear in a profile. Users can also view/delete individual interests, limit certain categories (i. e., alcohol and gambling), or completely disable ad personalization on the Ad Settings page (adssettings.google.com) (revised to My Ad Center in November 2022 (Google, Inc., 2022)).
At the time of the study, Google described five different interest types: (i) Demographicinterests (age, gender, and language) of self-reported data, (ii) Advertiserinterests (e. g., “Samsung Electronics”), and (iii) Aggregatedinterests (e. g., Homeownership Status) by determining activities “similar to people who’ve told Google they’re in this category.” By far, the biggest number of inferences are (iv) Activityinterests that are directly inferred from the activities associated with a Google account, and also a few (v) YTCinterests, likely based on YouTube comments or “video interactions.” Google describes around interests that originate from their AdWords vertical list (Google, Inc., 2021) that starts with 26 topics ranging from “Arts & Entertainment” to “Travel & Transportation.” The remaining labels are subcategories (or further nested) of these topics, with up to eight levels. We use this list of interests for participants to auto-fill when labeling their own activities. A list of example interests can be found in Table 7 in Appendix A.2. Other services like Facebook, LinkedIn, or Microsoft offer similar functions to control ad inferences.
3. Method, Recruitment, and Limitations
The study was designed around a custom online survey and browser extensions, in which participants interacted with their real Google account activities to apply interest labels, the labeling task (described below). At the time of the study, Google’s My Activity and Ad Settings dashboards only show the result, either the activity or the interest, but not how activities connect to interests. In conversation with our prior work (Farke et al., 2021), this study is designed around a labeling task to evaluate how reflective thinking (Fleck and Fitzpatrick, 2010) may alter the mental models of the data collection and assist users in understanding how their data may be used, which could lead to changes in attitude about technology (Bateman et al., 2012). Below, we describe the study procedure and analysis in more detail.
Study Procedure
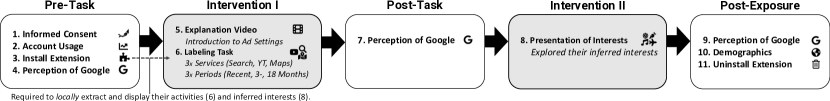
We performed six pilots with co-workers to refine the protocol, and we also performed test runs () on Prolific (Prolific, Academic Ltd., 2022), fixing an issue with timestamps at the start and end of the survey. The final procedure is outlined in Figure 1 and detailed below. The complete survey can be found in Appendix A.1.
-
(1)
Informed Consent: Participants consented to the described procedure, risks, benefits, and right to withdraw.
- (2)
-
(3)
“Survey Assistant” Browser Extension and Google Sign-In: Participants were directed to install the browser extension, with descriptions of its functionality and removal after the study. After this, participants signed in to their primary Google account using third-party sign-on and were informed that no details beyond their My Activity and Ad Settings pages would be accessed.
- (4)
-
(5)
Explanation of Google Ad Settings (Video): Participants watched a short video (Google, Inc., 2020) by Google explaining Ad Settings.
-
(6)
Labeling Tasks: Participants were presented with their past activities parsed from My Activity for three services, Google Search, YouTube, and Maps, and time periods, recent (i. e., last seven days), 3-months old, and 18-months old (Pierce, 2020). We randomly selected 100 activities that met these requirements and randomly displayed 9 (three services three time periods). Participants were asked to assign ad interests they believe Google learns from the shown activities. Participants were allowed to skip activities (when they considered the activity boring, generic, or sensitive), replacing it with another random activity of the same criteria. If all activities in a category were skipped, the entire portion was skipped. Only participant-labeled activities are included in the analysis.
- (7)
-
(8)
Exposure to Inferred Interests: Participants were then presented their real interests from Google, which must be viewed for 30 seconds before continuing. This part and the next were skipped when participants turned off ad personalization.
- (9)
- (10)
-
(11)
Browser Extension Removal & Feedback: Participants gave feedback optionally and removed the extension.
Statistical Tests and Regression Analysis
We performed six Wilcoxon signed-rank tests for repeated measurements on the Likert responses to the questions on concern Q2, Q9, and Q11, as well as the questions on frequency of benefit Q3, Q10, and Q12. To correct the p-values, we used Holm’s method for overlapping measures. These tests assume that the exposures, either the labeling task or viewing the interests, affected changes in concern or benefit.
To explore if there are other factors, we conducted two binomial logistic regressions that included demographics, labeling accuracy, and other factors to determine what else might influence participants to decrease their concern rating or increase their benefit rating, respectively. Finally, we calculated a binomial logistic regression mixed-effect model to explore whether participants were more likely to choose labels that Google also inferred (i. e., were on their Ad Settings page) for activities of a specific service or time frame.
Qualitative Coding
We analyzed the free-response questions on concern Q2_A, Q9_A, and Q11_A, frequency of benefit Q3_A, Q10_A, and Q12_A, and accuracy of the Ad Settings page Q13_A using qualitative open coding. One author bootstrapped the process using the codebook published in the extended version of our previous work (Farke et al., 2021) by coding the entire set of responses. Whenever they identified missing themes, new codes were added. A new codebook was crafted for the accuracy question using the same method. To validate it, a secondary coder conducted several rounds of coding on a sub-sample of each free-response question. Every round of coding resulted in updating the codebook. We repeated this process until we reached an inter-coder agreement (Cohen’s , , ).
Since we were especially interested in why people change their concern/benefit rating in the different parts of the survey, we did another coding with the subset of participants that changed their rating. Here, the coders identify reasons for increasing/decreasing concern/benefit, and this process was repeated together with a second coder for the question pairs Q2_A and Q9_A, as well as Q3_A and Q10_A.
Ethical Considerations
The institutional review board (IRB) of the George Washington University approved our study under following number NCR213523. All participants were informed and consented to the study. As our browser extension had access to the participants’ Google accounts, we were especially cautious not to collect any data participants would not want to share. At no time did the extension nor the researchers have access to the participants’ Google password or any other Google account data besides My Activity and Ad Settings. Participants could also decide in each labeling task whether they consider the presented activity too sensitive and thus exclude it from the analysis. We also carefully reviewed the final dataset for personally identifiable information (PII) and removed anything we considered problematic.
Recruitment and Demographics
Of the initially recruited people residing in the U.S. via Prolific (Prolific, Academic Ltd., 2022), completed the study in May 2022. We do not consider the dropout rate a systematic issue with the participant pool, as the population of Prolific generally yields representative results for questions about user perceptions and experiences (Redmiles et al., 2019; Tang et al., 2022). We rather explain the number of dropouts as follows: people did not consent to participate in the study (either they did not want to install the browser extension or were using the wrong browser/device), more chose not to log into their Google account, and for , the browser extension failed to fetch data. Four additional people completed the study but failed to submit for credit on Prolific, and four withdrew mid-study. Only the remaining six people dropped out for unknown reasons.
All participants who completed the study were compensated ] with a medium completion time of to minutes. As the study consisted of interactive tasks (e. g., authenticating with Google, installing an extension, and answering open-text responses), we did not use attention check questions due to the ability to assess data quality directly. In reviewing responses, we observed only four participants who were eventually excluded due to inconsistencies in their data. Not all participants had sufficient activities for the labeling tasks, and only participants who completed at least three tasks were considered in the analysis, excluding another participants. These eligibility checks resulted in participants being included in the final analysis. Table 5 in Appendix A.2 shows the demographics of the participants who completed the study and the participants included in the analysis.
Of these participants, had Google ad personalization enabled with a total of different interests, with a median of interests () per participant. Most interests were activity-based (, representing distinct interests). The remaining interests included: advertiser interests from different advertisers; aggregated interests with different interest combinations across 7 categories; demographic interests with distinct interests across 3 categories); and YTC interests, of which were distinct. The top 10 interests, which are all activity based, can be found in Table 6 in Appendix A.2.
We did not ask the participants why they disabled ad personalization. Privacy concerns may be one possible explanation, but we did not find any significant difference in the initial level of concern between both groups.
Limitations
Due to the restrictions of our recruitment, our sample is not fully representative in multiple dimensions. The study’s methodology inherently introduces a degree of self-selection bias, particularly in the requirement for participants to install a browser extension and share their Google account data. This requirement may deter more privacy-conscious individuals from participating, as they may be less willing to grant access to their online activities and install third-party software. Despite this, we argue that there are still significant and relevant takeaways, particularly as recent work suggests that online samples can provide insights compared to the general population (Redmiles et al., 2019; Tang et al., 2022). Notably, Tang et al. (Tang et al., 2022) showed that gender-balanced data collected through Prolific for online privacy and security surveys is generally representative when questioning participants about their perceptions and experiences. While only studying an U.S.-based sample is a limitation, it was chosen for better comparability (Farke et al., 2021).
There are also limitations in data balancing as a number of participants did not complete the same number of labeling tasks, either because they skipped activities or did not have enough activities. We argue that the exposures to activities and advertising interests are still sufficient to measure pre- and post-effects as well as to perform exploratory regression analysis. These limitations may, however, affect results regarding the difference in labeling and perceptions thereof, and we include clarifications in those cases. There was also a reasonable fraction () of participants who disabled ad personalization, and as a result, some results are based on a smaller, but still meaningful, share of participants.
Finally, as our sample size, including the exclusions, is relatively small, there are limitations regarding the conclusions that can be drawn from failed significance testing. We conducted power analyses and determined that the Wilcoxon sign-ranked tests comparing pre- and post-exposure should be sufficiently powered with to identify medium effects (). For the regression analyses with 12 predictors, the power analyses revealed that the regression models are also sufficient for identifying medium effects (). While this is reasonable for identifying trends, a much larger sample would be needed to rule out other influential factors that might have small effect sizes conclusively.
4. Results
This section is structured along our three research questions. We first present participants’ understanding of inferred ad interests by describing how they labeled their online activities. Secondly, we show the impact of letting participants connect their online activities and interest labels on the perceived concern and benefit of Google’s data collection. Finally, we report users’ perceptions of the interest labels that Google actually applied to their profile.
4.1. RQ1: Understanding of Ad Interests
Labeling Task
Participants were presented with nine activities from a list of up to 100 randomly selected activities from their My Activity page that matched the following criteria. Activities were selected both temporally and based on services: recent, three months, or 18 months old (Pierce, 2020) and Google Search, YouTube, or Google Maps. Participants could skip activities if they found them “too boring,” “too generic,” or “too sensitive.” When skipped, the activity was replaced with another one from the list of selected activities. Most participants, i. e., of the participants, skipped at least one activity with a median of seven activities, and participants skipped enough activities of one criterion, only labeling 8 activities instead of 9. Only two participants skipped two of the nine labeling tasks.
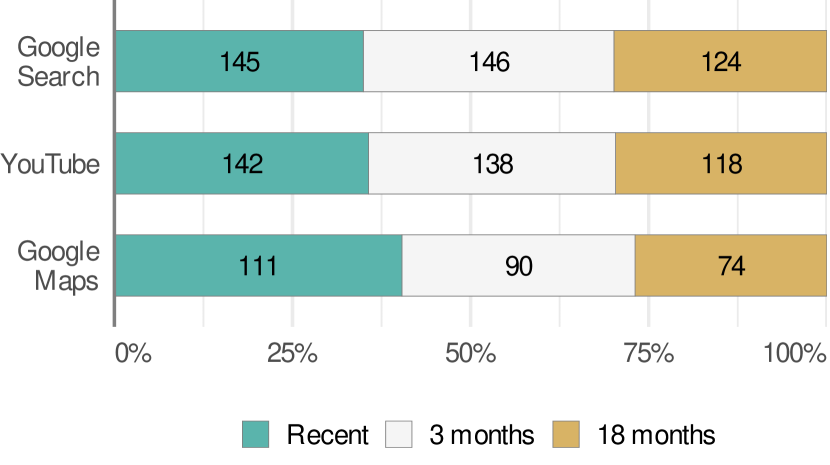
Overall, participants completed nine and participants eight of the labeling tasks, respectively. Seven labeling tasks were completed by participants, six by , and five by participants. The remaining 35 participants completed four () or three () labeling tasks, most often because there were not enough activities in those participants’ profiles to match the criteria. We include these participants who completed at least three labeling tasks in the analysis below. Figure 2 shows a breakdown of the completed labeling tasks per service and time frame.
Participants’ Labels Present in Ad Settings Page
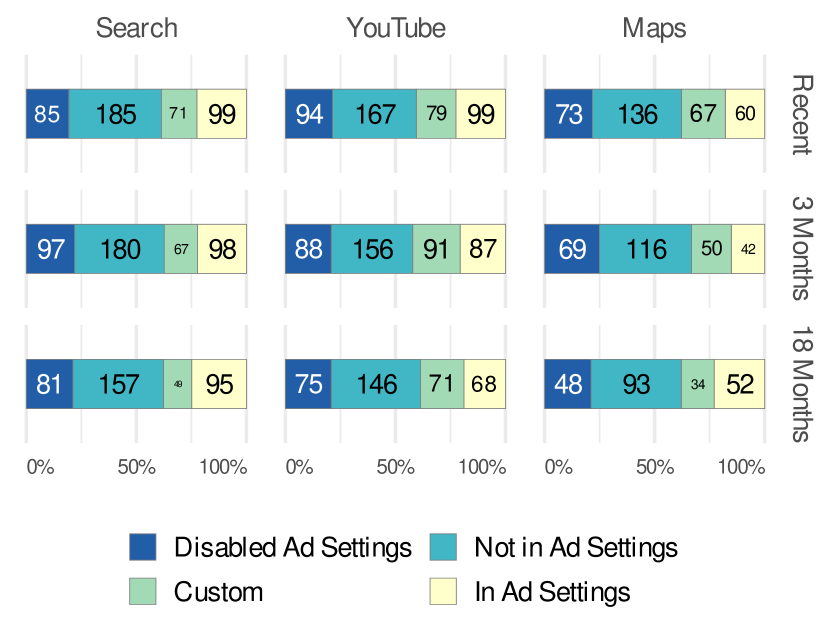
Participants labeled activities with advertising interests by typing into a text field that suggested verticals from AdWords (Google, Inc., 2021). Additionally, they could create and add custom labels. We compared the labels applied by the participants with the list of interests from their Ad Settings page. Figure 3 visualizes the difference between the participants’ self-applied labels and Google’s applied interest labels. In total, the participants applied labels across all completed labeling tasks.
Participants often created a custom label even when a matching vertical was available. We developed multiple processes to match custom labels to verticals. First, we performed simple text transformations, e. g., adjusting the capitalization and striping white spaces. Next, we combined any custom labels that were synonyms (e. g., “Kids” and “Children”), singular/plural writings, and corrected typos. We then split the custom labels into individual words, filtering out any stop words (e. g., function words like “and” or “to”), and removed all remaining words with less than three letters. The remaining words were again compared to AdWords verticals and replaced with a vertical if a match existed.
We sought agreement between two researchers to verify replacements. One researcher reviewed if one of the replacement verticals was suitable (e. g., “Computer & Video Games” for “Video Games”) and aligned the decision with that of the other researcher. The custom label was not replaced when no agreement was reached. This process reduced the number of custom labels from to distinct labels. Finally, we performed a qualitative coding of the remaining custom labels as specific and generic labels.
Most of the selected labels did not occur on the participants’ Ad Settings page (on median, only out of ). As shown in Figure 3, these label differences occurred across services and time frames, and we sought to explore what factors may lead to more concurring labels. To do so, we calculated a generalized logistic regression with mixed effects (see Table 1), with an outcome variable of whether the labels applied by the participants are on their Ad Settings page. We included the three services and time frames, with interactions as input variables. Since participants performed multiple labelings (i. e., repeated measures), the participant’s ID is a random effect, and YouTube and months are the model baselines.
We find that when selecting Google Maps, participants are less likely to choose labels showing up on their Ad Settings page, except potentially when considering a Maps activity that is 18 months or older (trending towards significance). However, the model’s Aldrich-Nelson pseudo- is , which is low, suggesting that these factors do not explain the variance in labeling difference well.
| Factor | Est. | OR | Error | z | Pr(>|z|) | |
|---|---|---|---|---|---|---|
| (Intercept) | -1.11 | 0.33 | 0.15 | -7.63 | <0.001 | *** |
| Google Search | 0.05 | 1.06 | 0.18 | 0.30 | 0.767 | |
| Google Maps | -0.42 | 0.65 | 0.23 | -1.88 | 0.059 | . |
| Recent | 0.11 | 1.12 | 0.18 | 0.61 | 0.541 | |
| 18 months | -0.16 | 0.85 | 0.20 | -0.84 | 0.402 | |
| Interaction | Est. | OR | Error | z | Pr(>|z|) | |
| Search Recent | -0.13 | 0.87 | 0.25 | -0.53 | 0.595 | |
| Maps Recent | 0.14 | 1.15 | 0.30 | 0.47 | 0.639 | |
| Search 18 months | 0.25 | 1.29 | 0.27 | 0.96 | 0.339 | |
| Maps 18 months | 0.60 | 1.83 | 0.32 | 1.91 | 0.056 | |
Signif. codes: ; ; ;
How Participants Labeled Their Activities
To observe the differences between the labels the participants and Google applied, we must exclude of the labels applied by participants that had disabled Ad Settings. Out of the remaining applied labels, are on the participants’ Ad Settings page, did not, and were custom labels created by the participants. There are two potential reasons for this: (i) the activity was unusual for the participant, or (ii) participants apply interests differently than Google. We reviewed the non-matching labels and found that there are two distinct groups of labels applied by participants not appearing in Google’s labeling: (i) Too generic (e. g., Comedy, Maps, Images, YouTube, knowledge); or (ii) overly specific (e. g., Minecraft, Disney+, Taylor Swift Red). Other reasons include the use of (iii) banned or sensitive ad categories (e. g., Christianity, pornography, COVID-19, brewing, depression) or (iv) context-dependent knowledge that cannot be inferred from the activity alone (e. g., hobbies, ideas).
Among the three services, Google Maps activities were the most difficult to label, with participants often applying labels like recently visited, places, street, or driving directions. We also found that out of the labels appeared in the activity description, i. e., the label “Reddit” was used for the activity “Searched for: Can other people on Reddit see your followers.” When we split multi-word labels and removed stop words, we even found matches for out of labels, e. g., for the custom label “Rice Dishs[sic]” in the “Searched for: Dye rice.”
Summary of RQ1 [Understanding of Ad Interests]
We find that participants apply interest labels differently than Google, as only about one quarter of the applied labels occur on the participants’ Ad Settings pages. Google Maps activities are especially difficult to label. Non-matching labels were either too generic (“Maps”) or overly specific (“Sims 4”).
4.2. RQ2: Impact on Benefit and Concern
In this section, we focus on participants’ perceived concern about and benefit from Google’s data collection. We ask the same Likert and open-response questions before and after the labeling task. A shift in the responses may indicate a change in perspective due to the labeling task. We provide a complete analysis of those responses and qualitative feedback regarding concerns/benefits before and after the task.
Initial Perceptions Concerns
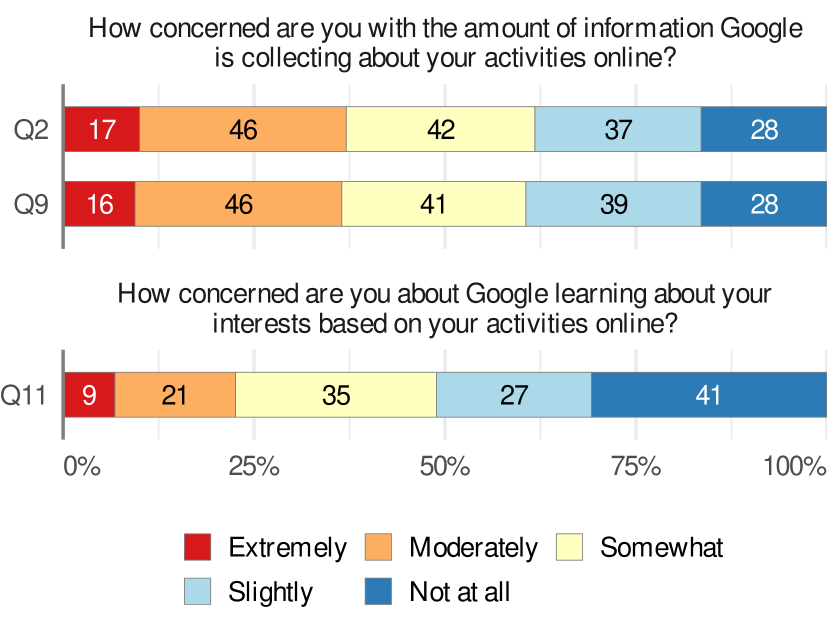
In 4(a) (top bar), the results of Q2 are presented regarding the concern for Google’s data collection. There is a near-even split between participants who were moderately or extremely concerned () and those who were slightly or not at all concerned (). Another participants were somewhat concerned. These heterogeneous results indicate that participants have diverse perceptions of Google’s data collection.
When participants were asked to explain their concerns (Q2_A), out of mentioned personal privacy. Among these participants, mentioned concerns about Google selling their data, such as P174, who reported being slightly concerned and said, “I do not like that they can make tons of money selling my data but I don’t see any of that money.” Participants may be confounding selling targeted advertisements with selling personal information. As illustrated by P78 (moderately concerned), “I’m sure they are selling user info, if not directly then by selling targeted ads.”
Sharing or having others view their personal information was a concern of participants, e. g., P157 (extremely concerned) responded, “I do not like strangers knowing my personal information and/or details of all my online activities.” Another concern mentioned by participants was the amount of information collected. As P153 (moderately concerned) explained, “Google collects so much information that I’m concerned I don’t really have a say in what they are collecting.” participants were worried about third parties accessing their data, like P115 (moderately concerned) who wrote: “They have access, which I have granted them, to a lot of my private information. This information may end up with third parties.”
Further concerns include information being used to track people across websites and services were raised by participants, such as when P133 (extremely concerned) said, “I want my browsing experience to be private and not tracked.” Moreover, participants had concerns about the sensitive nature of some of the information, e. g., P142 (extremely concerned) shared, “It concerns me that some of that information that is shared might be sensitive and something I do not want companies to know.”
For participants, the unknown itself was concerning. Such unknowns include how information is used (), how much information is collected (), and who has access to the information (). The response of P123 (somewhat concerned) illustrates this: “I am somewhat concerned considering that I do not really know how much information Google collects from me, or if I can limit how much in any meaningful way.”
Privacy fatigue was another theme described by participants who stated they were resigned to the loss of privacy when using online websites and services such as Google. For example, P55 (not at all concerned) noted: “Not much I can do to stop it, so why worry?” Participant P88 (slightly concerned) added: “I believe that data gathering and analytics is occurring in all aspects of life from the television that you watch to the groceries that you buy so I’m really not that concerned and there is little I can do to block the collecting of information.”
Another participants considered Google’s data collection as a reasonable trade-off for free applications and services. For instance, P62 (not at all concerned) noted: “They aren’t collecting any more from me than from anyone else and it is the cost of using their free services.” Participant P60 (slightly concerned) articulated that the conveniences of Google services made them willing to accept the data collection, explaining: “Google provides many conveniences to me as an internet user. It’s not ideal that so much information is gathered about me, but I’m not prepared to give up these conveniences.”
There were participants whose concerns were primarily for the security of their collected data. Examples include security concerns about their data being released in some way (), such as a data breach at Google. Like when P9 (moderately concerned) explained, “I’m concerned that my data may fall into the wrong hands through a breach or other methods.” Also, participants were concerned that their data could be mishandled or misused in a way that would be harmful. An instance of this is when P72 (somewhat concerned) mentioned, “It exposes my information to those out there that could end up being malicious.”
However, participants reported being unconcerned about the amount of information Google collects. Eight participants stated that the information Google collected was non-sensitive in nature, like P67 (not at all concerned), who recalled, “I don’t have anything that I would deem important that I don’t mind Google knowing.” Another five participants felt the collection of information was low risk to them personally, e. g., P33, who reported being not at all concerned, said simply, “As long as it isn’t harmful to me personally, I am okay with it.” Still, four participants claimed they had nothing to hide. For instance, P107 (somewhat concerned) explained, “I need it, and I don’t have anything to hide, so it doesn’t really matter to me.” Two participants were unconcerned because they had never experienced negative impacts, e. g., P105 (slightly concerned) mentioned, “Only slightly concerned because I’ve never had any bad experiences with Google or privacy.” participants explicitly noted that they trusted Google for the reason they were unconcerned.
Initial Perceptions of Benefits
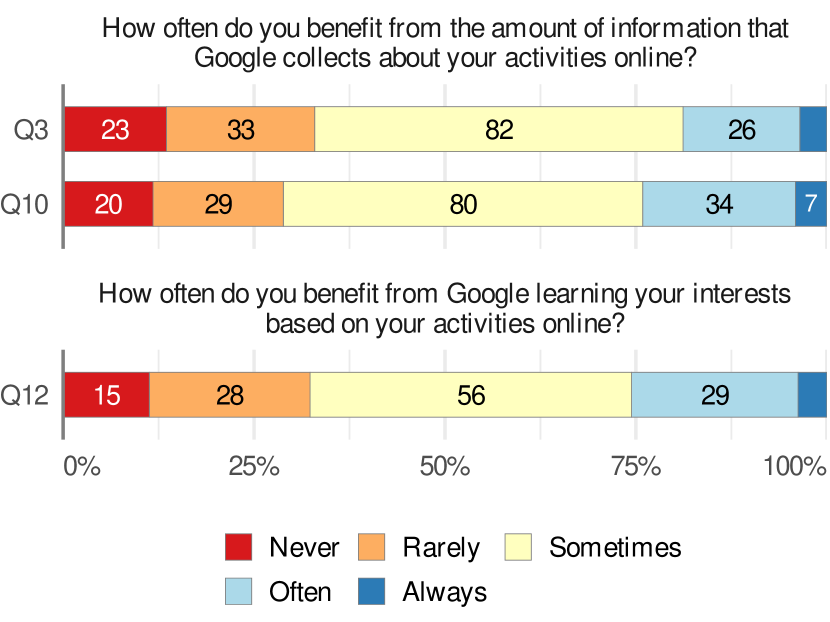
Participants seemed uncertain when first asked how often they benefit (Q3) from the amount of information Google collects (cf. 4(b); top bar). Almost half stated they sometimes benefit from data collection, and the remaining tend to choose rarely or never () instead of often or always (). This result indicates that direct benefits coming from the data collection are intangible for the participants.
When explaining why or why not they benefit (Q3_A), participants described the benefits of personalized advertisements. Better recommendations were emphasized by participants, e. g., when using Google Search (), YouTube (), or Maps (). Also, participants mentioned an overall improved experience. For instance, P139, who reported benefiting sometimes from the amount of information collected, responded: “I believe that the info collected is used to improve my experience with Google products. For example, using my watch history for better recommendations on YouTube.” Participant P66 (sometimes), who found personalized advertisements useful, said, “I see ads pop up that are relevant to me quite frequently. I’m assuming Google know what ads to show me based on information they’ve collected on me.” Nine participants found it useful to revisit their Google activity history, such as when P16 (sometimes) had this to say, “It will remember your history to be able for easy access next time you want to visit the same page.” participants mentioned a personalized experience, e. g., P50 (sometimes), who said, “It can be used to personalize apps and websites, or to track things like my location, which can be useful to me.” Five participants called out the benefit of Google Chrome filling out forms automatically and remembering passwords for websites. As an example of this, P48 (sometimes) explained, “When I am autofilling forms with information Google has already collected from me I benefit by saving time.”
However, participants stated that personalized ads were not beneficial to them. This was highlighted by P172 (rarely), who shared: “I don’t find the personalized ads useful at all. Instead, I find them creepy because it means Google is watching my every step online.”
Changing Perceptions of Concerns
| Concern | n | Effect Size | W | Pr(>|W|) | |||
|---|---|---|---|---|---|---|---|
| Q2 | Q9 | 170 | 0.009 | (small) | 848.0 | 0.668 | |
| Q2 | Q11 | 133 | 0.405 | (mod.) | 1995.0 | <0.001 | *** |
| Q9 | Q11 | 133 | 0.388 | (mod.) | 1373.5 | <0.001 | *** |
| Benefit | n | Effect Size | W | Pr(>|W|) | |||
| Q3 | Q10 | 170 | 0.157 | (small) | 854.5 | 0.069 | |
| Q3 | Q12 | 133 | 0.098 | (small) | 557.0 | 0.454 | |
| Q10 | Q12 | 133 | 0.097 | (small) | 85.5 | 0.186 | |
Signif. codes: ; ; ;
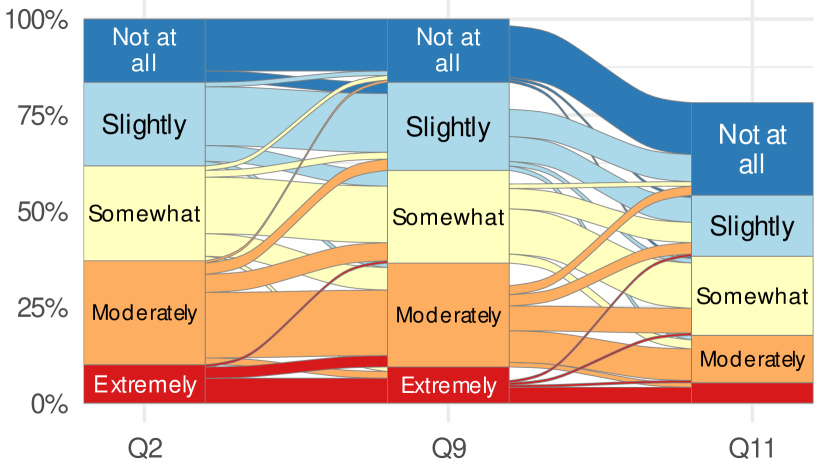
Comparing only the proportions in 4(a) (top two bars), it seems that there is no change between the initial concern (Q2) and concern after the labeling tasks (Q9). This is confirmed by a two-tailed Wilcoxon signed-rank test (cf. Table 2, comparing Q2 to Q9); no significant difference was found (). More details on how the participants change their level of concern are shown in the alluvium plot in 5(a) (first two columns). Out of the 170 participants, did not change their initial assessment after doing the tasks. The remaining 56 participants changed their assessment: moved to a lower concern level, and moved up.
Compared to our previous work (Farke et al., 2021), this is notable as back then, we found a decrease in the level of concern after participants observed their Google My Activity dashboard. Here, we observe no significant difference before and after observing activities and applying ad interests to those activities. This could be due to the further reasoning requested of participants, where they now had to consider what Google may actually learn from their activities. However, after reviewing their true interest as assigned by Google (i. e., a “summarized” version of their activities), their concern actually dropped. We discuss these further results in more detail in Section 4.3.
| Factor | Est. | OR | Pr(>|z|) | |
|---|---|---|---|---|
| (Intercept) | -19.01 | 5.55E-09 | 0.986 | |
| 18.75 | 1.39E+08 | 0.986 | ||
| 18.52 | 1.10E+08 | 0.987 | ||
| 17.05 | 2.54E+07 | 0.988 | ||
| 15.57 | 5.79E+06 | 0.989 | ||
| Labeling difference | 0.26 | 1.30E+00 | 0.869 | |
| Increasing benefit | 2.13 | 8.39E+00 | <0.001 | *** |
| -1.47 | 2.31E-01 | 0.016 | * | |
| -0.56 | 5.73E-01 | 0.445 | ||
| 0.80 | 2.22E+00 | 0.269 | ||
| -0.27 | 7.66E-01 | 0.734 | ||
| -0.31 | 7.37E-01 | 0.596 | ||
| Has S.T.E.M major | 0.18 | 1.20E+00 | 0.778 | |
Signif. codes: ; ; ;
While there was no significant difference between concerns, overall, there were participants who did change their concern level, both up and down. We conducted a generalized logistic regression to identify the factors that more likely lead to a decrease in concern. Logistic regression is an ideal model for this analysis as it considers a single binary outcome: After the labeling task, did the participant decrease their concern, or not? (Q2 vs. Q9). The model provides how correlated the input factors are to a binary variable, as well as how much more likely a given input would lead to the output factor (the odds ratio). For input factors, we selected 1) demographic input factors, such as age, education, and gender, as these were used in prior work (Farke et al., 2021); 2) how differing the participants’ labeling of activity were compared to how Google applied labels; 3) and finally, what their initial concern levels were as represented in their Likert response to Q2, where Not at all Concerned is withheld and included in the intercept. Note, the same description applies to the results in Table 4, but in this case, regarding benefit instead of concern.
Regarding a decrease in the level of concern (Table 3), we find that participants who increase their benefit rating (comparing Q3 to Q10) were more likely to decrease their concern assessment (; ; ). Participants who identified as male were more likely to increase their concern, higher (; ; ).
Participants were also asked (Q9_A) why they changed or did not change their assessment of how concerned they are with the amount of information Google collects about their activities online. Participants who changed their perspective and became more concerned () after completing the labeling task included those who were worried about the amount of information collected () or that their search history was recorded (), or that the data collected could be used to track them online (). For instance, P26, who reported being somewhat concerned before the labeling task and changed to moderately concerned afterward, responded, “I forgot how many little details of the websites I was visiting were being collected.” P64 (somewhat concerned to moderately concerned) explained, “I didn’t realize what a snapshot of my life that they keep. And these are just recent searches.” Participant P93 (slightly concerned to somewhat concerned), reacting to an activity collected in the 18-month or older timeframe, illustrated: “It’s kind of surprising that they can essentially take screenshots of everything that I look up and store it. Also, I was kind of surprised to see search results from 2020, which makes me think about how much information they could be storing and from how long ago.”
Learning that Google collected search history made participant P53 (somewhat concerned to moderately concerned) more concerned as they noted, “I didn’t know Google collected my entire search history.” Participant P83 (somewhat concerned to moderately concerned) felt the data collection was invasive and that they were being tracked as they explained, “It feels invasive knowing how much I am being tracked at all times as if I have no privacy and can be tracked and found by anyone at anytime.” Others increased their concern when they found that the information collected was sensitive in nature (), very specific to them (), and contained location data (). For example, P79, who was slightly concerned and became moderately concerned, highlighted, “It doesn’t seem to track as much variety of information as I thought and a lot of what I saw it tracked was very personal.” P28 (not at all concerned to slightly concerned) added, “I noticed that specific addresses were collected that I am not comfortable sharing.”
In contrast, some participants who changed their perception of the data collection became less concerned () after completing the labeling task. Their reasons for becoming less concerned included that the information shown was not sensitive () or was generic in nature (). For instance, participant P5, who was somewhat concerned and changed to not at all concerned said simply, “There is nothing sensitive in this information.” While P99 (slightly concerned to not at all concerned) added: “I realized how little of importance the results that came up where, most of them were in regards to what I was currently studying or just watching on YouTube which had no real value to a person outside of recommending me things that would be more to my preferences.”
Changing Perceptions of Benefits
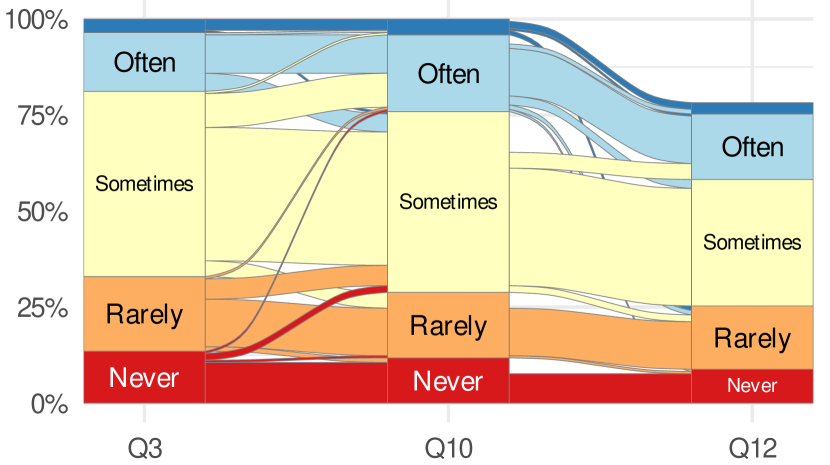
The top two bars in 4(b) suggest a slight increase in the frequency of initial benefit assessment (Q3) and after the labeling tasks (Q10). A detailed overview of the pair-wise changes of benefit can be found in 5(b) (left & middle column). From the initial benefit (Q3) to the benefit after the labeling tasks (Q10), participants increased their ratings. A majority of participants did not change, and participants even decreased their assessments.
We performed a two-tailed Wilcoxon signed-rank test (), which is trending toward significant with a possible small effect. This is not a significant result, i. e., , but the test was two-tailed. A one-tailed test would be significant; however, this was outside our analysis plan. We had no priors on which directions we should expect a change. More so, our test is only sufficiently powered to identify moderate effects () with , and the effect size is most likely small. A much larger sample, e. g., with over participants, would be needed to properly test for small effects (), but this sample suggests that such a result could be the case in a larger evaluation.
| Factor | Est. | OR | Pr(>|z|) | |
|---|---|---|---|---|
| (Intercept) | -16.70 | 5.60E-08 | 0.986 | |
| 15.22 | 4.06E+06 | 0.988 | ||
| 15.63 | 6.11E+06 | 0.987 | ||
| 15.17 | 3.89E+06 | 0.988 | ||
| 13.35 | 6.28E+05 | 0.989 | ||
| Labeling difference | -0.19 | 8.29E-01 | 0.884 | |
| Decreasing concern | 1.11 | 3.02E+00 | 0.026 | * |
| 0.52 | 1.68E+00 | 0.247 | ||
| -0.51 | 6.02E-01 | 0.388 | ||
| -0.76 | 4.65E-01 | 0.203 | ||
| 0.29 | 1.34E+00 | 0.661 | ||
| -0.11 | 9.00E-01 | 0.824 | ||
| Has S.T.E.M major | 0.51 | 1.66E+00 | 0.307 | |
Signif. codes: ; ; ;
To complement the regression analysis of the level of concern, as described above, we calculated a similar logistic regression with an outcome variable for an increase in the benefit scale. The model in Table 4 shows symmetry with the prior regression as the only significant factor is “decreasing concern.” That is, participants who decrease their level of concern are roughly more likely to increase their perceived benefit rating, which mirrors the prior result where participants with an increase in benefit were more likely to decrease their concern.
These results complement the findings of our previous study (Farke et al., 2021), where we found significant increases in benefit paired with decreases in concern after participants viewed their own Google activities. Here, there is still a tight relationship between decreases in concern and increases in benefit, but overall shifts are weaker.
After completing the labeling task, participants were again asked (Q10_A) to explain why they changed or did not change their assessment of how often they benefit from the amount of information Google collects about them. Many participants () changed their perspective and increased their perceived benefit from data collection following the labeling task. Among these, common themes included improved search results (), product personalization (), better recommendations (), and more accurate targeted ads (). Participant P63, who changed from sometimes to often benefiting from Google’s data collection, said: “Google collects information and uses some of it to aid in my searches, narrow down searches, and provide information relevant to me.” P20 (sometimes to often) added, “I believe that Google understands what kind of person I am and what I want.”
Conversely, those five participants who became aware of fewer benefits of data collection after the labeling task cited targeted ads not being beneficial () and a lack of improvement in the experience of using Google search and products (). For instance, participant P174, who went from rarely down to never benefiting from Google’s data collection, replied, “I do not believe personalized ads are worth trading my personal information.” Moreover, participant P101 (sometimes to rarely) explained, “I changed my assessment here because I cannot recall any instance of the data shown being used to improve my internet user experience.”
Summary of RQ2 [Impact on Benefit/Concern]
We find a near-even split between participants who are concerned about Google’s data collection and those who are not. Participants described to benefit of personalized advertisements and better recommendations. Contrary to the results of our previous work (Farke et al., 2021), we have not observed any significant change in the level of concern or benefit before and after the labeling tasks, suggesting that connecting activities with implied interests better maintains prior perceptions.
4.3. RQ3: Reactions to Ad Interests
We asked the 133 participants with interests on their Ad Settings page additional questions regarding their concerns that Google applied these interests (Q11), the perceived benefit of “personalization” (Q12), and how accurate the labels are in representing them as an individual (Q13). The 37 participants without Ad Settings pages skipped this part of the survey.
Concerns of Ad Settings Interests
The results for the level of concern (Q11) are found in 4(a) and show a shift toward not at all. More than half of the participants are either slightly () or not at all concerned () after viewing their Google Ad Settings page. About a quarter of the participants () are still somewhat concerned. Another participants are moderately concerned, and only a minority of participants are extremely concerned. 5(a) shows that from question Q9 to Q11, both on concern, fewer participants () did not change their assessment. participants had disabled Google’s ad interests. Of the remaining participants, decreased their rating, and increased it.
Again, we performed two-tailed Wilcoxon signed-rank tests to determine if there were significant differences before and after viewing their Google-applied labels. These results are found in Table 2. While there was no significant change after the labeling tasks, viewing the true labels led to significant decreases in concern both from Q2 (; ) and Q9 (; ) compared to Q11. When viewing the true labels, which they viewed as more general and, at times, inaccurate (discussed below), their concern about how the advertising interests were assigned significantly dropped.
Participants provided short-answer responses about their change in concern (Q11_A). Many () responses included concerns about personal privacy regarding data collected by Google. Among these participants, concerns about the amount of information collected were common (). For instance, participant P24, who was moderately concerned about Google learning their interest highlighted: “They know a lot about me. I like the personalization aspects that come with them having that data, but I’m not sure if I’m completely ok with them knowing all that about me.” Participant P84 (extremely concerned) added: “The information shown was a lot of items collected about me.”
Concerns about Google selling data were again common (), such as P62, who reported being slightly concerned and said, “I am concerned that they may sell the data to companies that I don’t want to have it.” Furthermore, P119 (moderately concerned) felt that the Google user community is not being fairly compensated for the use of their data: “Again, it is the concept that Google and other giants tech companies don’t pay the community for the right to use their data. Make these companies pay data rents to the community on top of guaranteeing autonomy.” Seven participants were concerned about third-party access to their interests, such as when P19 said, “I am concerned that my interests could be shared elsewhere/with other parties, which may not be desirable.”
Another concern, mention by six participants, was the number of interests that Google learns, e.g., P93 (slightly concerned) reported: “I am just slightly concerned because of how many interests they have me tagged in. Kind of makes them know more than a friend that you talk to everyday would.”
Six participants were concerned about how much Google knows about them. P57 (extremely concerned) shared, “Yikes, like I said, they know everything about me.” Additionally, there were participants () who felt concerned about being tracked, such as P36 (slightly concerned), who illustrated, “I just don’t like having everything about me tracked. It’s really bizarre to someone who is 55 years old.”
Security concerns () were also described by participants who were worried about their data being misused () or released (). For instance, participant P59 (slightly concerned) shared, “It’s a little concerning just to have that much information concentrated in one place/on one platform, because you never know how it could be used or who could potentially access it.”
On the other hand, many () participants were unconcerned after viewing their Google-inferred ad interests and felt they were generic in nature (), and the fact that Google inferred this knowledge was low risk (). Like participant P68 (slightly concerned), who described: “If anything, I thought all the interests shown were much more generic than I previously thought. It doesn’t really reveal anything I’d consider personal.” Participant P145 (not at all concerned) replied, “I don’t care if they know my interests, I can’t see any harm coming from that.”
Many participants () found Google’s inferred interests to be inaccurate, leading to less concern. Participant P74, who was not at all concerned, illustrated: “Because a lot is so wrong it doesn’t matter. It’s an annoyance to have ‘targeted’ ads which are way off.”
Perceived Benefit of Ad Settings Interests
In the final frequency of benefit question (Q12), a smaller proportion of the participants () as compared to the first two questions Q3, Q10 stated to “sometimes” benefit from the interests Google is inferring from their activity (cf. 4(b)). One third of the participants thought that they “rarely” () or even “never” () benefit. The remaining participants stated to benefit either “often” () or “always” () from Google’s data collection. As shown in 5(b), of the participants did not change their benefit assessment from Q10 to Q12. Of the remaining people, a majority decreased (), and only participants increased their rating. Also, as mentioned before, did not answer this question. And, as shown in Table 2, there was no significant change for Q12. Likely, participants already solidified their view on the benefits of the advertising interests, and viewing their true labels only confirmed their priors.
In explaining their change (or lack thereof) of benefit (Q12_A), many () described benefits around the idea that Google learns their interests. Among these participants, a common concept () was the better recommendations that they received when using Google products and services. According to participant P76, who sometimes benefits, “Knowing more about me can influence the recommendations I’m given which impacts my user experience positively.” Another common idea () was a more personalized experience when using Google products and services, such as when P164 (sometimes) said, “Sometimes relevant products, ads, and websites are presented, and that’s beneficial to me and helps make my internet experience more personalized.” Some () participant responses included the benefits of targeted advertising. For instance, P68 (sometimes) noted, “I think the interests were mostly correct, so I like having ads tailored to me.” Others () mentioned they benefit from improved Google search results. For example, participant P63 (often) explained, “Google’s learning helps them to cater searches and information to my needs, makes everything more relevant.” Seven participants noted improvements in their YouTube experience, such as participant P14 (often), who replied, “Google learning about my interests helps me to get YouTube videos and websites recommended to me based on my interests so that I know I’ll always like what is recommended to me.”
Conversely, participants reported little or no benefits from Google learning their interests. Common themes included a dislike for personalized ads (), and Google learning interests was unhelpful (). For instance, P17 (never) said, “I do not benefit from google learning my interests, I do not need them to help me find things to buy.” And P72 (rarely) added, “I don’t see this as being beneficial in terms of what it can offer.”
Perceived Accuracy of Ad Settings Interests
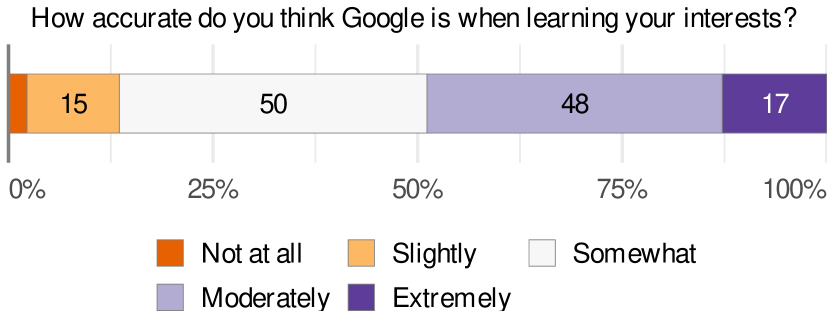
Participants were asked (Q13 and Q13_A) to assess and explain how accurate they viewed Google’s assigned interests. The results of Q13, presented in Figure 6, suggest that most participants consider their Ad Settings interests to be accurate. Of the participants who had Ad Settings enabled, stated that the interests were “moderately” or “extremely” accurate. Another participants were more ambivalent about the accuracy with a “somewhat” rating, and participants stated that the interests are “slightly” accurate. Only a minority of three participants found the interest applied to their accounts to be “not at all” accurate.
Still, participants explained that Google had some incorrect inferences. Among these participants, some complained about the interests being based on one-time-activities or searches, such as when P29, who rated the interests as somewhat accurate, described: “Some of my searches are specific while others are just one time events and sometime a search I do for someone else. Google can’t tell the difference and therefore never leverages any info collected in any way meaningful to me.” Other examples were given by participants, such as P51 (somewhat accurate), who recalled, “There were things listed, like Anime and Bread Makers, that I’ve never looked at before.” participants reported that their Ad Settings page had many incorrect inferences, such as P157 (not at all accurate), who complained about out-of-date interests, “These collections are all old, I have moved on.”
In contrast, participants reported that many of their interests were accurate, and participants even said most were accurate. For instance, P57, who found the interests to be extremely accurate, exclaimed, “Because I use them for everything, they know more about me than I know about myself, and that’s not a joke.” Participant P101 (moderately accurate) was able to connect the dots from Google’s inferred interests back to past online activities when they explained: “The interests that Google identified as my interests were very accurate and I am able to assume that they have concluded these as my interests directly through my interactions with the internet.” This theme was also reflected in participant P85’s response, “I think Google picks up on things I search a lot and places I shop and dine at so Google knows me better than I thought.” Another participants found only some of the interests to be correct, like P24 (moderately accurate), who shared, “There are a few things that are off, but overall, it’s a lot more accurate than I expected.” Three participants even found the interests to accurately reflect their personality, e.g., P32 (extremely accurate) said, “I saw so many corners of my personality and identity in the listed categories.”
Summary of RQ3 [Reactions to Ad Interests]
Overall, participants found the interests applied by Google to be accurate, with some exceptions. In contrast to the labeling task, we find that viewing the labels that Google applied significantly decreased participants’ concern, mainly because participants perceived the labels to be too generic or that they were low-risk labels or inaccurate.
5. Discussion
In this paper, we evaluated the impact of “connecting the dots” of the data food chain by asking participants to supply their own advertising labels to their own real online activities. Through our study, we got the following answers to our research questions:
-
RQ1
[Understanding of Ad Interests] Participants applied interests to their own activities differently than Google, mostly being either too generic or overly specific.
-
RQ2
[Impact on Benefit/Concern] We found no significant shifts in concern or benefit before and after the labeling task.
-
RQ3
[Reactions to Ad Interests] Viewing their true ad interest, as assigned by Google, causes a significant decrease in participants’ concerns. The interests are accurate but perceived as generic and low risk, contributing to the decrease of concern.
The strongest insight gained is the potential to build next-generation privacy dashboards that both provide users the ability to actively manage their data collection and also access to how that data may be used, such is in the behavioral advertising ecosystem. Such a system has the potential to better maintain priors of concern and benefit expectations, as opposed to existing dashboards, which just display raw information, that has been shown to reduce concern and increase perceived benefit (Farke et al., 2021). After the labeling task, participants expressed what labels they believe Google would apply given their activities, their priors were reinforced: a) If they were concerned about data collection, they remained concerned, or b) if they were unconcerned, they remained unconcerned.
However, there is a potentially large shortcoming when moving to such a new privacy dashboard design due to the mismatched expectations in the specificity of the advertising labels that users imagine, compared to the rather generic labels used by advertisers. We refer to this phenomenon as the generic paradox, and the impact was that after participants viewed their actual labels on Google’s Ad Settings page, the results reverted back to be in line with our previous study (Farke et al., 2021), we observed a large decrease in concern and a moderate increase in benefits. It is critical that new interfaces both connect the dots of data collection and provide important context to counteract the generic paradox. One design direction is to build interfaces that help users moderate their expectations and better explain how the collected data will be used to generate actionable insights and profiles, as well as to demonstrate how even seemingly low-risk generic labels can actually be combined to unique identifiers that can lead to abuse.
In the rest of this section, we explore this theme and other insights gained from this research and how they generally apply to the current online behavioral advertising ecosystem.
Methodological Shift Compared to Prior Work
Our prior work (Farke et al., 2021) performed a pre-post study design with an intervention that had people interact directly with the activities that Google collected about them via the Google My Activity dashboard. At the time, we found both a significant decrease in participants’ concern and an increase in benefit from Google’s data collection. The study in this work has a similar pre-post study design. However, the intervention goes to a higher order of data processing and asks participants to reason, by completing a labeling task, about how Google uses their collected activities to infer information about them via ad interests. This methodological shift of the intervention also led to a shift in concern and benefit findings. The results show a stable pre-post concern rating and a minor increase in benefit. The more modest increase in benefit could be the result of the intervention where the focus is on the benefits of behavioral advertising (seen as less beneficial) than when considering activity history, which reminds individuals of the quality of Google services, such as YouTube and Google Search.
According to our previous study (Farke et al., 2021), the significant reduction in concern after viewing the My Activity page was partly due to the sense of control over the collected data. In contrast, at the time we conducted the study described in this paper, Google’s Ad Settings page offered close to no opportunities to customize, manage, and understand inferred ad interests. The decrease in concern we observed with participants viewing their interests could be attributed to a lack of perceived risk posed by the interests. For example, many participants indicated that even though the labels were accurate, they were generic and less specific than they feared. Google has since revised the dashboard—now called My Ad Center (myadcenter.google.com) (Google, Inc., 2022)—in an effort to make it more useful for managing interests.
Still, there is an unresolved question of the best strategy for assisting people in managing the data collected about them and how that data is used. Providing additional controls via data dashboards eases concerns and helps to demonstrate the benefit of data collection, but it still may not fully explain why such controls should be used or raise awareness about the associated risks. In some ways, these results suggest that a better explanation of data flows can help expose people and reinforce existing concerns, but future work is needed to fully understand how to properly present such data collection mechanisms and processing in a data dashboard.
The Generic Paradox
According to our qualitative findings, participants were commonly unconcerned or became less concerned about Google’s data collection because their inferred ad interests were generic. For instance, the ad interest “Apparel” could apply to anyone with clothing-related activities so this interest could be applied to many people. However, given the fact that participants had a median of 180 inferred interests and that almost half of them reported that the interests were extremely or moderately accurate, it is important to consider what happens when numerous discrete generic (but accurate) pieces of information are combined to form a more complete and precise picture of an individual. Paradoxically, by focusing on the generic quality of individual interests and not on the volume and accuracy of those interests, people will be less likely to manage or remove their interests and will be more likely to allow Google to continue collecting data about their online activities. A recent study by Reitinger et al. (Reitinger et al., 2023) found that while many of their participants shared general topics (“Shopping”), a lot of interests were unique to each participant and highly individualized. Furthermore, it only takes 33 bits of entropy to identify an individual uniquely among the world’s population (Narayanan and Shmatikov, 2008), and de-anonymization attack techniques have been successful in targeted advertisements (Korolova, 2010; Venkatadri et al., 2018), and in many other domains (Zang and Bolot, 2011; De Montjoye et al., 2015; Caliskan et al., 2018).
People’s Understanding of Inferencing
Prior work on ad inferencing suggests that people base their understanding on direct, one-to-one connections between past online behaviors and inferred interests (Rader et al., 2020). Few understand the abilities of machine learning to aggregate data from millions of individuals to create detailed personal inferences (Warshaw et al., 2016). For instance, if a person searches for “pants,” they simply connect that with the ad interest “Apparel,” while few take the extra step to match “lawnmower” with “Homeownership Status: Homeowners.” Our findings show that people have misconceptions when assigning ad interests based on their past online activities, often because they are too literal and overly specific, such as naming specific brands and exact locations. The actual Google ad interests, on the other hand, tend to focus on grouping peoples’ interests into broad categories, with the goal to appeal to a wide range of advertisers thereby increasing Google’s revenue. Qualitative data suggests that participants understood that interests are inferred from their interactions with Google products, but little understanding exists about how those interactions are combined with other data.
The Data Food Chain
The metaphor of a data food chain (Nissenbaum, 2019) helps to expose the information hierarchy in which data of a higher order (i. e., ad interests) is a function of data of a lower order (i. e., activities). For instance, the inferred ad interest Sports Cars might be a function of the YouTube activity where a person watched a video of a “2022 Mazda CX-30,” combined with other lower-order data such as location, past searches, and the inferred interests of other people on Google with similar activity profiles. This data aggregation raises the question of whether consent to data collection can be meaningful, informed, and explicit when privacy disclosure mechanisms such as privacy policies provide transparency primarily regarding lower-order data collection but limited transparency regarding what, how, and why higher-order data is derived. Compounded by the fact that people do not fully understand what is inferred about them, as is evidenced by our findings that participants self-assigning interests differently, this questions the usefulness of privacy notices in the context of higher-order data processing. In a report filed in the U.S. Department of Justice anti-trust complaint against Google (of Justice, 2022), privacy expert Martin argues that “certain uses of Google search profile data for the purpose of returning personalized advertising would constitute a ‘non-contextual, secondary’ data use that would violate users’ privacy expectations.”
A Lack of Alternatives
When participants were asked which other products (than Gmail) they would use (S3), we observed Google’s products and services dominating. In our biased sample of Google account owners we considered in our analysis, Chrome was used by 168, YouTube by 167, Gmail by 164, Google Maps by 151, and Google Search by 148, emphasizing Google’s profound impact on the Web. Since Google’s primary source of revenue is advertising, and the current business model of targeted advertising is based on collecting an ever-increasing amount of behavioral data, it is incumbent that people spend more and more time engaged with their products and services. With all these services, a free Google account adds enormous value. P207 said, “Google provides many conveniences to me as an Internet user.” These conveniences, unfortunately, force people to make a trade-off between their privacy and the products they have come to rely on and make competition hard to come by. As P131 summarized, “I still value some Google products over their competition so I compromise on the collection of my activity information.”
My Ad Center Design Changes
Google revised Ad Settings in November 2022 to provide more “transparency and control” (Google, Inc., 2022). In comparison to Ad Settings, the new dashboard lists fewer interests, now called “topics” (“Jewelry”), and introduces a new tab for managing “brands” (“Amazon”), as well as demographic and aggregated interests, now called “categories” (“Homeownership Status”). With the new dashboard, users have better control over the number of ads that are based on a certain topic by liking or disliking the topic. Unfortunately, this design change can only make ads more relevant but does not improve users’ privacy. An interesting design change is the new “recent ads” section, where Google itself has started connecting advertisements with interests. Here, for every ad they have seen, users can check which topic an advertiser used for segmenting and targeting them. Exploring if this new design impacts perceived benefits or concerns, as well as if it encourages users to take more actions in managing their privacy online, would be a fruitful area of future research.
References
- (1)
- Amazon (2023) Amazon. 2023. Amazon Ad Preferences. https://www.amazon.com/adprefs, as of .
- Andreou et al. (2019) Athanasios Andreou, Márcio Silva, Fabrício Benevenuto, Oana Goga, Patrick Loiseau, and Alan Mislove. 2019. Measuring the Facebook Advertising Ecosystem. In Symposium on Network and Distributed System Security (NDSS ’19). ISOC, San Diego, California, USA.
- Barbosa et al. (2021) Natã M. Barbosa, Gang Wang, Blase Ur, and Yang Wang. 2021. Who Am I? A Design Probe Exploring Real-Time Transparency about Online and Offline User Profiling Underlying Targeted Ads. In ACM Conference on Pervasive and Ubiquitous Computing (UbiComp ’21). ACM, Virtual Conference, 88:1–88:32.
- Bashir et al. (2019) Muhammad Ahmad Bashir, Umar Farooq, Maryam Shahid, Muhammad Fareed Zaffar, and Christo Wilson. 2019. Quantity vs. Quality: Evaluating User Interest Profiles Using Ad Preference Managers. In Symposium on Network and Distributed System Security (NDSS ’19). ISOC, San Diego, California, USA.
- Bateman et al. (2012) Scott Bateman, Jaime Teevan, and Ryen W. White. 2012. The Search Dashboard: How Reflection and Comparison Impact Search Behavior. In ACM Conference on Human Factors in Computing Systems (CHI ’12). ACM, Austin, Texas, USA, 1785–1794.
- Caliskan et al. (2018) Aylin Caliskan, Fabian Yamaguchi, Edwin Dauber, Richard E. Harang, Konrad Rieck, Rachel Greenstadt, and Arvind Narayanan. 2018. When Coding Style Survives Compilation: De-anonymizing Programmers from Executable Binaries. In Symposium on Network and Distributed System Security (NDSS ’18). ISOC, San Diego, California, USA.
- Chanchary and Chiasson (2015) Farah Chanchary and Sonia Chiasson. 2015. User Perceptions of Sharing, Advertising, and Tracking. In Symposium on Usable Privacy and Security (SOUPS ’15). USENIX, Ottawa, Canada, 53–67.
- Datta et al. (2015) Amit Datta, Michael Carl Tschantz, and Anupam Datta. 2015. Automated Experiments on Ad Privacy Settings. In Privacy Enhancing Technologies Symposium (PETS ’15). Sciendo, Philadelphia, Pennsylvania, USA, 92–112.
- De Montjoye et al. (2015) Yves-Alexandre De Montjoye, Laura Radaelli, Vivek Kumar Singh, and Alex “Sandy” Pentland. 2015. Unique in the Shopping Mall: On the Reidentifiability of Credit Card Metadata. Science 347, 6221 (Jan. 2015), 536–539.
- Dolin et al. (2018) Claire Dolin, Ben Weinshel, Shawn Shan, Chang Min Hahn, Euirim Choi, Michelle L. Mazurek, and Blase Ur. 2018. Unpacking Perceptions of Data-Driven Inferences Underlying Online Targeting and Personalization. In ACM Conference on Human Factors in Computing Systems (CHI ’18). ACM, Montreal, Quebec, Canada, 493:1–493:12.
- Farke et al. (2021) Florian M. Farke, David G. Balash, Maximilian Golla, Markus Dürmuth, and Adam J. Aviv. 2021. Are Privacy Dashboards Good for End Users? Evaluating User Perceptions and Reactions to Google’s My Activity. In USENIX Security Symposium (SSYM ’21). USENIX, Virtual Conference, 483–500.
- Fischer-Hübner et al. (2016) Simone Fischer-Hübner, Julio Angulo, Farzaneh Karegar, and Tobias Pulls. 2016. Transparency, Privacy and Trust – Technology for Tracking and Controlling My Data Disclosures: Does This Work?. In IFIP International Conference on Trust Management (IFIP TM ’16). IFIP, Darmstadt, Germany, 3–14.
- Fleck and Fitzpatrick (2010) Rowanne Fleck and Geraldine Fitzpatrick. 2010. Reflecting on Reflection: Framing a Design Landscape. In Australian Conference on Human-Computer Interaction (OZCHI ’10). ACM, Brisbane, Australia, 216–223.
- Google, Inc. (2020) Google, Inc. 2020. How to Personalize the Ads You See on YouTube and Google. https://www.youtube.com/watch?v=hdBTv1x7iLk, as of .
- Google, Inc. (2021) Google, Inc. 2021. AdWords API (Deprecated): Verticals. https://developers.google.com/adwords/api/docs/appendix/verticals, as of .
- Google, Inc. (2022) Google, Inc. 2022. Google My Ad Center: What is My Ad Center? https://support.google.com/My-Ad-Center-Help/answer/12155154, as of .
- Herder and van Maaren (2020) Eelco Herder and Olaf van Maaren. 2020. Privacy Dashboards: The Impact of the Type of Personal Data and User Control on Trust and Perceived Risk. In ACM Conference on User Modeling, Adaptation and Personalization (UMAP ’20). ACM, Virtual Conference, 169–174.
- Korolova (2010) Aleksandra Korolova. 2010. Privacy Violations Using Microtargeted Ads: A Case Study. In IEEE International Conference on Data Mining Workshops (ICDMW ’10). IEEE, Sydney, New South Wales, Australia, 474–482.
- LinkedIn Corporation (2023) LinkedIn Corporation. 2023. LinkedIn Ad Preferences. https://www.linkedin.com/psettings/advertising, as of .
- Meta (2023) Meta. 2023. Facebook Ad Preferences. https://www.facebook.com/adpreferences, as of .
- Microsoft Corporation (2023) Microsoft Corporation. 2023. Microsoft Ad Preferences. https://account.microsoft.com/privacy/ad-settings, as of .
- Narayanan and Shmatikov (2008) Arvind Narayanan and Vitaly Shmatikov. 2008. Robust De-Anonymization of Large Sparse Datasets. In IEEE Symposium on Security and Privacy (SP ’08). IEEE, Oakland, California, USA, 111–125.
- Nissenbaum (2019) Helen Nissenbaum. 2019. Contextual Integrity Up and Down the Data Food Chain. Theoretical Inquiries in Law 20, 1 (Jan. 2019), 221–256.
- of Justice (2022) U.S.Department of Justice. 2022. United States of America v. Google LLC (1:20-Cv-03010): Document 398. https://www.courtlistener.com/docket/18552824/united-states-of-america-v-google-llc/, as of .
- Pierce (2020) David Pierce. 2020. Google’s New Magic Number for Storing Personal Data: 18 Months. https://www.protocol.com/google-delete-data-18-months, as of .
- Prolific, Academic Ltd. (2022) Prolific, Academic Ltd. 2022. A Higher Standard of Online Research. https://www.prolific.co, as of .
- Rader (2014) Emilee Rader. 2014. Awareness of Behavioral Tracking and Information Privacy Concern in Facebook and Google. In Symposium on Usable Privacy and Security (SOUPS ’14). USENIX, Menlo Park, California, USA, 51–67.
- Rader et al. (2020) Emilee Rader, Samantha Hautea, and Anjali Munasinghe. 2020. “I Have a Narrow Thought Process”: Constraints on Explanations Connecting Inferences and Self-Perceptions. In Symposium on Usable Privacy and Security (SOUPS ’20). USENIX, Virtual Conference, 457–488.
- Raschke et al. (2017) Philip Raschke, Axel Küpper, Olha Drozd, and Sabrina Kirrane. 2017. Designing a GDPR-Compliant and Usable Privacy Dashboard. In IFIP International Summer School on Privacy and Identity Management (IFIP SC ’17). IFIP, Ispra, Italy, 221–236.
- Redmiles et al. (2019) Elissa M. Redmiles, Sean Kross, and Michelle L. Mazurek. 2019. How Well Do My Results Generalize? Comparing Security and Privacy Survey Results from MTurk, Web, and Telephone Samples. In IEEE Symposium on Security and Privacy (SP ’19). IEEE, San Francisco, California, USA, 227–244.
- Reitinger et al. (2023) Nathan Reitinger, Bruce Wen, Michelle L. Mazurek, and Blase Ur. 2023. Analysis of Google Ads Settings Over Time: Updated, Individualized, Accurate, and Filtereds. In Workshop on Privacy in the Electronic Society (WPES ’23). ACM, Copenhagen, Denmark, 167–172.
- Sabir et al. (2022) Aafaq Sabir, Evan Lafontaine, and Anupam Das. 2022. Analyzing the Impact and Accuracy of Facebook Activity on Facebook’s Ad-Interest Inference Process. In ACM Conference on Computer-Supported Cooperative Work and Social Computing (CSCW ’22). ACM, Virtual Conference, 76:1–76:34.
- Tang et al. (2022) Jenny Tang, Eleanor Birrell, and Ada Lerner. 2022. Replication: How Well Do My Results Generalize Now? The External Validity of Online Privacy and Security Surveys. In Symposium on Usable Privacy and Security (SOUPS ’22). USENIX, Boston, Massachusetts, USA, 367–385.
- Tschantz et al. (2018) Michael Carl Tschantz, Serge Egelman, Jaeyoung Choi, Nicholas Weaver, and Gerald Friedland. 2018. The Accuracy of the Demographic Inferences Shown on Google’s Ad Settings. In Workshop on Privacy in the Electronic Society (WPES ’18). ACM, Toronto, Canada, 33–41.
- Ur et al. (2012) Blase Ur, Pedro Giovanni Leon, Lorrie Faith Cranor, Richard Shay, and Yang Wang. 2012. Smart, Useful, Scary, Creepy: Perceptions of Online Behavioral Advertising. In Symposium on Usable Privacy and Security (SOUPS ’12). ACM, Washington, D.C., USA, 4:1–4:15.
- Venkatadri et al. (2018) Giridhari Venkatadri, Athanasios Andreou, Yabing Liu, Alan Mislove, Krishna P. Gummadi, Patrick Loiseau, and Oana Goga. 2018. Privacy Risks with Facebook’s PII-Based Targeting: Auditing a Data Broker’s Advertising Interface. In IEEE Symposium on Security and Privacy (SP ’18). IEEE, San Francisco, California, USA, 89–107.
- Warshaw et al. (2016) Jeffrey Warshaw, Nina Taft, and Allison Woodruff. 2016. Intuitions, Analytics, and Killing Ants: Inference Literacy of High School-Educated Adults in the US. In Symposium on Usable Privacy and Security (SOUPS ’16). USENIX, Denver, Colorado, USA, 271–285.
- Wei et al. (2020) Miranda Wei, Madison Stamos, Sophie Veys, Nathan Reitinger, Justin Goodman, Margot Herman, Dorota Filipczuk, Ben Weinshel, Michelle L. Mazurek, and Blase Ur. 2020. What Twitter Knows: Characterizing Ad Targeting Practices, User Perceptions, and Ad Explanations Through Users’ Own Twitter Data. In USENIX Security Symposium (SSYM ’20). USENIX, Virtual Conference, 145–162.
- Weinshel et al. (2019) Ben Weinshel, Miranda Wei, Mainack Mondal, Euirim Choi, Shawn Shan, Claire Dolin, Michelle L. Mazurek, and Blase Ur. 2019. Oh, the Places You’ve Been! User Reactions to Longitudinal Transparency About Third-Party Web Tracking and Inferencing. In ACM Conference on Computer and Communications Security (CCS ’19). ACM, London, United Kingdom, 149–166.
- Wills and Tatar (2012) Craig E. Wills and Can Tatar. 2012. Understanding What They Do with What They Know. In Workshop on Privacy in the Electronic Society (WPES ’12). ACM, Raleigh, North Carolina, USA, 13–18.
- X Corporation (2023) X Corporation. 2023. Twitter Ad Preferences. https://twitter.com/settings/ads_preferences, as of .
- Zang and Bolot (2011) Hui Zang and Jean Bolot. 2011. Anonymization of Location Data Does Not Work: A Large-Scale Measurement Study. In International Conference on Mobile Computing and Networking (MobiCom ’11). ACM, Las Vegas, Nevada, USA, 145–156.
- Zimmermann et al. (2014) Christian Zimmermann, Rafael Accorsi, and Günter Müller. 2014. Privacy Dashboards: Reconciling Data-Driven Business Models and Privacy. In IEEE Conference on Availability, Reliability and Security (ARES ’14). IEEE, Fribourg, Switzerland, 152–157.
Appendix A Appendix
A.1. Survey Instrument
Thank you for your interest in our survey. Your answers are important to us. Please read the following instructions carefully:
[A horizontal rule, like below, indicates a new page in the questionnaire.]
-
S1
Do you have a personal Gmail address (an email address ending in “gmail.com”)?
-
Yes
-
No
-
-
S2
How long do you have that Gmail address?
-
Less than a year
-
One year
-
Three years
-
Five years
-
More than five years
-
I do not have a Gmail address
-
Unsure
-
-
S3
Which other Google products do you currently use? (Select all that apply.)
-
Gmail
-
Google Maps
-
YouTube
-
Google Chrome
-
Google Search
-
Google Play
-
Google Drive
-
Google News
-
Google Pay
-
Android device
-
None of these
-
-
S4
How frequently do you use these products? [Included only products selected in S3. If “None of these” was selected question was hidden.]
Always Often Sometimes Rarely Never Unsure Gmail Google Maps YoutTube Google Chrome Google Search Google Play Google Drive Google News Google Pay Android device -
S5
How important is using Google products to your Internet experience?
-
Not important
-
Slightly important
-
Moderately important
-
Important
-
Very important
-
Please Install the “Survey Assistant” Extension
On this page, we will ask you to install our browser extension, which will assist you during the study. The installation takes only a few steps. Please follow the instructions below. We will assist you to uninstall the browser extension at the end of the survey.
Google Sign-in
This survey also requires that you login to your primary Google account for accessing items in your My Activity and Ad Settings page. My Activity and Ad Settings are services provided by Google to make you see more useful ads and offer a more personalized experience, including faster searches and automatic recommendations. Please use an account with an email address that ends in @gmail.com.
Privacy Note: We do not track or store your email address as part of this study, and we will not be able to tie your email address to any results or analysis. The researchers will never see your email address. At no time do the researchers have access to your Google account.
-
Q1
How aware are you of the amount of information that Google is collecting about your activities online?
-
Not at all aware
-
Slightly aware
-
Somewhat aware
-
Moderately aware
-
Extremely aware
-
-
Q2
How concerned are you with the amount of information Google is collecting about your activities online?
-
Not at all concerned
-
Slightly concerned
-
Somewhat concerned
-
Moderately concerned
-
Extremely concerned
-
Q2_A
Please explain why.
-
Answer:
-
Answer:
-
-
Q3
How often do you benefit from the amount of information that Google collects about your activities online?
-
Never
-
Rarely
-
Sometimes
-
Often
-
Always
-
Q3_A
Please explain why.
-
Answer:
-
Answer:
-
What is Google Ad Settings
The following video briefly introduces you to Google’s Ad Settings page. For every account, Google provides a settings page called Ad Settings, which allows you to control whether and how personalized ads are shown to you. Please watch this 1-minute video before proceeding:
[YouTube video describing Google’s Ad Settings.]
![[Uncaptioned image]](/html/2312.13813/assets/screenshots/manage-ad-settings.png)
Prepare Survey
Please click the “Prepare Survey” button to proceed to the next page.
[Interactive checklist, which visualized the progress of gathering data from the My Activity and Ad Settings page.]
-
•
Check for browser extension
-
•
Check for ad interests (Number of found interests)
-
•
Check for Google Search activities (Number of found Google Search activities)
-
•
Check for YouTube activities (Number of found YouTube activities)
-
•
Check for Google Maps activities (Number of found Google Maps)
Task Instructions
Next, we will ask you to assign at least 3 interests you think Google will learn from the shown activity, which we randomly selected from your Google My Activity page. This task is repeated with up to 9 different activities.
Note: We will store your assigned interests and activities. Please make sure to only assign interests to activities you feel comfortable sharing with us. You can skip any activity by clicking “Skip this Activity.”
Before we start, let us explain how you can assign these interests on the next page.
Task Demo
[Interactive tutorial of the Labeling Task user interface.]
-
(1)
The Activity: On the next page, you will be presented with one of your activities picked from your Google My Activity page.
-
(2)
Skipping an Activity: If you feel uncomfortable with the shown activity you can skip the activity by pressing this button.
-
(3)
Reason for Skipping: If you choose to skip, please select why you do not like to assign an interest and share the activity with us.
-
(4)
Assign an Interest: To assign an interest you think Google will learn from the shown activity above, use this text box to enter your idea.
-
(5)
List of Interests: While you type, we will display some suggestions that Google typically applies. You can select one by clicking on it.
-
(6)
Selected Interests: Your selected interests will be displayed in the text box and can be removed by pressing on the “X” icon.
-
(7)
Custom Interests: If no suggestion fits your idea, you can also enter your own interests.
-
(8)
Add Custom Interest: To add a custom interest, please press the plus button or the “Enter” key on your keyboard.
-
(9)
Finished: To start your assignment task, please click the Next button to proceed to the next page.
Labeling Tasks
In the next part, we will ask you questions about nine activities from your My Activity page. The activities are chosen randomly. We do not collect information about that activity as part of this survey. That information remains private, only accessible to you and Google. We only note which service the activity is associated with, e. g., “Google search” vs. “YouTube view,” and the date on which it occurred. Further details are not collected as part of this survey.
![[Uncaptioned image]](/html/2312.13813/assets/screenshots/matching-game.png)
-
I
Seeing the activity above, what interests do you think Google would apply to it?
[This question was repeated up to 9 times for different services and time periods.]
Now that you have worked with activities and interests, we would like to repeat some of the questions from the beginning of the survey.
-
Q9
How concerned are you with the amount of information Google is collecting about your activities online?
-
Not at all concerned
-
Slightly concerned
-
Somewhat concerned
-
Moderately concerned
-
Extremely concerned
-
Q9_A
Please explain why you changed or not changed your assessment.
-
Answer:
-
Answer:
-
-
Q10
How often do you benefit from the amount of information that Google collects about your activities online?
-
Never
-
Rarely
-
Sometimes
-
Often
-
Always
-
Q10_A
Please explain why you changed or not changed your assessment.
-
Answer:
-
Answer:
-
Google Ad Settings
Next, we will show you the interests from your Google Ad Settings page. These interests are assigned to your account by Google.
Note: Please take your time to look through the interests. You may proceed to the next page after 30 seconds.
Presentation of Interests
[Participants were presented with the interest from their Ad Settings page.]
![[Uncaptioned image]](/html/2312.13813/assets/screenshots/adssettings-survey-screenshot.png)
-
Q11
How concerned are you about Google learning about your interests based on your activities online?
-
Not at all concerned
-
Slightly concerned
-
Somewhat concerned
-
Moderately concerned
-
Extremely concerned
-
Q11_A
Please explain why.
-
Answer:
-
Answer:
-
-
Q12
How often do you benefit from Google learning your interests based on your activities online?
-
Never
-
Rarely
-
Sometimes
-
Often
-
Always
-
Q12_A
Please explain why.
-
Answer:
-
Answer:
-
-
Q13
How accurate do you think Google is when learning your interests?
-
Not at all accurate
-
Slightly accurate
-
Somewhat accurate
-
Moderately accurate
-
Extremely accurate
-
Q13_A
Please explain why.
-
Answer:
-
Answer:
-
-
D1
What is your gender?
-
Woman
-
Man
-
Non-binary
-
Prefer not to disclose
-
Prefer to self-describe
-
-
D2
What is your age?
-
18 – 24
-
25 – 34
-
35 – 44
-
45 – 54
-
55 – 64
-
65 or older
-
Prefer not to disclose
-
-
D3
Are you of Hispanic, Latino, or Spanish origin?
-
No, not of Hispanic, Latino, or Spanish origin
-
Yes, Mexican, Mexican Am., Chicano
-
Yes, Puerto Rican
-
Yes, Cuban
-
Yes, another Hispanic, Latino, or Spanish origin
-
•
Type, for example, Salvadoran, Dominican, Colombian, Guatemalan, Spaniard, Ecuadorian, etc.:
-
•
-
-
D4
What is your race?
-
White
-
Black or African American
-
American Indian or Alaskan Native
-
Chinese
-
Filipino
-
Asian Indian
-
Vietnamese
-
Korean
-
Japanese
-
Other Asian
-
Native Hawaiian
-
Samoan
-
Chamorro
-
Other Pacific Islander
-
-
D5
Which of these describes your personal income last year?
-
No income
-
$1 to $9,999
-
$10,000 to $24,999
-
$25,000 to $49,999
-
$50,000 to $74,999
-
$75,000 to $99,999
-
$100,000 to $149,999
-
$150,000 and greater
-
Prefer not to disclose
-
-
D6
What is the highest degree or level of school you have completed?
-
No schooling completed
-
Some high school, no diploma
-
High school graduate, diploma, or equivalent
-
Some college credit, no degree
-
Trade/technical/vocational training
-
Associate degree
-
Bachelor’s degree
-
Master’s degree
-
Professional degree (e. g., J.D., M.D.)
-
Doctorate degree
-
Prefer not to disclose
-
Other (please specify)
-
-
D7
Do you have a major in one of the following fields?
-
S.T.E.M.
-
Humanities
-
Law
-
Social science
-
Prefer not to disclose
-
Other (please specify)
-
-
D8
What is your marital status?
-
Married
-
Living as married
-
Divorced
-
Widowed
-
Separated
-
Single, never been married
-
Prefer not to disclose
-
Prefer to self-describe
-
-
D9
How many children do you have?
-
0
-
1
-
2–4
-
4+
-
Prefer not to disclose
-
-
D10
Which of the following best represents how you think of yourself?
-
Lesbian or gay
-
Straight, that is, not lesbian or gay
-
Bisexual
-
Something else
-
I don’t know the answer
-
Prefer not to disclose
-
Prefer to self-describe
-
A.2. Tables
| Completed | Eligible | ||||
|---|---|---|---|---|---|
| (n = ) | (n = ) | ||||
| n | % | n | % | ||
| Gender | Man | 130 | 55 | 98 | 58 |
| Woman | 94 | 40 | 67 | 39 | |
| Non-binary | 6 | 3 | 4 | 2 | |
| Preferred not to answer | 5 | 2 | 1 | 1 | |
| Age | 18–24 | 21 | 9 | 16 | 9 |
| 25–34 | 77 | 33 | 61 | 36 | |
| 35–44 | 60 | 25 | 46 | 27 | |
| 45–54 | 32 | 14 | 22 | 13 | |
| 55–64 | 30 | 13 | 19 | 11 | |
| 65 or older | 9 | 4 | 5 | 3 | |
| Preferred not to answer | 6 | 2 | 1 | 1 | |
| Education | Bachelor’s degree | 91 | 39 | 61 | 36 |
| Some college credit, no degree | 45 | 19 | 39 | 23 | |
| High school diploma, or equivalent | 28 | 12 | 21 | 12 | |
| Associate degree | 26 | 11 | 21 | 12 | |
| Master’s degree | 19 | 8 | 12 | 7 | |
| Trade / technical / vocational training | 7 | 3 | 4 | 2 | |
| Doctorate degree | 6 | 2 | 5 | 3 | |
| Some high school, no diploma | 4 | 2 | 3 | 2 | |
| Professional degree (e. g., J.D., M.D.) | 3 | 1 | 2 | 1 | |
| Preferred not to answer | 6 | 3 | 2 | 1 | |
| Income | No income | 6 | 3 | 4 | 2 |
| ] to ] | 30 | 13 | 24 | 14 | |
| ] to ] | 35 | 15 | 27 | 16 | |
| ] to ] | 59 | 25 | 43 | 25 | |
| ] to ] | 38 | 16 | 24 | 14 | |
| ] to ] | 27 | 11 | 22 | 13 | |
| ] to ] | 19 | 8 | 14 | 8 | |
| ] and greater | 8 | 3 | 4 | 2 | |
| Preferred not to answer | 13 | 6 | 8 | 5 | |
| # | Topic | Interest | n | % |
|---|---|---|---|---|
| 1 | Shopping | Shopping | 125 | 94 |
| 2 | Business & Industrial | Business Services | 123 | 92 |
| 2 | Games | Computer & Video Games | 123 | 92 |
| 3 | News | News | 122 | 92 |
| 3 | Travel & Transportation | Travel & Transportation | 122 | 92 |
| 4 | Computers & Electronics | Computers & Electronics | 120 | 90 |
| 4 | Online Communities | Social Networks | 120 | 90 |
| 5 | Books & Literature | Books & Literature | 119 | 89 |
| 5 | Food & Drink | Cooking & Recipes | 119 | 89 |
| 6 | Arts & Entertainment | Comics & Animation | 118 | 89 |
| 6 | Food & Drink | Restaurants | 118 | 89 |
| 7 | Internet & Telecom | Mobile Phones | 117 | 88 |
| 8 | Sports | Sports | 115 | 86 |
| 9 | Shopping | Apparel | 113 | 85 |
| 9 | Shopping | Flowers | 113 | 85 |
| 10 | Arts & Entertainment | Celebrities & Entertainment News | 112 | 84 |
| Demographic | Advertiser | Aggregated | Activity | YTC |
|---|---|---|---|---|
| 25-34 years old | Best Buy | Company Size: Small Employer (1-249 E.) | American Football | A video from Chromebook |
| Female | Capital One | Education Status: Bachelor’s Degree | Camera Lenses | A video from Coinbase |
| Language: English | Etsy | Homeownership Status: Homeowners | Cooking & Recipes | A video from HBO Max |
| Household Income: Lower Middle | Guitars | A video from Lyft | ||
| Target | Job Industry: Technology Industry | Movie & TV Streaming | A video from Pizza Hut | |
| Walmart | Marital Status: In a Relationship | Porsche | A video from Target | |
| Wayfair | Parental Status: Not A Parent | Yoga & Pilates | A video from TurboTax |
A.3. Codebook
-
•
collection-beneficial (319)
personalized-ads (106), better-recommendations (85), personalization (57), search (46), improved-experience (34), youtube (22), revisit-activities (14), maps (10), autofill-forms (3), search-history (2), news (2), storing-information (2), free-products-services (2), store-passwords (2), google-rewards (1), sometimes (1), saved-logins (1), websites (1)
-
•
privacy-concerns (218)
amount-of-information (62), selling-data (33), information-collection (27), tracking (24), sensitive-information (19), third-parties (18), monitoring (14), do-not-want-others-to-see (12), invasion-of-privacy (11), information-used-against-me (9), amount-of-interests (6), amount-of-knowledge (6), location (4), search-history (3), scary (3), targeted-advertising (3), creepy (3), ads-too-specific (2), specific-information (2), societal-consequences (1), stalking (1), what-information-collected (1), interests-too-accurate (1), behavior-modification (1), ads-everywhere (1), uncomfortable-sharing (1), how-long-data-stored (1), why-information-collected (1)
-
•
unconcerned (125)
non-sensitive (31), low-risk (21), information-is-generic (11), interests (7), nothing-bad-has-happened (5), collection-meets-expectations (4), data-collection (4), comfortable-sharing (4), because-interests-not-accurate (3), interests-not-sensitive (3), has-read-privacy-policy (2), do-not-care-who-knows-interests (1), information-is-secured-by-google (1), information-collected-is-not-important (1)
-
•
no-benefit (116)
no-use-ads (32), personalized-ads-not-helpful (6), interests-not-helpful (5), information-collected-not-helpful (3), no-use-recommendations (2), experience-not-enhanced (2), causes-problems (1), recommendations-not-helpful (1), not-paid-for-data-collection (1), personalized-ads-invasive (1)
-
•
did-not-change-perspective (109)
-
•
some-interests-incorrect (54)
one-off-activities (15), gave-examples (13), outdated (3), does-not-like-wrong-interests (2), is-okay (1), conflicting-interests (1), very-inaccurate (1), wants-to-delete (1)
-
•
unknowns (38)
how-information-used (17), who-has-access (10), what-information-collected (8), how-much-information (4), why-information-collected (2), how-long-information-stored (1), where-information-goes (1), risk (1)
-
•
interests-not-accurate (32)
only-one-search (3), wrong-context (1)
-
•
security-concerns (30)
data-misuse (14), data-released (10), data-breach (9), identity-theft (3)
-
•
privacy-tradeoff (27)
free-services (19), benefits (1), necessary (1)
-
•
trust-google (26)
transparent (1)
-
•
privacy-resigned (25)
-
•
most-interests-correct (24)
very-accurate (1), better-than-expected (1), based-on-activities (1)
-
•
privacy-aware (23)
-
•
many-interests-correct (22)
based-on-activities (4), assumptions (1)
-
•
some-interests-correct (20)
but-vague (1), lack-of-understanding (1)
-
•
many-interests-incorrect (12)
gave-examples (3), outdated (2), one-off-activities (1), indiscrete (1)
-
•
nothing-to-hide (10)
-
•
all-interests-correct (8)
-
•
some-benefit (8)
-
•
learned-something-new (8)
amount-of-information (6), how-long-data-stored (1)
-
•
interests-accurate (8)
-
•
based-on-activities (7)
search (5), maps (2), work-related (1)
-
•
only-few-interests (6)
-
•
surprise (5)
amount-of-information (4), how-old-data-was (1)
-
•
does-not-trust-google (5)
-
•
half-interests-correct (4)
-
•
does-not-reflect-personality (3)
-
•
reflects-personality (3)
-
•
interests-too-generic (2)
-
•
unsure (2)
-
•
changed-perspective (2)
-
•
feels-uncomfortable (2)
-
•
missing-interests (2)
-
•
physical-security-concerns (2)
location-data (1), targeting-groups (1)
-
•
surprised (2)
-
•
google-know-me-better-than-I (1)
-
•
repeated-search-metric (1)
-
•
google-morally-ambiguous (1)
-
•
reflects-history (1)
search (1)
-
•
google-should-do-better (1)
-
•
not-ashamed-of-activities (1)
-
•
right-to-privacy (1)
-
•
know-me-better-as-I (1)
-
•
use-tools (1)
-
•
not-surprised (1)
-
•
google-products-necessary (1)
-
•
companies-should-pay-for-data (1)
-
•
predatory-advertising (1)
-
•
benefits-not-worth-risk (1)
-
•
left-google-services (1)
-
•
order-incorrect (1)
-
•
wants-to-learn-more (1)
-
•
interests-derived-from-search (1)