Market-Adaptive Ratio for Portfolio Management
Abstract
This paper explores the limitations of existing risk-adjusted returns in portfolio management and introduces a novel metric, the Market-adaptive ratio, to address these shortcomings. Existing risk-adjusted returns neglect the differences between bear and bull markets. Acknowledging that these market conditions demand distinct strategies, the Market-adaptive ratio incorporates the unique attributes of each, enhancing the portfolio performance. By emphasizing the significance of market type in impacting investment outcomes, this novel metric empowers investors to refine their strategies accordingly
keywords:
Rho of the market portfolio , Market-adaptive ratio , Bull and bear markets[label1]organization=Inha University, city=Incheon, postcode=22212, country=South Korea
1 Introduction
Portfolio asset allocation determines how to properly allocate capital to the assets of a portfolio and achieve the investment objective, which is to minimize risk and maximize profit. Risk-adjusted returns help investors strike a balance between seeking higher returns and managing risk. In portfolio management, the assessment of investment performance has relied on traditional risk-adjusted returns, such as the Treynor, Sharpe, Sortino and Information ratios. While these measures can help reduce the tendency of investors to simply focus on returns without considering the investment risks, they often overlook an important element of complex markets: the distinction between bear and bull markets.
Market participants understand that bull and bear markets represent fundamentally different environments, each characterized by unique challenges and opportunities. During bull markets, the focus is on capitalizing on upward momentum, embracing risk, and seeking high returns. Conversely, bear markets demand a more conservative approach, emphasizing capital preservation and risk aversion to minimize losses. The one-size-fits-all approach of traditional risk-adjusted return measures fails to fully capture the nuances of these market conditions, leaving investors with an incomplete picture of investment performance.
To address this problem, this paper introduces a novel risk-adjusted return. Termed the Market-adaptive ratio, this novel metric incorporates the distinct attributes of bear and bull markets, enabling a more comprehensive assessment of portfolio performance across changing market dynamics. The importance of such a measure is underscored by the fact that market type can significantly impact portfolio performance. Strategies that excel in bull markets may crumble when bearish sentiments prevail, and vice versa. A portfolio performance measure that recognizes these shifts in market conditions empowers investors to fine-tune their strategies, and ultimately enhance the resilience and sustainability of their investments.
2 Related work
2.1 The Treynor ratio
The portfolio characteristic line [3] is used to determine the ex-post relationship between the return on a specific portfolio and that of the market portfolio
where is the portfolio return at time , is the return of the market portfolio at time , the intercept represents an abnormal return at time , the slope represents the portfolio’s volatility relative to that of the market at time , and represents random residuals at time . It is often used to understand how a portfolio’s performance relates to a benchmark. The Treynor ratio [3] is a metric to evaluate the risk-adjusted performance of a portfolio. It measures the return earned in excess of the risk-free rate per unit of market risk, beta:
where is the portfolio’s expected return, is the risk-free rate of return, and is the portfolio’s beta, which measures its sensitivity to systematic market risk. To evaluate the Treynor ratio, the market portfolio is needed.
2.2 The Sharpe ratio
The Sharpe ratio [1] is a widely used metric that helps evaluate the risk-adjusted return of a portfolio. Like the Treynor ratio, the Sharpe ratio relates the excess returns on a portfolio to its risk. The key difference is that the Sharpe ratio uses the standard deviation of the excess return:
where is the portfolio’s expected return, is the risk-free rate of return, and is the standard deviation of the portfolio’s excess returns, which measures the portfolio’s risk. One significant advantage of the Sharpe ratio is that it does not require a proxy for the market portfolio.
2.3 The Sortino ratio
The Sortino ratio [2] is another metric used to evaluate the risk adjusted return of a portfolio, similar to the Sharpe ratio. The key difference is that the Sortino ratio focuses on downside risk, particularly the volatility of returns below a minimum acceptable return:
where is the portfolio’s expected return, is the risk-free rate of return, and is the downside deviation of the portfolio’s excess returns.
2.4 The Information ratio
The Information ratio is a measure that assesses the excess return generated by a portfolio in relation to a specific benchmark. The Information ratio is commonly used by professional fund managers to gauge the success of active investment strategies in outperforming a benchmark:
where is the portfolio’s expected return, is the return of a chosen benchmark, and is the active risk of the portfolio. This ratio is similar to the Sharpe ratio, the main difference being that the Sharpe ratio uses the risk-free rate of return as a benchmark. The Information ratio is particularly relevant for evaluating active investment management. It assesses the extent to which the portfolio manager’s active decisions have added value compared to the benchmark.
3 The proposed method
3.1 Bear and bull markets
Bear market and bull market are terms used in the financial markets to describe the direction of asset prices. A bull market is characterized by optimism, rising asset prices, and positive investor sentiment. Investors in a bull market are generally confident about the future of the financial markets. Consequently, they tend to buy more stocks, leading to higher demand and further price increases. On the other hand, a bear market is characterized by pessimism, falling asset prices, and negative investor sentiment. During a bear market, investors are often concerned about economic conditions, leading them to be more inclined to sell their stocks to protect their investments.
Existing risk-adjusted return measures provide a generic evaluation of the portfolio performance that does not consider the varying characteristics of different market conditions, such as bull and bear markets. This may not accurately reflect the way investors perceive and experience risk. In a bull market, the focus is on capitalizing on upward momentum, embracing risk, and seeking high returns. Conversely, a bear market demands a more conservative approach, emphasizing capital preservation and risk aversion to minimize losses. This paper introduces a novel risk-adjusted return designed to address this critical gap in the evaluation of portfolio performance.
3.2 Market-adaptive ratio
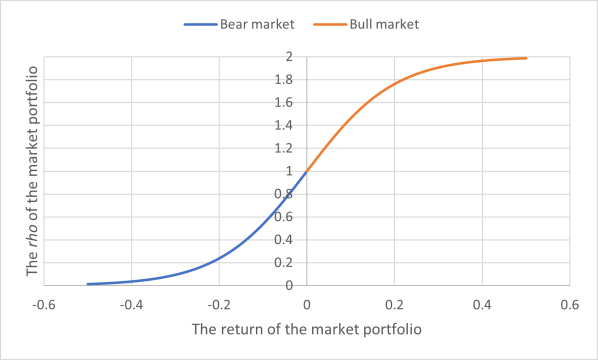
The Market-adaptive ratio incorporates the distinct attributes of bear and bull markets. Before defining it, we introduce a new measure of market types termed the rho of the market portfolio.
| (1) |
where is the return of the market portfolio. represents a type of the market portfolio. The greater the decline in the market portfolio, the closer it gets to 0, and the higher the rise in the market portfolio, the closer it gets to 2.
The market-adaptive ratio can be defined using the rho of the market portfolio.
| (2) |
where is the portfolio’s expected return, is the risk-free rate of return, is the standard deviation of the portfolio’s excess returns and is the rho of the market portfolio.
This ratio provides a dynamic perspective on portfolio performance, adjusting for market conditions. Importantly, this is in contrast to the traditional Sharpe ratio, which does not consider the rho of the market portfolio. To illustrate the significance of incorporating rho, let’s consider the Sharpe ratio as an example.
| portfolio return | 0.08 | 8.00 | 4.00 | 2.67 | 2.00 | 1.60 | 1.33 | 1.14 | 1.00 |
|---|---|---|---|---|---|---|---|---|---|
| 0.07 | 7.00 | 3.50 | 2.33 | 1.75 | 1.40 | 1.17 | 1.00 | 0.88 | |
| 0.06 | 6.00 | 3.00 | 2.00 | 1.50 | 1.20 | 1.00 | 0.86 | 0.75 | |
| 0.05 | 5.00 | 2.50 | 1.67 | 1.25 | 1.00 | 0.83 | 0.71 | 0.63 | |
| 0.04 | 4.00 | 2.00 | 1.33 | 1.00 | 0.80 | 0.67 | 0.57 | 0.50 | |
| 0.03 | 3.00 | 1.50 | 1.00 | 0.75 | 0.60 | 0.50 | 0.43 | 0.38 | |
| 0.02 | 2.00 | 1.00 | 0.67 | 0.50 | 0.40 | 0.33 | 0.29 | 0.25 | |
| 0.01 | 1.00 | 0.50 | 0.33 | 0.25 | 0.20 | 0.17 | 0.14 | 0.13 | |
| 0.01 | 0.02 | 0.03 | 0.04 | 0.05 | 0.06 | 0.07 | 0.08 | ||
| portfolio risk | |||||||||
In Table 1, several portfolios have a Sharpe ratio equal to 2.00. However, the choice of the best portfolio is random when using the traditional Sharpe ratio. Can this problem be solved using the rho of the market portfolio?
| portfolio return | 0.08 | 8.00 | 4.13 | 2.81 | 2.14 | 1.73 | 1.45 | 1.25 | 1.10 |
|---|---|---|---|---|---|---|---|---|---|
| 0.07 | 6.95 | 3.59 | 2.44 | 1.86 | 1.50 | 1.26 | 1.09 | 0.96 | |
| 0.06 | 5.91 | 3.06 | 2.08 | 1.58 | 1.28 | 1.07 | 0.93 | 0.82 | |
| 0.05 | 4.88 | 2.52 | 1.72 | 1.30 | 1.05 | 0.89 | 0.77 | 0.67 | |
| 0.04 | 3.86 | 2.00 | 1.36 | 1.03 | 0.83 | 0.70 | 0.61 | 0.53 | |
| 0.03 | 2.86 | 1.48 | 1.00 | 0.76 | 0.62 | 0.52 | 0.45 | 0.39 | |
| 0.02 | 1.87 | 0.96 | 0.66 | 0.50 | 0.40 | 0.34 | 0.29 | 0.26 | |
| 0.01 | 0.90 | 0.47 | 0.32 | 0.24 | 0.19 | 0.16 | 0.14 | 0.12 | |
| 0.01 | 0.02 | 0.03 | 0.04 | 0.05 | 0.06 | 0.07 | 0.08 | ||
| portfolio risk | |||||||||
| portfolio return | 0.08 | 8.00 | 3.86 | 2.52 | 1.86 | 1.47 | 1.21 | 1.03 | 0.90 |
|---|---|---|---|---|---|---|---|---|---|
| 0.07 | 7.05 | 3.40 | 2.22 | 1.64 | 1.29 | 1.07 | 0.91 | 0.79 | |
| 0.06 | 6.09 | 2.93 | 1.92 | 1.41 | 1.12 | 0.92 | 0.78 | 0.68 | |
| 0.05 | 5.12 | 2.47 | 1.61 | 1.19 | 0.94 | 0.78 | 0.66 | 0.57 | |
| 0.04 | 4.14 | 2.00 | 1.30 | 0.96 | 0.76 | 0.63 | 0.53 | 0.46 | |
| 0.03 | 3.15 | 1.52 | 0.99 | 0.73 | 0.58 | 0.48 | 0.41 | 0.35 | |
| 0.02 | 2.14 | 1.03 | 0.67 | 0.50 | 0.39 | 0.33 | 0.28 | 0.24 | |
| 0.01 | 1.11 | 0.53 | 0.35 | 0.26 | 0.20 | 0.17 | 0.14 | 0.12 | |
| 0.01 | 0.02 | 0.03 | 0.04 | 0.05 | 0.06 | 0.07 | 0.08 | ||
| portfolio risk | |||||||||
| portfolio return | 0.08 | 8.00 | 4.07 | 2.74 | 2.07 | 1.66 | 1.39 | 1.20 | 1.05 |
|---|---|---|---|---|---|---|---|---|---|
| 0.07 | 6.98 | 3.55 | 2.39 | 1.80 | 1.45 | 1.21 | 1.05 | 0.92 | |
| 0.06 | 5.96 | 3.03 | 2.04 | 1.54 | 1.24 | 1.04 | 0.89 | 0.78 | |
| 0.05 | 4.94 | 2.51 | 1.69 | 1.28 | 1.03 | 0.86 | 0.74 | 0.65 | |
| 0.04 | 3.93 | 2.00 | 1.35 | 1.02 | 0.82 | 0.68 | 0.59 | 0.52 | |
| 0.03 | 2.93 | 1.49 | 1.00 | 0.76 | 0.61 | 0.51 | 0.44 | 0.38 | |
| 0.02 | 1.93 | 0.98 | 0.66 | 0.50 | 0.40 | 0.34 | 0.29 | 0.25 | |
| 0.01 | 0.95 | 0.48 | 0.33 | 0.25 | 0.20 | 0.17 | 0.14 | 0.12 | |
| 0.01 | 0.02 | 0.03 | 0.04 | 0.05 | 0.06 | 0.07 | 0.08 | ||
| portfolio risk | |||||||||
| portfolio return | 0.08 | 8.00 | 3.93 | 2.59 | 1.93 | 1.54 | 1.27 | 1.09 | 0.95 |
|---|---|---|---|---|---|---|---|---|---|
| 0.07 | 7.02 | 3.45 | 2.28 | 1.69 | 1.35 | 1.12 | 0.95 | 0.83 | |
| 0.06 | 6.04 | 2.97 | 1.96 | 1.46 | 1.16 | 0.96 | 0.82 | 0.72 | |
| 0.05 | 5.06 | 2.47 | 1.64 | 1.22 | 0.97 | 0.81 | 0.69 | 0.60 | |
| 0.04 | 4.07 | 2.00 | 1.32 | 0.98 | 0.78 | 0.65 | 0.55 | 0.48 | |
| 0.03 | 3.07 | 1.51 | 1.00 | 0.74 | 0.59 | 0.49 | 0.42 | 0.36 | |
| 0.02 | 2.07 | 1.02 | 0.67 | 0.50 | 0.40 | 0.33 | 0.28 | 0.25 | |
| 0.01 | 1.05 | 0.52 | 0.34 | 0.25 | 0.20 | 0.17 | 0.14 | 0.12 | |
| 0.01 | 0.02 | 0.03 | 0.04 | 0.05 | 0.06 | 0.07 | 0.08 | ||
| portfolio risk | |||||||||
In Tables 2, based on the rho of the market portfolio, a different portfolio is chosen. During bull markets, the market-adaptive ratio allows for embracing risk and seeking high returns. Conversely, during bear markets, it works to minimize portfolio risks, providing a tailored approach to risk management.
References
- [1] William F. Sharpe. Mutual fund performance. The Journal of Business, 39(1):119–138, 1966.
- [2] Frank A. Sortino and Lee N. Price. Performance measurement in a downside risk framework. The Journal of Investing, 3(3):59–64, 1994.
- [3] Jack L. Treynor. How to rate management of investment funds. Harvard Business Review, 43:63–75, 1965.