Observation of top-quark pair production in proton-lead collisions in ATLAS
Petr Baroň111Contact: petr.baron@upol.cz
“Copyright 2023 CERN for the benefit of the ATLAS Collaboration. Reproduction of this article or parts of it is allowed as specified in the CC-BY-4.0 license.”on behalf of the ATLAS Collaboration
Joint Laboratory of Optics of Palacký University Olomouc and Institute of Physics of Czech Academy of Sciences, Czech Republic
Top-quarks and Higgs boson are the only elementary particles that have not been observed in heavy-ion collisions in the ATLAS detector yet. In particular top quarks, the heaviest elementary particles carrying colour charges, have been argued to be attractive candidates for probing the quark-gluon plasma produced in heavy-ion collisions. In proton-lead collisions, top-quark production is expected to be sensitive to nuclear modifications of parton distribution functions (PDF) at high Bjoerken-x values which are hard to access experimentally using other probes available so far. In 2016 the ATLAS experiment collected proton-lead collisions at centre-of-mass energy of 8.16 TeV per nucleon pair. The data sample corresponds to an integrated luminosity of 164 nb-1, which allows for the first time in this data set with ATLAS, to measure top-quark pair production. In this work, we discuss the inclusive cross section measurement for the top-quark pairs production in dilepton and lepton+jets decay modes with electrons and muons recorded by the ATLAS experiment. The measurement is compared to the NNLO predictions for top-quark production using various PDF sets.
PRESENTED AT
International Workshop on Top Quark Physics
(Top2023), 24–29 September, 2023
1 Introduction
This proceedings showcases the process of production in +Pb collisions at measured by the ATLAS experiment. A comprehensive exposition is available in the recent conference note [1]. The study focuses on the reconstruction of top-quark pairs observed in both jets and dilepton channels, employing electrons and muons in the final states. While the dilepton mode is less abundant, its purity significantly surpasses that of the jets channels. The results are compared with NNLO calculations involving the most recent nPDF sets.
The ATLAS detector [2, 3, 4, 5, 6, 7, 8] collected the data for this measurement during the 2016 +Pb collision running period, amassing an integrated luminosity of 165 nb-1. Operation of the LHC at energies of 6.5 TeV for the proton beams and 2.51 TeV per nucleon for the Pb beams led in a center-of-mass collision energy of 8.16 TeV. This configuration induces a rapidity boost of units w.r.t. the ATLAS laboratory frame, depending upon the direction of the beam.
The experiment facilitated two beam-direction configurations: +Pb and Pb+. The latter configuration, with the Pb beam directed in the direction, provided approximately twice the integrated luminosity compared to the former.
2 Data and Monte Carlo Simulation Samples
The ATLAS experiment used data collected during the 2016 +Pb running period, amounting to an integrated luminosity of 165 nb-1. Events were selected via single-lepton electron or muon triggers with a minimum transverse momentum threshold of 15 GeV [9, 10]. These events were required to possess at least one reconstructed vertex built from a minimum of two good-quality charged tracks with . Electron candidates were identified through a cluster of energy deposits in the EM calorimeter matched to an ID track. Selection criteria included ’Medium’ likelihood-based requirements [11], , and . Varying isolation requirements were imposed based on track and calorimeter-based isolation, with efficiency thresholds at different values. Muon candidates were reconstructed by combining inner detector (ID) and muon spectrometer (MS) tracks, satisfying ’Medium’ requirements [12] with , , and isolation criteria using a cone size of around the muon and a track-based isolation requirement with a varying cone size [12]. Jets were reconstructed from calorimeter energy deposits [13, 14], using the anti- algorithm [15, 16] with . The jet kinematics are corrected event-by-event for the contribution from underlying event (UE) particles, calibration included calorimeter response simulations [17], and in situ absolute energy scale measurements. In situ measurements are carried out in collisions and cross-calibrated to the system typical by its low pile-up () enviroment. Jets reconstructed this way are referred to as Heavy Ion (HI) jets. HI jets and Particle Flow (PF) jets, were matched using a minimal criterion. HI jets lacking PF counterparts were considered non--tagged. The analysis relied on HI jets for kinematic calculations, but inherited -tagging information from matched PF jets.
Monte Carlo (MC) simulated events were utilized for analysis development, signal estimation, and background evaluation. Samples were processed using the ATLAS detector simulation based on Geant4 [18]. Top-quark samples were simulated using various event generators [19, 20, 21], normalized using NNLO+NNLL predictions [22]. Backgrounds from +jets, single top-quark, and diboson production were simulated using Sherpa and Powheg event generators with Pythia8 for particle shower. The fake-lepton and non-prompt background was estimated using the Matrix Method [23]. Events were categorized into dilepton and jets channels based on lepton count and -tagged jet requirements, with specific event yields and signal purities observed.
The dilepton channel comprises events featuring precisely two opposite-sign leptons. Pairs of same-flavor leptons ( or ) within an invariant mass range of are discarded. Additionally, the invariant mass in the ( and ) channel must exceed 15 (45) GeV, a constraint aimed at aligning with the phase space of the +jets simulation samples without significantly impacting the results. Events with a minimum of two HI jets with at least one being -tagged form the Signal Region (SR). In total 106 and 104 data events were observed in the and regions, respectively, exhibiting expected signal purities of 53% and 91% in data. The lepton+jets (jets) channel is constructed from events featuring precisely one lepton and at least four HI jets, including at least one -tagged jet, in the SR. This channel comprises 1874 and 1075 data events in the and regions, respectively, exhibiting anticipated signal purities of 20% and 71%. Further division of the jets SR, based on lepton flavor, produces in total four signal regions: ejets, ejets, mujets, and mujets.
3 Systematic uncertainties
The measurement is subject to systematic uncertainties stemming from various sources:
- •
- •
- •
-
•
Uncertainties in the non-prompt and fake-lepton background involve statistical and systematic variations in efficiencies. Shape variations in the jets channel and normalization uncertainties are imposed based on conservative estimations in the control region.
- •
- •
4 Analysis
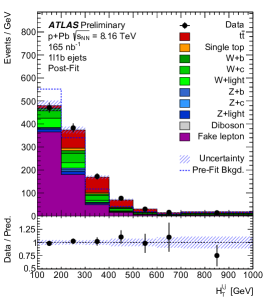
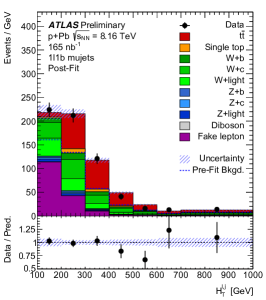
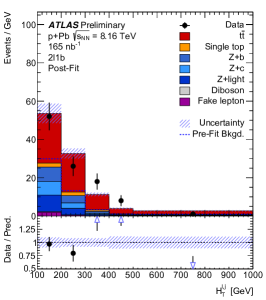
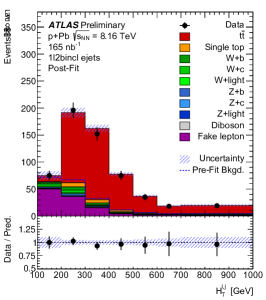
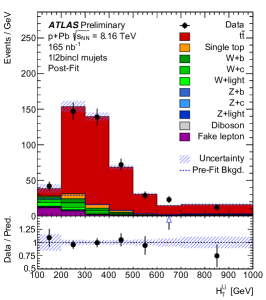
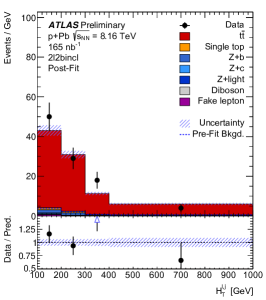
The signal strength parameter, denoted as , represents the observed signal yield in both the jets and dilepton final states, relative to the Standard Model (SM) expectation without nuclear parton distribution function (nPDF) effects. Its determination employs a profile-likelihood fit [33, 34] to the data distributions across six Signal Regions, where denotes the scalar sum of transverse momenta of leptons and HI jets. Figure in 1 depict the post-fit distributions for six channels within the dilepton and jets SRs, distinguishing between exactly one and at least two -tagged jets. Observed distributions are in good agreement with those predicted by the fit.
The fit incorporates roughly 130 nuisance parameters that account for systematic uncertainties. These uncertainties are collectively treated as correlated across the Signal Regions. Primary contributors to the pre-fit uncertainties encompass fake-lepton and +jets normalization in the jets channel, along with +jets normalization in the dilepton channel. The fit procedure mitigates the impact of fake-lepton uncertainties. The major factors contributing to the overall systematic uncertainty include signal modeling, jet energy scale, luminosity of the data sample, and fake-lepton background. A summary outlining grouped systematic uncertainties is presented in Table 1. Overall, the total relative systematic uncertainty is estimated at 8%.
| Source | unc. up | unc. down |
| Jet energy scale | +0.048 | -0.044 |
| generator | +0.048 | -0.043 |
| Fake-lepton background | +0.030 | -0.027 |
| Background | +0.030 | -0.025 |
| Luminosity | +0.029 | -0.025 |
| Muon systs. | +0.024 | -0.021 |
| jets | +0.023 | -0.020 |
| -tagging | +0.022 | -0.021 |
| Electron systs. | +0.018 | -0.017 |
| MC statistical uncertainties | +0.011 | -0.010 |
| Jet energy resolution | +0.005 | -0.004 |
| +0.001 | -0.001 | |
| Total syst. | +0.088 | -0.081 |
5 Results
The measured value of is used to derive the inclusive production cross section using the formula
| (1) |
Here, represents the predicted production cross section in nucleon-nucleon collisions, determined at NNLO precision, used as normalization for the signal samples in both jets and dilepton decay modes. The measured inclusive cross section for +Pb collisions is . The total relative uncertainty stands at 9%, mainly driven by systematic contributions.
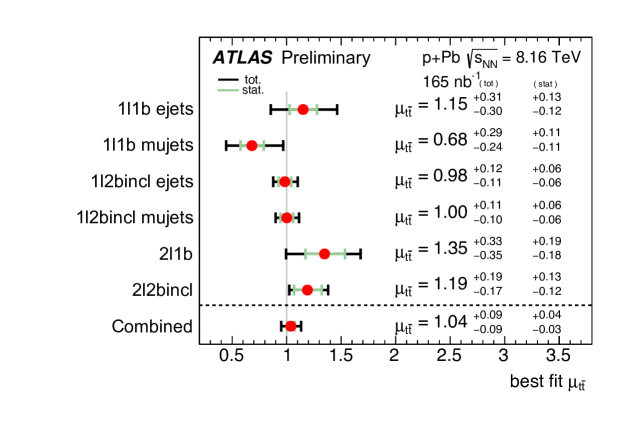
The background-only hypothesis is dismissed with a significance exceeding 5 standard deviations, confirming the observation of the process in +Pb collisions by ATLAS. Figure 2 showcases the signal strength obtained separately in each region and through the combined fit. The two jets channels with the highest signal yield (in the region) produce very close results. Slight variations are observed in the signal strength between the dilepton channels, with a slightly higher preferred in the dilepton channels compared to the jets channel, but consistent within uncertainties. The precision of the value is limited by systematic uncertainties in the jets SRs, while statistical uncertainties dominate in the dilepton SRs. Additionally, separate fits of to the combined four jets and two dilepton SRs both exceed , confirming the observation of production also in the individual jets and dilepton channels. This marks the first report of the latter in +Pb collisions at the LHC.
The combined measurement of the production cross section showed in Figure 3 is compared with the corresponding result obtained by CMS [35], both acquired using +Pb collisions at . These two measurements exhibit agreement within the range of uncertainties. Additionally, the most precise production cross section measured in collisions at , derived from a combination of ATLAS and CMS data [36], is presented. This cross-section value is extrapolated to the center-of-mass energy of this particular measurement using predictions from Top++ v2 and scaled by to the +Pb system. The extrapolated cross section bears a 2.5% relative uncertainty and remains independent of nPDF dependencies. The measured cross section is compared with NLO calculations obtained using the MCFM generator [37], scaled to NNLO precision in QCD using a k-factor (k=1.139) derived from the Top++ generator. The MCFM calculations utilize four distinct nPDF sets: EPPS21 [38], nCTEQ15HQ [39], nNNPDF30 [40], and TUJU21 [41]. The nNNPDF30 nPDF set exhibits the largest discrepancy when compared with the measured cross-section value. In contrast, the remaining nPDF sets showcase good alignment with the measured cross-section value.

6 Conclusion
This proceeding presented measurement of top-quark pair production in +Pb collisions at a center-of-mass energy of per nucleon pair, conducted with the ATLAS experiment. The observation of top-quark pairs occurs through the distinct jets and dilepton channels, with final states containing electrons and muons. The observation of top-quark pair production in the dilepton channel surpasses 8 standard deviations, marking its first observation in the +Pb system at the LHC. The total integrated cross section is measured with a total relative uncertainty of 9%, establishing this as the most precise determination of the cross section in nuclear collisions to date. While the precision in the individual decay channels is constrained by systematic uncertainties in the jets channel, the dilepton region is predominantly limited by statistical uncertainties.
The measured cross section is compared with the CMS measurement in the +Pb system and the combined measurement from ATLAS and CMS in collisions at . The latter is appropriately scaled to the +Pb system and the energy of this analysis. Additionally, the measured cross section is compared against NNLO calculations derived from various nPDF sets. The measured cross section aligns closely with previous measurements and Standard Model predictions. With its enhanced precision, this measurement promises to offer constraints on nPDFs, particularly in the high- region.
Acknowledgement
The author gratefully acknowledge the support from the project IGA_PrF_2023_005 of Palacky University.
References
- [1] ATLAS Collaboration Observation of production in lepton+jets and dilepton channels in p+Pb collisions at TeV with the ATLAS detector. (CERN,2023), http://cds.cern.ch/record/2873517
- [2] ATLAS Collaboration The ATLAS Experiment at the CERN Large Hadron Collider. JINST. 3 pp. S08003 (2008)
- [3] ATLAS Collaboration ATLAS Insertable B-Layer Technical Design Report. (2010), https://cds.cern.ch/record/1291633
- [4] Abbott, B. & Others Production and Integration of the ATLAS Insertable B-Layer. JINST. 13, T05008 (2018)
- [5] ATLAS Collaboration Performance of the ATLAS Trigger System in 2015. Eur. Phys. J. C. 77, 317 (2017)
- [6] ATLAS Collaboration Operation of the ATLAS trigger system in Run 2. JINST. 15, P10004 (2020)
- [7] ATLAS Collaboration The ATLAS Collaboration Software and Firmware. (CERN,2021), https://cds.cern.ch/record/2767187
- [8] ATLAS Collaboration ATLAS data quality operations and performance for 2015–2018 data-taking. JINST. 15, P04003 (2020)
- [9] ATLAS Collaboration Performance of electron and photon triggers in ATLAS during LHC Run 2. Eur. Phys. J. C. 80, 47 (2020)
- [10] ATLAS Collaboration Performance of the ATLAS muon triggers in Run 2. JINST. 15, P09015 (2020)
- [11] ATLAS Collaboration Electron and photon performance measurements with the ATLAS detector using the 2015–2017 LHC proton-proton collision data. JINST. 14, P12006 (2019)
- [12] ATLAS Collaboration Muon reconstruction and identification efficiency in ATLAS using the full Run 2 pp collision data set at =13 TeV. Eur. Phys. J. C. 81, 578 (2021)
- [13] ATLAS Collaboration Dijet azimuthal correlations and conditional yields in pp and p+Pb collisions at sNN=5.02TeV with the ATLAS detector. Phys. Rev. C. 100, 034903 (2019)
- [14] ATLAS Collaboration Charged-hadron production in , +Pb, Pb+Pb, and Xe+Xe collisions at TeV with the ATLAS detector at the LHC, JHEP 07 (2023), 074 doi:10.1007/JHEP07(2023)074 [arXiv:2211.15257 [hep-ex]].
- [15] Cacciari, M., Salam, G. & Soyez, G. The anti- jet clustering algorithm. JHEP. 4 pp. 063 (2008)
- [16] Cacciari, M., Salam, G. & Soyez, G. FastJet User Manual. Eur. Phys. J. C. 72 pp. 1896 (2012)
- [17] ATLAS Collaboration Jet energy scale and resolution measured in proton–proton collisions at =13 TeV with the ATLAS detector. Eur. Phys. J. C. 81, 689 (2021)
- [18] Agostinelli, S. & Others GEANT4–a simulation toolkit. Nucl. Instrum. Meth. A. 506 pp. 250-303 (2003)
- [19] Alioli, S., Nason, P., Oleari, C. & Re, E. A general framework for implementing NLO calculations in shower Monte Carlo programs: the POWHEG BOX. JHEP. 6 pp. 043 (2010)
- [20] Sjöstrand, T., Mrenna, S. & Skands, P. A brief introduction to PYTHIA 8.1. Computer Physics Communications. 178, 852-867 (2008), https://www.sciencedirect.com/science/article/pii/S0010465508000441
- [21] ATLAS Collaboration ATLAS Pythia 8 tunes to 7 TeV data. (CERN,2014), https://cds.cern.ch/record/1966419
- [22] Czakon, M. & Mitov, A. Top++: A Program for the Calculation of the Top-Pair Cross-Section at Hadron Colliders. Comput. Phys. Commun.. 185 pp. 2930 (2014)
- [23] G. Aad et al. ATLAS Collaboration Tools for estimating fake/non-prompt lepton backgrounds with the ATLAS detector at the LHC, JINST 18 (2023) no.11, T11004, doi:10.1088/1748-0221/18/11/T11004 [arXiv:2211.16178 [hep-ex]].
- [24] ATLAS Collaboration Electron reconstruction and identification in the ATLAS experiment using the 2015 and 2016 LHC proton-proton collision data at = 13 TeV. Eur. Phys. J. C. 79, 639 (2019)
- [25] ATLAS Collaboration Jet energy scale measurements and their systematic uncertainties in proton-proton collisions at = 13 TeV with the ATLAS detector. Phys. Rev. D. 96, 072002 (2017)
- [26] ATLAS Collaboration Jet energy scale and its uncertainty for jets reconstructed using the ATLAS heavy ion jet algorithm. (CERN,2015), https://cds.cern.ch/record/2008677
- [27] Berger, C., Bern, Z., Dixon, L., Febres Cordero, F., Forde, D., Gleisberg, T., Ita, H., Kosower, D. & Maıt̂re, D. Precise Predictions for W+4-Jet Production at the Large Hadron Collider. Phys. Rev. Lett.. 106, 092001 (2011,3), https://link.aps.org/doi/10.1103/PhysRevLett.106.092001
- [28] Re, E. Single-top Wt-channel production matched with parton showers using the POWHEG method. Eur. Phys. J. C. 71 pp. 1547 (2011)
- [29] ATLAS Collaboration Measurement of the production cross-section in pp collisions at = 5.02 TeV with the ATLAS detector. JHEP. 6 pp. 138 (2023)
- [30] Butterworth, J. & Others PDF4LHC recommendations for LHC Run II. J. Phys. G. 43 pp. 023001 (2016)
- [31] ATLAS Collaboration Luminosity determination in pp collisions at = 13 TeV using the ATLAS detector at the LHC. (2022,12)
- [32] Avoni, G., Bruschi, M., Cabras, G., Caforio, D., Dehghanian, N., Floderus, A., Giacobbe, B., Giannuzzi, F., Giorgi, F., Grafström, P., Hedberg, V., Manghi, F., Meneghini, S., Pinfold, J., Richards, E., Sbarra, C., Cesari, N., Sbrizzi, A., Soluk, R., Ucchielli, G., Valentinetti, S., Viazlo, O., Villa, M., Vittori, C., Vuillermet, R. & Zoccoli, A. The new LUCID-2 detector for luminosity measurement and monitoring in ATLAS. (IOP Publishing,2018,7), https://doi.org/10.1088/1748-0221/13/07/p07017
- [33] Cowan, G., Cranmer, K., Gross, E. & Vitells, O. Asymptotic formulae for likelihood-based tests of new physics. Eur. Phys. J. C. 71 pp. 1554 (2011), [Erratum: Eur.Phys.J.C 73, 2501 (2013)]
- [34] Cranmer, K., Lewis, G., Moneta, L., Shibata, A. & Verkerke, W. HistFactory: A tool for creating statistical models for use with RooFit and RooStats. (New York U.,2012), https://cds.cern.ch/record/1456844
- [35] CMS Collaboration Observation of top quark production in proton-nucleus collisions. Phys. Rev. Lett.. 119, 242001 (2017)
- [36] ATLAS, CMS Collaborations Combination of inclusive top-quark pair production cross-section measurements using ATLAS and CMS data at = 7 and 8 TeV. (2022,5)
- [37] Campbell, J., Wackeroth, D. & Zhou, J. Study of weak corrections to Drell-Yan, top-quark pair, and dijet production at high energies with MCFM. Phys. Rev. D. 94, 093009 (2016)
- [38] Eskola, K., Paakkinen, P., Paukkunen, H. & Salgado, C. Towards EPPS21 nuclear PDFs. SciPost Phys. Proc.. 8 pp. 033 (2022)
- [39] Kusina, A. & Others Impact of LHC vector boson production in heavy ion collisions on strange PDFs. Eur. Phys. J. C. 80, 968 (2020)
- [40] Ubiali, M. Towards the NNPDF3.0 parton set for the second LHC run. PoS. DIS2014 pp. 041 (2014)
- [41] Helenius, I., Walt, M. & Vogelsang, W. TUJU21: nuclear PDFs with electroweak-boson data at NNLO. 29th International Workshop On Deep-Inelastic Scattering And Related Subjects. (2022,7)