[ ] \cormark[1] \creditConceptualization, Data curation, Writing - original draft
[ orcid=0000-0003-4976-6114 ] \creditConceptualization, Data curation, Validation, Writing - review & editing
[ orcid=0000-0002-7211-8206 ] \creditWriting - original draft, Writing - review & editing
[ orcid=0000-0001-5912-5092 ] \creditData curation, Formal Analysis, Methodology, Validation
[] \creditData curation, Methodology, Validation
[ orcid=0000-0002-9550-2411 ] \creditConceptualization, Supervision, Writing - review & editing
1]organization=Waymo, LLC., addressline=1600 Ampatheater Parkway, city=Mountain View, postcode=94043, state=CA, country=USA
[1]Corresponding author
Benchmarks for Retrospective Automated Driving System Crash Rate Analysis Using Police-Reported Crash Data
Abstract
With fully automated driving systems (ADS; SAE level 4) ride-hailing services expanding in the U.S., we are now approaching an inflection point in the history of vehicle safety assessment. The process of retrospectively evaluating ADS safety impact (as seen with seatbelts, airbags, electronic stability control, etc.) can start to yield statistically credible conclusions. An ADS safety impact measurement requires a comparison to a “benchmark” crash rate. Most benchmarks generated to-date have focused on the current human-driven fleet, which enable researchers to understand the impact of the introduced ADS technology on the current crash record status quo. This study aims to address, update, and extend the existing literature by leveraging police-reported crashes to generate human crash rates for multiple geographic areas with current ADS deployments. All of the data leveraged is publicly accessible, and the benchmark determination methodology is intended to be repeatable and transparent. Generating a benchmark that is comparable to ADS crash data is associated with certain challenges, including data selection, handling underreporting and reporting thresholds, identifying the population of drivers and vehicles to compare against, choosing an appropriate severity level to assess, and matching crash and mileage exposure data. Consequently, we identify essential steps when generating benchmarks, and present our analyses amongst a backdrop of existing ADS benchmark literature. One analysis presented is the usage of established underreporting correction methodology to publicly available human driver police-reported data to improve comparability to publicly available ADS crash data. We also identify important dependencies in controlling for geographic region, road type, and vehicle type, and show how failing to control for these features can bias results. This body of work aims to contribute to the ability of the community - researchers, regulators, industry, and experts - to reach consensus on how to estimate accurate benchmarks.
keywords:
Automated Driving Systems\sepSafety Impact Analysis\sepTraffic Safety\sep1 Introduction
1.1 The Burden of Motor Vehicle Crashes
Automotive crashes are a crisis on U.S. public roadways (US DOT, 2022). In 2021, the U.S. experienced 6.1 million police-reported crashes (NCSA, 2023a) and 42,939 fatalities (NCSA, 2023b). Several vehicle solutions, including improved vehicle crashworthiness and advanced driver assistance systems (ADAS), have all contributed toward reducing this motor vehicle crash burden (Glassbrenner & Starnes, 2009; Fildes et al., 2015; Lie et al., 2005; Teoh & Lund, 2011, Strandroth et al., 2012; Cicchino, 2017; Cicchino, 2018, Isaksson-Helman & Lindman, 2015). Despite the adoption and improvement of passive and active safety systems, the U.S. had the most traffic fatalities in 2021 since 2005 (Stewart, 2023).
1.2 Safety Impact of Automated Driving Systems
Automated driving systems (ADS), specifically SAE level 4 ADS used in fully automated ride-hailing services without a human behind the steering wheel, have been deployed in multiple urban metropolitan areas throughout the U.S. In an SAE level 4 ADS, when the system is active, the ADS can handle the entire dynamic driving task, and a human driver is not required to continuously monitor the driving task or urgently respond (SAE, 2021). While an ADS is in the development phase, prospective and design-based methods are used to evaluate the safety of the system before widespread deployment (Favaro et al., 2023; Webb et al., 2020). Testing operations (TO) are an important part of the development phase in that real-world performance can be evaluated with the support of a human autonomous specialist behind the wheel to monitor the driving behavior. When a human is present and disengages the vehicle prior to a potential crash, counterfactual simulation is required to project forward the driving scenario, which introduces uncertainty (Schwall et al., 2020). Scaled, rider-only (RO) deployments - without a human in the driver seat - enable a new phase of ADS evaluation: retrospective safety impact. At this deployment stage, the performance of the system can be evaluated without the confounding effect of a human available to take control.
There is a long history in the automotive safety literature of retrospective safety impact analysis, including the assessment of airbags, seatbelts, electronic stability control, and automated emergency braking (Glassbrenner & Starnes, 2009; Fildes et al., 2015; Lie et al., 2005; Teoh & Lund, 2011, Strandroth et al., 2012; Cicchino, 2017; Cicchino, 2018, Isaksson-Helman & Lindman, 2015 ). In retrospective safety impact analyses, crash and injury rates are evaluated against some benchmark rate(s). A common point of comparison is the relative performance of the introduced technology relative to the current rate of crashes and injuries. This evaluation enables researchers to make statistical claims regarding the impact of the introduction of the technology relative to the driving population at-large.
To execute retrospective safety impact on ADS technology, enough driving exposure must be accumulated to where there is some deviation from an expected crash and/or injury rate that can be detected by statistical tests (Kalra and Paddock, 2016; Lindman et al., 2017). Because of this mileage dependency, we are in the early stages of retrospective ADS evaluation (Victor et al., 2023; Di Lillo et al., 2023). As mileage continues to grow, researchers’ ability to evaluate more granular components, such as less frequent higher severity crash outcomes or narrowly defined crash types, will be enabled. A valid comparison between ADS and benchmark is enabled by consistent safety-relevant reporting standards, control of influential covariates, and credible statistical testing.
1.3 Benchmarks for ADS Performance Evaluation
An ideal safety impact analysis for an ADS would compare crash rates of an ADS operated fleet with a benchmark crash rate of the existing fleet (human-driven vehicles). The goal of the benchmark is to create a fair and accurate representation of that existing fleet within the context of the ADS operational design domain (ODD) conditions. Two main dimensions should be considered when generating a benchmark with which to compare an ADS to: (1) what data can be relied upon for generating benchmarks? and (2) what minimum methodological requirements are required to generate a valid, apples-to-apples comparison?
1.3.1 Types of Benchmark Data Sources
Benchmark creation efforts - for both ADS and ADAS - have largely considered three primary data sources: Insurance, naturalistic driving study, and police-reported. When examining the performance of an ADS, evaluators generally want to understand, for the benchmark, how often does that population of drivers crash given some amount of driving exposure? Generating this vehicle-level crash rate estimate requires a count of total crashed vehicles (or crash involved drivers) and an estimation of the total VMT. It is important to consider: (a) which population of drivers are ADS comparable (e.g., geographic region, vehicle type, road types)? and (b) what crash outcomes is of interest? Data source selection and methodological choices around these questions should be driven by the desired research question.
Insurance data has served as one credible source for retrospectively assessing performance (Cicchino, 2017; Isaksson-Helman & Lindman, 2015; Isaksson-Helman & Lindman, 2018). Data tables derived from insurance claims data have several key advantages for measuring safety impact. First, there are established insurance reporting practices, which help to limit surveillance bias due to reporting thresholds (Di Lillo et al., 2023). Second, claims data tends to capture a higher proportion of safety-relevant crash events (better event recall) than police-reported data (Isaksson-Helman & Lindman, 2018; Blincoe et al., 2023). One challenge with relying on insurance data is driving mileage is generally not directly measured, and other data sources are required to estimate driving volume and mix (e.g., exact locations, time-of-day, weather). Insurance data usage in ADAS retrospective safety impact has largely been restricted to analysis only after substantial mileage has been collected.
The Swiss Re Group (Swiss Re) recently led a study examining Waymo’s third party liability claims frequency over the company’s first 3.8 million RO miles (Di Lillo et al., 2023). Third party liability claim rates are distinct from overall crash rates. A third party liability claim occurs only when there is a request for compensation due to property damage or injury by another involved party. Because of this, crashes without attributed liability are excluded from both the benchmark and ADS rates. SwissRe was able to leverage a dataset of over 600,000 claims received over an estimated 125 billion vehicle miles traveled in the areas where Waymo is deployed. Despite a small number of ADS miles compared to the insurance benchmark, this analysis was able to detect a statistically significant reduction in third party property damage and bodily injury claims rate relative to a mileage and zip-code matched human driver benchmark. The detectable difference on a relatively small amount of ADS data (3.8 million miles) was possible because (a) the confidence intervals on the Swiss Re benchmark and ADS data were sufficiently small and (b) the magnitude (effect size) of the ADS-human driver difference was large.
Naturalistic driving study (NDS) data provides another unique opportunity for retrospective safety evaluation, because researchers are able to directly attribute the driving miles to specific geographic areas and can capture events that might not be reported to insurance or police (Goodall, 2021a; Goodall, 2021a; Blanco et al., 2016; Flannagan et al., 2023). Having a direct measure of the driving provides unique analytical opportunities when looking at how the composition of driving exposure affects crash rate. NDS data has a greater ability to detect and report lower severity events compared to other data sources. On the other hand, NDS data currently published generally covers few geographic regions and only for a limited amount of mileage. Flannagan et al. (2023) generated benchmarks for low-severity crashes using a small-scale (approximately 5 ½ million miles) NDS in San Francisco. This study used a combination of insurance and telematics data and recorded NDS data to estimate a property damage crash rate. Blanco (2016) and Goodall (2021a; 2021b) both previously relied upon data collected from the Second Strategic Highway Research Program Naturalistic Driving Study (SHRP-2) to generate benchmarks. SHRP-2 comprises approximately 34 million driving miles across multiple geographic regions in the U.S. Despite their limited size, the UMTRI study and SHRP-2 dataset enable the analysis of mostly low severity contacts, given how frequently these contacts occur in dense-urban driving environments. However, relying on this data volume alone is limited for measuring safety impact, because lower mileage increases the crash rate estimate confidence intervals. In practice, lower quoted mileage (i.e., on the order of millions) generally available in NDS data limits the ability to make statistical claims around higher severity crash outcomes, such as those resulting in fatality or in moderate, serious or worse Abbreviated Injury Scale (AIS) injuries (AAAM, 2016).
The third commonly relied upon data, and the focus of the current study, is publicly-accessible, police-reported crash databases. The National Highway Traffic Safety Administration (NHTSA) is the primary compiler of national crashes in the U.S., and many states additionally compile their own sets of crashes, which are inherently dependent on the reporting of said crashes to local jurisdictions and then to state-level compilers. Because police crash report data is publicly-accessible, a wider group of researchers are able to leverage data, replicate results, and build upon the current state-of-the-art. These databases take a number of sampling strategies, ranging from stratified sampling to a complete census. For appreciation of scale, the collected annual datasets are generally representative of billions to trillions of miles driven. Where insurance data is generally focused and compiled for a cost-based use case, police-reported data is compiled for quantifying the measurement of injuries, which makes its data features (e.g., KABCO, AIS, crash reconstructions) well suited for safety impact evaluation. Given its accessibility (publicly available) and scale, police-reported data has long served as a primary source of high severity crash rates for measuring safety impact (Strandroth et al., 2012; Glassbrenner & Starnes, 2009). Like insurance claims data, police-reported crash data does not directly contain associated driving mileage, so other data sources are required to help estimate driving exposure.
1.3.2 Benchmarks Using Police-Reported Data
Several studies have generated benchmarks for ADS evaluation using police-reported crash and publicly-accessible mileage data. Many of these studies leveraged TO data, where a human was seated in the driver seat and had the ability to take control prior to any crash event. Accordingly, observed TO crash rates - and computed safety impact - are not necessarily reflective of RO operations. Dixit et al. (2016) computed a California statewide police-reported crash rate using non-fatal injury state crash data (no mileage data source was provided) and compared it to all California (CA) Department of Motor Vehicle (DMV) OL 316 reported crashes, which are reported by the ADS operators (CA DMV, 2023; Young 2021). Favaro et al. (2017) and Banerjee et al. (2018) used national crash data and driving mileage to estimate an overall national crash rate, which they then compared to CA DMV OL 316 reported ADS TO crash rates. Schoettle and Sivak (2015) used national crash databases to derive a benchmark, and adjusted the crash rates using underreporting estimates by a NHTSA study (Blincoe et al., 2015). Their adjusted benchmark rates were then compared to CA DMV OL 316 reported ADS TO crash rates. Blanco et al. (2016) leveraged state and national police-reported data to generate benchmarks, and used SHRP-2 data and the Blincoe et al. (2015) study to correct for underreporting in police-reported databases. Blanco et al. used these adjusted police-reported crash rates to then compare the benchmark to CA DMV OL 316 reported crashes involving an ADS. Teoh and Kidd (2017) used both state and national datasets to generate benchmark rates of police-reported crashes and compared these rates to “police-reportable” Waymo driving crash events in TO. Cummings (2024) used national crash and mileage data to estimate a non-interstate ADS benchmark and then compared the benchmark rates to ADS RO and TO crash rates with any injury or property damage, which were gathered from NHTSA Standing General Order (SGO) 2021-01 reporting (NHTSA, 2023b).
The opportunity for ADS comparison to a police-reported crash benchmark does bring with it certain challenges that include:
-
1.
Analytical error of comparing crash-level and vehicle-level rates,
-
2.
Reporting thresholds,
-
3.
Underreporting,
-
4.
ODD-matching, and
-
5.
Mismatched crash and mileage data.
A key contribution of this current study is the methodological handling and presentation of these key challenges that researchers face when leveraging this publicly accessible data, which can ultimately unreasonably bias results if not properly handled. Relevant ADS benchmarking literature with features of the works can be found in Table 1. Young (2021) previously performed epidemiological analysis on six of these prior studies using police-reported data: Schoettle and Sivak (2015), Blanco et al. (2016), Dixit et al. (2016), Teoh and Kidd (2017), Favaro et al. (2017), and Banerjee et al. (2018). Young’s (2021) extensive review of the prior research noted multiple biases that can be introduced through data and analytical choices that included the aforementioned challenges.
| Study | ADS Data Deployment Stage | Vehicle-Level Benchmark Crash Rates1 | Any ADS & Benchmark Data Alignment Procedure | ||||
| Geo-Corrected | Reporting Threshold | Vehicle Type | Road Type | Other4 | |||
| Insurance Data | |||||||
| Di Lillo et al., 2023 | TO & RO | ✓ | ✓ | ✓ | ✓ | ||
| Naturalistic Driving Study Data | |||||||
| Blanco et al., 2016 | TO | ✓ | ✓ | ✓ | ✓ | ||
| Goodall et al., 2021a | TO | ✓ | ✓ | ✓ | ✓ | ||
| Flannagan et al., 2023 | RO | ✓ | ✓ | ✓ | ✓ | ✓ | |
| Police-Reported + Public Mileage Data | |||||||
| Banerjee et al., 2018 | TO | ||||||
| Dixit et al., 2016 | TO | ||||||
| Favarò et al., 20172 | TO | ||||||
| Schoettle and Sivak, 2015 | TO | ✓ | |||||
| Blanco et al., 2016 | TO | ✓ | ✓ | ||||
| Teoh and Kidd, 2017 | TO | ✓ | ✓ | ✓ | |||
| Cummings, 2023 | TO & RO | ✓ | |||||
| Scanlon et al., 2023 (current) & Kusano et al., 2023 | RO | ✓ | ✓ | ✓ | ✓ | ✓ | |
1 Unlike the data alignment procedures, failure to generate “vehicle-level” benchmark crash rates invalidates the comparison to ADS crash rates (which are at the vehicle-level). This common mathematical error is discussed further in the paper.
2 It is notable that, of the studies presented, Favaro et al. (2017) did not draw any safety impact conclusions regarding ADS efficacies. Because a human-relative rate was presented in relation to ADS TO crash rates, this study was included.
3 Teoh and Kidd (2017) do some vehicle type and road type corrections, but do not apply equivalent procedures to both the crash and mileage data. For mileage, they included all vehicle types and only city maintained roads, which excluded mileage on various state highway maintained roads like freeways and interstate 101 passing through city limits. For crashes, they included only passenger vehicles and did not exclude based on road type.
4 Additional features, including weather, traffic density, and time-of-day, are known to affect crash rates, but were not controlled for in any of these prior studies, mostly because of lack of mileage data that include these dimensions.
The current study supplements this existing body of research with a refreshed set of police-reported benchmarks within multiple geographic regions where ADS technology is currently deployed. Each of the identified potential biases was addressed within the analysis and the quantitative impact of accounting for them was demonstrated. We specifically examined the opportunity to generate lower-severity-inclusive crash benchmarks from these police-reported data, such as “any property damage, injury, or fatality” (a component of the SGO reporting threshold), by correcting for underreporting. We also established rates for subsets of police-reported crashes with higher severity, such as tow-away, any injury, and fatal crashes.
1.4 Objectives and Research Questions
The objective of this paper was to leverage police-reported data to create crash rate benchmarks for evaluating ADS performance against the current human crash rate status quo. Several research questions were posed. First, what are the effects of methodological choices made in generating benchmark rates? As police-reportable crashes do not always get reported, and can lead to underestimating the benchmark crash rate, the second research question is therefore: How can police-reported data be used to generate a benchmark that is comparable to ADS crash data, which has no lower property damage limit for reporting? Third, what are crash rate benchmarks for evaluating ADS performance within the Phoenix, San Francisco, and Los Angeles driving environments (three active deployment locations for ADS technology)?
2 Methods
2.1 Data Sources
All crash and mileage data used in the current study is publicly accessible. Crash data - at a minimum - contains crash, vehicle, and person data that can be combined to answer various research questions. For crash data, this study followed the general best practice of downloading and processing the published raw data tables. This study focused exclusively on data collected from 2021. This year of data was the most up-to-date year available in all data sources.
2.1.1 National Data
In the United States, police-reported databases are generally managed by federal, state, and local agencies. Nationally, two crash database sources were leveraged to generate crash rates. First, the Crash Report Sampling System (CRSS) was used to generate non-fatal, police reported crash counts (NCSA, 2023a). The CRSS database is annually compiled by NHTSA to quantify the total number of police-reported crashes on US roadways. According to NHTSA: “By restricting attention to police-reported crashes, CRSS concentrates on those crashes of greatest concern to the highway safety community and the general public.” The database is compiled by taking a probability sample of crashes within multiple jurisdictions, and each crash is then assigned a weight to enable nationally-representative estimates to be made. Second, although CRSS contains (sampled) fatal crashes, NHTSA also compiles the Fatality Analysis Reporting System (FARS), which contains a census of fatal motor vehicle crashes on US public roadways (NCSA, 2023b). To be included in FARS, at least one person must have been fatally injured. Both CRSS and FARS have unique data elements, but are generally similar in structure and formatting, which helps facilitate their combination into a single, nationally representative crash compilation. Both CRSS and FARS are publicly accessible for download (NHTSA, 2023a). For a national estimate of vehicle miles traveled (VMT), the USDOT Federal Highway Administration (FHWA) highway statistics series was used (FHWA, 2023b). This annually compiled publication contains multiple tabulations of various highway data, including VMT data compiled as part of the Highway Performance Monitoring System (HPMS). The data, itself, is compiled, processed, and verified by a cooperation of local, state, and federal agencies. From this series, the “VM-2” and “VM-4” tables were used. When combined, these two tables provide state-level VMT by functional system, vehicle type, and population density.
2.1.2 State Data
Three counties where ADS technologies are currently deployed were considered for this analysis: Maricopa, Arizona, San Francisco, California, and Los Angeles, California. The Arizona Department of Transportation (ADOT) annually compiles a census of all police-reported crashes within the state that can be accessed via a public record request (ADOT, 2023a, ADOT, 2023c). In California, the Statewide Integrated Traffic Records System (SWITRS) database is publicly accessible for download via the California Highway Patrol’s (CHP) online portal (CHP, 2023). The SWITRS dataset is intended to be a full compilation of crashes that resulted in injury, where SWITRS “processes all reported fatal and injury crashes that occurred on California’s state highways and all other roadways, excluding private property” (CHP, 2021). Police-reported crashes that are property damage only (PDO) are not fully accounted for in SWITRS due to the fact that “some agencies report only partial numbers of their PDO crashes, or none at all” (CHP, 2021). Under California Vehicle Code § 20008, injury crashes must be reported to CHP, and there is no requirement that PDO crashes be reported. This underreporting feature in California data is discussed further in the paper, but it is not clear whether Los Angeles and San Francisco fully report all of their PDO crashes to SWITRS. For VMT estimates, three data sources were used. In Arizona, ADOT maintains the certified public miles (CPM) for roadways statewide (ADOT, 2023b). In California, the California Department of Transportation (Caltrans) maintains Public Road Data (PRD) (Caltrans, 2023). The annually compiled VMT data from both Ar
2.2 Data Processing
2.2.1 Driver Datasets
Shown in Table 2, four main driver datasets of matched mileage-crashes were generated to estimate crashes and miles traveled in order to answer this study’s research questions. Aggregate statistics were then generated from each of these combined datasets. Because FARS is a census of all fatal crashes, CRSS was not needed to generate national fatal crash rates, and FARS was directly merged with FHWA mileage estimates.
| Geographic Region | Severity Level | Crash Source | Mileage Source |
| National | All Police-Reported | CRSS/FARS | FHWA |
| Fatal Only | FARS | FHWA | |
| Maricopa County | All Police-Reported | ADOT | CPM + FHWA |
| San Francisco County | All Police-Reported | SWITRS | PRD+FHWA |
| Los Angeles County | All Police-Reported | SWITRS | PRD+FHWA |
2.2.2 ADS Comparable Drivers
To isolate a comparable driving population to active, commercially-available ADS deployments, the current study considered two dimensions, road type and vehicle type, when selecting mileage and crash data. Each crash and mileage data source has its own unique set of data features (e.g., roadway definition, vehicle type definitions) for properly considering these two dimensions. When doing this analysis, the data should be subsetted in a way that (a) is comparable (calibrated) to the ADS deployment and (b) allows matching between the mileage and crash data. Appendix A.1 contains all subsetting procedures, including the specific data elements relied upon..
For road type, although testing extends to higher speed roads, commercially-available Rider Only ADS technologies in the US currently only operate on “surface streets”, where speed limits are generally lower. Accordingly, highways and interstates were identified and excluded in the mileage and crash data.
For vehicle type, currently, commercially-available, ADS deployments consist exclusively of light-duty passenger vehicles, so accordingly, cars and light trucks / vans (LTV) were identified within the available data (e.g., heavy vehicles, low-speed vehicles, and motorcycles were excluded). These passenger vehicles were also identified for inclusion in both the mileage and crash data.
2.2.3 Crash Severity Level
Rates for several different crash severity levels were generated. We independently examined crashed vehicle rates of:
-
1.
Any property damage or injury: an involved crash with “any property damage, injury, or fatality,”
-
2.
police-reported: the involved crash was reported to police,
-
3.
any-injury-reported: any involved person sustained some level of reported injury,
-
4.
tow-away: any of the involved vehicles was towed from the scene, and
-
5.
fatality: any involved person was fatally injured.
Naturally, police-reported crashes were identified by their inclusion within the CRSS, FARS, ADOT, and California SWITRS crash databases. As noted previously, the CHP annual SWITRS report explicitly notes that, for certain agencies, the police-reported PDO crashes may not be fully accounted for, which would lead to an underestimation of associated police-reported rates for potentially affected areas (Los Angeles and San Francisco County). This limitation is discussed later in the paper. For both national estimates and Maricopa county, the police reported numbers presented are expected to reflect the true volume of crashes that resulted in a police-report.
This study focused on generating a benchmark crash rate of any property damage or injury for comparison to SGO-reported ADS crashes. Again, SGO refers to the NHTSA Standing General Order 2021-01 that requires ADS developers to report “any physical impact between a vehicle and another road user (vehicle, pedestrian, cyclist, etc.) or property that results or allegedly results in any property damage, injury, or fatality” (NHTSA, 2023b). This reporting requirement applies to both crashes involving the ADS, and crashes where the ADS “contributes or is alleged to contribute (by steering, braking, acceleration, or other operational performance) to another vehicle’s physical impact with another road user or property involved in that crash.” The latter cannot be readily determined from police-reported databases because non-damaged vehicles are not recorded in most crash databases, so this study focused only on generating a benchmark crash rate for only vehicles that sustained damage in a crash, and not vehicles that contributed to the crash but were not damaged.
Determining any property damage or injury rates from police-reported data requires a correction to account for underreporting and reporting thresholds. To generate this any property damage or injury rate, we used two independent underreporting adjustment methods. First, we leveraged underreporting estimates derived by Blincoe et al. (Blincoe et al., 2015, Blincoe et al., 2023) that were created using a combination of telephone surveyed persons (M. Davis & Co, 2015) and insurance records. In the telephone survey, respondents were asked to self-report crashes that resulted in any type of damage with no guidance on a minimum threshold. In this study by NHTSA, Blincoe et al. (2023) found that approximately 60% of PDO crashes and 32% of non-fatal injury crashes were not police-reported. We will refer to this correction as the “Blincoe” estimate. Second, Blanco et al. (2016) leveraged the SHRP-2 NDS study to further refine the Blincoe estimate. The motivation was that the observed NDS crash data could be more accurate than relying on surveyed persons for generating an underreporting correction, and also be more accurate than insurance data, which has some risk of underreporting of low amounts of property damage. In an analysis of SHRP-2 crashes detected, Blanco et al. (2016) estimated that 84% of PDO crashes were not reported. For this “Blanco et al.” estimate, we used 84% underreporting of PDO crashes, and the Blincoe et al. 32% underreporting estimate for non-fatal injury crashes. Fatality crashes did not receive an adjustment factor when generating the rates, as it is assumed that all fatal crashes are reported. Some CRSS crashes had an unknown severity level. An imputation method for “unknown” severity cases was used that estimated the underreporting amount using the relative proportions of PDO and non-fatal injury crashes. Additional details and a complete listing of the associated adjustment factors can be found in Appendix A.2.
Any-injury-reported crash rates, where an Injury occurred, were identified using the “KABCO” Injury classification scale for all driver datasets (GHSA & NHTSA, 2017). Specifically, only crashes with a reported injury level (“K”, “A”, “B”, or “C”) were included to generate these crash rates. In addition, CRSS crashes with “Injured, Severity Unknown” (MAX_SEV equal to 5) were included. The non-fatal injury crash underreporting adjustment by Blincoe et al. (2023) was applied to the non-fatal injury crashes.
A tow-away crash is one in which any vehicle involved was towed away from the crash scene. Tow-away crashes are not mutually exclusive from any-injury-reported crashes, so there is overlap in some crashes that contribute to both the tow-away crash rate and any-injury-reported crash rate. Tow-away crashes were readily identifiable in both state crash databases at the crash-level (ADOT: “TowAwayFlag”; SWITRS: “tow_away”).
For national rates, the “towed” variable (equal to 2, 3, or 7) present in both CRSS and FARS for every vehicle was used. If any vehicle within a given crash was towed, the crash was indicated to be a tow-away. Fatality crashes were identified from state databases using the “K” classification in the KABCO crash severity score. All crashes in FARS are, by inclusion, fatal crashes.
2.3 Statistical Power Analysis
ADS crash data can be compared to benchmarks for any property damage or injury, police-reported, and any-injury-reported crashes. In order to investigate how many miles would need to be driven to have a high probability of showing retrospective safety impact at a statistically significant level, a power analysis was performed. Consider a fictive ADS which has a known crashed vehicle rate that is some percentage of the human benchmark. After accumulating some amount of VMT, an expected number of crash incidents can be estimated by multiplying the assumed rate by the number of miles and rounding to the lowest integer value (i.e., floor routine).
Using the method described in Gu et al. (2008) and implemented in the R PASSED package (Li et al., 2023), we estimated the approximate mileage required for 80% statistical power using a 2-sided test with . In some cases, the method implemented in the PASSED library failed to find a solution. When this happened, we substituted a calculation based on the normal approximation to the Poisson distribution.
For this exercise, we used the national benchmark crashed vehicle rates for any property damage or injury, police-reported, any-injury-reported. In addition, a rate of injury crashes with a maximum Abbreviated Injury Scale (AIS) of 2 or greater (MAIS2+) was approximated by modeling that these types of injuries occur approximately at a frequency of 10 times the rate of fatal crashes (Blincoe et al., 2023). Given the large gap between any-injury-reported and fatal crashed vehicle rates, it is useful to set an intermediate injury rate. Estimating MAIS2+ rates is difficult in-practice, because AIS must be encoded by trained personnel using hospital records and is generally not available in most police-reported crash databases. The associated mileage with these national benchmarks (2.1 trillion miles) is orders of magnitude higher than the assumed ADS mileages used in this exercise (billions of miles). So, although this test is a two-sided statistical test, in practice the result is almost indistinguishable from a one-sided test where the benchmark rate is assumed as a quantity without any confidence interval.
3 Results
Figure 1 shows this study’s ADS-calibrated benchmarks. Table 3 shows the values of these computed benchmarks with intermediate crash counts, mileages, and crashed vehicle rates, prior to controlling for road and vehicle type. The relative effect of controlling for geo-specificity, vehicle type, and road type was examined.
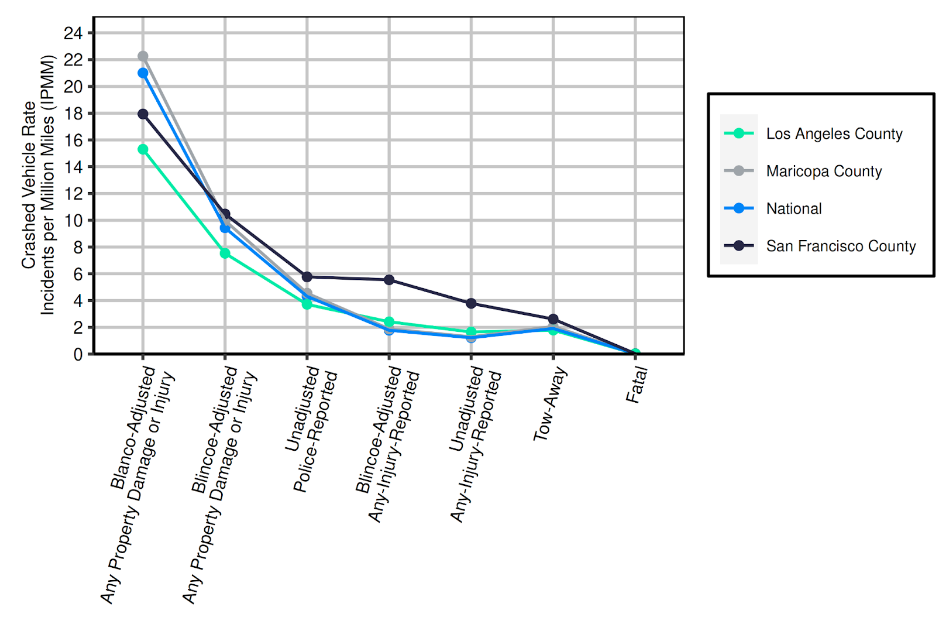
3.1 ADS-Comparable Benchmarks Across Different Geographic Regions
ADS comparable rates (crashed passenger vehicles on surface streets) were successfully generated for any property damage or injury, police-reported, any-injury-reported, tow-away, and fatal crashes. The effect of geographic region on the data was notable at multiple severity levels. When examining underreported adjusted any-injury-reported vehicle crash rates, all ADS driving regions had higher crash rates than the adjusted national average. San Francisco had the highest crash rate with 5.55 incidents per million miles (IPMM), which was approximately three times higher than the national average (1.78 IPMM). Maricopa County’s rate (1.88 IPMM) was approximately 6% higher than the national average. Los Angeles county (2.55 IPMM) had a crashed vehicle rate approximately 43% higher than the national average.
3.2 Vehicle and Road Type Effects
Passenger vehicles tended to have a higher crash rate than the overall crashed vehicle rate, which included passenger vehicles, heavy vehicles, and motorcycles. Nationally, on all roadways, the police-reported IPMM was 5% higher for passenger vehicles than all crashed vehicles (prior to subsetting by vehicle type). Also, Maricopa county (1% higher), San Francisco county (3% higher), and Los Angeles county (7% higher) all had a higher passenger vehicle crash rate than all vehicle crash rate. Surface streets tended to have a higher crash rate when compared to all roadways, which includes highways. This was examined by comparing the police-reported passenger vehicle crash rate before and after controlling for road type. Nationally, this surface street passenger vehicle crash rate was 18% higher than the all road crash rate. In all county-level evaluations, the surface street crash rate was higher by a range of 10% (for Maricopa County) to 34% (for San Francisco County).
| National | Maricopa County | San Francisco County | Los Angeles County | |||||
| All Police-reported | Mileage | 3,132,411 Mmi | 41,291 Mmi | 2,238 Mmi | 69,643 Mmi | Intermediate Values | ||
| Crashes | Unadjusted | 6,104,617 | 86,747 | 5,776 | 108,708 | |||
| All Vehicles, Any Type (IPMM) | Unadjusted | 10,846,125 | 168,985 | 9,312 | 196,466 | |||
| (3.46 IPMM) | (4.09 IPMM) | (4.16 IPMM) | (2.82 IPMM) | |||||
| Crashed Passenger Vehicles | All Roads | Mileage | 2,769,006 Mmi | 37,537 Mmi | 1,934 Mmi | 60,180 Mmi | ||
| Police-Reported (IPMM) | Unadjusted | 10,068,598 | 155,390 | 8,306 | 182,140 | |||
| (3.64 IPMM) | (4.14 IPMM) | (4.29 IPMM) | (3.03 IPMM) | |||||
| Surface Streets | Mileage | 2,109,149 Mmi | 24,224 Mmi | 927 Mmi | 28,445 Mmi | ADS Benchmarks | ||
| Any Property Damage or Injury (IPMM) | Blincoe Adjusted | 19,901,217 | 241,568 | 9,703 | 214,233 | |||
| (9.44 IPMM) | (9.97 IPMM) | (10.5 IPMM) | (7.53 IPMM) | |||||
| Blanco Adjusted | 44,307,166 | 539,276 | 16,629 | 435,328 | ||||
| (21.0 IPMM) | (22.3 IPMM) | (17.9 IPMM) | (15.3 IPMM) | |||||
| Police-Reported (IPMM) | Unadjusted | 9,098,658 | 110,207 | 5,350 | 105,625 | |||
| (4.31 IPMM) | (4.55 IPMM) | (5.77 IPMM) | (3.71 IPMM) | |||||
| Any-Inury-Reported (IPMM) | Unadjusted | 2,570,569 | 31,210 | 3,512 | 46,958 | |||
| (1.22 IPMM) | (1.29 IPMM) | (3.79 IPMM) | (1.65 IPMM) | |||||
| Blincoe Adjusted | 3,755,156 | 45,546 | 5,143 | 68,657 | ||||
| (1.78 IPMM) | (1.88 IPMM) | (5.55 IPMM) | (2.41 IPMM) | |||||
| Tow-Away (IPMM) | Unadjusted | 4,031,590 | 50,007 | 2,425 | 50,927 | |||
| (1.91 IPMM) | (2.06 IPMM) | (2.62 IPMM) | (1.79 IPMM) | |||||
| Any Fatality | Unadjusted | 41,719 | 605 | 31 | 635 | |||
| (22.5 IPBM) | (25.0 IPBM) | (33.2 IPBM) | (22.3 IPBM) | |||||
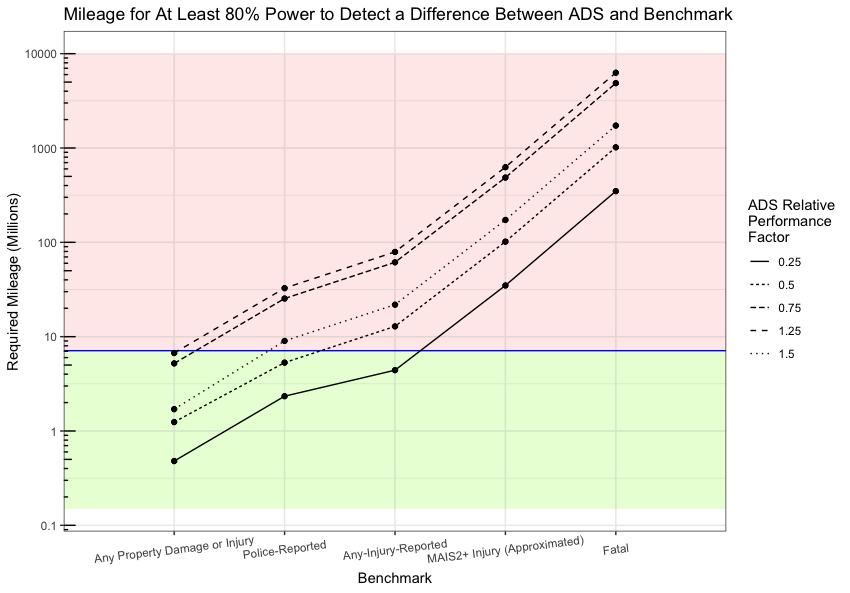
3.3 Statistical Power Analysis
Table 4 shows the results of the statistical power analysis for determining the approximate number of miles needed to find statistical significance relative to national benchmarks. Figure 2 shows the same data as in Table 4 graphically. The analysis demonstrates that millions of miles are needed to determine statistically significant differences at the any property damage or injury, police-reported, and any-injury-reported crash severity levels. Fictive ADS crash rates closer to the benchmark rate require more miles to establish statistical significance. For the approximated MAIS2+ injury rate, the required ADS VMT to establish statistical significance ranges from tens to hundreds of millions of miles, and the fatal outcome requires hundreds of millions to billions of miles of driving are needed. The number of miles needed to reach statistical significance are the same for a fictive ADS that has a crashed vehicle rate 1%, 10%, or 25% the benchmark because in all these cases, zero crashes are expected up to the number of miles required for statistical significance. An important conclusion from Table 4 is that both the magnitude of the the benchmark rate and the magnitude of the relative ADS performance difference determines the VMT required for statistical significance.
| Fictive ADS with Crashed Vehicle Rate Relative to Human Benchmark | |||||||
| 1% | 10% | 25% | 50% | 75% | 125% | 150% | |
| Any Property Damage or Injury | 0.2 | 0.3 | 0.5 | 1.2 | 5.2 | 6.7 | 1.7 |
| Police-Reported | 1.0 | 1.4 | 2.3 | 5.3 | 25.4 | 32.7 | 9.0 |
| Any-Injury-Reported | 2.4 | 2.4 | 4.4 | 12.9 | 61.4 | 79.1 | 21.8 |
| MAIS2+ Injury (Approximated) | 18.9 | 18.7 | 34.9 | 101.7 | 486.0 | 626.2 | 172.7 |
| Fatal | 189 | 187 | 349 | 1017 | 4,869 | 6,280 | 1,728 |
4 Discussion
The results provide sets of ADS comparable human crash benchmarks across multiple geographic markets, where SAE level 4 ADS-equipped ride-hailing fleets are currently deployed. Crash rates for several outcome levels were presented. Any property damage or injury crash rates were notably the highest of the crash rate outcome levels. Fatality crash rates were the lowest. The importance of controlling for geographic region, vehicle type, and road type in the computation of benchmarks are quantitatively demonstrated to be influential covariates. Failing to control for each of these features when generating ADS-comparable benchmarks was generally found to cause an overestimation of human driving performance (i.e., would result in a lower-than-actual human crash rate) within the current ADS ODD.
In the process of both reviewing the literature on this topic and generating the benchmarks above, we identified a common mathematical error when calculating an ADS-comparable crash rate (Section 4.1). Additionally, we noted multiple opportunities for biases that can be present when generating benchmarks: (1) bias endemic to the raw data for which the researcher must adjust through analysis (section 4.2), and (2) bias introduced by the researcher’s analytic choices (section 4.3). The biases identified are not exclusive to police-reported data, but this data source is particularly prone. A discussion of the results is presented in the following sections alongside pathways through which biases can occur. We additionally provide discussion on how analyses may properly consider and adapt for these challenges.
4.1 Measuring Vehicle Crash Rates
We identified multiple publications that improperly compared human crash-level rates to ADS vehicle-level rates (Banerjee et al., 2018; Blanco et al., 2016; Cummings, 2024; Favarò et al., 2017; Kalra and Paddock, 2016; Schoettle and Sivak, 2015). Crash rates derived from ADS data represent the number of times an ADS crashes for some amount of VMT (a vehicle-level or driver-level crash rate). The appropriate benchmark comparison to this ADS rate would also be a vehicle-level crash rate, or the number of times human drivers crashed over some amount of VMT.
In this undercounting of the human driver crash rate, rather than determine the number of human drivers who crashed (a vehicle-level or driver-level rate), these past studies determined the number of overall crashes (a crash-level rate). The total number of crashes is not equivalent to the total number of drivers that crashed, because crashes, more often than not, involve multiple vehicle drivers. Using crash counts instead of the number of crashed vehicles leads to undercounting of crashed vehicle rates, which specifically underestimates the human crash rate (a better safety performance than in reality) and does not represent the number of human drivers who crashed divided by the mileage they had accumulated.
In Young’s (2021) review of multiple prior benchmarking studies, the author claimed that a vehicle-level crash rate is improper but failed to provide any physical or mathematical reasoning. This was the only acknowledgement of incongruence in crash rate calculations (crash-level vs. vehicle-level) between studies that the authors could find when examining the literature. Young’s (2021) assertion, however, is incorrect. As an exercise, consider a town of 6 vehicles (A, B, C, D, E, and F) that each drive 2,000 miles in a year for a total of 12,000 VMT in the town. Over the course of that year, two of the vehicles, A and B, get into a crash with one another. In a separate incident, vehicle C also runs off the road, and has a crash with a fixed object. There are no other crashes. We want to know: how many times do drivers in this town crash per VMT? In the incorrect computation, the crash count would be “2”, and the following conclusion would be drawn: drivers crash once every 6,000 VMT. This formulation discounts the fact that there were two crashes partners in the crash between vehicle A and B. Imagine that each of these vehicles was equipped with sensors that can detect crashes (like an event data recorder or a perception system) and all mileage is being tracked onboard. At the vehicle-level, we would have observed “3” crashed vehicles over the course of 12,000 miles, and this would draw the conclusion: drivers crash once every 4,000 VMT. This is exactly the way vehicle crash rates are computed in NDS studies and with ADS fleets: the number of times the driver(s) crashed over some amount of VMT. This fictitious example shows how easy it is, on one hand, to compute very different crash rates out of the same dataset and, on the other, how nuanced the process for computing appropriate performance crash rates is.
All of these referenced prior works who compared crash-level benchmark rates with vehicle-level ADS rates used US national data sources to derive a benchmark. As an example, using the 2021 national police-reported crashes and VMT in the current study, there were 6.1 million police-reported crashes in 2021 over 3.1 trillion VMT. These 6.1 million crashes had a total of 10.9 million crashed vehicles, which computes to 3.46 police-reported crashed vehicles per million miles (an average of 1.78 drivers in every crash). The result is that the vehicle-level rate is 78% higher than the crash-level rate using the national crash statistics. Therefore, comparing a benchmark crash-level rate to an ADS vehicle-level rate could easily lead to erroneous conclusions.
Another important quoted rate is the number of fatalities (fatally injured persons) per VMT. In 2021, there were 42,939 people fatally injured in crashes on U.S. public roadways, which equates to a fatality rate of 1.37 persons per 100 million VMT (Stewart, 2023). This fatality rate represents the number of persons killed over an entire population’s VMT, which is inherently different from a crashed vehicle rate - the number of times a vehicle was involved in a fatal crash divided by the number of miles driven. In Kalra and Paddock’s (2016) influential study computing the amount of driving miles needed for “demonstrating autonomous vehicle safety,” the fatality rate was incorrectly used to represent the vehicle crash rate. In 2021, there were 61,332 vehicles involved in fatal crashes in the U.S., which computes to 1.96 vehicles (or drivers) involved in fatal crashes per 100 million VMT (crashed vehicle rate). The U.S. vehicle fatal crash rate was 43% higher than the fatality rate in 2021.
Few of the previously published studies correctly compared an ADS crashed-vehicle rate to a benchmark crashed-vehicle rate. A study done by Teoh and Kidd (2017) compiled the police-reported crash data at the driver-level for comparison to the ADS fleet crash rates. In their study, Teoh and Kidd (2017) present the benchmark data in “human-driven passenger vehicles involved in police-reported crashes per million VMT.” Similarly, Lindman et al. (2017) used the Swedish Transport Accident Data Acquisition (STRADA) police-reported database to estimate the required driving mileage for measuring statistically significant differences in crash rates between automated vehicles and a benchmark. The benchmark from Lindman et al. (2017) also correctly considered the crash data at the vehicle-level.
4.2 Bias in Data
Police-reported crash and public mileage data can be invaluable resources in generating crash rate benchmarks. However, as with any data set, diligence is required in preparing and analyzing the data. Due to the data sets’ inclusion criteria and surveillance approach, an unadjusted or inappropriately subsetted dataset may contain biases which can affect study results.
4.2.1 Information Bias
Information bias occurs when there are issues or inadequacies in the way through which data is obtained, and particularly when those issues or inadequacies exist for only one exposure group (i.e. for human drivers only or for ADS vehicles only) (Gordis, 2000). When data quality varies between exposure groups, it can lead to incorrectly calculating risk. Information bias can create bias within the raw data (as discussed in 4.2.1.1 with surveillance bias and 4.2.1.2 with reporting bias, both types of information bias) that can be mitigated through methodology strategies (as discussed in 4.2.1.3).
4.2.1.1 Surveillance Bias and Reporting Thresholds
Surveillance bias, a type of information bias, occurs when the type and quality of data collected through passive or active monitoring systems differs in some way for one group (i.e., ADS vehicles) compared to another group (i.e., human driven vehicles) (Gordis, 2000). This bias, which is endemic to the raw data, can often result in differences in the range of outcomes detected for one group over another.
ADS are required to report a crash involving “physical impact” that “results or allegedly results in any property damage, injury, or fatality” as a part of the NHTSA SGO reporting (NHTSA, 2023b).
This study relied on police-reported crash data, which has a higher severity reporting threshold than the SGO. A crash involving human-driven vehicles can be reported to and by police if it meets a given threshold. This reporting threshold varies by jurisdiction. For example, California and Arizona have a $1,000 and $300 reporting threshold, respectively, while states like Pennsylvania require a vehicle to have been towed away from the scene (Blincoe, 2023). The differences in reporting thresholds by geographic region make it especially important to leverage police-reported crash data from the actual jurisdiction of interest.
This study generated an any property damage or injury crash rate for potential comparison to ADS crash rates. Due to higher reporting thresholds, most SGO-reportable crashes are not police-reportable (Victor et al., 2023; Kusano et al., 2023). If the human police-reported crash rate is assumed to be equivalent to the any property damage or injury rate (i.e., no adjustment is made), the computed any property damage or injury crash rate would be underestimated (i.e., a better human safety performance than in reality).
Additionally, systematic underreporting of police-reported PDO crashes to SWITRS (California’s state crash database) adds an additional layer of surveillance bias not addressed by this study’s underreporting corrections. Young (2021) was the only researcher we could identify that noted this gap in SWITRS reporting, where he specifically examined Mountain View (the location where much of the TO ADS driving was occurring at the time) Police Department underreporting (mostly PDO) crashes to CHP for inclusion in SWITRS. To reiterate this limitation, the SWITRS database, by design, is intended to capture all reported injuries and fatalities. With regards to PDO-level crash reports, “some agencies report only partial numbers of their PDO crashes, or none at all” (CHP, 2021). This is particularly troubling given that this would artificially deflate both SGO reportable and police-reported estimates - another underestimation-inducing bias brought on by the available human crash data. From the available literature and data tables, we were unable to identify if this PDO reporting to SWITRS applied to San Francisco and Los Angeles counties. We did, however, note that the proportion of PDO (no injuries) to any-injury-reported crashes varied between San Francisco and Los Angeles despite being located in the same state and having the same nominal reporting threshold. When looking at passenger vehicles on surface streets, approximately one-half (52%) of SWITRS reported crasheswere PDO in Los Angeles, whereas PDO crashes in San Francisco were only one-third (33%) of the total PDOreported events. For comparison, over two-thirds of Maricopa County (72%) and national (71%) police-reported crashes were PDO. Arizona is likely influenced by the lower PDO reporting threshold, and there are a range of reporting thresholds used nationally. It is not clear whether these differences are due to (a) systematic reporting differences or (b) heterogeneity in the proportion of any-injury-reported to PDO crashes. The explicit SWITRS requirement that it “processes all reported fatal and any-injury-reported crashes that occurred on California’s state highways and all other roadways, excluding private property” indicates that this data is most useful when examining higher severity crash types, and not intended for PDO comparisons (CHP, 2021).
4.2.1.2 Reporting Bias and Underreporting
Reporting bias occurs when one group is less likely or less able to report an exposure (i.e. a crash) compared to the other group (Gordis, 2000). This creates a bias in the raw data for which analyses must adjust.
Police-reportable crashes are often simply not reported by involved persons to the police in human driver only crashes. For ADS operators, contact events can be detected by an advanced set of vehicle sensors and assessed, which, along with established internal reporting procedures, substantially reduces the likelihood of an unreported (police-reportable) crash. This underreporting of human crashes leads to bias, whereby, because humans appear to be better drivers than they are, the human benchmark rate is artificially lower.
There are many reasons why a police-reportable, human-only crash may not be reported to police (M. Davis & Co, 2015). For a police-reported crash to be counted for human drivers, the police have to be notified of an event, and some reporting threshold must be satisfied. In general, higher severity crashes are more likely to be reported to police, where factors such as emergency services, tow-away status, and property damage all influence likelihood of being reported (Blincoe et al., 2023). It is also important to consider that property damage is being assessed on-scene by a reporting officer, where damage may or may not be readily apparent and a judgment call must be made without a comprehensive assessment of damage. Other factors like availability of resources may also impact the likelihood a police report is generated or the accuracy of the information in filed reports.
For any-injury-reported crashes, unreported events still occur. Blincoe et al. (2023) found that approximately one out of every three crashes, nationally, that involved an any-injury-reported were not reported to police. Notably, 27% and 6% of moderate (MAIS2) and seriously injured (MAIS3) persons, respectively, are estimated to not be reported to police (Blincoe et al., 2023). In another study, the San Francisco Department of Public Health (SFDPH) collaborated with the San Francisco Municipal Transportation Agency (SFMTA) on a “Vision Zero SF” project examining high injury locations within San Francisco (SFDPH, 2017). Their work developed a comprehensive Transportation-related Injury Surveillance System (TISS) to monitor reported injuries in both police-reported data and through hospital records. There was specific emphasis on “severe” injuries, which was defined by presentation of several predefined injuries, any visit to a hospital trauma center, or an injury severity score (ISS) of 15 or greater. When examining hospital records against police-reported data, their analysis found 39.2% of vehicle occupants, 27.7% of pedestrians, and 33.1% of cyclist riders with severe injuries caused by motor vehicle crashes did not have an associated police report by the San Francisco Police Department.
4.2.1.3 Strategies for Reducing Information Bias Effects
There are two general strategies that can be used to bridge the issues of information bias: make ADS data more comparable to human driving data by looking only at ADS crashes that are severe enough to have sufficiently high likelihood of reporting in the human crash data, or make human driver data more comparable to ADS data by performing an underreporting correction (Blanco et al., 2016; Schoettle and Sivak, 2015).
Either of these approaches mitigate the effects of information bias. This study used multiple sources of underreporting estimates to generate an SGO-reportable benchmark from police-reported data. Those generated estimates did vary by a considerable margin, and it is not clear how applicable the adjustment factors, which are derived from representative national surveys, are to the current ADS operating locations of San Francisco, Maricopa, and Los Angeles counties.
As mentioned previously, the alternative to relying on police-reported data is to rely upon NDS data or insurance data when evaluating lower severity crash outcomes. Notably, recent analysis by Flannagan et al. (2023) using a 5.6 million mile NDS dataset (mostly of ride-hailing drivers) taken from San Francisco roadways provides a unique opportunity to examine these lower severity crash rates (e.g., any property damage or injury crashes). It is our understanding that this is the only formally published NDS human benchmark data taken directly from the San Francisco geographic area. The researchers generated several ODD-specific crash rates, including (a) an overall crash rate (“any insurance claim crash with crash damage present”) and a (b) police-reportable rate. The overall crash rate from Flannagan et al. (2023) appears to be comparable to the any property damage or injury crash rate generated in the current study. Flannagan et al. (2023) estimated that the NDS fleet experienced 64.9 crashes per million miles, which is multiple times higher than the any property damage or injury crash rate estimated in the present study for San Francisco (10.5 to 17.9 IPMM). Potential underreporting of PDO police-reported crashes for San Francisco in SWITRS, discussed previously, might explain some of this difference. It is also possible that some of the included crashes used to generate this NDS rate would not have been SGO reportable. The NDS ride-hailing fleet may have been more concentrated in areas with a higher crash rate (e.g., more densely populated areas).
As more miles are driven by ADS fleets, we expect that the police-reported data will become increasingly valuable to the safety community for statistically evaluating high severity crash rates. Likelihood of reporting in the human crash data is better as severity increases, so the accuracy and precision of the crash benchmark rate estimates will improve with increasing severity. Higher severity outcomes, naturally, also represent more harm to the general population, and are generally of more interest to the safety community.
4.2.2 Volunteer Bias and Customer Profiles
Volunteer bias (also referred to as self-selection bias), a type of selection bias, occurs when those who volunteer for one exposure group (i.e. individuals taking an ADS) systematically and saliently differ from the control group (i.e. human drivers) (Gordis, 2000). This is a problem endemic to the data. Specifically, the population who use ADS for transportation may differ from the general population, and this difference could result in differences in crash outcomes (such as injuries, vehicle damage, or property losses). For example, the age profile of ADS technology users may differ from the population taking human-driven transport, and age-associated comorbidities can confound crash outcomes (Li et al., 2003; Mcmurry et al., 2021). Additionally, in ridehail operations, the ADS will have no occupants at times.
Risk-based measures of safety should be considered as an alternative to outcome measures. Prior works, including the current study, have generally demonstrated the utility of “outcome” data in retrospective safety assessment. Outcomes, such as injuries, vehicle damage, or property losses, are highly dependent on individual or vehicle characteristics (e.g., person age, sex, seat belt use) and, to a certain degree, chance. The safety community has historically considered injury risk-based assessments as an alternative approach to measuring safety impact (Campolettano et al., 2023; Kullgren, 2008; Kusano & Gabler, 2012; Kusano et al., 2022; Scanlon et al., 2017; Scanlon et al., 2022). Using this approach, the dynamics of the crash are used to assess injury risk (McMurry et al., 2021; Schubert et al., 2023; Lubbe et al., 2022). The benefits of this approach is (a) it can provide earlier indication of safety performance on injury-relevant crashes and (b) crash prevention and mitigation can be more explicitly measured by controlling for other influential covariates.
4.3 Bias from Analytical Choices
Bias can be introduced into study results through decisions made during data analysis. In ADS benchmarking, we observed that this can occur primarily through the choices made in trying to make the human driver data more comparable to AV data (i.e., exposure and events). Neglecting to adjust properly or adjusting inappropriately can bias results.
4.3.1 Selection Bias and ODD Matching
Selection bias occurs when the two groups of interest (e.g. humans drivers and ADS vehicles) are not selected in the same way (Gordis, 2000). Within this context of ADS vehicles, this can occur when two groups were not selected from the same ODD. This is a clear bias in the way in which the raw data is collected.
The driving context influences crash and injury rates. The current ADS fleets are implemented on passenger vehicle platforms, restricted to specific geographic regions, operating on surface street roadways, and some fleets are even restricted by time-of-day. Even after controlling for these restrictions, the driving exposure of the ADS deployments are not inherently equivalent to the exposure of the benchmark crash population. For example, ride-hailing fleets may operate more at night, in areas of denser traffic, or areas with more vulnerable road users than the general driving population. This current study does not account for the effect of the driving environment, and its effect on the benchmark.
The direction of potential information biases (underestimating or overestimating crash rates) will vary based on the challenges of the environment from which ADS data and human driver data is gathered, and the heterogeneity within the environment. By using available mileage data and police-reported crash data, alone, we are limited in how narrowly this data can be analyzed to properly account for relevant driving environment features. This study does attempt to control for some driving environment features, such as geographic region (county-level), vehicle type (passenger vehicles), and road type (non highways). The effect of the unaccounted for driving environment factors discussed above is not known and additional data sources would be needed to account for these factors.
Currently, ADS fleets tend to be deployed in dense urban settings with complex scenarios and vulnerable road users (e.g. San Francisco). This study demonstrates that urban crash rates are considerably higher than the general US crash rate. In other words, failing to account for differences in crash rate due to the urban geographic environment biases the data to overestimate human driver performance (i.e., a lower than actual crash rate). In addition, this study demonstrates that failing to account for road type (surface streets only) and vehicle type (passenger vehicles only) also leads to an underestimation of the benchmark crash rate.
Other relevant features, such as time-of-day, weather, day of the week, vulnerable road user presence, and traffic density, can also influence crash rates (Martin, 2002; Regev et al., 2018; Qiu et al, 2008). To generate crash rates, both the crash and exposure data must contain the data parameters to account for the other influential factors (i.e., the data on those factors must be recorded in the data). Due to limitations in the available data parameters, the publicly available crash and mileage data sources used in the current study cannot be used, alone, to correct for these additional sources of systematic bias.
4.3.2 Exclusion Bias and Misclassification Bias
Exclusion Bias is when eligibility criteria differ for one group of interest versus another or, in how they are applied, do not apply equally to both groups (Gordis, 2000). Within ADS vehicle evaluation, this bias can arise when a type of outcome is excluded from the data, as occurs in Cummings (2023), where fatal crashes are excluded.
Because the endpoints of fatal trips were removed from the event-numerator but the mileage of those trips could not be removed from the exposure-denominator, all fatal crashes were, in effect, re-classified as trips where no crash occurred. This exclusion of only the outcomes but not the miles introduces misclassification bias, which occurs when, due to mistakes and inaccuracies in data collection or processing, subjects’ outcomes are misclassified. These biases may not be a large influence on the results due to the relative rarity of fatal crashes, but they remain important conceptual issues.
4.4 Other Relevant Data Considerations
The current study focused on the general crash population for generating benchmarks. This focus enables the understanding of the net effect of the introduction of the technology on the total population of drivers. Data permitting, researchers should consider additional benchmarks to further explore safety impact. The Flannagan et al. (2023) provides an example of more narrowly focusing on ride-hailing human drivers, which may have more similar driving characteristics to ADS ride-hailing vehicles than the general population. The overall driving population can be analyzed in other ways to assess an even higher standard of driving. For example, a “consistently performing, always-attentive driver” has been demonstrated as a useful high performance bar in ADS assessment of response to imminent high potential severity conflicts (Scanlon et al., 2022). Goodall (2021a) presented a technique for adjusting crash benchmarks for an “error and impairment-free model driver.” This idealized “model driving” crash rate created a benchmark of human driving superior to the overall driving population that exists only during periods of driving (i.e., “sober, rested, attentive, cautious”). There are also other opportunities for better performance crash rates, such as comparing to newer vehicles equipped with the latest safety features. To reiterate, comparing ADS crash rates to a benchmark of the overall crash population, as was generated in the current study, enables an estimate of the actual effect of the introduction of some technology on the current crash data status quo, i.e., retrospective safety impact. Idealized crash rate benchmarks provide additional evaluation criteria that may more closely match societal expectations for driving competency, but do not accurately estimate the effect of a technology on status quo. Additional research is required to establish additional benchmarks beyond overall status quo benchmarks.
Crash data is also subject to a certain degree of missingness in the data that is compiled for a given crash. Factors like missing records or a vehicle driving away from the scene of a crash result in certain crash variables not being coded, such as the type of vehicle, injury status, or damage extent. Researchers should consider various strategies for handling missingness, such as relying on imputed data, when handling police-reported data, and should be aware of how that missingness may introduce bias in the results (Mcmurry et al, 2020). Given that vehicle type was occasionally not specified with enough detail, we relied on a form of imputation for estimating the passenger vehicle crash counts.
Another consideration is that the current study only considered crash and mileage data from 2021. This was the most recent data present across all data sources. Crash rates do vary from year-to-year (Stewart, 2023). Ideally, researchers would match ADS crash rates for some time period to some benchmark rates to the same period, but this lag in police reported crash data becoming available prevents this. In general, national and state police-report databases are published for each complete calendar year, and are typically published several months to years after the calendar year is over. It is possible the COVID-19 pandemic was still affecting travel behaviors in the U.S. in 2021, and it is unclear if 2021 data will be representative of future human crash populations. The results presented from this study should be revisited using future years of data as they become available.
4.5 Safety Impact Considerations for High Severity Crash Outcomes
The statistical power analysis performed in this paper is not unlike the analysis shown in Figure 3 of Kalra & Paddock (2016). As discussed in section 4.1, Kalra & Paddock (2016) improperly used a fatality rate (fatally injured persons per VMT) rather than a vehicle-level crash rate. Additionally, Kalra & Paddock used an earlier year of crash data (2013), and generated benchmark rates that included all vehicle types and driving conditions including freeways, whereas the national estimates from this study are generated for passenger vehicles only and exclude interstate highways. These differences resulted in the national benchmark rates from this study to be slightly larger than those used by Kalra & Paddock (2016) (22.5 IPBM vs 10.9 IPBM for fatal, 1.78 IPMM vs 1.03 IPMM for Blincoe-adjusted any-injury-reported, and 9.44 IPMM vs 3.82 IPMM for Blincoe-adjusted any property damage or injury).Therefore, the analysis presented in this paper and from Kalra & Paddock find approximately similar necessary ADS miles to determine statistical significance.
The conclusion of Kalra & Paddock (2016) was generally that it is infeasible to use public road testing data to draw conclusions about ADS safety performance due to the large number of miles needed. The analysis of Kalra & Paddock (2016) assumed modest differences between the ADS and the benchmark crash rates, using an ADS that has a crash rate of 80% of the benchmark as a reference point. This may have been a prudent reference at the time when only early testing data from ADS was available. The results of early ADS safety impact analysis using RO data (Kusano et al., 2023) suggest that the police-reported and any-injury-reported performance of an ADS fleet operating in RO operations generally have lower crashed vehicle rates compared to the benchmarks (police-reported crashes reduced between 51% and 70%.
Another difference between the statistical power analysis done in this study and Figure 3 of Kalra and Paddock (2016) was that this paper rounded the number of expected events to the next lowest integer, whereas Kalra and Paddock (2016) appeared to have computed the number of miles using fractional event counts. This results in a smooth and monotonically curve with the number of miles needed for significance as a function of ADS performance relative to the benchmark.
This statistical power analysis relied upon estimates of any property damage or injury and any-injury-reported, where an underreporting adjustment was performed. The estimated variance considers only the variance based on observed crashed vehicle counts over a certain VMT, and there is no statistical uncertainty considered for this underreporting adjustment. Accounting for this uncertainty would lead to a higher estimated VMT required for detecting statistical significance.
5 Conclusions
This paper presents human benchmarks for multiple geographic regions and outcome levels that are comparable to available ADS crash data sources to help advance the retrospective assessment of ADS technology. ADS fleets are increasing miles driven, and we are beginning to have an opportunity for statistical evaluation of safety impact. With that opportunity, the safety research community needs to be vigilant about implementation of benchmarks that are comparable to ADS crash data. A review of the existing literature highlights multiple opportunities for error and bias. These common challenges are identified, their effect is quantified, and a methodological solution is presented, which serves to inform the automotive safety community on careful, conservative practices that can be used for crash rate benchmark generation. This study demonstrated that police-reported benchmarks can be generated for various outcomes, and caution should be taken when comparing any property damage or injury, police-reported, and any-injury-reported rates against observed ADS performance. Features like geographic region, vehicle type, and road type all play a role in influencing crash rates. Other features like traffic density, time-of-day, and weather likely also all play a known role and should be considered when further refining benchmark crash rate estimates, but are not available in most current data sources. Lastly, other crash data sources, such as NDS and insurance data, should be considered as complementary sources of data for lower severity crash rate evaluation, where police-reported data typically suffers from underreporting challenges, especially for any property damage or injury outcomes. The presented benchmarks are only one iteration. Researchers, regulators, industry, and experts should consider these results, and have an opportunity to continue to elevate the state-of-the-art of benchmarking.
6 References
.5in1 AAAM (2016). The Abbreviated Injury Scale-2015 Revision. Association for the Advancement of Automotive Medicine.
Arizona Department of Transportation (2023a). 2022 Motor Vehicle Crash Facts for the State of Arizona. The Arizona Department of Transportation, Phoenix, Arizona.
Arizona Department of Transportation (2023b, October). Extent and Travel Dashboard. https://experience.arcgis.com/experience/ac0948fc05224aa8a80313f59a634fde
Arizona Department of Transportation (2023c, October). Records Center. https://azdot.govqa.us/WEBAPP/_rs/supporthome.aspx
Blanco, M., Atwood, J., Russell, S. M., Trimble, T. E., McClafferty, J. A., & Perez, M. A. (2016). Automated vehicle crash rate comparison using naturalistic data. Virginia Tech Transportation Institute.
Blincoe, L., Miller, T., Wang, J.-S., Swedler, D., Coughlin, T., Lawrence, B., Guo, F., Klauer, S., & Dingus, T. (2023). The economic and societal impact of motor vehicle crashes, 2019 (Revised) (Report No. DOT HS 813 403). National Highway Traffic Safety Administration.
Blincoe, L., Miller, T. R., Zaloshnja, E., & Lawrence, B. A. (2015). The economic and societal impact of motor vehicle crashes, 2010 (Revised) (No. DOT HS 812 013).
California Department of Motor Vehicles (2023, October). Autonomous Vehicle Collision Reports. https://www.dmv.ca.gov/portal/vehicle-industry-services/autonomous-vehicles/autonomous-vehicle-collision-reports/
California Department of Transportation (2023). 2021 California Public Road Data: Statistical Information Derived from the Highway Performance Monitoring System. California Department of Transportation
California Highway Patrol (2023, October). Statewide Integrated Traffic Records System. https://iswitrs.chp.ca.gov/
California Highway Patrol (2021). SWITRS 2019 Report: Annual Report of Fatal and Injury Motor Vehicle Traffic Collisions - Preface. California Highway Patrol.
Campolettano, E. T., Scanlon, J. M., & Victor, T. (2023). Representative Pedestrian Collision Injury Risk Distributions for A Dense-Urban US ODD Using Naturalistic Dash Camera Data. In 27th International Technical Conference on the Enhanced Safety of Vehicles (ESV) National Highway Traffic Safety Administration (No. 23-0075).
Cicchino, J. B. (2017). Effectiveness of forward collision warning and autonomous emergency braking systems in reducing front-to-rear crash rates. Accident Analysis & Prevention, 99, 142-152.
Cicchino, J. B. (2018). Effects of lane departure warning on police-reported crash rates. Journal of safety research, 66, 61-70.
Cummings, M. (2024). Assessing Readiness of Self-Driving Vehicles. The 103rd Transportation Research Board (TRB) Annual Meeting, Washington, D.C.
Di Lillo, L., Gode, T., Zhou, X., Atzei, M., Chen, R., & Victor, T. (2023). Comparative Safety Performance of Autonomous-and Human Drivers: A Real-World Case Study of the Waymo One Service. arXiv preprint arXiv:2309.01206.
Dixit, V. V., Chand, S., & Nair, D. J. (2016). Autonomous vehicles: disengagements, accidents and reaction times. PLoS one, 11(12), e0168054.
Favaro, F., Fraade-Blanar, L., Schnelle, S., Victor, T., Peña, M., Engstrom, J., Scanlon, J., Kusano, K., & Smith, D. (2023). Building a Credible Case for Safety: Waymo’s Approach for the Determination of Absence of Unreasonable Risk. arXiv preprint arXiv:2306.01917.
Favarò, F. M., Nader, N., Eurich, S. O., Tripp, M., & Varadaraju, N. (2017). Examining accident reports involving autonomous vehicles in California. PLoS one, 12(9), e0184952.
Federal Highway Administration. (2023a). Highway functional classification concepts, criteria and procedures 2023 Edition.
Federal Highway Administration (2023b). Highway statistics 2021. Washington, D.C.: U.S. Department of Transportation. https://www.fhwa.dot.gov/policyinformation/statistics/2021/
Fildes, B., Keall, M., Bos, N., Lie, A., Page, Y., Pastor, C., … & Tingvall, C. (2015). Effectiveness of low speed autonomous emergency braking in real-world rear-end crashes. Accident Analysis & Prevention, 81, 24-29.
Flannagan, C., Leslie, A., Kiefer, R., Bogard, S., Chi-Johnston, G., Freeman, L., Huang, R., Walsh, D., & Joseph A. (2023). Establishing a Crash Rate Benchmark Using Large-Scale Naturalistic Human Ridehail Data. University of Michigan Transportation Research Institute.
Glassbrenner, D., & Starnes, M. (2009). Lives saved calculations for seat belts and frontal air bags (No. HS-811 206).
Goodall, N. J. (2021a). Comparison of automated vehicle struck-from-behind crash rates with national rates using naturalistic data. Accident Analysis & Prevention, 154, 106056.
Goodall, N. J. (2021b). Potential crash rate benchmarks for automated vehicles. Transportation research record, 2675(10), 31-40.
Gordis, L. (2000). Epidemiology. (2nd Ed). W. B. Saunders Company.
Governors Highway Safety Association & National Highway Traffic Safety Administration. (2017, July). MMUCC guideline Model Minimum Uniform Crash Criteria, 5th edition (Report No. DOT HS 812 433). Available at www.nhtsa.gov/mmucc-1
Gu, K., Ng, H.K.T., Tang, M.L. & Schucany, W.R. (2008), Testing the Ratio of Two Poisson Rates. Biom. J., 50: 283-298. https://doi.org/10.1002/bimj.200710403
Isaksson-Hellman, I., & Lindman, M. (2015). Evaluation of rear-end collision avoidance technologies based on real world crash data. Proceedings of the Future Active Safety Technology Towards zero traffic accidents (FASTzero), Gothenburg, Sweden, 9-11.
Isaksson-Hellman, I., & Lindman, M. (2018). An evaluation of the real-world safety effect of a lane change driver support system and characteristics of lane change crashes based on insurance claims data. Traffic injury prevention, 19(sup1), S104-S111.
Kalra, N., & Paddock, S. M. (2016). Driving to safety: How many miles of driving would it take to demonstrate autonomous vehicle reliability?. Transportation Research Part A: Policy and Practice, 94, 182-193.
Kullgren, A. (2008, September). Dose-response models and EDR data for assessment of injury risk and effectiveness of safety systems. In Proc of Int. IRCOBI Conf., Bern, Switzerland (pp. 3-14).
Kusano, K.D., Beatty, K., Schnelle, S., Favarò, F. M., Crary, C., and Victor, T. (2022). Collision Avoidance Testing of the Waymo Automated Driving System.
Kusano, K. D., & Gabler, H. C. (2012). Safety benefits of forward collision warning, brake assist, and autonomous braking systems in rear-end collisions. IEEE Transactions on Intelligent Transportation Systems, 13(4), 1546-1555.
Kusano, K., Scanlon, J., McMurray, T., Chen, Y., Chen, R., Gode, T., & Victor, T. (2023). Comparison of Wamyo One Rider-Only Collision Data to Human Benchmarks. Waymo LLC.
Li, J., Knigge, R. P., Chen, K., & Leary, E. V. (2021). PASSED: Calculate Power and Sample Size for Two Sample Tests. R Journal, 13(2).
Li, G., Braver, E. R., & Chen, L. H. (2003). Fragility versus excessive crash involvement as determinants of high death rates per vehicle-mile of travel among older drivers. Accident Analysis & Prevention, 35(2), 227-235.
Lie, A., Tingvall, C., Krafft, M., & Kullgren, A. (2006). The effectiveness of electronic stability control (ESC) in reducing real life crashes and injuries. Traffic injury prevention, 7(1), 38-43.
Lindman, M., Isaksson-Hellman, I., & Strandroth, J. (2017, September). Basic numbers needed to understand the traffic safety effect of automated cars. In IRCOBI Conference (pp. 1-12).
Lubbe, N., Wu, Y., & Jeppsson, H. (2022). Safe speeds: fatality and injury risks of pedestrians, cyclists, motorcyclists, and car drivers impacting the front of another passenger car as a function of closing speed and age. Traffic safety research.
Martin, J. L. (2002). Relationship between crash rate and hourly traffic flow on interurban motorways. Accident Analysis & Prevention, 34(5), 619-629
McMurry, T. L., Cormier, J. M., Daniel, T., Scanlon, J. M., & Crandall, J. R. (2021). An omni-directional model of injury risk in planar crashes with application for autonomous vehicles. Traffic injury prevention, 22(sup1), S122-S127.
National Center for Statistics and Analysis. (2022, January). Product information catalog and vehicle listing (vPIC) analytical user’s manual, 2020 (Report No. DOT HS 813 252). National Highway Traffic Safety Administration.
National Center for Statistics and Analysis. (2023a, April). Crash Report Sampling System analytical user’s manual, 2016-2021 (Report No. DOT HS 813 436). National Highway Traffic Safety Administration. National Center for Statistics and Analysis. (2023b, April). Fatality Analysis Reporting System analytical user’s manual, 1975-2021 (Report No. DOT HS 813 417). National Highway Traffic Safety Administration.
National Highway Traffic Safety Administration (2023a). NHTSA File Downloads. United States Department of Transportation. https://www.nhtsa.gov/file-downloads
National Highway Traffic Safety Administration (2023b). Second Amended Standing General Order 2021-01: Incident Reporting for Automated Driving Systems (ADS) and Level 2 Advanced Driver Assistance Systems (ADAS).
Office of Highway Policy Information (2016). Highway Performance Monitoring System Field Manual. U.S. Department of Transportation Federal Highway Administration.
Qiu, L., & Nixon, W. A. (2008). Effects of Adverse Weather on Traffic Crashes: Systematic Review and Meta-Analysis. Transportation Research Record, 2055(1), 139-146. https://doi.org/10.3141/2055-16
Regev, S., Rolison, J. J., & Moutari, S. (2018). Crash risk by driver age, gender, and time of day using a new exposure methodology. Journal of safety research, 66, 131-140.
SAE (2021). J3016: Taxonomy and Definitions for Terms Related to Driving Automation Systems for On-Road Motor Vehicles. https://doi.org/10.4271/J3016_202104
San Francisco Department of Public Health-Program on Health, Equity and Sustainability (2017). Vision Zero High Injury Network: 2017 Update – A Methodology for San Francisco, California.
Scanlon, J. M., Kusano, K. D., Engström, J., & Victor, T. (2022). Collision Avoidance Effectiveness of an Automated Driving System Using a Human Driver Behavior Reference Model in Reconstructed Fatal Collisions.
Scanlon, J. M., Sherony, R., & Gabler, H. C. (2017). Injury mitigation estimates for an intersection driver assistance system in straight crossing path crashes in the United States. Traffic injury prevention, 18(sup1), S9-S17.
Schubert, A., Babisch, S., Scanlon, J. M., Campolettano, E. T., Roessler, R., Unger, T., & McMurry, T. L. (2023). Passenger and heavy vehicle collisions with pedestrians: assessment of injury mechanisms and risk. Accident Analysis & Prevention, 190, 107139.
Stewart, T. (2023, April). Overview of motor vehicle traffic crashes in 2021 (Report No. DOT HS 813 435). National Highway Traffic Safety Administration.
Schoettle, B., & Sivak, M. (2015). A preliminary analysis of real-world crashes involving self-driving vehicles. University of Michigan Transportation Research Institute.
Strandroth, J., Rizzi, M., Olai, M., Lie, A., & Tingvall, C. (2012). The effects of studded tires on fatal crashes with passenger cars and the benefits of electronic stability control (ESC) in Swedish winter driving. Accident Analysis & Prevention, 45, 50-60.
Teoh, E. R., & Kidd, D. G. (2017). Rage against the machine? Google’s self-driving cars versus human drivers. Journal of safety research, 63, 57-60.
Teoh, E. R., & Lund, A. K. (2011). IIHS side crash test ratings and occupant death risk in real-world crashes. Traffic injury prevention, 12(5), 500-507.
U.S. DOT, “National Roadway Safety Strategy” (2022). Retrieved October 2023, from https://www.transportation.gov/nrss/
Vehicle Identification Number (VIN) Requirements, 49 C.F.R. § 565.15 (2022).
Victor, T., Kusano, K., Gode, T., Chen, R., & Schwall, M. (2023). Safety performance of the Waymo rider-only automated driving system at one million miles. Waymo LLC.
Webb, N., Smith, D., Ludwick, C., Victor, T., Hommes, Q., Favaro, F., Ivanov, G., & Daniel, T. (2020). Waymo’s safety methodologies and safety readiness determinations. arXiv preprint arXiv:2011.00054.
Young, R. (2021). Critical Analysis of Prototype Autonomous Vehicle Crash Rates: Six Scientific Studies from 2015–2018. SAE International.
Appendix A Appendix
A.1 Identifying a Comparable Population of Drivers
A.1.1 Surface Streets
Ideally, surface streets would be identified using identical encodings across all crash and mileage datasets. Each mileage and crash table, however, have their own unique set of parameters from which road type can be identified. One convenient lens for identifying non-highways is FHWA’s highway function classification coding (FHWA, 2023a), which is shown in Table 5. Using this coding scheme, our targeted surface street roadways would exclude “Interstates” and “Other Arterials - Other Freeways and Expressways”. Functional system was only available for FARS, ADOT CPM, and FHWA mileage. None of the other mileage and crash datasets use this coding scheme directly.
| Higher category | Functional System |
| Interstate System | Interstates |
| Other Arterials | Other Freeways and Expressways |
| Other Principal Arterial | |
| Minor Arterials | |
| Collectors | Major Collectors |
| Minor Collectors | |
| Local | Local |
Two concurrent goals were optimized for when defining our surface street classification scheme: (1) exclude non-surface street road types and (2) align the mileage and crash data road type definitions to ensure apples-to-apples merging of the two datasets. Alignment of road type definitions between the mileage and crash data limits risk of over or under estimating mileage exposure, which would directly affect the computed ADS crash rate. Table 6 covers the various encodings used to best identify surface streets when forming the various driver datasets.
| Geographic Region | Severity Level | Crash | Mileage |
| National | All police-reported | CRSS: int_hwy equal to 0 FARS: func_sys IN (2:7) | Exclude Interstate |
| Fatal Only | func_sys equals (3:7) | Exclude Interstate and “Other Freeways and Expressways” | |
| Maricopa County | All police-reported | GeocodeOnRoad contains (’Ave’, ’Rd’, ’Blvd’, ’Dr’, ’Pl’, ’St’, ’Ln’, ’Way’, ’Ct’, ’Pkwy’, ’Hwy’, ’Trl’, ’Cir’, ’Loop’,’Calle’,’Via’, ’Mc 85’, ’SR-74’, ’SR-85’, ’SR-87’, ’SR-303’, ’SR-347’, ’SR-88’,’SR-8B’, ’SR-238’, ’SR-153’, ’SR-587’, ’SR-71’, ’SR-188’) OR PostedSpeed 45 mph | Exclude Interstate and “Other Freeways and Expressways” |
| San Francisco County | All police-reported | Chp_beat_type is not equal to (1, 2, 3) | Exclude roadways with state highway jurisdiction |
| Los Angeles County | All police-reported | Chp_beat_type is not equal to (1, 2, 3) | Exclude roadways with state highway jurisdiction |
For all national, non-fatal crash rates, we were limited to only excluding interstates due to limitations in available CRSS variables. Specifically, there is a variable to indicate interstates in CRSS, but no variables to robustly identify all other highway variants. Accordingly, we prioritized aligning the mileage and crash data by only removing interstates. This did result in the national, non-fatal dataset including “Other Arterials: Other Freeways and Expressways.”
For national fatality crash rates, FARS crashes and FHWA mileage directly use functional system coding. In both datasets, we were able to identify and exclude both interstates and “Other Freeways and Expressways.”
Using ADOT data, we were able to identify surface streets using a combination of road name suffix and speed limit, and we attempted to match the manual coding logic to the mileage data, which had a functional system directly encoded.
Lastly, using California data, we excluded all crashes on interstates, state routes, and US highways and all mileage on roadways with state highway jurisdiction. This enabled us to roughly match the mileage and crash data by approximately removing all higher speed roads. There were some lower speed limit stretches of state highways being excluded in both the mileage and crash data.
A.1.2 Passenger Vehicles
In-transit, passenger vehicles were identified in the national and state crash databases. The variables and values relied upon for capturing this passenger vehicle population from the crash databases can be found in Table 7.
| Region | Variable Name & Value | Captures |
| National1 | BODY_TYP in (1:17, 19:25, 28:42, 45:49) | Passenger Vehicle |
| BODY_TYP in (98,99) | Vehicle - NFS | |
| UNITTYPE equal to 1 | In-Transport Status | |
| Maricopa County | BodyStyle in (2:7, 9:26, 30:32, 34:53, 71, 72) | Passenger Vehicle |
| BodyStyle in (94:104, 107:109: 112:114, 116:119) | Vehicle | |
| UnitType equals 1 AND BodyStyle equals (-1, 254, 255) | ||
| UnitAction NOT IN (14, 15) | In-Transport Status | |
| San Francisco and Los Angeles Counties | Stwd_vehicle_type in (A, B, D, E) OR Chp_veh_type_towing in (1, 7, 8, 21, 22, 23, 48, 71:73, 81:83) | Passenger Vehicle |
| Stwd_vehicle_type in (J, M) OR Chp_veh_type_towing in (32, 34:36, 98) | Vehicle - NFS | |
| textttparty_type equals 1 AND Stwd_vehicle_type equals NULL AND Chp_veh_type_towing equals NULL | ||
| move_pre_acc NOT equal to 0 AND Party_type NOT equal to 3 | In-Transport Status |
1 The same variable names and values were used for both CRSS and FARS databases.
We targeted vehicles with a gross vehicle weight rating (GVWR) of 10,000 pounds or less, which is consistent with 49 CFR § 565.15 classification of passenger vehicles (Vehicle Identification Number (VIN) Requirements, 2022). This definition also matches the class-1 and class-2 GVWR classifications readily identifiable from vehicle identification numbers (VIN) and the Class 2 and 3 vehicle types in FHWA highway statistics annual reporting (NCSA, 2022, FHWA, 2023a).
A proportion of the crashed vehicles had enough information to identify the actor as a vehicle, but not enough information to indicate whether or not the vehicle was a passenger vehicle. For these vehicles not further specified (NFS), we imputed vehicle type by applying a weighting factor that represented the total proportion of known vehicles that were passenger vehicles. The computed weighting factors applied to NFS vehicles for national, Maricopa county, Los Angeles county, and San Francisco county were 0.94, 0.91, 0.88, and 0.93, respectively.
In addition, only vehicles “in-transit” were included in this study. Vehicles not “in-transit” were readily identifiable in all datasets and would include, among others, vehicles parked in designated parking, vehicles parked off the roadway, vehicles parked on private property, and working vehicles.
All mileage data sources provided mileage totals across all vehicle types, which includes single trucks, combination trucks, buses, and motorcycles. We relied on the FHWA VM-4 tables to identify which mileage was attributable to passenger vehicles, which are labeled as “passenger cars” and “light trucks”. The VM-4 tables provide independent proportions by both functional systems (broken down by interstate, other arterial, and other), census-defined urban/rural population grouping, and U.S. state (Office of Highway Policy Information, 2016).
For all national mileage estimates, combining the VM-2 and VM-4 tables was straightforward. Both datasets are broken down by functional system, urban/rural designation, and state. The VM-4 proportion of passenger vehicles for these groupings was simply applied to the appropriate cell of the VM-2 table to generate a passenger vehicle-only version of the VM-2 table.
When applying the VM-4 table to both California PRD and Arizona CPM mileage data, the urban VM-4 table was exclusively used for the corresponding U.S. state. Similar to the national crash data, the Arizona CPM mileage data is broken down by functional systems, which enables the proportion of passenger vehicles to be directly applied to the overall mileage estimates. For the California PRD data surface streets, the FHWA VM-4 table “other arterial” and “other” passenger vehicle percentages were averaged together to generate a single percentage of passenger cars on surface streets. This percentage was applied to the total surface street mileage to generate the passenger car mileage on surface streets.
A.2 CRSS Non-KABCO Unreported Adjustments
Table 8 shows the crash-level unreported rates relied upon in the current study, which were applied to each police-reported crash using an adjustment correction factor. For some CRSS data relied upon in the current study, the crash-level crash severity was unknown (max_sev equal to 9). For these cases, we generated a custom adjustment to account for underreporting using the relative proportions of PDO and non-fatal injury crashes using CRSS 2021 data.
| Crash Severity | Percent Unreported | Correction Factor | |
| Blincoe | SHRP-2 | ||
| PDO | 59.7% | 2.48 | 6.25 |
| Non-Fatal Injury | 31.9% | 1.47 | |
| Fatal | 0.0% | 1.00 | |
| Unknown | – | 2.20 | 4.92 |