Photons from neutrinos: the gamma ray echo of a supernova neutrino burst
Abstract
When a star undergoes core collapse, a vast amount of energy is released in a s long burst of neutrinos of all species. Inverse beta decay in the star’s hydrogen envelope causes an electromagnetic cascade which ultimately results in a flare of gamma rays – an “echo” of the neutrino burst – at the characteristic energy of 0.511 MeV. We study the phenomenology and detectability of this flare. Its luminosity curve is characterized by a fast, seconds-long, rise and an equally fast decline, with a minute- or hour-long plateau in between. For a near-Earth star (distance kpc) the echo will be observable at near future gamma ray telescopes with an effective area of or larger. Its observation will inform us on the envelope size and composition. In conjunction with the direct detection of the neutrino burst, it will also give information on the neutrino emission away from the line of sight and will enable tests of neutrino propagation effects between the stellar surface and Earth.
A core collapse supernova is the most powerful neutrino emitter known so far. The s-long burst of thermal neutrinos emitted from the outskirts of the collapsed core is the main cooling mechanism, and is a powerful diagnostic tool of the physics that takes place in the very dense and hot region deep inside the star.
Interestingly, one of the best supernova neutrino detectors is the most abundant element in the universe, Hydrogen. Indeed, the process of inverse decay (IBD), , has a relatively large, well known, cross section Vogel and Beacom (1999); Strumia and Vissani (2003) and, depending on the type of detector, it can provide information on the energies and arrival times of the individual neutrinos detected. This simple, reliable method has found application in water and liquid scintillator detectors Scholberg (2012), and it was used in the first and only detection of supernova neutrinos, the burst from SN1987A Hirata et al. (1987); Bionta et al. (1987); Alekseev et al. (1988). Its evolution has been driven by the need of having larger detector masses; e.g., about kt mass of water is needed for high statistics detection of supernovae beyond our galaxy.
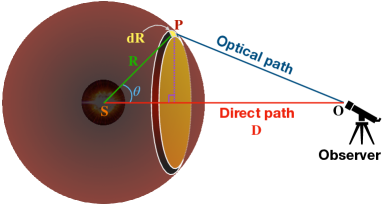
The concept of Hydrogen as detector leads to an idea: why not use the vast mass of Hydrogen in or near the star itself as detector? This question was first studied several decades ago, when it was observed Bisnovatyi-Kogan et al. (1975); Ryazhskaya (1999) that inverse beta decay in the hydrogen envelope of a collapsing star leads to a transient signal of positron annihilation () signatures, mainly in the form of 0.511 MeV gamma rays Lu and Qian (2007)111Other channels were considered, but the most dominant signal was the MeV rays. Due to the geometry of the system (fig. 1), these gamma rays arrive at Earth as an echo, spread over a characteristic time (with being the star’s radius), relative to the neutrino burst. In those early studies, the predicted luminosity of this echo was considered too low for observation, and therefore this phenomenon was largely ignored since. With the planned next-generation improved gamma ray telescopes like COSI Tomsick (2021), AMEGO Caputo et al. (2019); Kierans (2020), and AMEGO-X Caputo et al. (2022), this 511 keV signal now has better prospects for being detected in the near future.
In this letter, we present a modern study of the gamma ray echo of a supernova neutrino burst in the light of the recent progress of MeV gamma ray surveys. We propose it as a realistic, observable signature of core collapse and discuss its physics potential.
To fix the ideas, we focus on the case which is most favorable for detection, where the gamma rays originate near the surface of the star, and propagate without absorption to Earth (attenuation will be discussed below). Let’s begin by estimating the total photon flux at Earth. We assume a spherically symmetric star, and model the flux of reaching its surface (after flavor conversion, see, e.g. Duan and Kneller (2009) for a review) as having total energy ergs.
The commonly used “alpha spectrum” is assumed for its energy distribution Keil et al. (2003); Tamborra et al. (2012), with the first two momenta being MeV and (corresponding to the shape parameter , where ). For simplicity, we use a time-independent spectrum, so the total number of emitted is, simply, . Two cross sections are relevant here: one is the spectrum-averaged IBD cross section, , the other is for the Compton scattering of gamma rays, Rybicki and Lightman (1986), which is the main channel of photon absorption at the energies of interest Lu and Qian (2007). As an approximation, we consider that the emerging flux of gamma rays is entirely due to the that interact in the outermost layer of the star, a very thin shell of width equal to the gamma ray Compton optical depth ( cm, , see Lu and Qian (2007)). One can then express the number of positrons produced in this layer, and the corresponding number of gamma rays from positron propagation that leave the star as Ryazhskaya (1999):
| (1) |
where and are the proton and electron fractions in the stellar matter; is the effective number of 0.511 MeV gamma rays produced per positron (see below), and the factor accounts for the fact that half of the gamma rays propagates inwards and is absorbed. By symmetry arguments, it follows immediately that the time-integrated photon flux at Earth is
| (2) |
. We estimate the uncertainty on and to be about in either direction due to the uncertainty in the neutrino spectrum parameters.
To compute the expected time-dependent gamma ray flux and its energy spectrum, it is necessary to consider a specific stellar environment and model the positron propagation in detail. Here we follow the extensive discussion in Lu and Qian (2007), where a precise estimate for is found. There, the values and are used. It is shown that positron annihilation is the main channel of gamma ray production, dominating over the secondary channel – the emission of MeV gamma rays from neutron capture – by roughly two orders of magnitude in flux. For a hydrogen envelope in thermodynamic equilibrium at temperature K and density , it was found that positron thermalization is – in the vast majority of cases – fast, occurring over a typical time scale of s, and that a fraction of all positrons annihilate after thermalization, resulting in a gamma ray spectrum that is centered at MeV, with width (full width at half maximum) keV. Accounting for the fact that each annihilation produces two photons, we therefore estimate which will be used here as reference value.
Let us now describe the expected gamma ray lightcurve at Earth, for a star at distance , and a given neutrino number luminosity . From eq. (1), and basic geometry arguments (see fig. 1) one obtains the gamma ray flux at Earth (in the absence of absorption effects, see discussion below):
| (3) | |||||
where is the speed of light, and is a box function normalized to 1: for , and elsewhere. The second line of eq. (3) emphasizes that the echo is described by a convolution operation (see, e.g., the formalism in Dwek et al. (2021)). Here is set to be the start of the neutrino burst as observed at Earth.
For illustration, we model the neutrino luminosity as a truncated exponential:
| (4) |
where the limit (no truncation) well approximates the case of a neutron-star forming collapse, where the proto-neutron star cools smoothly by neutrino emission over several tens of seconds. The case s could describe a collapse with direct black-hole formation (failed supernova, see, e.g. O’Connor and Ott (2011); Pejcha and Thompson (2015); Ertl et al. (2016)), for which the neutrino emission is truncated sharply when the neutrinosphere falls within the gravitational radius. Here we take s (for black hole formation) and s. The description in eq. (4) captures the main features of the luminosity curve over a multi-second timescale, which is sufficient for the present scope. We note that fast fluctuations of (over a time scale 0.1 s or less) such as those expected in the first second or so of the neutrino burst Foglizzo (2001); Blondin et al. (2003); Foglizzo (2002) would in any case be smoothed out by the integration in eq. (3), and therefore have a negligible effect on the gamma ray lightcurve.
The result for the case of a neutron-star forming collapse is sufficiently simple, and is given by:
| (5) | ||||
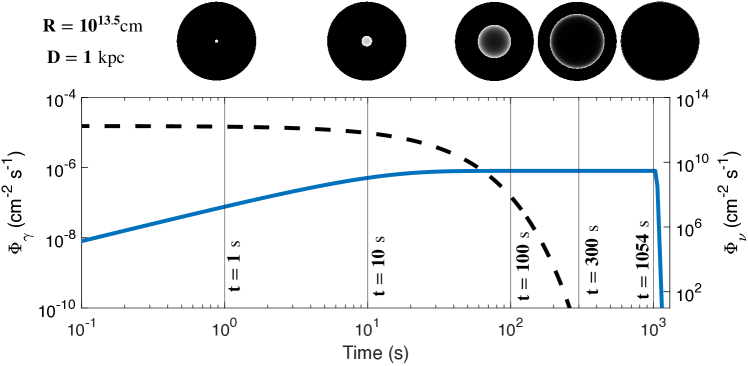
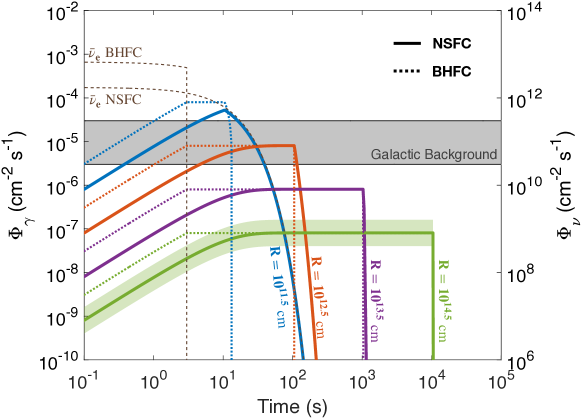
The results are shown in fig. 2 and 3 (solid curves). The expression in eq. (5) describes the “phases” of the star as seen by an observer at Earth (see illustration in fig. 2): first, there is an increase in flux (), when the surface of the star becomes bright in a circle around the line of sight, and the circle expands. After a time comparable with the neutrino emission timescale, , the luminosity of the echo has reached a plateau. This behavior describes the phase where the gamma-ray emitting region of the star – as seen at Earth – is made of an expanding annulus where the intensity of emission is at its maximum, whereas the region near the line of sight emits less intensely due to the decline on . The plateau lasts until , when the entire visible face of the star has become bright in gamma rays; at later times the star still appears completely illuminated, but the gamma ray flux declines over a timescale because all the points on its surface are receiving a neutrino flux that is past its peak luminosity.
As shown in Eqs. (3) and (5), and fig. 3, the echo becomes fainter and longer for larger envelope radii; for a reference radius cm and distance kpc to the star, we estimate a duration of s (approximately 17 minutes) and maximum flux .
The case of a failed supernova – for which the analytical result is complicated, and will be omitted for simplicity – is described in fig. 3 (dotted lines). Qualitatively, the behavior is similar to the previous case, with the difference that the transition between phases is sharper, reflecting the sudden drop of . In this case, an observer at Earth would see a sharp boundary between a fully illuminated annulus and a completely dark circle centered at the line of sight. Note that, by construction, the total energy emitted in neutrinos is the same for the two types of collapses. Therefore, due to the shorter time scale of the emission, for a failed supernova the rise phase of the echo is more luminous and could be more easily observed.
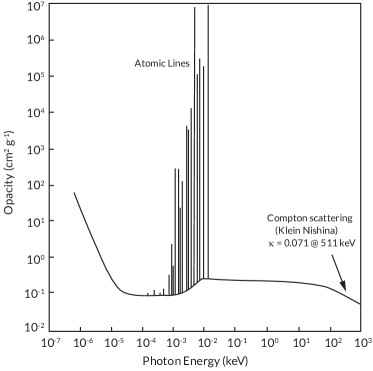
Let us briefly discuss the attenuation of the emitted gamma rays due to propagation in the circumstellar medium (CSM) and interstellar medium (ISM). The attenuation factor is , where , and are the monochromatic opacity and density of the medium respectively, and the integral is performed along the line of sight. For simplicity, we approximate the CSM using the radially averaged density and temperature profiles from Ref. Georgy et al. (2013), where typical values are in the range: log, log. For these, the MeV photon interactions are dominated by Compton scattering (in the Klein-Nishina regime): cm2/g. Absorption by atoms and ions is negligible, being most effective at lower energy (see fig. 4, where the corresponding spectral lines are shown). We find that attenuation is practically negligible; for example for a CSM of pc width, and for propagation in the ISM over a distance of kpc.
The echo is detectable in principle if it produces at least one photon signal in a detector at Earth: , where is the effective area of the telescope, which we assume to be pointing in the direction of the star (incidence angle ). Using eq. Eq. (2), we obtain the detectability condition (for fixed neutrino flux parameters):
| (6) |
Current or upcoming instrument typically have (see, e.g, COSI Tomsick (2021) and 511-CAM Shirazi et al. (2023)), and therefore would be unable to observe an echo, except for a very nearby collapse with an exceptionally luminous neutrino emission. For the largest telescopes of the next generation, AMEGO Caputo et al. (2019); Kierans (2020) ( cm), and GECCO ( cm) Orlando et al. (2022), the echo might be visible for stars within a radius of 1 kpc or so, where about 31 supernova candidates are located Mukhopadhyay et al. (2020).
Realistically, detection requires the signal to be distinguishable above the relevant backgrounds, mainly the diffuse galactic background at MeV, which peaks in the direction of the Galactic Center (see, e.g., Diehl (2013); Roland (2016); Diehl et al. (2021); Frontera et al. (2021)). We do not consider possible contamination of an echo signal from other nearby sources like gamma ray bursts, other supernovae, supernova remnants, low mass X-ray binaries, and others. Positron annihilation from competing processes in the stellar envelope is unlikely to contribute, as the temperature of the envelope is well below the threshold for thermally producing electron-positron pairs, and positrons from (post-collapse) radionuclides near the core of the star would be located too deep to affect the echo over its short timescale.
Let us estimate the diffuse galactic background at MeV. We take the value as a reference for this flux away from the galactic center (see results in Skinner et al. (2015), for galactic latitude and longitude and ). Taking the published angular resolution of AMEGO, AMEGO technical sheet (corresponding to a solid angle sr), we obtain a flux , which is comparable to the maximum value predicted for the echo for cm and kpc (see fig. 3). This indicates that realistically, a distance below the kpc scale is needed for a robust identification of the echo. A rough criterion for the signal to be detectable above the background is that the number of signal photon counts exceeds the one of the background over the duration of the echo: , where 333 For simplicity, here we refer to the case where the signal flux is dominated by the plateau phase, i.e., s, which is realized for the nearby stars considered here (Table 1). In this case the condition is well approximated by , with being the flux at the plateau. . Numerically, we get:
| (7) |
If , one can use the (less stringent) requirement that the signal exceeds a 3 Gaussian fluctuation of the background: .
Since a detection is possible only for near-Earth collapses, we have examined the known hydrogen-rich supernova candidate stars within a radius of 1 kpc; they are listed in Table 1 (taken from Mukhopadhyay et al. (2020) with some updates, see table caption). For each, we report the estimated distance and radius, the value of in the direction of the star and our result for . The direction-specific is evaluated from Skinner et al. (2015) (see fig. 2 there). In the absence of a a detailed three dimensional model of the galactic background, the angular separation between the galactic center and the star has been calculated only along the galactic longitude (), assuming latitude . For stars with angular separation exceeding , we take the fixed value , which is an overestimate, and therefore leads to conservative conclusions.
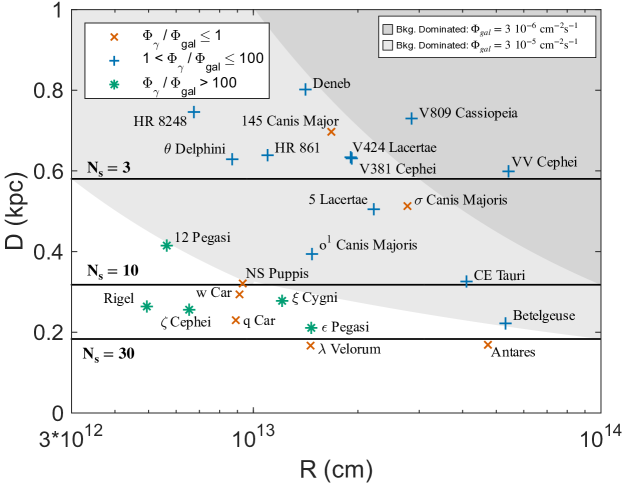
The conditions for detectability, Eqs. (6) and (7) (and its extension to Gaussian statistics, see above), are illustrated in fig. 5, for two fixed values of the galactic background flux, and . The candidate stars in Table 1 are shown as well, color coded according to the realistic (direction-specific) signal-to-background ratio given in the Table. From the figure, it appears that the detection of the echo is possible - with a telescope having - for several candidates. Many of them are in a fortunate location, where the galactic background is low. Examples are Betelgeuse and Rigel, for which the angular separation from the galactic center is and respectively, and therefore the background is overestimated. Rigel is also favored by is relatively compact size, cm, which implies a higher peak of the echo flux (see fig. 3). In contrast, Antares - which is similar in distance and radius to Betelgeuse - is disfavored by its proximity to the Galactic Center, which causes a higher background () and lower signal-to-background ratio.
The observation of the gamma ray echo could reveal information that would otherwise be inaccessible. In particular, the echo provides information on the flux passing through the stellar surface facing the observer. Therefore, the comparison with the detected neutrino burst would test the intensity of the neutrino emission away from the line of sight. It would also allow to search for exotic effects that might affect the neutrinos between the star and Earth, like neutrino decay, conversion into sterile states, scattering on Dark Matter, etc. Our predicted gamma ray flux might serve as a reference for searches of gamma-ray-producing effects beyond the Standard Model, like axion-photon conversion (see, e.g. Chattopadhyay et al. (2023) for a related idea). The echo could also provide independent estimates of the progenitor star’s features, mainly the radius and envelope composition. Its initial, rising phase could also contribute to early alerts of the collapse, preceding the explosion (or collapse into black hole) of the star.
This work can be extended in many ways, to obtain more realistic predictions. For example, one could use numerical results for the stellar envelope structure and composition and for the neutrino luminosity, that might include deviations from spherical symmetry. Different, more realistic forms of the time profile of the neutrino luminosity could be examined (e.g., a power-law form, see Suwa et al. (2021)). Including secondary branches of positron propagation, and the contribution of the layers of the star deeper than the gamma ray optical depth may result in more optimistic predictions for the gamma ray flux. The idea of a gamma ray echo could be extended to other set-ups, for example involving supernova progenitors with Carbon- or Oxygen-rich envelopes - where gamma rays can be produced by neutrino-nucleus scattering - , or envelope-stripped stars where the echo might be due to a detached hydrogen shell (for example, the shell between two companion stars, see, e.g., Pejcha et al. (2022)). The latter, however, might give very faint echoes due to their more extended structure (larger ).
In conclusion, we have presented a modern rendering of the idea of supernova neutrinos producing a gamma ray echo. This phenomenon is conceptually interesting, because the neutrinos take the unusual role of being the source of an electromagnetic signal, and is also attractive as a realistic target of observation for future large gamma ray telescopes with sub-MeV capability. It adds another facet to the very rich landscape of multi-messenger astronomy.
| Common Name | D (in kpc) | R () | RA | Dec | l Sep. | () | |
|---|---|---|---|---|---|---|---|
| Velorum | Carpenter et al. (1999) | 09:07:59.76 | -43:25:57.3 | 0.732 | |||
| Antares/ Scorpii | Ohnaka et al. (2013) | 16:29:24.46 | -26:25:55.2 | 0.968 | |||
| Pegasi | Stock et al. (2018) | 21:44:11.16 | +09:52:30.0 | ||||
| Betelgeuse | Joyce et al. (2020) | 05:55:10.31 | +07:24:25.4 | 38.1 | |||
| q Car/V337 Car | Kallinger et al. (2019) | 10:17:04.98 | -61:19:56.3 | 0.659 | |||
| Cephei | Messineo and Brown (2019) | 22:10:51.28 | +58:12:04.5 | ||||
| Rigel/ Orion | Przybilla et al. (2006); Moravveji et al. (2012) | 05:14:32.27 | -08:12:05.90 | ||||
| Cygni | Messineo and Brown (2019) | 21:04:55.86 | +43:55:40.3 | ||||
| w Car/V520 Car | Gaia Collaboration (2018) | 10:43:32.29 | -60:33:59.8 | 0.296 | |||
| NS Puppis | Messineo and Brown (2019) | 08:11:21.49 | -39:37:06.8 | 0.342 | |||
| CE Tauri/119 Tauri | Montargès et al. (2018) | 05:32:12.75 | +18:35:39.2 | 22.9 | |||
| Canis Majoris | Messineo and Brown (2019) | 06:54:07.95 | -24:11:03.2 | 2.05 | |||
| 12 Pegasi | Messineo and Brown (2019) | 21:46:04.36 | +22:56:56.0 | ||||
| 5 Lacertae | Baines et al. (2018) | 22:29:31.82 | +47:42:24.8 | 17.6 | |||
| Canis Majoris | Messineo and Brown (2019) | 07:01:43.15 | -27:56:05.4 | 0.376 | |||
| VV Cephei | Baines et al. (2018) | 21:56:39.14 | +63:37:32.0 | 5.13 | |||
| Delphini | Messineo and Brown (2019) | 20:38:43.99 | +13:18:54.4 | 29.0 | |||
| V381 Cephei | Baines et al. (2018) | 21:19:15.69 | +58:37:24.6 | 13.0 | |||
| V424 Lacertae | Norris (2019) | 22:56:26.00 | +49:44:00.8 | 13.0 | |||
| HR 861 | van Belle et al. (2009) | 02:56:24.65 | +64:19:56.8 | 22.2 | |||
| 145 Canis Major | Gaia Collaboration (2018) | 07:16:36.83 | -23:18:56.1 | 0.079 | |||
| V809 Cassiopeia | Levesque et al. (2005) | 23:19:23.77 | +62:44:23.2 | 6.56 | |||
| HR 8248 | van Belle et al. (2009) | 21:33:17.88 | +45:51:14.5 | 26.6 | |||
| Deneb/ Cygni | Schiller and Przybilla (2008) | 20:41:25.9 | +45:16:49.0 | 11.0 |
Acknowledgements.
We thank Christopher Fontes from Los Alamos National Laboratory for his help in providing a monochromatic opacity for 0.511 MeV rays. We are grateful to Regina Caputo, Yong-Zhong Qian and Yudai Suwa for useful discussions. CL acknowledges support from the NSF grant PHY-2309973, and from the National Astronomical Observatory of Japan, where part of this work was conducted. M. M. is supported by NSF Grant No. AST-2108466. M. M. also acknowledges support from the Institute for Gravitation and the Cosmos (IGC) Postdoctoral Fellowship. FXT and EF acknowledge support from NSF under grant 2154339 entitled ”Neutrino Emission From Stars”.References
- Vogel and Beacom (1999) P. Vogel and J. F. Beacom, Phys. Rev. D 60, 053003 (1999), arXiv:hep-ph/9903554 .
- Strumia and Vissani (2003) A. Strumia and F. Vissani, Phys. Lett. B 564, 42 (2003), arXiv:astro-ph/0302055 .
- Scholberg (2012) K. Scholberg, Ann. Rev. Nucl. Part. Sci. 62, 81 (2012), arXiv:1205.6003 [astro-ph.IM] .
- Hirata et al. (1987) K. Hirata et al. (Kamiokande-II), Phys. Rev. Lett. 58, 1490 (1987).
- Bionta et al. (1987) R. M. Bionta et al., Phys. Rev. Lett. 58, 1494 (1987).
- Alekseev et al. (1988) E. N. Alekseev, L. N. Alekseeva, I. V. Krivosheina, and V. I. Volchenko, Phys. Lett. B 205, 209 (1988).
- Bisnovatyi-Kogan et al. (1975) G. S. Bisnovatyi-Kogan, V. S. Imshennik, D. K. Nadyozhin, and V. M. Chechetkin, Astrophys. Space Sci. 35, 23 (1975).
- Ryazhskaya (1999) O. G. Ryazhskaya, Nuovo Cimento C Geophysics Space Physics C 22C, 115 (1999).
- Lu and Qian (2007) Y. Lu and Y.-Z. Qian, Phys. Rev. D 76, 103002 (2007), arXiv:0709.0501 [astro-ph] .
- Note (1) Other channels were considered, but the most dominant signal was the MeV rays.
- Tomsick (2021) J. A. Tomsick (COSI), PoS ICRC2021, 652 (2021), arXiv:2109.10403 [astro-ph.IM] .
- Caputo et al. (2019) R. Caputo et al. (AMEGO), (2019), arXiv:1907.07558 [astro-ph.IM] .
- Kierans (2020) C. A. Kierans (AMEGO Team), Proc. SPIE Int. Soc. Opt. Eng. 11444, 1144431 (2020), arXiv:2101.03105 [astro-ph.IM] .
- Caputo et al. (2022) R. Caputo et al., J. Astron. Telesc. Instrum. Syst. 8, 044003 (2022), arXiv:2208.04990 [astro-ph.IM] .
- Duan and Kneller (2009) H. Duan and J. P. Kneller, J. Phys. G 36, 113201 (2009), arXiv:0904.0974 [astro-ph.HE] .
- Keil et al. (2003) M. T. Keil, G. G. Raffelt, and H.-T. Janka, Astrophys. J. 590, 971 (2003), arXiv:astro-ph/0208035 .
- Tamborra et al. (2012) I. Tamborra, B. Muller, L. Hudepohl, H.-T. Janka, and G. Raffelt, Phys. Rev. D 86, 125031 (2012), arXiv:1211.3920 [astro-ph.SR] .
- Rybicki and Lightman (1986) G. B. Rybicki and A. P. Lightman, Radiative Processes in Astrophysics (1986).
- Note (2) Our result is a factor of 4 larger than the one in Lu and Qian (2007). We were unable to trace the origin of the difference; still, the geometric factor in eq. (2) is substantiated by the extended derivation in Ref. Favorite (2016).
- Dwek et al. (2021) E. Dwek, A. Sarangi, R. G. Arendt, T. Kallman, D. Kazanas, and O. D. Fox, Astrophys. J. 917, 84 (2021), arXiv:2106.06531 [astro-ph.HE] .
- O’Connor and Ott (2011) E. O’Connor and C. D. Ott, Astrophys. J. 730, 70 (2011), arXiv:1010.5550 [astro-ph.HE] .
- Pejcha and Thompson (2015) O. Pejcha and T. A. Thompson, Astrophys. J. 801, 90 (2015), arXiv:1409.0540 [astro-ph.HE] .
- Ertl et al. (2016) T. Ertl, H. T. Janka, S. E. Woosley, T. Sukhbold, and M. Ugliano, Astrophys. J. 818, 124 (2016), arXiv:1503.07522 [astro-ph.SR] .
- Foglizzo (2001) T. Foglizzo, Astron. Astrophys. 368, 311 (2001), arXiv:astro-ph/0101056 .
- Blondin et al. (2003) J. M. Blondin, A. Mezzacappa, and C. DeMarino, Astrophys. J. 584, 971 (2003), arXiv:astro-ph/0210634 .
- Foglizzo (2002) T. Foglizzo, Astron. Astrophys. 392, 353 (2002), arXiv:astro-ph/0206274 .
- Georgy et al. (2013) C. Georgy, R. Walder, D. Folini, A. Bykov, A. Marcowith, and J. M. Favre, Astron. Astrophys. 559, A69 (2013), arXiv:1309.1360 [astro-ph.SR] .
- Shirazi et al. (2023) F. Shirazi et al., J. Astron. Telesc. Instrum. Syst. 9, 024006 (2023), arXiv:2206.14652 [astro-ph.IM] .
- Orlando et al. (2022) E. Orlando et al., JCAP 07, 036 (2022), arXiv:2112.07190 [astro-ph.HE] .
- Mukhopadhyay et al. (2020) M. Mukhopadhyay, C. Lunardini, F. X. Timmes, and K. Zuber, Astrophys. J. 899, 153 (2020), arXiv:2004.02045 [astro-ph.HE] .
- Diehl (2013) R. Diehl, The Astronomical Review 8, 19 (2013), arXiv:1307.4198 [astro-ph.HE] .
- Roland (2016) D. Roland, in Journal of Physics Conference Series, Journal of Physics Conference Series, Vol. 703 (2016) p. 012001, arXiv:1602.09018 [astro-ph.HE] .
- Diehl et al. (2021) R. Diehl, M. Lugaro, A. Heger, A. Sieverding, X. Tang, K. A. Li, E. T. Li, C. L. Doherty, M. G. H. Krause, A. Wallner, N. Prantzos, H. E. Brinkman, J. W. den Hartogh, B. Wehmeyer, A. Yagüe López, M. M. M. Pleintinger, P. Banerjee, and W. Wang, PASA 38, e062 (2021), arXiv:2109.08558 [astro-ph.HE] .
- Frontera et al. (2021) F. Frontera, E. Virgilli, C. Guidorzi, P. Rosati, R. Diehl, T. Siegert, C. Fryer, L. Amati, N. Auricchio, R. Campana, E. Caroli, F. Fuschino, C. Labanti, M. Orlandini, E. Pian, J. B. Stephen, S. Del Sordo, C. Budtz-Jorgensen, I. Kuvvetli, S. Brandt, R. M. C. da Silva, P. Laurent, E. Bozzo, P. Mazzali, and M. Della Valle, Experimental Astronomy 51, 1175 (2021).
- Skinner et al. (2015) G. Skinner, R. Diehl, X.-L. Zhang, L. Bouchet, and P. Jean, PoS Integral2014, 054 (2015).
- (36) AMEGO technical sheet, Available at https://asd.gsfc.nasa.gov/amego/technical.html.
- Note (3) For simplicity, here we refer to the case where the signal flux is dominated by the plateau phase, i.e., s, which is realized for the nearby stars considered here (Table 1). In this case the condition is well approximated by , with being the flux at the plateau.
- Chattopadhyay et al. (2023) D. S. Chattopadhyay, B. Dasgupta, A. Dighe, and M. Narang, (2023), arXiv:2311.14298 [hep-ph] .
- Suwa et al. (2021) Y. Suwa, A. Harada, K. Nakazato, and K. Sumiyoshi, PTEP 2021, 013E01 (2021), arXiv:2008.07070 [astro-ph.HE] .
- Pejcha et al. (2022) O. Pejcha, D. Calderón, and P. Kurfürst, Mon. Not. Roy. Astron. Soc. 510, 3276 (2022), arXiv:2111.08039 [astro-ph.HE] .
- Carpenter et al. (1999) K. G. Carpenter, R. D. Robinson, G. M. Harper, P. D. Bennett, A. Brown, and D. J. Mullan, Astrophys. J. 521, 382 (1999).
- Ohnaka et al. (2013) K. Ohnaka, K. H. Hofmann, D. Schertl, G. Weigelt, C. Baffa, A. Chelli, R. Petrov, and S. Robbe-Dubois, Astron. Astrophys. 555, A24 (2013), arXiv:1304.4800 [astro-ph.SR] .
- Stock et al. (2018) S. Stock, S. Reffert, and A. Quirrenbach, VizieR Online Data Catalog , J/A+A/616/A33 (2018).
- Joyce et al. (2020) M. Joyce, S.-C. Leung, L. Molnár, M. Ireland, C. Kobayashi, and K. Nomoto, Astrophys. J. 902, 63 (2020), arXiv:2006.09837 [astro-ph.SR] .
- Kallinger et al. (2019) T. Kallinger, P. G. Beck, S. Hekker, D. Huber, R. Kuschnig, M. Rockenbauer, P. M. Winter, W. W. Weiss, G. Handler, A. F. J. Moffat, A. Pigulski, A. Popowicz, G. A. Wade, and K. Zwintz, Astron. Astrophys. 624, A35 (2019), arXiv:1902.07531 [astro-ph.SR] .
- Messineo and Brown (2019) M. Messineo and A. G. A. Brown, The Astronomical Journal 158, 20 (2019), arXiv:1905.03744 [astro-ph.GA] .
- Przybilla et al. (2006) N. Przybilla, K. Butler, S. R. Becker, and R. P. Kudritzki, Astron. Astrophys. 445, 1099 (2006), arXiv:astro-ph/0509669 [astro-ph] .
- Moravveji et al. (2012) E. Moravveji, E. F. Guinan, M. Shultz, M. H. Williamson, and A. Moya, Astrophys. J. 747, 108 (2012), arXiv:1201.0843 [astro-ph.SR] .
- Gaia Collaboration (2018) Gaia Collaboration, Astron. Astrophys. 616, A1 (2018), arXiv:1804.09365 [astro-ph.GA] .
- Montargès et al. (2018) M. Montargès, R. Norris, A. Chiavassa, B. Tessore, A. Lèbre, and F. Baron, Astron. Astrophys. 614, A12 (2018), arXiv:1802.06086 [astro-ph.SR] .
- Baines et al. (2018) E. K. Baines, J. T. Armstrong, H. R. Schmitt, R. T. Zavala, J. A. Benson, D. J. Hutter, C. Tycner, and G. T. van Belle, The Astronomical Journal 155, 30 (2018), arXiv:1712.08109 [astro-ph.SR] .
- Norris (2019) R. P. Norris, Seeing Stars Like Never Before: A Long-term Interferometric Imaging Survey of Red Supergiants, Ph.D. thesis, Georgia State University (2019).
- van Belle et al. (2009) G. T. van Belle, M. J. Creech-Eakman, and A. Hart, Mon. Not. Roy. Astron. Soc. 394, 1925 (2009), arXiv:0811.4239 [astro-ph] .
- Levesque et al. (2005) E. M. Levesque, P. Massey, K. A. G. Olsen, B. Plez, E. Josselin, A. Maeder, and G. Meynet, Astrophys. J. 628, 973 (2005), arXiv:astro-ph/0504337 [astro-ph] .
- Schiller and Przybilla (2008) F. Schiller and N. Przybilla, Astron. Astrophys. 479, 849 (2008), arXiv:0712.0040 [astro-ph] .
- Favorite (2016) J. A. Favorite, Nuclear Instruments and Methods in Physics Research Section A: Accelerators, Spectrometers, Detectors and Associated Equipment 813, 29 (2016).