The Belle II Collaboration
Search for the and processes at
Abstract
We search for the and processes at a center-of-mass energy of 10.745 GeV, which is close to the peak of the state. We use data collected by the Belle II experiment during a special run, corresponding to an integrated luminosity of . We reconstruct decays and use the meson’s recoil mass to search for the signals. We do not find evidence for either process, and set upper limits on the corresponding Born-level cross sections of 2.5 pb and 7.8 pb, respectively, at the 90% confidence level. The limit is the result of a combination of this analysis and a previous search using full reconstruction.
I Introduction
Recently, the Belle experiment observed a new state, the , as a narrow enhancement in the cross sections [1]. Subsequently, the Belle II experiment observed a similar structure in the cross sections, which confirms the existence of the in additional decay channels [2]. This state has been interpreted in several ways: as an bottomonium level mixed with nearby -wave states via hadron loops [3, 4, 5, 6], a hadronic molecule with a small admixture of bottomonium [7], a hybrid meson [8, 9, 10], or a compact tetraquark with a diquark-antidiquark structure [11, 12]. Further studies of hadronic transitions from the to lower bottomonia will help to understand its structure [6, 10, 11, 12, 13, 14, 15, 16, 17].
In this paper, we report on a search for the processes and at a center-of-mass (c.m.) energy of , which is close to the peak of the state. We use Belle II data corresponding to an integrated luminosity of [18] collected during a special run of the SuperKEKB collider at energies above the resonance.
The and mesons do not have exclusive decay channels with a large product of efficiency and branching fraction. Thus, we reconstruct only an meson in the decay and use recoil mass,
| (1) |
as the signal-extraction variable, where and are the energy and momentum of the combination in the c.m. frame.
In a previous study [2], we searched for the process fully reconstructing the decay and found no significant signal. The probability of the decay is small, thus, the sensitivity of partial reconstruction, applied in this analysis, might be higher than that of full reconstruction.
We follow a blind approach, i.e., the analysis procedure is established before examining the signal-variable distribution in data.
II Belle II detector and simulation
The analysis is based on a data sample collected with the Belle II detector [19] at the asymmetric-energy SuperKEKB collider [20].
The detector has a cylindrical geometry with axis approximately coincident with the electron beam direction, which defines the forward direction. Belle II includes a two-layer silicon-pixel detector (PXD) surrounded by a four-layer double-sided silicon-strip detector and a 56-layer central drift chamber (CDC). These detectors reconstruct tracks (trajectories of charged particles). Only one sixth of the second layer of the PXD was installed for the data analyzed here. Surrounding the CDC is a time-of-propagation counter (TOP) in the central region, and an aerogel-based ring-imaging Cherenkov counter (ARICH) in the forward region. These detectors provide charged-particle identification. Surrounding the TOP and ARICH is an electromagnetic calorimeter (ECL) made with CsI(Tl) crystals that provides energy and timing measurements for photons and electrons. These sub-systems are surrounded by a superconducting solenoid, providing an axial magnetic field of 1.5 T. An iron flux return located outside the coil is instrumented with resistive plate chambers and plastic scintillators to detect mesons and to identify muons (KLM).
We generate signal events using EvtGen [21]. Events are generated with a uniform distribution over angular variables and then are weighted according to the theoretical expectations described in Appendix A. Initial-state radiation (ISR) is simulated using the PHOKHARA generator [22] where processes at next-to-leading order in the electromagnetic coupling are taken into account. We assume that the signal processes proceed via the state with parameters from Ref. [1] and weight events accordingly. The GEANT4 package is used to simulate the passage of the particles inside the detector and its response [23]. All the data and simulated events are reconstructed and analyzed using the Belle II analysis software [24, 25].
III Event selection
We reconstruct the meson using the decay. Online event selection is based on the number of charged particles and observed energy in an event, and is fully efficient for signal. For charged pions, we require the distance from the beam-spot to be within 0.5 cm along the axis and 0.3 cm in the transverse plane. Particle identification uses the measurements in the CDC and information from TOP, ARICH, ECL, and KLM. The corresponding likelihoods are calculated for each particle hypothesis, and loose selections are applied to separate charged pions from kaons, protons, and electrons.
Candidate mesons are reconstructed from pairs of photons, which are energy deposits (clusters) in the ECL not matched to a track in the CDC. The photon energy is required to exceed in the forward endcap () and barrel () regions of the ECL, and in the backward endcap (), because the latter region has higher beam-induced background. To suppress beam-induced background, we require the difference between the cluster time and the collision time to satisfy . This requirement corresponds to approximately two standard deviations in time resolution. To suppress background from hadronic clusters, which are broader than electromagnetic ones, we require the ratio of the energy deposit in a matrix of crystals to that in the enclosing matrix in which the four corner crystals are excluded to be greater than 0.8. The invariant mass of the selected photon pairs is required to satisfy for the channel and for the channel, where is the mass [26]. These requirements correspond to approximately two standard deviations in mass resolution. To suppress combinatorial background from low-energy photons, we require the momentum of the candidate in the c.m. frame to exceed for the channel and for the channel. We perform a mass-constrained kinematic fit for the candidates to improve the momentum resolution.
The candidates are selected by combining , , and , and requiring the invariant mass to satisfy , where is the mass [26]. In the Dalitz plot (DP) of the decay, the density of the signal decreases towards the boundaries, while the combinatorial background is concentrated near the boundaries. To suppress the combinatorial background, we use a normalized distance to the center of the symmetrized DP [27] in our candidate selection criteria. The variable takes the value at the DP center and at its boundary. We require for the and for the .
To suppress background from continuum events (), which have a jet-like shape, we use the ratio of the second to the zeroth order Fox Wolfram moments [28]. For events, this variable peaks at approximately 0.1, while for continuum events it is distributed almost uniformly between 0.0 and 1.0. The selection criteria are for the and for the .
The above selection criteria are obtained by maximizing the figure of merit (FoM), defined as , where is the signal efficiency determined using simulation, and is the background yield estimated using data. This definition of the FoM takes into account the small signal-to-background ratio for partial reconstruction. To find the global maximum of the FoM, we scan each selection variable in an iterative way.
The fit intervals are and for the and candidates, respectively. For reference, the mass is , and the masses are , , and , respectively [26]. The resolutions are for the and for the .
There are on average 1.6 and 4.0 candidates per event for the and processes, respectively. We verify that the additional candidates do not peak in the signal regions, and therefore, we retain all candidates. The reconstruction efficiencies are 7.6% and 7.8% for the and channels, respectively. These include corrections for the discrepancies between data and simulation, which are discussed along with the systematic uncertainties in Section V.
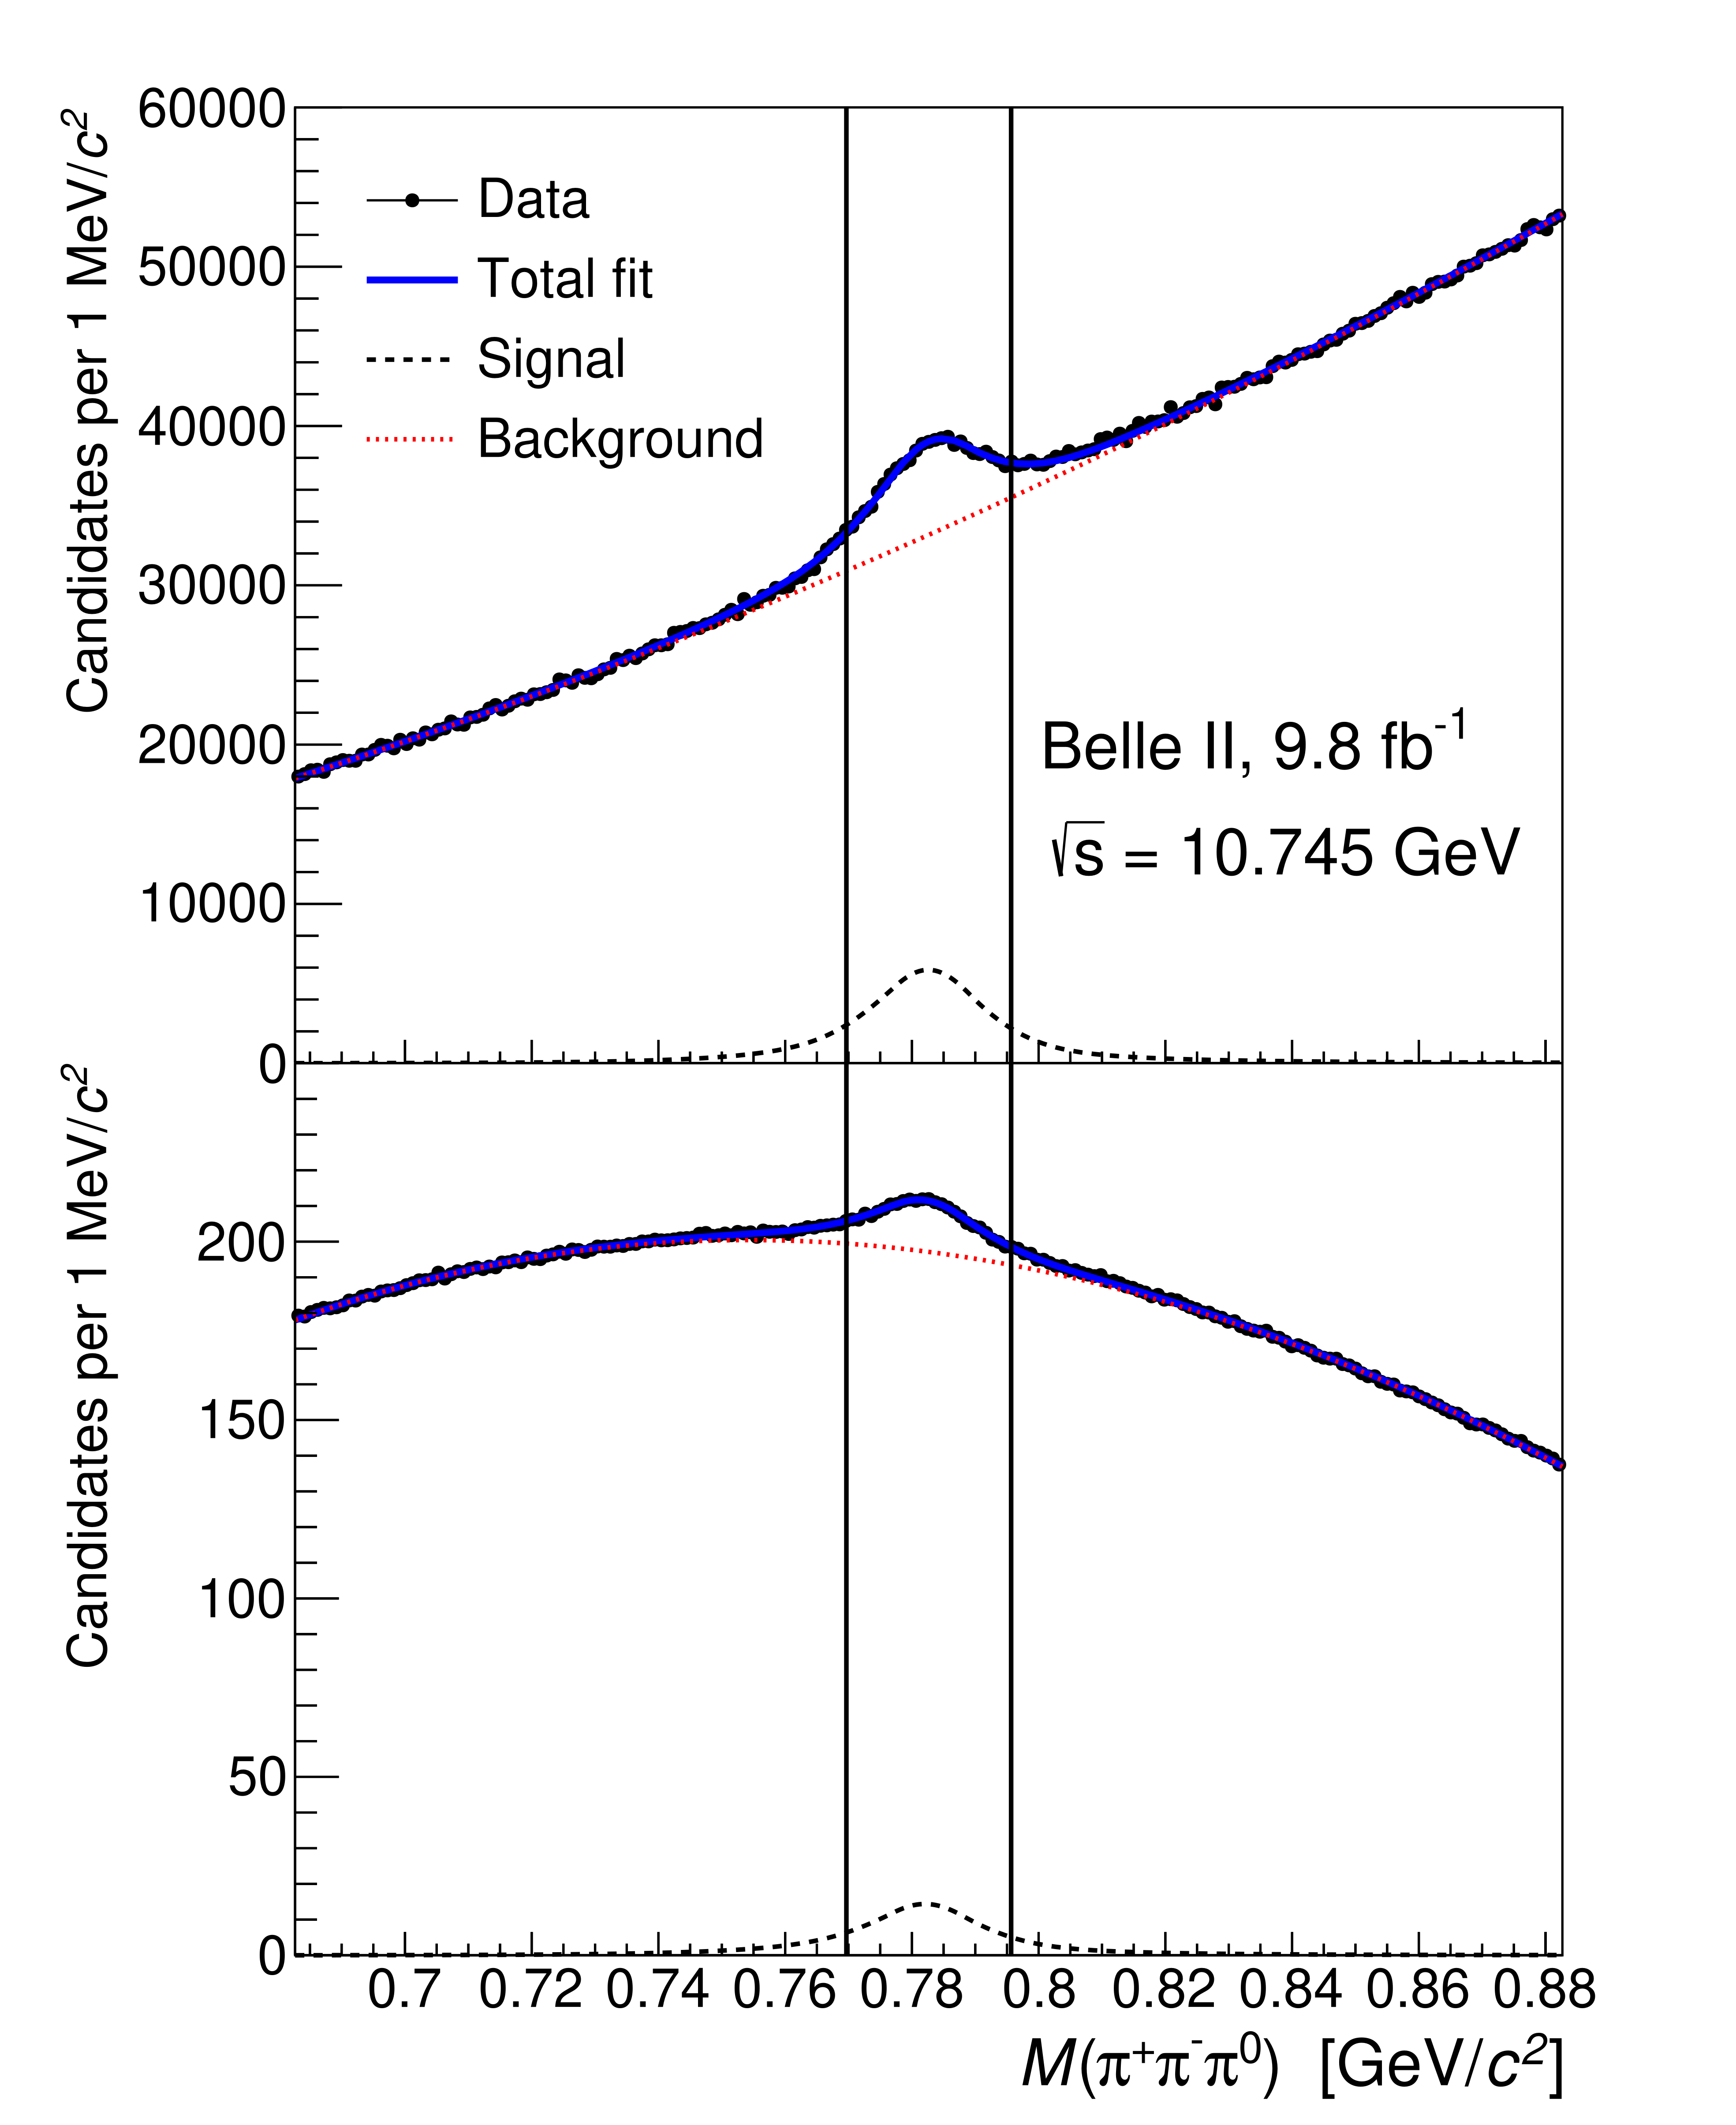
The distributions for the and candidates without the invariant mass requirement are shown in Fig. 1. We perform a least-squares fit to these distributions, in which the -signal shape is modeled by a sum of a Gaussian function and a double-sided Crystal Ball (CB) function [29], while the background is described by second and third order Chebyshev polynomials for the and channels, respectively. The parameters of the signal fit function are determined from simulation. To account for possible data-simulation discrepancies, we introduce an overall mass shift and a width scale factor that are determined from the fit. We find, respectively, and for the , and for the . The purity of the -meson candidates is estimated to be 12.9% and 5.3% for the and channels, respectively.
IV Yield measurement
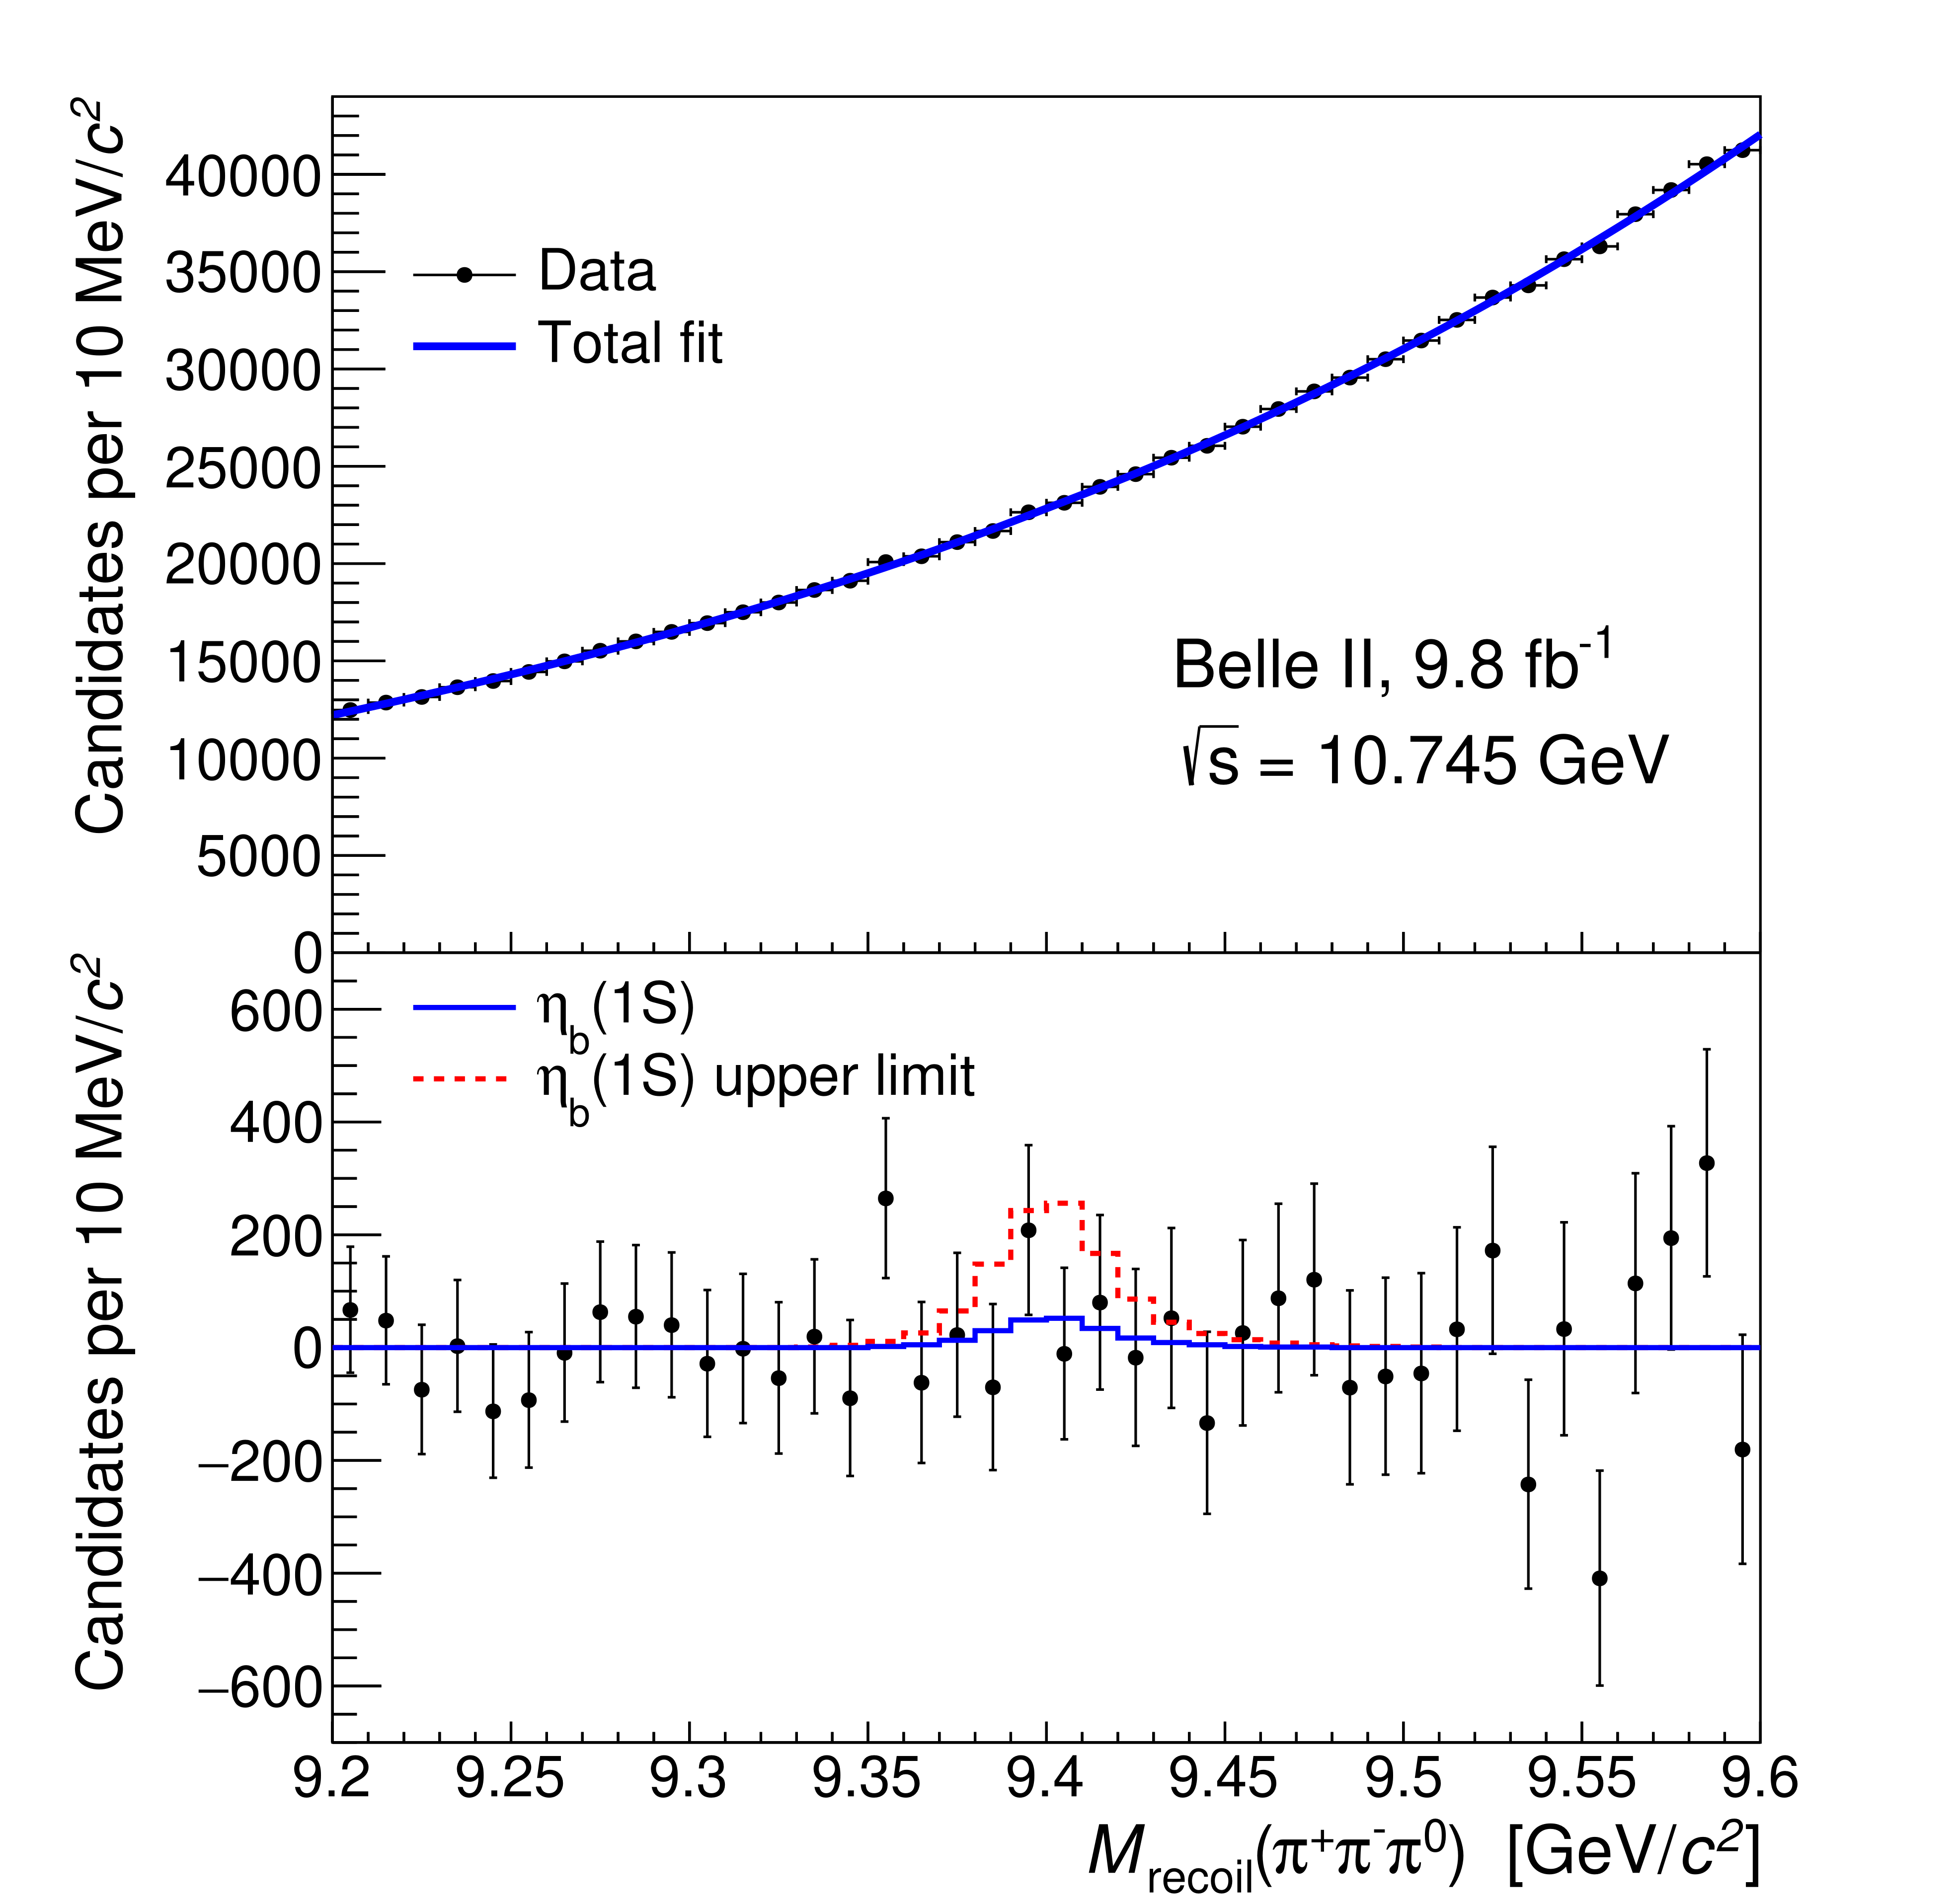
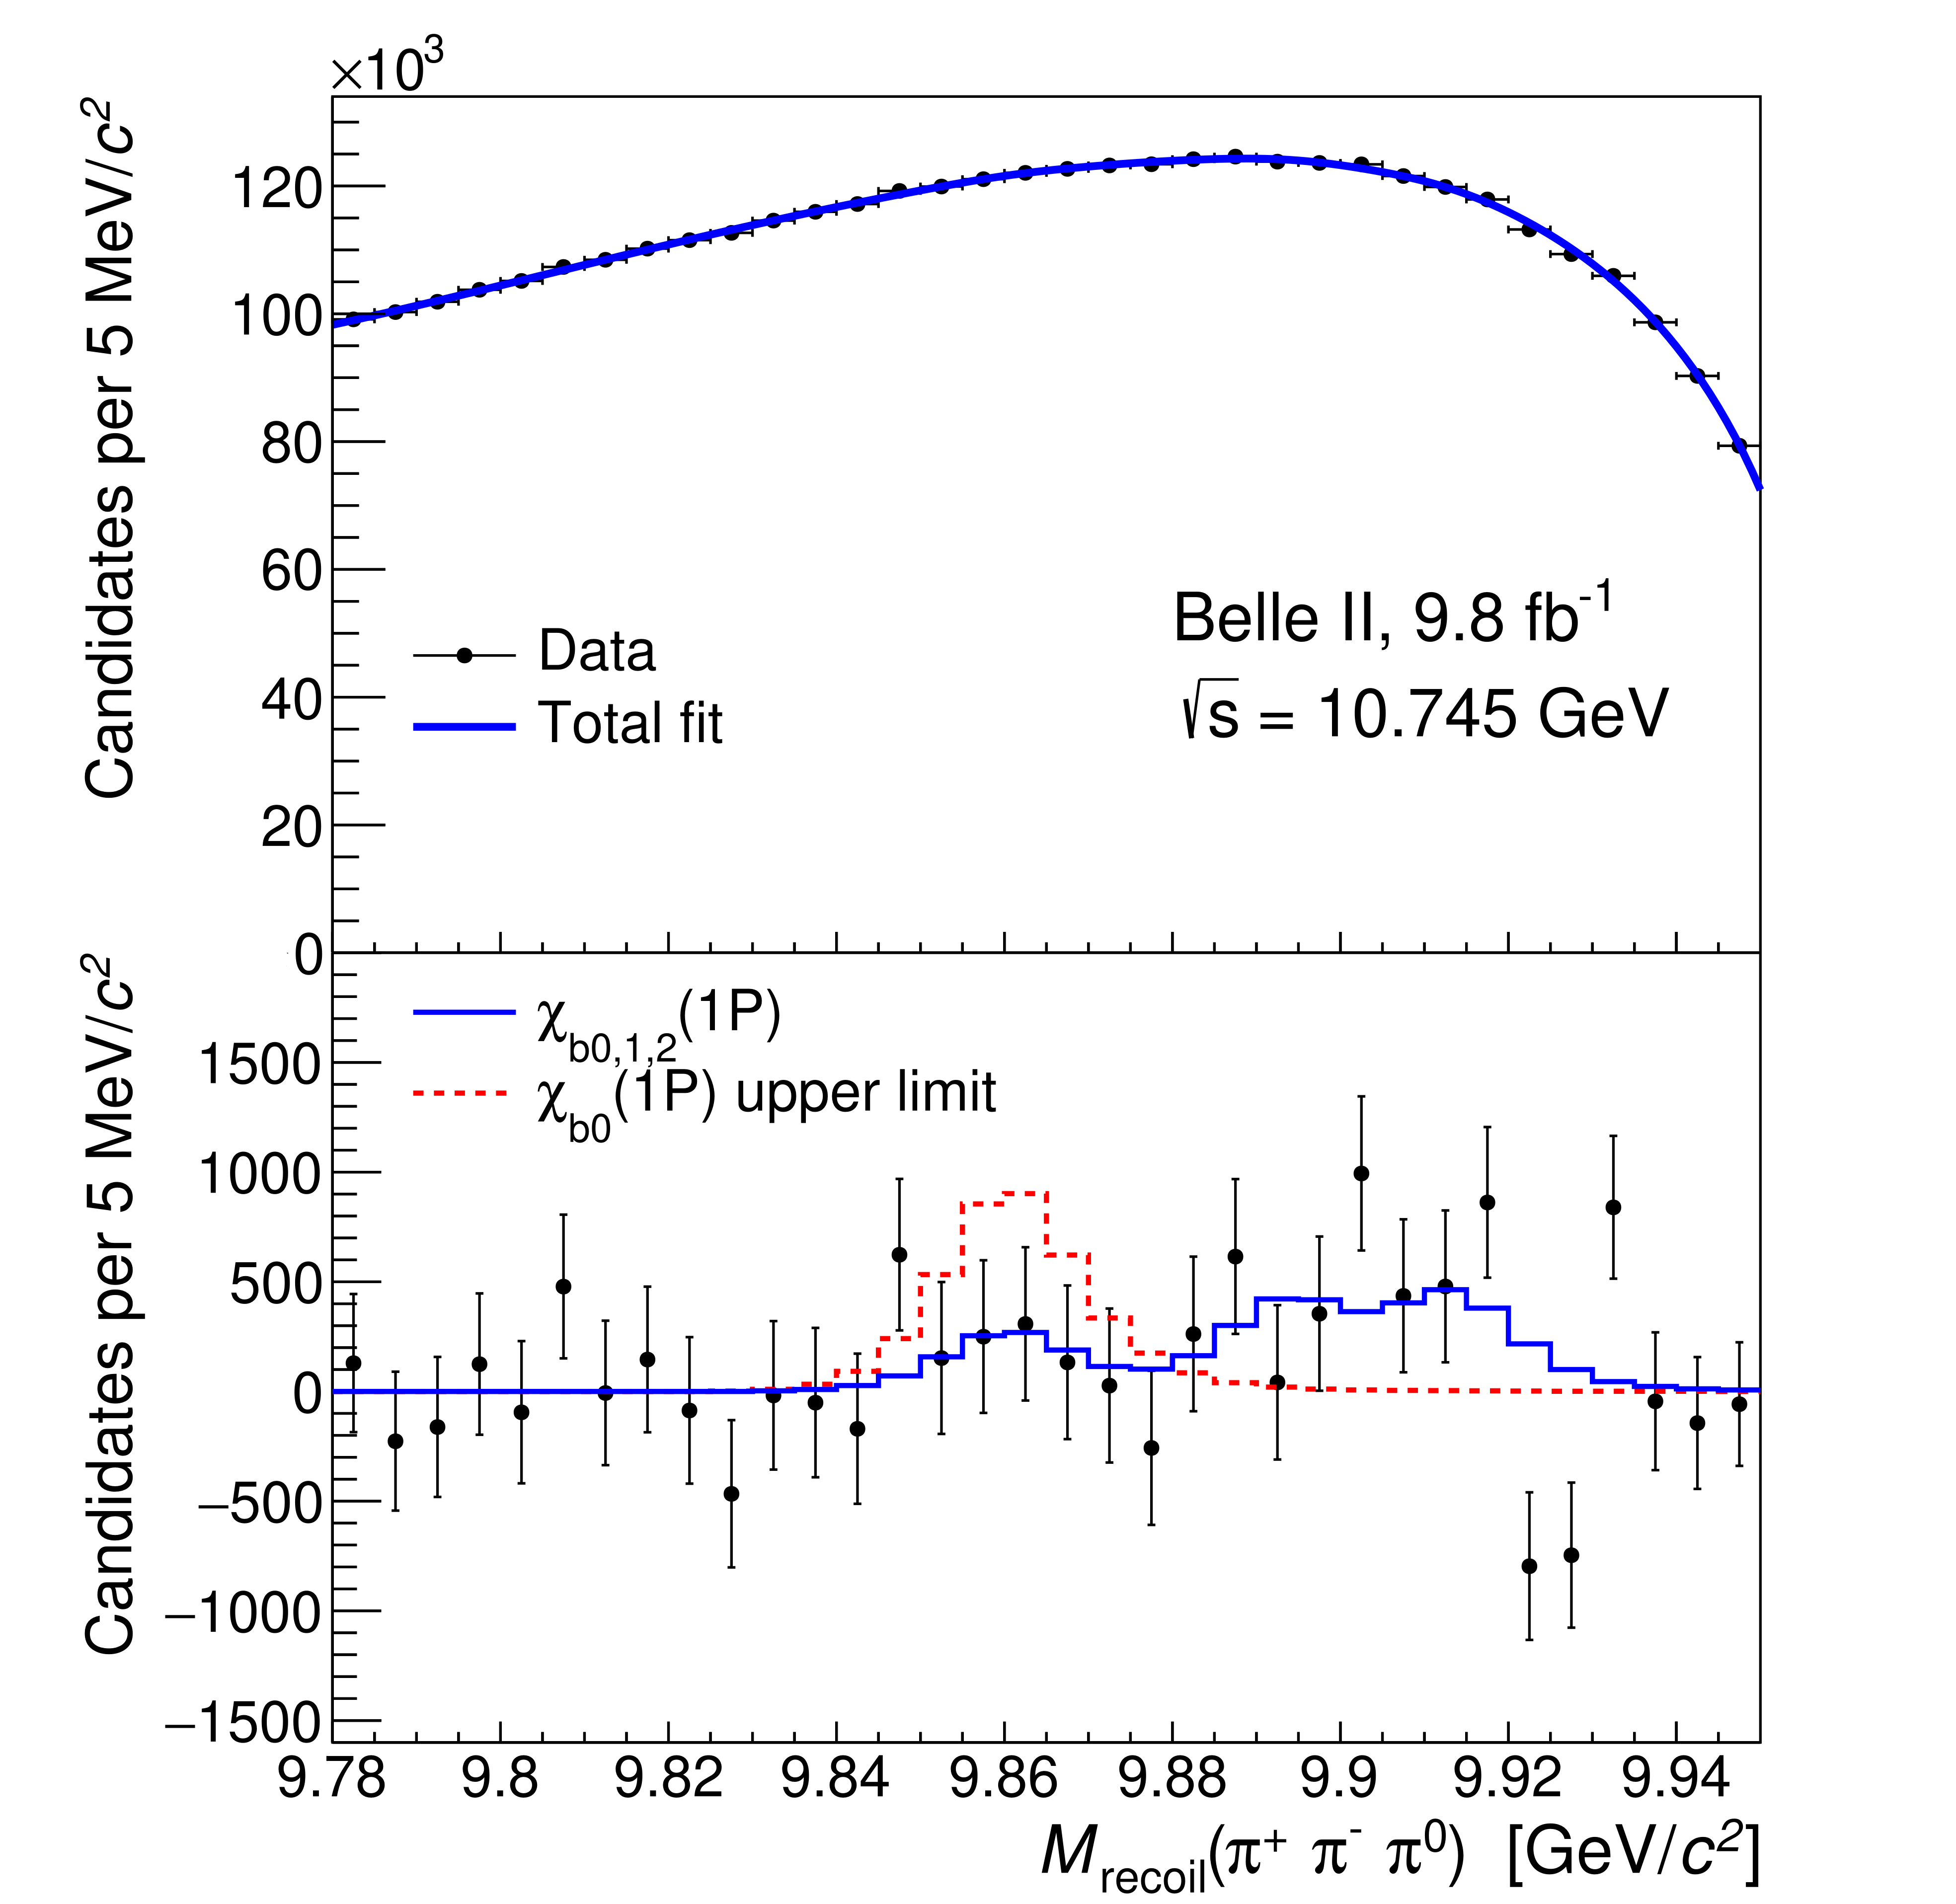
The distributions for the and candidates are shown in Figs. 2 and 3, respectively. We perform a fit to these distributions, in which the shapes of the and signals are fixed to the simulation results. To model the background, we use a 3rd-order Chebyshev polynomial for the channel, and the product of a 4th-order Chebyshev polynomial and a square-root function for the channel. Orders of the polynomial functions are chosen to give the maximal -value for the fit.
Based on the results of the full-reconstruction analysis [2], we find that the expected ratio of the and yields with partial reconstruction is . In an initial fit to the data we fix , and find , which agrees with the expectation based on Ref. [2] of . In the following, we fix to the expected value, which helps to improve the sensitivity to the signal. Thus, only the and yields, and background parameters, are free in the fit. The fit results are shown in Figs. 2 and 3. We use bins for fitting and or bins for visualization. No significant signals are observed; the obtained and yields are given in Table 1.
| Yield () | ||
|---|---|---|
| Born cross section (pb) | ||
| Upper limit (pb) |
V Born cross sections and systematic uncertainties
The Born-level cross sections are calculated as
| (2) |
where is the signal yield, is the reconstruction efficiency, is the integrated luminosity; is the vacuum polarization [30], is a product of the and branching fractions, is the radiative correction calculated using the Kuraev-Fadin radiator [31] assuming production via .
The dominant contributions to the systematic uncertainty in the yields are listed in Table 2. We vary the and masses by one standard deviation around their values [26]. The effect of variation of the width is negligibly small. We vary the c.m. energy in Eq. (1) by to account for the uncertainty in its calibration [32]. We use the shifts and scale factors of the fits, determined in Section III, to calibrate the momentum resolution in the signal simulation; the resulting change of the yields is negligibly small. The peak position and the ISR tail of the signal function depend on the shape of the cross section as a function of collision energy. We assume that the signal cross section is constant in energy instead of considering the resonant production via . Since and are correlated when the shape of the cross-section is varied, we calculate the deviation of the ratio . For the channel, we vary the expected and yields and according to their uncertainties considering their correlation [2]. To estimate the contribution from the assumptions on the background shape, we vary both boundaries of the fit interval simultaneously by , and the lower boundary of the fit interval by . We also increase the polynomial order by one. For the background-shape source, we consider the root-mean-square spread of the deviations to be the corresponding systematic uncertainty. For other sources, we use maximal deviations. The total systematic uncertainty in the yields, shown in Table 2, is estimated as a sum of the various contributions in quadrature.
| / mass | ||
|---|---|---|
| Collision-energy calibration | ||
| Cross-section shape | ||
| and yields | ||
| Background shape | ||
| Total |
A summary of the multiplicative uncertainties is presented in Table 3. The possible discrepancies between data and simulation contribute to the uncertainty in the reconstruction efficiency. The uncertainty in track reconstruction efficiency is estimated using the decays for low-momentum particles and using the process for mid-to-high momentum particles. The uncertainty in the efficiency of the PID requirements is determined using , , and data samples. The uncertainty in the reconstruction efficiency is estimated by comparing reconstructed , , and decays. The efficiencies of the requirements in the and channels are 82% and 91%, respectively. We assume that the relative uncertainty in these efficiencies is 10%. The uncertainty in luminosity is measured using Bhabha and events [18]. The uncertainties in the and branching fractions are taken from Ref. [26].
| Track reconstruction efficiency | 1.6 | 2.4 |
| PID efficiency | 0.8 | 1.0 |
| reconstruction efficiency | 3.2 | 7.3 |
| efficiency | 10.0 | 10.0 |
| Luminosity | 0.6 | 0.6 |
| 0.7 | 0.7 | |
| Total multiplicative uncertainty | 10.7 | 12.7 |
The yield uncertainty , obtained by adding the corresponding statistical and systematic uncertainties in quadrature, is combined with the multiplicative uncertainty using the following formula:
| (3) |
where the symbol denotes addition in quadrature. The estimated Born-level cross sections and upper limits at the 90% confidence level (CL) set using the likelihood-ratio ordering method [33] are presented in Table 1.
VI Conclusions
We report a search for the and processes at . No significant signals are observed, and we set the following 90% CL upper limits on Born-level cross sections:
| (4) |
The upper limit on the cross section is comparable to the upper limit obtained using full reconstruction of 11.3 pb [2]. We combine the two results, taking into account correlations, to obtain
| (5) |
The tetraquark model of Ref. [11] predicts that the decay rate of is strongly enhanced compared to the decay rates of . The obtained upper limit on is close to the measured values of , which are in the range [1]. Thus, our results do not support the tetraquark-model prediction that the decay is enhanced [11]. In the mixing model, the decay rate of is smaller than the decay rate of by a factor [17]; our upper limit is consistent with this expectation.
The upper limit on the cross section is higher than the measured and cross sections of and , respectively [2]. For a mixed state, the decay rate to is expected to be comparable to the decay rates to and [14]; our upper limit is consistent with this expectation. In the charmonium sector, the decay of the state to is enhanced compared to the decays to and [34]. We do not find an analogous enhancement in the decay pattern of , which may indicate that and have different structures.
VII Acknowledgements
We are grateful to A.I. Milstein for valuable discussions. This work, based on data collected using the Belle II detector, which was built and commissioned prior to March 2019, was supported by Science Committee of the Republic of Armenia Grant No. 20TTCG-1C010; Australian Research Council and Research Grants No. DP200101792, No. DP210101900, No. DP210102831, No. DE220100462, No. LE210100098, and No. LE230100085; Austrian Federal Ministry of Education, Science and Research, Austrian Science Fund No. P 31361-N36 and No. J4625-N, and Horizon 2020 ERC Starting Grant No. 947006 “InterLeptons”; Natural Sciences and Engineering Research Council of Canada, Compute Canada and CANARIE; National Key R&D Program of China under Contract No. 2022YFA1601903, National Natural Science Foundation of China and Research Grants No. 11575017, No. 11761141009, No. 11705209, No. 11975076, No. 12135005, No. 12150004, No. 12161141008, and No. 12175041, and Shandong Provincial Natural Science Foundation Project ZR2022JQ02; the Czech Science Foundation Grant No. 22-18469S; European Research Council, Seventh Framework PIEF-GA-2013-622527, Horizon 2020 ERC-Advanced Grants No. 267104 and No. 884719, Horizon 2020 ERC-Consolidator Grant No. 819127, Horizon 2020 Marie Sklodowska-Curie Grant Agreement No. 700525 “NIOBE” and No. 101026516, and Horizon 2020 Marie Sklodowska-Curie RISE project JENNIFER2 Grant Agreement No. 822070 (European grants); L’Institut National de Physique Nucléaire et de Physique des Particules (IN2P3) du CNRS and L’Agence Nationale de la Recherche (ANR) under grant ANR-21-CE31-0009 (France); BMBF, DFG, HGF, MPG, and AvH Foundation (Germany); Department of Atomic Energy under Project Identification No. RTI 4002, Department of Science and Technology, and UPES SEED funding programs No. UPES/R&D-SEED-INFRA/17052023/01 and No. UPES/R&D-SOE/20062022/06 (India); Israel Science Foundation Grant No. 2476/17, U.S.-Israel Binational Science Foundation Grant No. 2016113, and Israel Ministry of Science Grant No. 3-16543; Istituto Nazionale di Fisica Nucleare and the Research Grants BELLE2; Japan Society for the Promotion of Science, Grant-in-Aid for Scientific Research Grants No. 16H03968, No. 16H03993, No. 16H06492, No. 16K05323, No. 17H01133, No. 17H05405, No. 18K03621, No. 18H03710, No. 18H05226, No. 19H00682, No. 22H00144, No. 22K14056, No. 22K21347, No. 23H05433, No. 26220706, and No. 26400255, the National Institute of Informatics, and Science Information NETwork 5 (SINET5), and the Ministry of Education, Culture, Sports, Science, and Technology (MEXT) of Japan; National Research Foundation (NRF) of Korea Grants No. 2016R1D1A1B02012900, No. 2018R1A2B3003643, No. 2018R1A6A1A06024970, No. 2019R1I1A3A01058933, No. 2021R1A6A1A03043957, No. 2021R1F1A1060423, No. 2021R1F1A1064008, No. 2022R1A2C1003993, and No. RS-2022-00197659, Radiation Science Research Institute, Foreign Large-Size Research Facility Application Supporting project, the Global Science Experimental Data Hub Center of the Korea Institute of Science and Technology Information and KREONET/GLORIAD; Universiti Malaya RU grant, Akademi Sains Malaysia, and Ministry of Education Malaysia; Frontiers of Science Program Contracts No. FOINS-296, No. CB-221329, No. CB-236394, No. CB-254409, and No. CB-180023, and SEP-CINVESTAV Research Grant No. 237 (Mexico); the Polish Ministry of Science and Higher Education and the National Science Center; the Ministry of Science and Higher Education of the Russian Federation, Agreement No. 14.W03.31.0026, and the HSE University Basic Research Program, Moscow; University of Tabuk Research Grants No. S-0256-1438 and No. S-0280-1439 (Saudi Arabia); Slovenian Research Agency and Research Grants No. J1-9124 and No. P1-0135; Agencia Estatal de Investigacion, Spain Grant No. RYC2020-029875-I and Generalitat Valenciana, Spain Grant No. CIDEGENT/2018/020; National Science and Technology Council, and Ministry of Education (Taiwan); Thailand Center of Excellence in Physics; TUBITAK ULAKBIM (Turkey); National Research Foundation of Ukraine, Project No. 2020.02/0257, and Ministry of Education and Science of Ukraine; the U.S. National Science Foundation and Research Grants No. PHY-1913789 and No. PHY-2111604, and the U.S. Department of Energy and Research Awards No. DE-AC06-76RLO1830, No. DE-SC0007983, No. DE-SC0009824, No. DE-SC0009973, No. DE-SC0010007, No. DE-SC0010073, No. DE-SC0010118, No. DE-SC0010504, No. DE-SC0011784, No. DE-SC0012704, No. DE-SC0019230, No. DE-SC0021274, No. DE-SC0022350, No. DE-SC0023470; and the Vietnam Academy of Science and Technology (VAST) under Grants No. NVCC.05.12/22-23 and No DL0000.02/24-25.
These acknowledgements are not to be interpreted as an endorsement of any statement made by any of our institutes, funding agencies, governments, or their representatives.
We thank the SuperKEKB team for the excellent operation of the accelerator and their special efforts to accomplish the center-of-mass energy scan that made these results possible; the KEK cryogenics group for the efficient operation of the detector solenoid magnet; the KEK computer group and the NII for on-site computing support and SINET6 network support; and the raw-data centers at BNL, DESY, GridKa, IN2P3, INFN, and the University of Victoria for off-site computing support.
Appendix A Angular distributions
To estimate the angular distributions of the studied processes, we use a nonrelativistic approximation. The amplitude of the process can be written as
| (6) |
where is the polarization vector of the virtual photon produced in the annihilation, is the total momentum of the three pions measured in the c.m. frame, and is defined as
| (7) |
where are the energies of the pions measured in the c.m. frame. For low-momentum , the vector is perpendicular to the decay plane. Summation over gives the formula for magnitude
| (8) |
where is the unit vector along the beam direction. This formula corresponds to a distribution in the production angle (the angle between the beam direction and the momentum in the c.m. frame) and a distribution in the angle between the normal vector to the decay plane and the momentum of the beams measured in the rest frame.
The amplitudes for the processes can be written as
| (9) |
where , , and are wave functions, respectively. After summing over the projections the magnitudes are
| (10) |
References
- [1] R. Mizuk et al. (Belle Collaboration), “Observation of a new structure near 10.75 GeV in the energy dependence of the (n = 1, 2, 3) cross sections,” JHEP 10, 220 (2019).
- [2] I. Adachi et al. (Belle II Collaboration), “Observation of and search for at near 10.75 GeV,” Phys. Rev. Lett. 130, 091902 (2023).
- [3] A. M. Badalian, B. L. G. Bakker and I. V. Danilkin, “Dielectron widths of the S-, D-vector bottomonium states,” Phys. Atom. Nucl. 73, 138 (2010).
- [4] Q. Li, M. S. Liu, Q. F. Lü, L. C. Gui and X. H. Zhong, “Canonical interpretation of and in the family,” Eur. Phys. J. C 80, 59 (2020).
- [5] W. H. Liang, N. Ikeno and E. Oset, “ decay into ,” Phys. Lett. B 803, 135340 (2020).
- [6] J. F. Giron and R. F. Lebed, “Spectrum of the hidden-bottom and the hidden-charm-strange exotics in the dynamical diquark model,” Phys. Rev. D 102, 014036 (2020).
- [7] P. Bicudo, N. Cardoso, L. Mueller and M. Wagner, “Computation of the quarkonium and meson-meson composition of the states and of the new Belle resonance from lattice QCD static potentials,” Phys. Rev. D 103, 074507 (2021).
- [8] J. Tarrús Castellà, “Spin structure of heavy-quark hybrids,” AIP Conf. Proc. 2249, 020008 (2020).
- [9] B. Chen, A. Zhang and J. He, “Bottomonium spectrum in the relativistic flux tube model,” Phys. Rev. D 101, 014020 (2020).
- [10] N. Brambilla, S. Eidelman, C. Hanhart, A. Nefediev, C. P. Shen, C. E. Thomas, A. Vairo and C. Z. Yuan, “The states: experimental and theoretical status and perspectives,” Phys. Rep. 873, 1 (2020).
- [11] Z. G. Wang, “Vector hidden-bottom tetraquark candidate: ,” Chin. Phys. C 43, 123102 (2019).
- [12] A. Ali, L. Maiani, A. Y. Parkhomenko and W. Wang, “Interpretation of as a tetraquark and its production mechanism,” Phys. Lett. B 802, 135217 (2020).
- [13] J. Tarrús Castellà and E. Passemar, “Exotic to standard bottomonium transitions,” Phys. Rev. D 104, 034019 (2021).
- [14] Y. S. Li, Z. Y. Bai, Q. Huang and X. Liu, “Hidden-bottom hadronic decays of with a or emission,” Phys. Rev. D 104, 034036 (2021).
- [15] Z. Y. Bai, Y. S. Li, Q. Huang, X. Liu and T. Matsuki, “ decays induced by hadronic loop mechanism,” Phys. Rev. D 105, 074007 (2022).
- [16] Y. S. Li, Z. Y. Bai and X. Liu, “Investigating the transitions,” Phys. Rev. D 105, 114041 (2022).
- [17] S. Liu, Z. Cai, Z. Jia, G. Li and J. Xie, “Hidden-bottom hadronic transitions of ,” [arXiv:2312.02761 [hep-ph]].
- [18] F. Abudinén et al. (Belle II Collaboration), “Measurement of the integrated luminosity of the Phase 2 data of the Belle II experiment,” Chin. Phys. C 44, 021001 (2020).
- [19] T. Abe et al. (Belle II Collaboration), “Belle II Technical Design Report,” arXiv:1011.0352 [physics.ins-det].
- [20] K. Akai et al. (SuperKEKB Accelerator Team), “SuperKEKB Collider,” Nucl. Instrum. Meth. A 907, 188 (2018).
- [21] D. J. Lange, “The EvtGen particle decay simulation package,” Nucl. Instrum. Meth. A 462, 152 (2001).
- [22] G. Rodrigo, H. Czyz, J. H. Kuhn and M. Szopa, “Radiative return at NLO and the measurement of the hadronic cross section in electron positron annihilation,” Eur. Phys. J. C 24, 71 (2002).
- [23] S. Agostinelli et al. (GEANT4 Collaboration), “GEANT4 – a simulation toolkit,” Nucl. Instrum. Meth. A 506, 250 (2003).
- [24] T. Kuhr et al. (Belle II Framework Software Group), “The Belle II Core Software,” Comput. Softw. Big Sci. 3, 1 (2019).
- [25] Belle II Analysis Software Framework (basf2), https://doi.org/10.5281/zenodo.5574115.
- [26] R. L. Workman et al. (Particle Data Group), “Review of Particle Physics,” PTEP 2022, 083C01 (2022).
- [27] D. Matvienko et al. (Belle Collaboration), “Study of production and light hadronic states in the decay,” Phys. Rev. D 92, 012013 (2015).
- [28] G. C. Fox and S. Wolfram, “Observables for the Analysis of Event Shapes in Annihilation and Other Processes,” Phys. Rev. Lett. 41, 1581 (1978).
- [29] M. Oreglia et al. “A Study of the Reaction ,” Phys. Rev. D 25, 2259 (1982).
- [30] S. Actis et al. (Working Group on Radiative Corrections and Monte Carlo Generators for Low Energies), “Quest for precision in hadronic cross sections at low energy: Monte Carlo tools vs. experimental data,” Eur. Phys. J. C 66, 585 (2010).
- [31] E. A. Kuraev and V. S. Fadin, “On Radiative Corrections to Single Photon Annihilation at High-Energy,” Sov. J. Nucl. Phys. 41, 466 (1985).
- [32] Belle II Collaboration, “Measurement of the energy dependence of the , , and cross sections at Belle II,” to be published.
- [33] G. J. Feldman and R. D. Cousins, “A Unified approach to the classical statistical analysis of small signals,” Phys. Rev. D 57, 3873 (1998).
- [34] M. Ablikim et al. (BESIII Collaboration), “Cross section measurements of form 4.178 to 4.278 GeV,” Phys. Rev. D 99, 091103 (2019).