High-energy electron measurements with thin Si detectors
Abstract
A technique for measuring high-energy electrons using Si detectors of various thicknesses that are much smaller than the range of the examined electrons is presented. The advantages of the method are discussed on the basis of electron-positron pair creation recently studied in deuteron-deuteron fusion reactions at very low energies. Careful Geant 4 Monte Carlo simulations enabled to identify the main spectral contributions of emitted electrons and positrons resulting from the energy loss mechanisms and scattering processes within the target and detector. Significant changes in the intensity of the detected electrons, depending on the detector thickness and the thicknesses of absorption foils placed in the front of the detector could be observed. Significant changes in the intensity of the detected electrons, depending on the detector thickness and the thicknesses of absorption foils placed in the front of the detector could be observed. The corresponding correction factors have been calculated and can be used for different applications in basic and applied research.
keywords:
high-energy electrons, thin Si detectors, corrections due to scattering processes, nuclear fusion1 Introduction
The energy deposition of electrons in matter differs strongly from that known for heavier charged particles. Due to their low mass, the ionisation process of atoms by electron-electron scattering can occur at large scattering angles, leading to large path lengths compared to the extrapolated projected range [1]. The latter makes it difficult to determine a proper detector thickness for the detection of electrons of a known kinetic energy [2]. Furthermore, the intensity of the full energy line, obtained for a mono-energetic electron source measured in detectors of different thicknesses [1, 3], undergoes significant changes, and the contribution of scattered electrons producing a continuous energy spectrum additionally hinders the analysis. The problems arise especially for high energy electrons for which thicker detectors are needed and the exact number of detected electrons should be determined [1]. Additionally, high-energy electrons lose their energy also by bremsstrahlung, which makes the estimations even much more complicated. The best solution is to compare the measured energy spectrum with a simulated one, assuming that all physical processes involved are taken into account [4]. Moreover, the high penetrability of high-energy electrons makes it necessary to model the entire experimental setup. For this purpose, the Monte Carlo simulation platform, Geant 4[5, 6] seems to be the ideal tool.
Recently, we have observed an indication of the emission of high-energy electrons/positrons in the deuteron-deuteron (DD) reaction [9] from the previously predicted threshold resonance [8] in the compound nucleus 4He at the excitation energy of 23.84 MeV. This resonance has spin-parity, and can predominantly decay to the 4He ground state by internal pair creation (IPC) giving continuous energy spectra of emitted electrons and positrons. The measurements have been performed under ultra-high vacuum conditions in a small target chamber using a very compact detection geometry to increase detection probability and compensate for strongly decreasing cross-sections with the lowering deuteron energy. We have used only a single Si detector to determine the reaction branching between emitted electron-positron pairs and the 3.02 MeV protons from the reaction 2H(d, p)3H down to the lowest possible projectile energies with high precision. Simultaneous measurements of protons and electrons using Si detectors of various thicknesses will allow us to track the differences in the detection of both charged particles.
In the other studies, high-energy electrons/positrons were measured usually by means of large detector telescopes consisting of a thin-thick plastic scintillator [13]. Lately, a multiarray of dE-E plastic scintillator telescopes and improved dE-E hybrid (DSSD and plastic scintillator) telescopes were used to measure the energy and angular correlation of electron-positron pairs. These studies examined the possibility of creating a hypothetical boson with a mass of approximately 17 MeV/c2 decaying via IPC in the 3H(p, e+ e-) 4He nuclear reaction [14].
In the present work, we will focus on the measurement technique of high-energy electrons and positrons that can be applied for DD reactions at very low energy using relatively thin, single Si detectors. They are typically utilized for the detection of heavy-charged particles simultaneously produced in various nuclear reaction channels. However, their high detection efficiency and small sizes are highly beneficial for a compact detection geometry and determination of small reaction cross sections even for high energy electrons/positrons which cannot be fully stopped in the detector. We will show that a careful analysis of experimental spectra, based on the Geant 4 Monte Carlo simulations, is absolutely needed to understand different spectral contributions and their strengths, previously not discussed in the literature.

2 Experimental setup and Geant 4 Monte Carlo simulation model
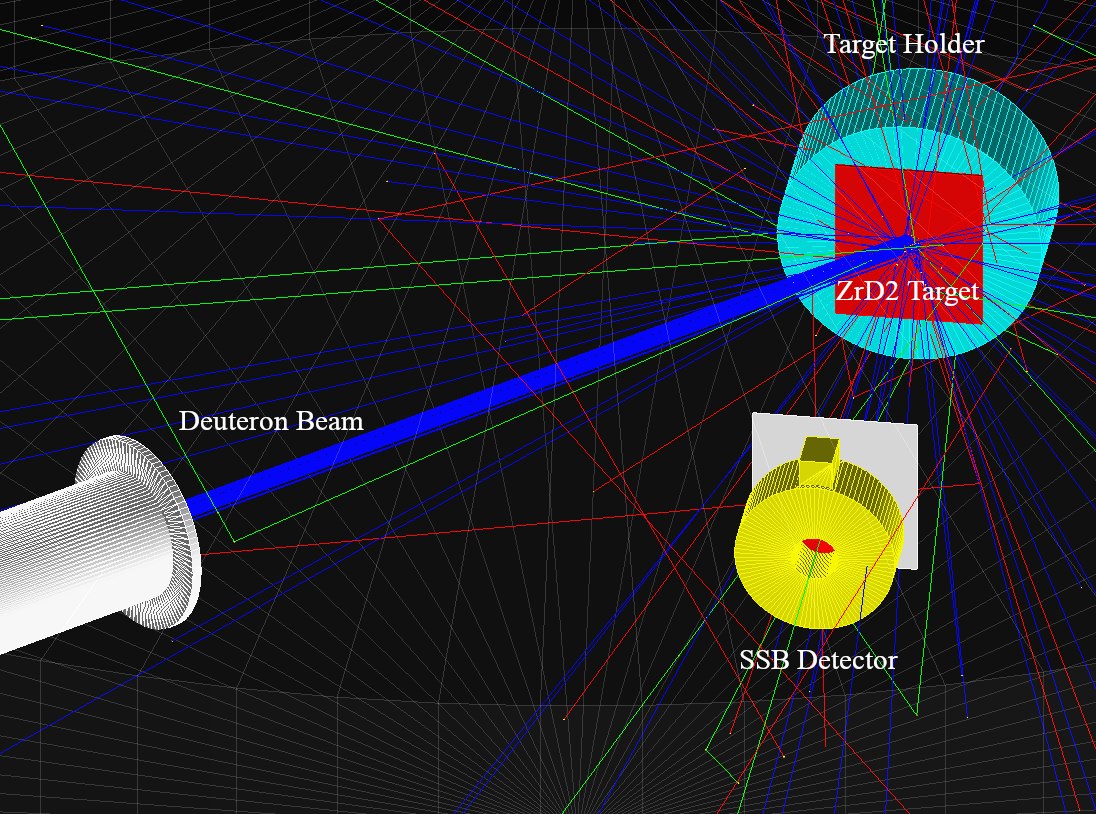
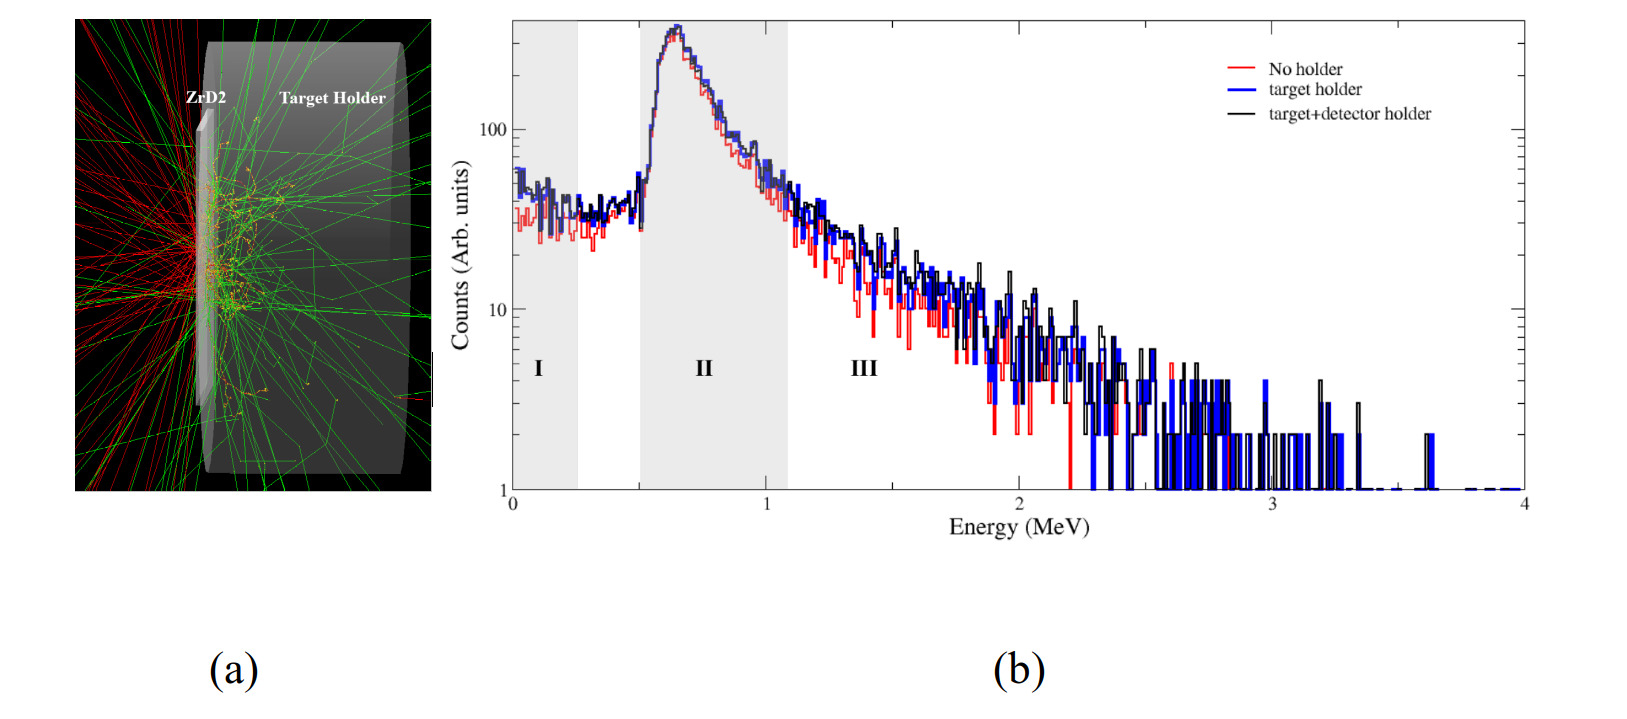
The experiments were performed at the Ultra High Vacuum Accelerator Facility of the University of Szczecin, Poland [10]. The figure of the actual experimental setup with one silicon detector, target, and target holder is shown in Fig. 1 (a), and the corresponding geometry simulated with Geant 4 MC is displayed in Fig. 1 (b). Firstly, to ensure the measurement accuracy and reliability of detectors, the energy calibration of the detector using a radioactive source (RS) was performed. Further, to clearly separate the accelerator and reaction-induced events, comprehensive Geant 4 simulations were performed. These simulations took into careful consideration the entirety of the experimental setup, encompassing the target, its backing material, the target holder, and all surrounding materials near the target and detectors. The simulations also accounted for the packaging of the detectors and the various components involved in mounting them. As shown in Fig. 1, The beam was bombarded on a 0.5 mm thick ZrD2 target plate that was tilted at 45° to the beam, resulting in a beam spot size of 7 12 mm. EG ORTEC surface barrier silicon detectors [7] of 0.3-3 mm thicknesses were used for detection of all charged particles emitted in the DD reaction: protons (3.02 MeV), tritons (1.2 MeV), and 3He particles (0.8 MeV), as well as electrons and positrons resulting from the internal pair creation (continuous energy spectrum up to 22.8 MeV). The DD reaction was studied for deuteron energies below 20 keV, which means that the reaction products were mainly created at the target depth smaller than 200 nm. The detector was situated at a backward angle of 1350 and 7 cm away from the target.
2.1 Detector calibration with radioactive sources
The 60Co radioactive point source was positioned 4 cm from the entrance window of the detector and the measurement was carried out for a live time of 10 minutes. An aluminium degrader of thickness 3.65 µm was placed in front of the detectors and the measurements were repeated. Long background measurements of 240 minutes each were conducted before and after the measurements with the radioactive source and the averaged background spectrum was subtracted from the radioactive isotope spectra. The 60Co radioactive source exhibits two decay channels, with end-point energies of 0.317 MeV and 1.48 MeV, resulting in the decay product 60Ni. The corresponding branching ratios for these channels are 99.88% and 0.12%, respectively[15]
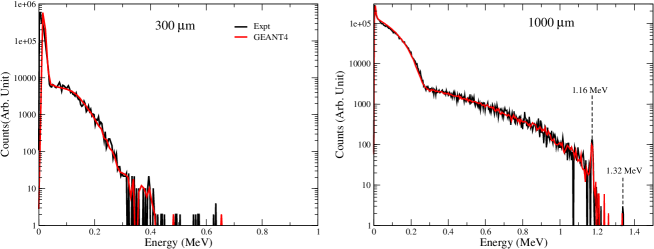
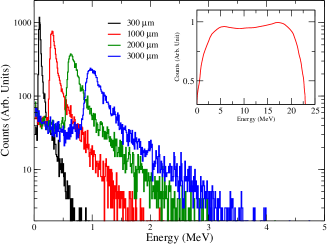
The beta endpoint energy of 317 keV can be prominently observed in 300 and 1000 m thick detectors (see Fig. 2). Additionally, in the 1000 m detector, the higher energy decay with the energy endpoint of 1.48 MeV and two distinct conversion electron peaks resulting from the 1173.23 keV and 1332.49 keV transitions are clearly visible. The differences between the measured spectra obviously arise from different energy depositions of electrons in the thinner and thicker detectors.
3 Results
Recently, it has been proposed that threshold resonance in the compound nucleus 4He at the excitation energy of 23.8 MeV can predominantly decay to the ground state of 4He via internal pair creation (IPC) giving continuous energy spectra of emitted electrons and positron [9].To ensure a correct interpretation of the electron/positron spectra obtained in the DD reaction, it is essential to have a clear understanding of the origin of each energy spectrum component. For example, besides the IPC process, the background contributions from external pair creation (EPC) and multiple electron scattering are also possible. For this purpose, several event generators were developed and applied to the Geant 4 MC code.
3.1 Implementation of internal pair creation in GEANT4
An internal pair creation is the electromagnetic process by which a nucleus emits an pair instead of gamma-rays, in conjunction with the recoil of the emitting nucleus. The differential IPC cross-section calculation for the E0 transition in 4He follows the method proposed by Rose [12]. Using a two-dimensional random generator that is part of the HBOOK library (CERN), the emission angle and energy of a positron related to an IPC event are generated based on input to a two-dimensional random generator [11]. The energy spectrum of emitted electrons/positrons is displayed as an inset in Fig. 4 (b).
3.2 Energy spectrum of electrons
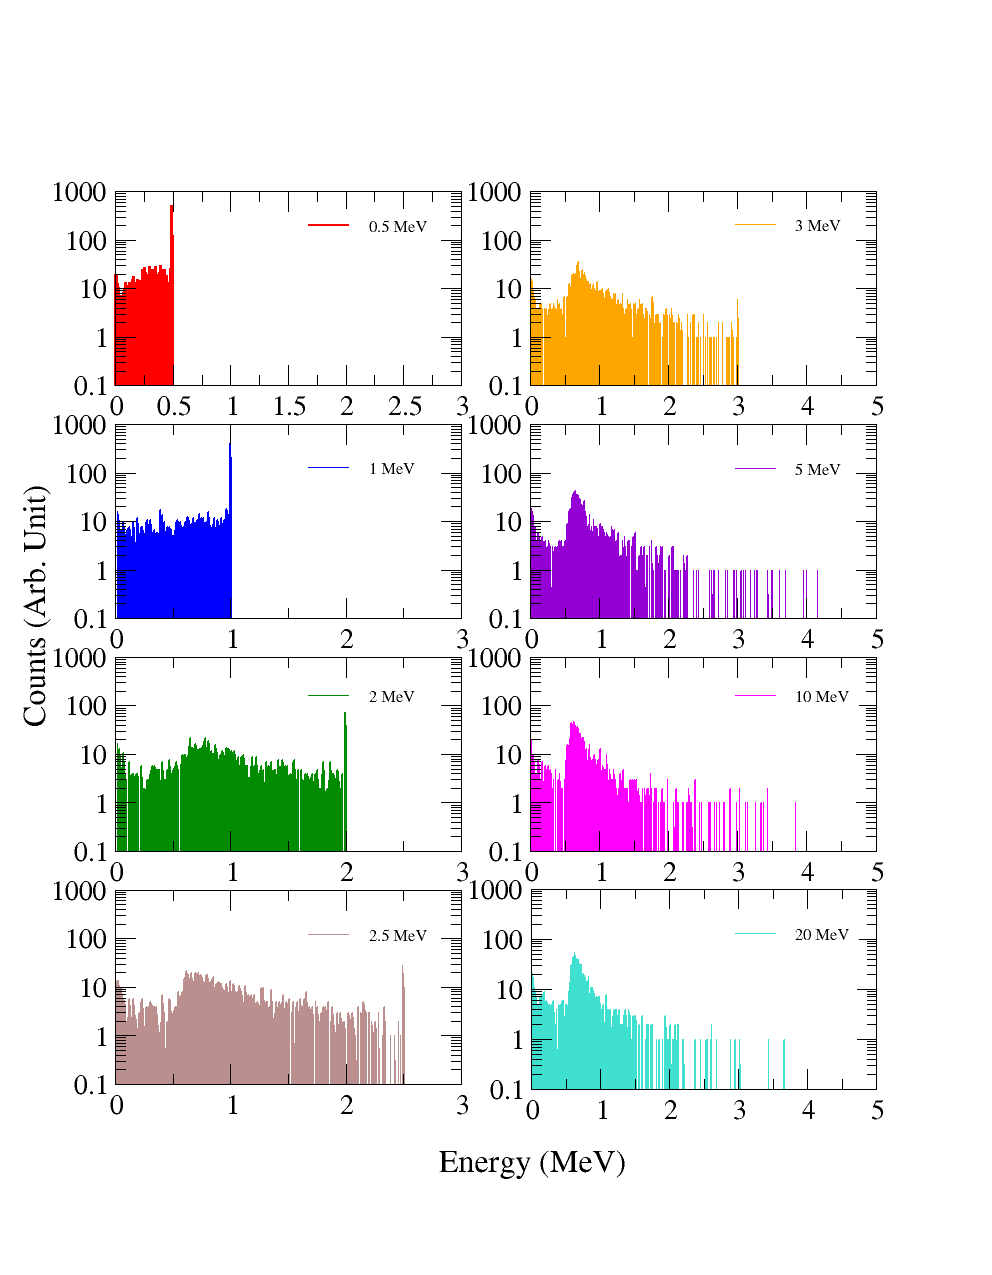
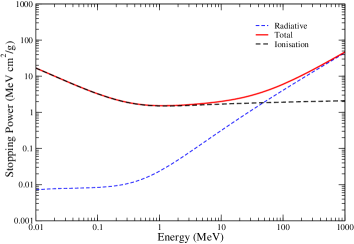
The response function of the Si detector calculated for monoenergetic electrons using Geant 4 simulations (see Fig. 3) exhibits two prominent peaks, namely the full energy peak resulting from the entire absorption of particles, and an average (partial) energy loss peak arising from the incomplete absorption of energy. When an electron with energies below 2.5 MeV traverses the 2 mm silicon (Si) detector, the observed spectra are mostly characterized by the presence of the full energy peak [3]. However, there is a tailing effect observed at lower energies due to partial energy deposition in the detector. For higher electron energies, the full energy line is gradually weaker and disappears for 5 MeV electrons, completely. Instead of that, a broad bump at energies below 1 MeV can be observed, the position of which does not depend on the incident electron energy. This structure corresponds to the average energy loss of electrons in the detector which is independent of the electron energy due to almost constant stopping power values for energies in the range of 0.2 and 20 MeV (see Fig. 4). Therefore, the position of this bump is determined only by a thickness of the detector being transparent for high energy electrons. This effect can also be observed in Fig. 4 (b), where response functions to the IPC electrons/positrons are compared for different detector thicknesses. At very low energies of detected electrons (Fig. 3 and 5) below 0.3 MeV, an additional spectrum structure can be observed which increases with the incident electron energy. As discussed in the next section, this spectrum component results from electrons backscattered in the target and target holder. The stopping power and range of positrons in Si are about 2 per cent lower than for electrons [1]. It means that the energy spectrum of detected positrons does not need to be simulated separately, and the number of emitted electrons can be simply increased by a factor of two.
3.3 Effects of scattered electrons
The backscattered electrons from the target holder and other parts of the experimental setup can have a significant impact on the precise measurement of the electron energy spectrum. Figure 5 shows Geant4 MC calculations of how backscattering from both the target holder and the detector holder affects the entire electron energy spectrum for a 2 mm detector with a 46 m aluminium absorber. For a quantitative analysis, the energy spectrum is divided into three regions: the energy region of elastically scattered electrons (I), the absorption peak region (II) and the high-energy tail region (III). The contribution from backscattering is separately calculated for all regions. The peak region is of significant importance for experimentally determining the strength of the IPC transition. The high-energy tail region is typically overlapping with other DD reaction products (protons, tritons, 3He). Thus, additional absorption foils in the front of the detector can be applied to fully absorb or reduce the energy of heavy-charged particles while high-energy electrons will lose only a small amount of their kinetic energy. In experiments, Al foils of thickness ranging between 0.8 – 125 m were used. Unlike heavy-charged particles, the detection of electrons predominantly occurs within the entire volume of the detectors due to their much smaller stopping power values in silicon.
The influence of detector dimensions (thickness and detection area) on the scattered electron contribution from the target-target holder system is thoroughly examined using simulations.
The multiple scattering in the thick target holder reduces the energy of the electrons and also produces bremsstrahlung photons. The low-energy electrons and photons collectively contribute to the increment in the lower energy region up to 200 keV across various detector geometries. The corresponding percentage increment of the counting rate in this energy range has been calculated as follows:
,
where is the area under the curve with a holder and is the area under the curve without holder. This is documented in Table 1 as the low energy increment.
The peak region is defined in the simulation as the range where the peak’s height is reduced to 12% from its maximum, both to the left and right of the absorption peak. We have detailed this information in Table 1, where the increase in the peak area as a measure of backscattering was considered for detectors of various sizes. Notably, the present study reveals that backscattering from different sources within the experimental setup results in an average increase of about 18% in the overall spectrum for 0.3 -3 mm thickness of the Si detector. Moreover, the analysis of the relationship between detector dimensions and the contribution of backscattering led us to the conclusion that detector dimensions do not significantly affect the detection of the backscattering component (as shown in Table 1). The position of the absorption peak becomes a crucial limiting factor, as depicted in Figure 4. In thinner detectors (e.g. 300 m), the absorption peak blend with low-energy noise or other DD fusion products 3H and 3He, making them indistinguishable.
| Thickness (m) | Surface area (mm2) | position of peak (MeV) | peak to total area (%) | low energy increment (%) | peak area increment (%) | tail area increment (%) | total area increment (%) |
| 300 | 25 | 0.084 | 86 | — | |||
| 1000 | 50 | 0.304 | 80 | ||||
| 1000 | 100 | 0.305 | 82 | ||||
| 2000 | 50 | 0.625 | 68 | ||||
| 3000 | 50 | 0.980 | 62 |
3.4 Al absorption foil effect
Aluminium absorption foils have a negligible impact on high-energy electrons (greater than 5 MeV) spectrum, but they play a critical role in counting electrons, protons, 3H, 3He particles in the entire energy spectrum of DD reactions, measured by a surface barrier Si detector. To accurately differentiate between different reaction channels of DD reaction in experiments at ultra-low energy, it is essential to keep charged particle events separate from high-energy electron events.
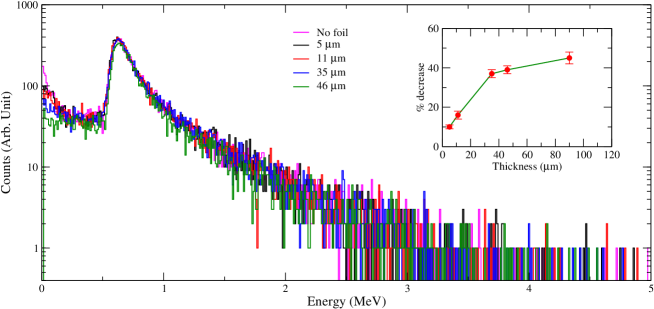
Figure 6 illustrates electron energy spectra derived from a Geant4 Monte Carlo simulation using the 2 mm thick Si detector obtained for different thicknesses of the Al absorption foil placed in the front of the detector. In the lower energy range, the variation in the number of counts is primarily attributed to differences in the thickness of aluminium foils. Thinner foils permit some low-energy, backscattered electrons to pass through, whereas thicker foils effectively block them. This effect, although not significantly affecting electron energy, does have a significant impact on the recorded counting rate. The position of the electron absorption peak remains, however, constant regardless of the foil thickness.
For a more detailed analysis, a quantitative factor “Foils Reduction Factor” (FRF) is defined as a decrease in counts with respect to the no-foil case observed in the low energy region (up to 200 keV). As illustrated in the figure’s inset, thinner foils, ranging from 0.8 to 40 m, display a marked and conspicuous increase in FRF, reflecting a corresponding percentage decrease in counts. However, once the absorber thickness surpasses 46 m, the FRF exhibits no significant change.
In addition to the current Geant4 Monte Carlo calculations, we also conducted calculations using the SRIM code [16] for various thicknesses of aluminium absorbers. These additional calculations have revealed that a 46 m thick aluminium absorber foil offers the most favourable experimental conditions for observing and distinguishing the absorption peak of electrons and protons resulting from the DD reaction measured at ultra-low energies.
4 Discussion and Summary
In the present paper, a measurement method of high-energy electrons using a single Si surface barrier detector has been presented. The thickness of the detector is much lower than the range of electrons so that only an energy absorption spectrum can be observed. Since the stopping power value for electrons in the broad energy range 0.5 – 20.0 MeV is almost constant, we observe a broad energy bump of the detected electrons, the position of which depends only on the thickness of the detector. Detailed Geant 4 MC simulations, taking into account the entire experimental setup consisting of the target chamber, target holder, target plate and detector holder, show that the resulting energy spectrum for monoenergetic electrons is much more complicated. The study has been focused on the recognition of the energy spectrum component produced by the scattered electrons. This contribution is especially visible in the low energy part of the spectrum and arises from the backscattered electrons on the target holder. For the first time, we have shown that the strength of different energy spectrum contributions changes significantly for different detector thicknesses and absorption foils usually placed in the front of the detector to enable particle identification.
The measurement method is especially useful for experiments dealing with high-energy electrons of continuous energy spectrum because of the absorption bump formation that allows to improve the effect-background ratio for processes of a relatively small probability. An example for that is the internal e+ e- pair creation (IPC) in the deuteron-deuteron (DD) nuclear reaction at energies far below the Coulomb barrier. This process, producing continuous energy electrons and positrons up to 22.8 MeV, is much weaker compared to the 2H(d,p)3H and 2H(d,n)3He reactions, even though an enhancement due to the recently observed threshold resonance in 4He can be expected [17, 8]. To study this mechanism, the determination of the branching ratio between IPC and the proton emission for different deuteron energies is necessary [9]. To be sure that the observed energy bump in the detector energy spectrum (see Fig. 6) results from IPC, we have employed Si detectors of different thicknesses and used additional absorption Al foils in the front of the detectors. The measurements were accompanied by detailed Geant 4 simulations which allowed to determine the energy spectrum of emitted electrons/positrons and scattering effects studied before for monoenergetic electrons.
| BR @ 16 keV () | Reduction of BR (%) | |||
|---|---|---|---|---|
| Scattering | Proton Scattering | Al absorber Attenuation | LEP | |
| 0.05 | 0.01 | 0.001 | 0.003 | |
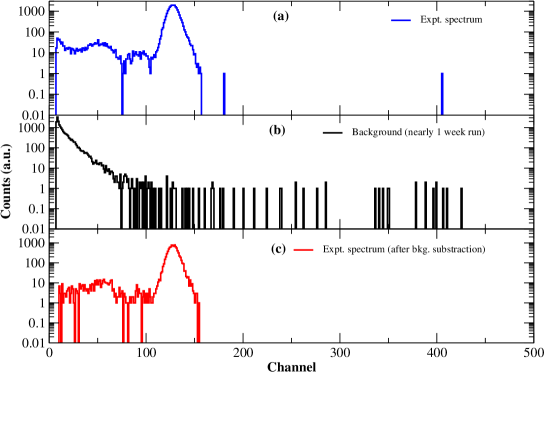
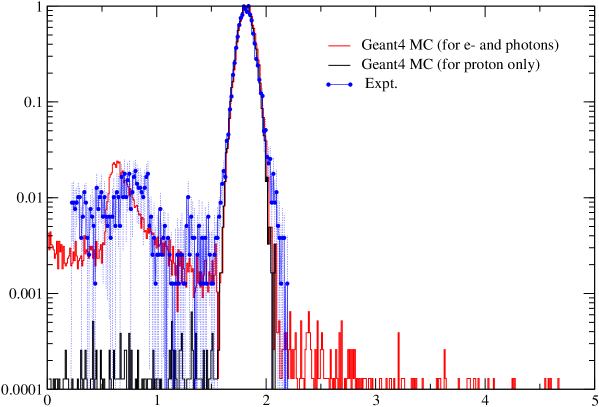
In Fig. 7, the charged particle spectrum measured by the 2 mm thick Si detectors with 46 m-thick absorption Al foils at the deuteron energy of 16 keV is shown. The foil thickness was tuned to remove from the spectrum tritons of energy 1.2 MeV and 3He particle of energy 0.8 MeV. They are fully absorbed in the Al foil. The protons emitted with energy of about 3 MeV lose about 0.4 MeV in the Al foil and can be clearly seen with a maximum in channel 130. The measured long-run background (for almost a week) was subtracted from the originally measured spectrum, and a noticeable bump around channel 55, nearly ten times weaker than the proton peak could be observed. A corresponding Geant 4 MC simulation and comparison with the experimental spectrum is presented in Fig. 7. The calculations have taken into account also the contribution resulting from the scattered protons which is of order 10-4 compared to the full energy line of protons. A slight difference in the calculated energy peak position of electrons (nearly 50 keV) can be observed. It might be due to uncertainty in straggling for high-energy electrons for Si medium and uncertainty of the actual thickness of Si surface barrier detector which depends on the supply voltage applied. An increase in the counting rate at very low energies corresponds mainly to the low-energy photons produced due to the bremsstrahlung and secondary recombination effects, e.g. about 80 keV X-rays induced in the gold surface layer of the detector (see also Fig. 4). Thanks to MC simulations the branching ratio between the IPC and proton channel could be estimated to about . The energy dependence of the branching ratio measured by different Si detector and Al foil thickness setups taking into account corresponding corrections could be also determined [9, 18].
In summary, we would like to underline that the presented method enables to study very weak nuclear processes resulting in high-energy electron emission. However, an accompanying Monte Carlo simulation of different electron scattering processes in the actual applied experiment setup is necessary to determine the absolute strength of the studied phenomena.
Acknowledgments This project has received funding from the European Union’s Horizon 2020 research and innovation programme under grant agreement No 951974.
References
- [1] J. C. Humphreys, and J. W. Motz, Tech. Note 489, CODEN: NBTNA; ”Tables of Response Functions for Silicon Electron Detectors (1969)”.
- [2] MJ. Berger, S.M. Seltzer, S.E. Chappell, J.C. Humphreys and J.W. Motz, Nucl. Instr. and Meth. 69, 181 (1969).
- [3] Th. Frommhold, W. Arnold, H. Friedrichs, R. Gobel, R.D. Heil, U. Kneissl, U. Seemann, F. Steiper, C. Kozhuharov, Nucl. Instrum. Meth. A, Volume 310, Pages 657-664(1991).
- [4] G.Soti and F. Wauters and M. Breitenfeldt and P. Finlay and I.S. Kraev and A. Knecht and T. Porobi and D. Zakouck y and N. Severijns, Nucl. Instrum. Meth. A Volume 728, Pages 11-22 (2013).
- [5] GEANT4, a Toolkit for the Simulation of the Passage of Particles through Matter Developed at CERN, ⟨http://geant4.cern.ch/⟩.
- [6] S. Agostinelli et al., Geant4 —a simulation toolkit, Nucl. Instrum. Meth. A. 506 , 186 (2003).
- [7] Silicon charged particle radiation detectors instruction manual, Ortec, 100 Midland Road, Oak Ridge.
- [8] K. Czerski, et al., Phys. Rev. C (Letters). 106, L011601 (2022).
- [9] K. Czerski, et al., submmitted to Phys. Rev. C (Letters), arXiv:2305.1710 (2023).
- [10] M. Kaczmarski, et al., Acta Phys. Pol. B 45, 509 (2014).
- [11] K.Siegbahn, Alpha-, Beta- and Gamma-Ray Spectroscopy 1st Edition - January 1, 1979, (https://www.elsevier.com/books/alpha-beta-and-gamma-ray-spectroscopy/siegbahn/978-0-7204-0083-0) eBook ISBN: 9780444596994, Pages(62-64).
- [12] M. E. Rose, Phys. Rev. 76, 678 (1949); 78, 184 (1950).
- [13] K E Stiebing et al., J. Phys. G: Nucl. Part. Phys. 30, 165 (2004).
- [14] A. J. Krasznahorkay et al; Phys. Rev. C (Letters) 104, 044003 (2021).
- [15] Basunia MS et al., Nuclear Data Sheets 107, 791 Evaluated Nuclear Structure Data File (ENSDF). National Nuclear Data Center (NNDC), Brookhaven National Laboratory, Upton, New York.
- [16] J.F. Ziegler, J.P. Biersack, M.D. Ziegler SRIM – The Stopping and Range of Ions in Matter”, Nucl. Instrum. Meth. B: Volume 268, Pages 1818-1823 (2010).
- [17] K. Czerski, et al., Europhys. Lett. 113, 22001 (2016).
- [18] R. Dubey, et al., to be published in Acta Physica Polonica B, Proceedings Series. 37th .