capbtabboxtable[][\FBwidth]
Testing a Neural Network for Anomaly Detection in the CMS Global Trigger Test Crate during Run 3
Abstract
We present the deployment and testing of an autoencoder trained for unbiased detection of new physics signatures in the CMS Level-1 Global Trigger (GT) test crate during LHC Run 3. The GT test crate is a copy of the main GT system, receiving the same input data, but whose output is not used to trigger the readout of CMS, providing a platform for thorough testing of new trigger algorithms on live data, but without interrupting data taking. We describe the integration of the Neural Network into the GT test crate, and the monitoring, testing, and validation of the algorithm during proton collisions.
1 Introduction
The CMS detector [1, 2] reads out far more data than can be processed, reconstructed, and analyzed. In order to use any of the TB/s being generated, a reduction of more than 99% is necessary. The job of the CMS Level-1 trigger (L1T), which it does in real-time on a chain of field programmable gate arrays (FPGAs) [3], is to perform this data reduction without missing interesting physics events. Operating on the clock of the LHC, where collisions occur every 25 nanoseconds, requires the entire system to adhere to microsecond latency constraints. Furthermore, stability is crucial for this system. Any error can lead to detector "dead time", where data is lost forever.
A potential problem of traditional trigger strategies is that they rely either on a priori knowledge of signal or generic kinematic selections. This problem is addressed by triggering on how anomalous an event is. A variational autoencoder (VAE) trained on real unbiased CMS data to detect outliers offers a solution that is both signal agnostic (applicable to signatures we have not had the foresight to target specifically) and highly sensitive (effectively boosts signal efficiency for multiple physics signatures) [4, 5].
2 Anomaly Detection Trigger Algorithm
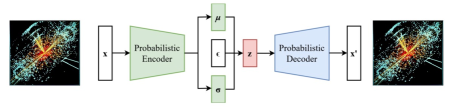

The VAE design uses an information bottleneck created by a small-dimensional latent space, which enforces an efficient data encoding, and leads the model to learn what makes an event anomalous. For this Anomaly Detection implementation in the CMS Level-1 Global Trigger, called Anomaly eXtraction Online Level-1 Trigger aLgorithm (AXOL1TL), the inputs are taken from a set of standard L1T objects (, 4 e/, 4 , and 10 jets) as vectors. The design of the VAE, visualized in figure 1, was driven by the constraints of the L1T system. Multiple steps were taken to minimize latency and resource utilization, including the removal of the decoder network, and the simplification of the latent space loss term, shown in (2.1). The reconstruction term is computed from the difference between the input (x) and output () of the VAE. The second, full regularization term, is the Kullback–Leibler divergence (KL-divergence) between the latent space distribution and a standard normal distribution with mean and standard deviation . The parameter can be tuned to balance the reconstruction performance with more efficient latent space encoding. At inference time, the loss is approximated by the mean-squared term of the KL-divergence for latency considerations. This approximation has no impact on performance.
| (2.1) |
AXOL1TL is trained with unbiased data collected by the CMS Experiment during 2023 with proton collisions at a centre of mass energy TeV. From this dataset, 10.5 million events were used: 50% for training and 50% for setting thresholds on the anomaly score. Quantization aware training, where inference-time quantization is emulated during training using the package QKeras [6], allowed for optimal performance in the final hardware implementation. A set of thresholds to demonstrate the range of performance possible with AXOL1TL was chosen, plotted in figure 2, estimating the L1T rate for different thresholds.
[\capbeside\thisfloatsetupcapbesideposition=right,top,capbesidewidth=.5]figure[\FBwidth]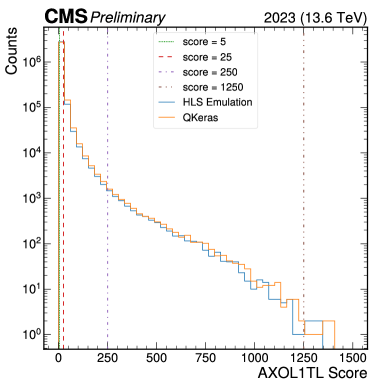
For the 2023-trained model, an example of the significant performance improvement for Beyond the Standard Model (BSM) signals, measured in simulated events, by adding AXOL1TL to the 2023 trigger menu is shown in table 1.
| AXOL1TL Rate | 1 kHz | 5 kHz | 10 kHz |
|---|---|---|---|
| Signal Efficiency Gain | 46% | 100% | 133% |
3 CMS Global Trigger Firmware
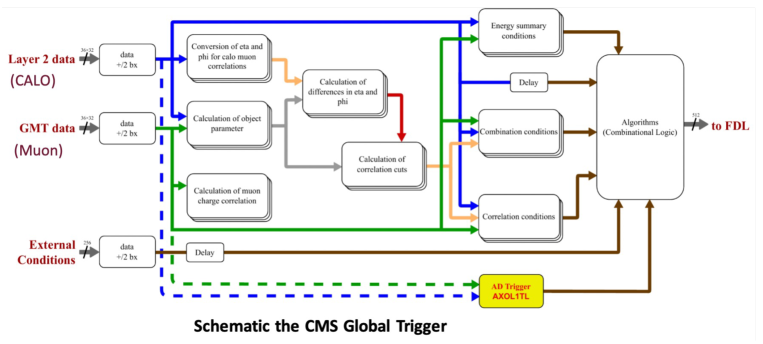
The firmware for the Anomaly Detection algorithms had to be integrated into the existing CMS Global Trigger () board structure [7], shown in in figure 3. To meet timing, the score is calculated in concert with other global trigger quantities, fed into the trigger combination logic, and its corresponding trigger decisions are read out via the standard links.
High-level synthesis (HLS) was used to generate the hardware code (VHDL) for the FPGA, utilizing the hls4ml package to efficiently synthesize the neural network [8]. To incorporate the trigger information into the common CMS software tools, an external CERN Gitlab repository for HLS dependencies was made. This code generates the bitfiles that configure the trigger boards.
Vivado co-simulation tests, shown in table 2, demonstrate that the synthesized VHDL code meets the L1T latency requirement of 50 ns and takes up only a small fraction of the resources available on the Xilinx Virtex-7 chip [9].
| Latency | LUTs | FFs | DSPs | BRAMs | |
| AXOL1TL | 2 ticks (50 ns) | 2.1% | 0% | 0% | 0% |
Further validation was performed to ensure trigger decisions were being computed correctly for the given thresholds. A ModelSim emulator, the standard CMS tool for L1T menu [10] validation was used. Test vector files with the Level-1 objects, detector conditions, and an independently emulated reference decision were read into the environment, and table 3 shows the perfect trigger bit agreement observed. This successful ModelSim test confirmed a functional firmware module that could be implemented in hardware, with final triggers decisions that could be accurately emulated and verified.
|
L1 Menu
Index |
L1 Menu
Algorithm Name |
Test Vector
Count |
Hardware
Emulation Count |
Agreement |
|---|---|---|---|---|
| 94 | L1_ADT_20000 | 0 | 0 | ✓ |
| 95 | L1_ADT_4000 | 29 | 29 | ✓ |
| 103 | L1_ADT_400 | 2618 | 2618 | ✓ |
| 108 | L1_ADT_80 | 3331 | 3331 | ✓ |
4 Test Crate Implementation
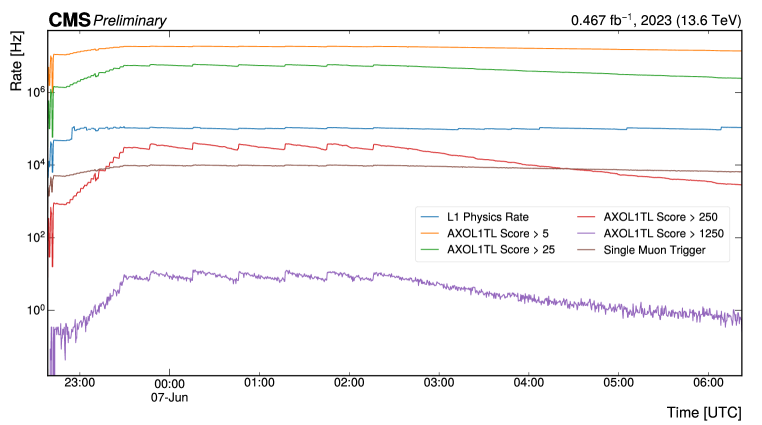
Once validated, the firmware was implemented on the CMS Global Trigger Test Crate (TC); The TC is a set of identical MP7 boards that are used as backup for the production system, as well as for testing new trigger strategies. In this configuration, the TC is set to read in the same inputs, but without actually triggering on events and saving data. The TC is connected to the CMS Prometheus monitoring server that can query trigger metrics in real-time allowing us to monitor trigger rates for the anomaly trigger paths while data is being taken, shown in figure 4.
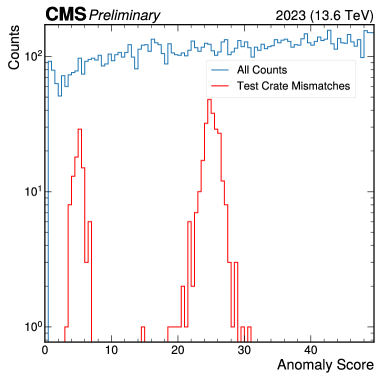
For particular runs, events that were triggered and saved by the production system contain TC information, showing which trigger bits were fired. This allows for a final validation of the anomaly score performance with respect to emulation. Figure 6 and table 6 show that for such events we see minimal mismatches and reasonable agreement between hardware and emulation.
|
L1 Menu
Algorithm Name |
Test Crate
Count |
Standalone
Emulation Count |
Mismatches |
|---|---|---|---|
| L1_ADT_20000 | 1 | 1 | 0 |
| L1_ADT_4000 | 742 | 741 | 19 |
| L1_ADT_400 | 21236 | 21229 | 253 |
| L1_ADT_80 | 25468 | 25481 | 93 |
5 Summary
We have shown a signal-agnostic trigger model sensitive to interesting physics. A firmware implementation for this trigger algorithm was successfully integrated into the CMS Level-1 trigger architecture. Using the CMS Global Trigger test crate, we showed an active hardware trigger that performed consistently during 2023 collisions. Finally, validation was performed at each steps using HLS emulation. We plan to update this algorithm and prepare downstream trigger logic to implement the Anomaly eXtraction Online Level-1 Trigger aLgorithm (AXOL1TL) in the Level-1 trigger for 2024 data-taking.
References
- [1] CMS Collaboration, The CMS experiment at the CERN LHC, Journal of Instrumentation 3 (2008) S08004.
- [2] CMS Collaboration, Development of the CMS detector for the CERN LHC Run 3, Tech. Rep. CMS-PRF-21-001, CERN-EP-2023-136, CMS-PRF-21-001-003, CERN, Geneva (2023).
- [3] CMS Collaboration, The Phase-2 Upgrade of the CMS Level-1 Trigger, Tech. Rep. CERN-LHCC-2020-004, CMS-TDR-021, CERN, Geneva (2020).
- [4] E. Govorkova et al., Autoencoders on field-programmable gate arrays for real-time, unsupervised new physics detection at 40 MHz at the Large Hadron Collider, Nature Mach. Intell. 4 (2022) 154 [2108.03986].
- [5] J. Duarte, S. Han, P. Harris, S. Jindariani, E. Kreinar, B. Kreis et al., Fast inference of deep neural networks in FPGAs for particle physics, Journal of Instrumentation 13 (2018) P07027 [1804.06913].
- [6] C.N. Coelho, A. Kuusela, S. Li, H. Zhuang, T. Aarrestad, V. Loncar et al., Automatic heterogeneous quantization of deep neural networks for low-latency inference on the edge for particle detectors, Nature Mach. Intell. 3 (2021) 675 [2006.10159].
- [7] M. Jeitler et al., The level-1 global trigger for the CMS experiment at LHC, JINST 2 (2007) P01006.
- [8] FastML Team, hls4ml, May, 2023. 10.5281/zenodo.7933047.
- [9] AMD Xilinx, “Virtex 7 FPGA.” https://www.xilinx.com/products/silicon-devices/fpga/virtex-7.html.
- [10] B. Herbert, “l1menus.” https://github.com/herbberg/l1menus, 2020.
- [11] CMS Collaboration, Performance of missing transverse momentum reconstruction in proton-proton collisions at TeV using the CMS detector, JINST 14 (2019) P07004 [1903.06078].
- [12] CMS Collaboration, Anomaly Detection in the CMS Global Trigger Test Crate for Run 3, Tech. Rep. CMS-DP-2023-079, CERN, Geneva (2023).