The detection and characterization of highly magnified stars with JWST: Prospects of finding Population III
Abstract
Gravitational lensing may render individual high-mass stars detectable out to cosmological distances, and several extremely magnified stars have in recent years been detected out to redshifts . Here, we present Muspelheim, a model for the evolving spectral energy distributions of both metal-enriched and metal-free stars at high redshifts. Using this model, we argue that lensed stars should form a highly biased sample of the intrinsic distribution of stars across the Hertzsprung-Russell diagram, and that this bias will typically tend to favour the detection of lensed stars in evolved stages characterized by low effective temperatures, even though stars only spend a minor fraction of their lifetimes in such states. We also explore the prospects of detecting individual, lensed metal-free (Population III) stars at high redshifts using the James Webb Space Telescope (JWST). We find that very massive () Population III stars at may potentially be detected by JWST in surveys covering large numbers of strong lensing clusters, provided that the Population III stellar initial mass function is sufficiently top-heavy, that these stars evolve to effective temperatures K, and that the cosmic star formation rate density of Pop III stars reaches cMpc-3 yr-1 at –10. Various ways to distinguish metal-free lensed stars from metal-enriched ones are also discussed.
keywords:
Stars: Population III – dark ages, reionization, first stars – gravitational lensing: strong – gravitational lensing: micro1 Introduction
The very first stars, formed out of gas with primordial composition, likely started forming at a time when the Universe was Myr old (cosmic redshift ), thereby bringing the cosmic “dark ages” to an end (see Klessen & Glover, 2023, for a recent review). Due to the lack of efficient coolants and fragmentation in the chemically unenriched gas at these early epochs, the resulting metal-free (a.k.a. Population III, hereafter Pop III) stars are believed to be characterized by extremely high masses (characteristic masses ; e.g., Hosokawa et al., 2016; Hirano & Bromm, 2018; Sharda & Krumholz, 2022) and short lifetimes ( Myr for stars in this mass range; Yoon et al., 2012). As some of these stars exploded as supernovae, the ambient gas was enriched with heavy elements which initiated the transition to the normal mode of star formation (population II and I), with much lower characteristic stellar masses as a result. While the Pop III star formation mode likely became cosmologically subdominant already at –25 (less than 200 Myr after the Big Bang), these stars may have continued forming at a low rate for several billion years within rare pockets of gas that remained unpolluted by metals (Magg et al., 2018; Mebane et al., 2018; Liu & Bromm, 2020). However, no massive Pop III stars have ever been directly detected, and – with the exception of supermassive Pop III stars (; e.g., Haemmerlé et al., 2018; Surace et al., 2018; Surace et al., 2019) or Pop III stars at the lowest redshifts ( for ) – their intrinsic fluxes place them far below the detection limits of both current and upcoming telescopes (Rydberg et al., 2013; Schauer et al., 2020).
Gravitational lensing can boost the fluxes of individual stars beyond the local Universe to detectable levels, and a few such stars have already been detected at –6 (Kelly et al., 2018; Rodney et al., 2018; Chen et al., 2019; Kaurov et al., 2019; Welch et al., 2022a; Kelly et al., 2022; Meena et al., 2023; Diego et al., 2022; Diego et al., 2023b, d). Very high levels of gravitational magnification () can also lift massive Pop III stars at redshifts as high as into the detection range of the James Webb Space Telescope (JWST), but the probability for such detections is sensitive to the detailed cosmic star formation history and stellar initial mass function of the Pop III stars (Rydberg et al., 2013; Windhorst et al., 2018).
The question of how to distinguish between a lensed, metal-enriched star and a bona fide Pop III object using JWST photometry or spectroscopy, and what stellar properties one can realistically hope to derive from such data, remains open.
While many papers have been devoted to the spectral signatures of Pop III galaxies or star clusters (e.g. Tumlinson & Shull, 2000; Tumlinson et al., 2001; Schaerer, 2002, 2003; Tumlinson et al., 2003; Inoue, 2011; Zackrisson et al., 2011; Mas-Ribas et al., 2016; Nakajima & Maiolino, 2022; Trussler et al., 2023), not much work has been devoted to the spectral signatures of individual lensed stars. Here, we present the Muspelheim111In Norse mythology, the stars of the night sky are interpreted as glowing sparks from Muspelheim, the realm of fire. models for the spectral energy distributions of individual, lensed stars at high redshifts, derive the required conditions for detecting highly magnified Pop III stars at and explore the prospects of distinguishing such stars from metal-enriched counterparts using JWST.
Section 2 includes an introduction to the computational machinery of the Muspelheim models. In Section 3, we use Muspelheim to explain why lensed, high- samples of stars obtained using JWST photometry will typically result in a highly biased sample of high-mass stars, favouring specific regions in the Hertzsprung-Russell (HR) diagram over others. This turns out to have a large impact on our forecasts for lensed Pop III star detections in Section 4, as some evolutionary pathways predicted for Pop III stars can significantly boost the detection probabilities of such stars in lensing surveys. In Section 5 we explore a number of features that can potentially be used to distinguish Pop III stars from metal-enriched lensed stars. Various uncertainties in the modelling of lensed stars are discussed in Section 6, and section 7 summarizes our findings.
2 The Muspelheim models
The Muspelheim model predicts the spectral energy distributions (SEDs) of stars as a function of age and initial (Zero-Age Main Sequence, ZAMS) mass at different metallicities. The model start from a set of stellar evolutionary tracks (section 2.1) which describe the bolometric luminosity , effective temperature , surface gravity and radius of stars as a function of age , , chemical composition and rotation. SEDs are generated for positions along the tracks separated by yr, or whenever has changed by compared to the last saved SED, by matching the and to a suitable stellar atmosphere spectrum from one of several pre-calculated grids (Section 2.2). This SED is then integrated and rescaled to match the bolometric luminosity of the star. As small mismatches between the and surface gravity of the track data point and the available pre-calculated stellar atmospheres are inevitable, this rescaling is required to minimize the impact of such defects on the predicted fluxes of the star. This results, for every Zero-Age Main Sequence (ZAMS) mass featured in the stellar evolutionary tracks, in an age sequence of stellar spectra with relatively low spectral resolution (SEDs) that cover the rest-frame ultraviolet to mid-infrared wavelength range. Using these spectra, we derive the ionizing luminosities and redshift-dependent AB magnitudes in a set of JWST broad- and medium band filters of these stars, assuming a , , km s-1 Mpc-1 cosmology. The Muspelheim model grids (spectra, ionizing fluxes, AB magnitudes in various filter sets) are publicly available (see Section Data Availability for access links).
2.1 Stellar evolutionary tracks
In this paper, we use the ‘Bonn’ Optimized Stellar Tracks (BoOST) (Szécsi et al., 2022) for low-metallicity stars (SMC metallicity; ) in the –575 range. For Pop III stars, several sets of alternative tracks are used: tracks in the –1000 range from Yoon et al. (2012), –100 tracks by Windhorst et al. (2018), –120 stars by Murphy et al. (2021) and 100–1000 stars by Volpato et al. (2023). These Pop III tracks differ in their assumptions on e.g., stellar rotation, magnetic torques, mass loss and overshooting, and consequently result in different predictions for mass, surface temperature, luminosity as a function on stellar age even for Pop III stars with identical ZAMS masses. We refer to the original papers for detailed descriptions on the input physics of these models, but note that whereas the Windhorst et al. (2018) and Volpato et al. (2023) models are for non-rotating stars only, Yoon et al. (2012) and Murphy et al. (2021) also consider models with various levels of rotation. The Yoon et al. (2012) models cover initial rotational velocities –0.6 for 10–250 and –0.4 at 300–1000 , where is the Keplerian velocity at the equatorial surface. The Murphy et al. (2021) models instead quantify the initial rotation of their models as the fraction of the critical break-up velocity , covering –0.4 throughout the 9–120 mass interval.
2.2 Stellar atmospheres
To produce stellar atmosphere spectra for metal-poor stars, we combine the O- and B-star TLUSTY grids of Lanz & Hubeny (2003, 2007) for –55000 K with the grid of Lejeune et al. (1997) at K, both at . For our Pop III models, we use the TLUSTY stellar atmosphere code (Hubeny & Lanz, 1995) to generate a grid of stellar atmosphere models with primordial chemical composition for effective surface temperatures in the range from 15000 K to K, and augment this with K with the lowest metallicity models () models from Lejeune et al. (1997) set. The wavelength coverage of these spectra is – Å for TLUSTY and – Å for the Lejeune et al. (1997) set.
To derive a suitable SED for each extracted data point along the stellar evolutionary tracks, these grids of stellar atmosphere spectra are interpolated in and . Details on this procedure can be found in Appendix. A.
While our models assume a primordial chemical composition for all Pop III stellar atmospheres, one should note that scenarios involving chemically homogeneous evolution and dredge-ups (e.g. Yoon et al., 2012; Song et al., 2020; Liu et al., 2021; Volpato et al., 2023) are expected to alter the surface composition of the star during their lifetimes (see Section 6.5 for a discussion). While this will affect individual spectral features, the impact on the overall photospheric SED as measured by broadband filter fluxes is likely to be negligible.
3 An observational bias in the Hertzsprung-Russell diagram
In this section, we use the Muspelheim models for the JWST broadband filter fluxes of high-redshift stars, as a function of initial mass and age, to demonstrate the existence of a strong selection bias of where in the HR diagram lensed stars are expected to turn up.
Massive, metal-enriched stars typically spend most of their lifetimes at relatively high ( K; Szécsi et al. 2022), but many of the currently known, lensed stars (e.g. Kelly et al., 2018; Meena et al., 2023; Diego et al., 2023b) are found at considerably lower temperatures (). We argue that this is due to a strong selection bias for lensed stars, caused by the combined effects of the detection limits (as a function of wavelength) and the lensing magnification distribution. Because of this bias, JWST surveys for lensed, high- stars will not be able to populate the Hertzsprung-Russell diagram uniformly, but will instead preferentially pick up stars from certain regions of the diagram (see also Diego et al., 2023a, for a discussion on this). Consequently, stars that evolve into such regions will be easier to detect, and this has direct consequences for the detection probabilities of Pop III stars, since not all proposed evolutionary paths for such stars will venture into the HR diagram regions where the detection prospects are optimized.
In general, the lensed-star selection function (i.e. the bias that determines what stars are lifted above the observational detection threshold through a combination of macro- and microlensing) is expected to be highly complex. If star formation were unclustered, we argue that this selection function should depend on the wavelength-dependent detection limits, on the shape of the magnification probability distribution, on the shape of the stellar IMF, on the evolution of stars of a given initial mass across the HR diagram, and the dust obscuration and reddening along the line of sight (with potential contributions from the circumstellar medium of the host star, the ISM at its location of birth, the ISM elsewhere in its host galaxy and within the cluster lens). The path that a star of a given initial mass follows across the HR diagram in turn depends on metallicity, rotation rate, the impact of binary evolution and the potential mergers of stars. The fact that most stars are likely to be born in star clusters brings additional complications, since the difference in magnification between one star and its immediate neighbours dictates whether the observer detects a single lensed star or the blended light from many. IMF sampling effects in small star clusters (e.g. Yan et al., 2023) and the potential ejection of some massive stars from their birth clusters also play a role. Here, we make no attempt to provide a definitive model for all of these effects, but simply use Muspelheim to demonstrate the likely biases in the highly simplified situation of single-metallicity stars obeying a specific IMF, while neglecting binary evolution, clustering and dust obscuration effects.
As stars age, they typically evolve from a long-lasting high state on the main sequence, to more short-lived states at lower (although rapid rotation, binary evolution and mergers can alter this behaviour; e.g., de Mink et al. 2009; Yoon et al. 2012; Szécsi et al. 2022; Wang et al. 2022). This is typically accompanied by an increase in , although this increase can be rather modest for the most massive stars, which are predicted to evolve almost horizontally across the Hertzsprung-Russell diagram (e.g. Yoon et al., 2012; Windhorst et al., 2018; Volpato et al., 2023).
One may perhaps naively expect that most lensed stars would be detected in their more-long lasting main-sequence states, but there are observational biases that favour the detection of more evolved stars. At fixed , a low- star attains a higher flux at the peak of its SED compared to that of a high- star222This is because so that fluxes at short wavelengths contribute more to than a similar at long wavelengths. The increase in peak brightness with decreasing at fixed holds for both stellar atmosphere spectra and black body spectra if flux is expressed in units, but not if it’s expressed in units.. Since the JWST/NIRCam detection limits are relatively constant in units across the m range, this means that a high-, low- star requires a lower gravitational magnification to be rendered detectable compared to a high- star at the same redshift. Since the probability to attain a certain magnification approximately goes as in the source plane (up to some limit; see Section 3.1), a star will typically attain a higher detection probability in its more evolved, lower- states even though much less time is spent in such evolutionary stages (see Appendix B for further discussion on this).
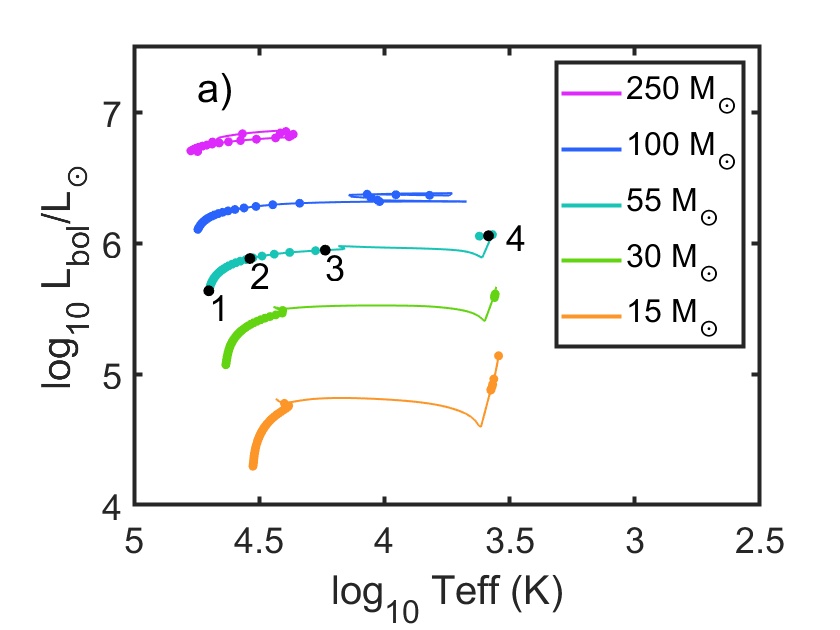
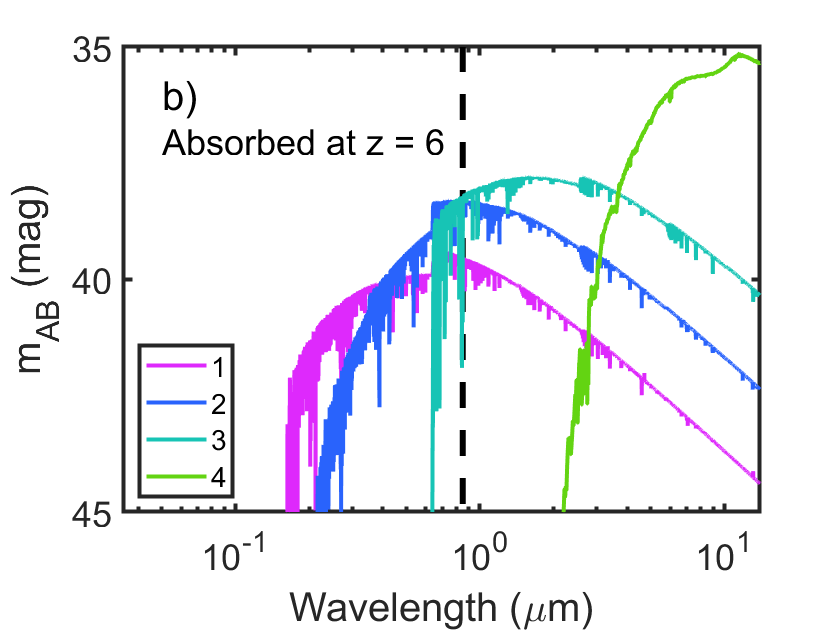
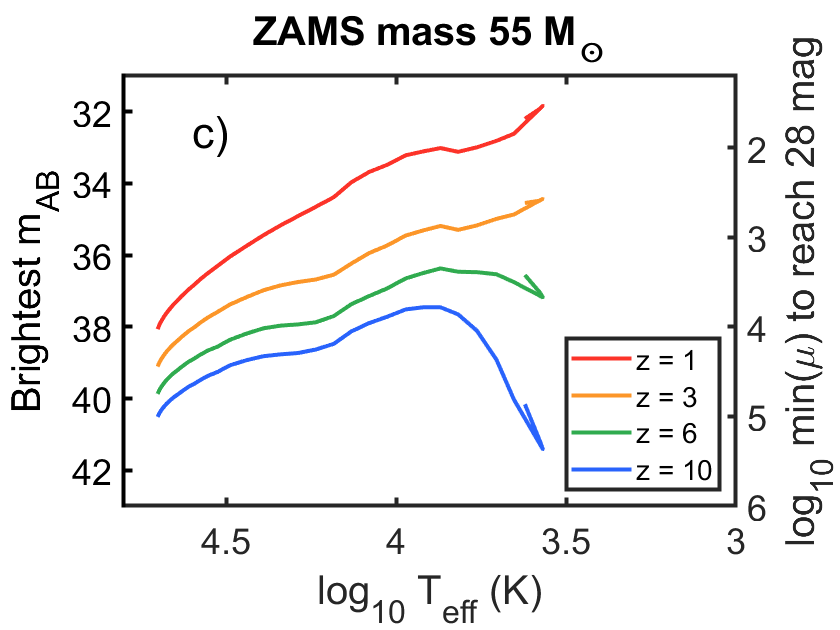
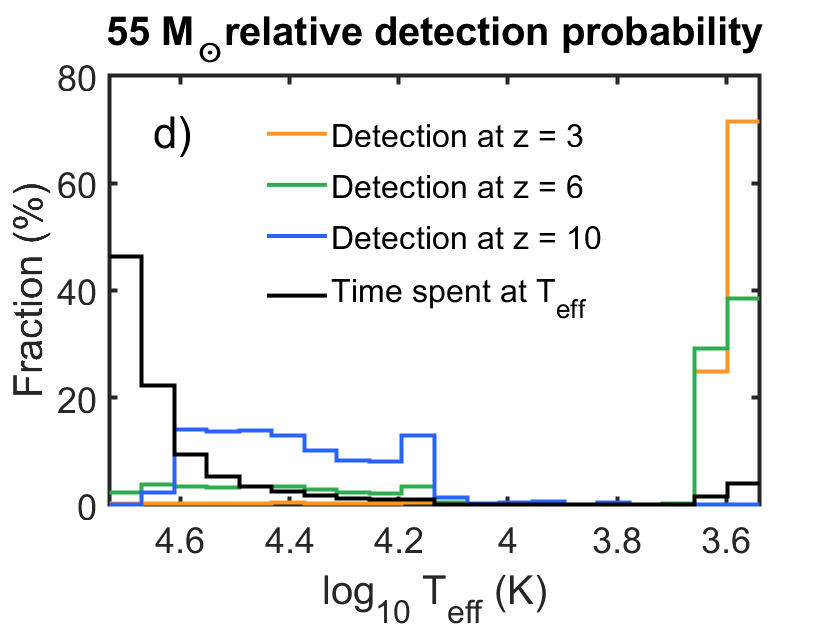
We demonstrate this effect for a 55 star at –10 in Fig. 1. In general, this bias will favour detection of the lowest- states along the stellar evolutionary tracks, as long as these are not too short-lived, and as long as the peak of the SEDs of these low- stars falls within the wavelength range of JWST/NIRCam at the redshift of the star. If the redshift is increased, the most favoured gradually shifts towards higher , since the peak of lower- stars redshifts out of NIRCam range. However, the selection function still looks very different from one based simply on how long stars occupy different states.
3.1 Modelling the selection function of lensed stars
Here, we use Muspelheim to simulate the expected distribution of low-metallicity () lensed stars at –10 in the HR diagram for a JWST/NIRCam survey of cluster-lens fields. To do this, we assume a fixed detection limit (in the 27–30 AB magnitude range) in NIRCam filters F090W, F115W, F150W, F200W, F277W, F356W and F444W.
For plotting purposes, we at each redshift interpolate the Muspelheim models for the AB magnitudes of stars along the Szécsi et al. (2022) evolutionary tracks to a finer mass resolution, and derive the brightest AB magnitudes in the JWST/NIRCam bands as a function of redshift at each data point along these interpolated tracks.
To model the intrinsic distribution of stellar masses, we adopt a stellar initial mass function (IMF) with the same high-mass slope as the Kroupa (2001) universal IMF () throughout the 10–150 mass range.
We then run a Monte Carlo simulation which draws a sample of stars that obey the adopted IMF, randomly assigns ages up to 30 Myr and rejects stars which, based on their initial mass, have expired at their selected age. This corresponds to a situation where stars of any age may drift across the source-plane caustic of the clusters surveyed. This is a fair assumption in a case where the sample of lensed stars comes from many highly magnified galaxies with different star formation histories. However, this may not accurately reflect a situation in which the sample of lensed stars comes from a single, highly magnified galaxy, since the actual age distribution of stars would then be dictated by the detailed star formation history of that particular galaxy.
For every Monte Carlo generated star, a random magnification is assigned under the assumption of a source-plane probability distribution function , and the brightest NIRCam wide-band flux is shifted accordingly to predict the brightest apparent magnitude across the NIRCam bands of the star. Stars that do not reach the adopted JWST detection threshold in at least one of the NIRCam filters assumed are rejected from the simulated sample.
We note that in the resulting sample of the lensed stars that make it above the JWST detection threshold, the distribution (or equivalently ) will no longer be obeyed, even though stars were initially assigned magnifications from this distribution. This happens because some stars can be rendered detectable at lower magnifications than others. The reason for this bias can be understood through the following thought experiment: Let’s assume that there are only two types of stars, A and B, which both retain fixed positions in the HR diagram until they expire. Due to having different intrinsic brightness, star A may be detected when , whereas star B requires to be lifted above the detection threshold. If these stars were equally common, then one would expect to detect B one hundred times less often than A (). However, if B is times more common then A (due to the IMF or a longer lifetime), then the probability to detect A and B become comparable, and hence magnifications of and turn out about equally likely in the observed sample of lensed stars, which violates the distribution. In practice, however, the magnification distributions of our simulated samples are never flat, and the highest magnifications are still the rarest, but the mean or median magnifications may vary substantially with the adopted detection limit and choice of stellar evolutionary tracks.
In this section, we only consider stars with magnifications in the – range. The lower limit is motivated by the desire to reject lensed stars that may not necessarily be identifiable as such. Many stars located within the same star cluster as a moderately magnified star (–1000) located close to to a macrolensing caustic could end up with similar magnifications, thereby making the observed object manifest itself as a lensed star cluster rather than an individual star. The upper limit is set by the fact that higher magnifications are highly unlikely in realistic settings, as argued by Diego et al. (2018). While the absolute scaling of the magnification distribution is important for the absolute number of lensed stars expected to be detected in a given survey, we are in this section only concerned with the relative distribution across the HR diagram of the lensed stars that are detected (i.e. where in the HR diagram lensed stars are likely turn up, not the number of stars that turn up in those regions), for which the scaling factor does not matter.
Stars that attain their high magnifications due to microlensing by stars in a foreground galaxy cluster, for instance because they were selected based on variability criteria in multi-epoch observations, may show a slightly different HR diagram bias compared to stars that attain their high magnification due to their close proximity of a cluster macrolensing caustic. In general, the size of a star sets an upper limit on its microlensing-induced magnification, which would make microlensing disfavour detection of the largest stars.
While the exact size-magnification limit depends on the gradient of the lensing potential at the position of the event, and the surface mass density in stars at this location (e.g. Venumadhav et al., 2017; Meena et al., 2023), we here adopt a size-magnification limit of the form
| (1) |
with either or , where the higher value corresponds to a lower contribution from microlenses to the surface mass density. Here, is the angular size distance to the source at redshift , and is the radius of the star in units of Solar radii.
3.2 Selection bias for metal-enriched stars obeying a standard IMF
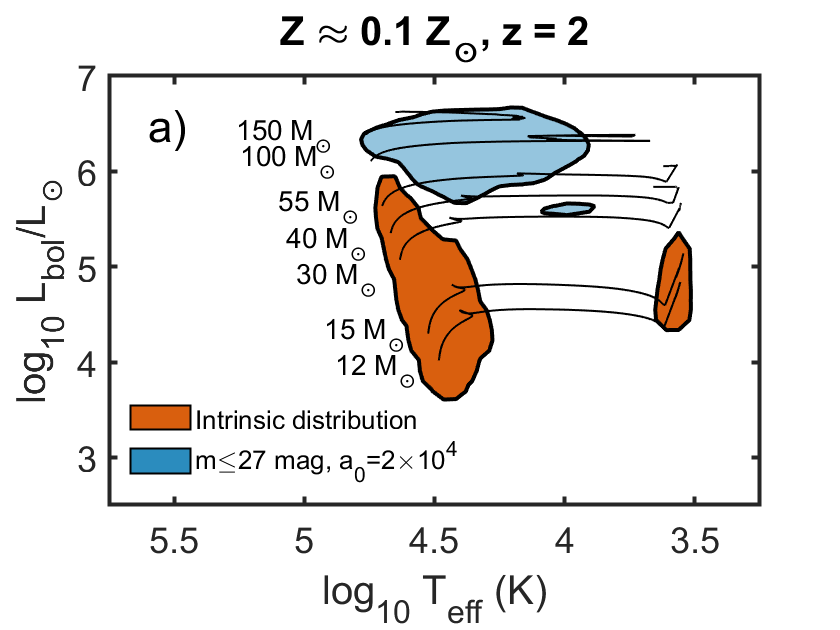
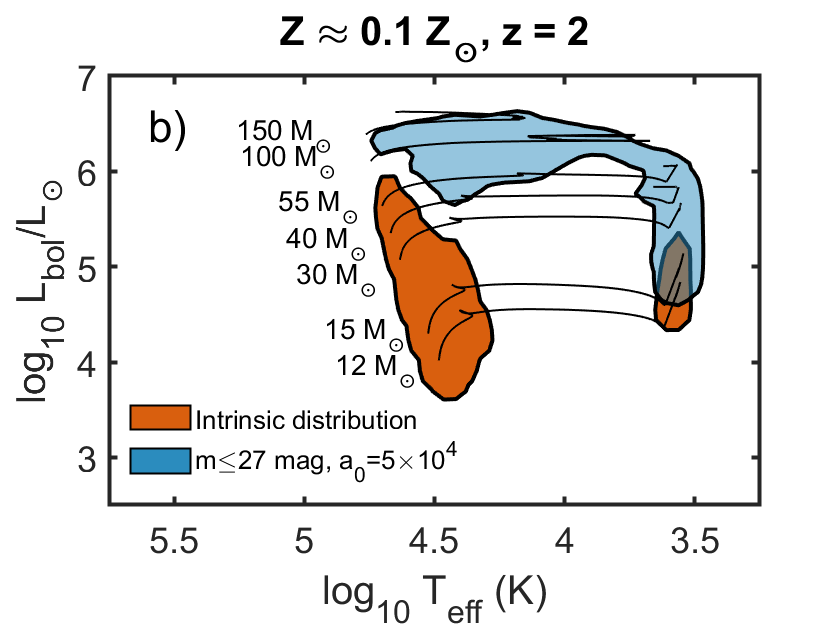
To illustrate the effects of the resulting selection biases, we in Fig. 2 compare the intrinsic distribution of stars with initial masses 10–150 in the HR diagram with the most likely regions for lensed stars to appear at in a JWST survey reaching 27.0 AB magnitudes, given our models. The intrinsic distribution is dominated by stars on, or close to the main sequence at , and by stars that have evolved to red supergiants at . In a lensed sample with a microlensing size-magnification limit (equation 1) of (Figure 2a), the observed distribution instead gets dominated by more massive stars (–) with temperatures extending down to . Adopting a less constraining microlensing size-magnification limit with (Figure 2b) also allows red supergiants produced by stars of mass to be detected.
In fact, here produces a situation where the microlensing size-magnification has a very minor impact on the selection function of lensed stars, and their preferred territory in the Hertzsprung-Russell diagram becomes almost indistinguishable from one where no size-magnification limit is adopted (i.e., similar to the case where the lensing is dominated by a smooth cluster macrolensing potential).
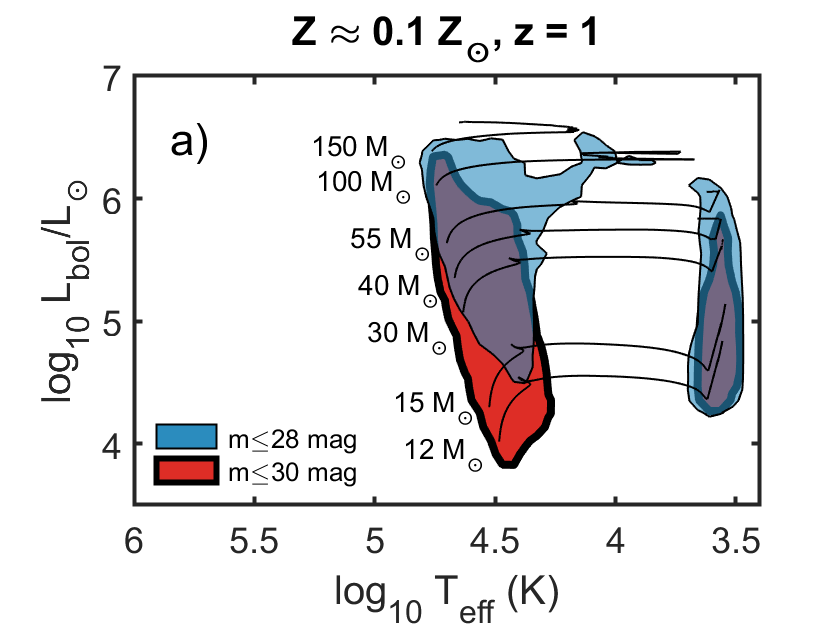
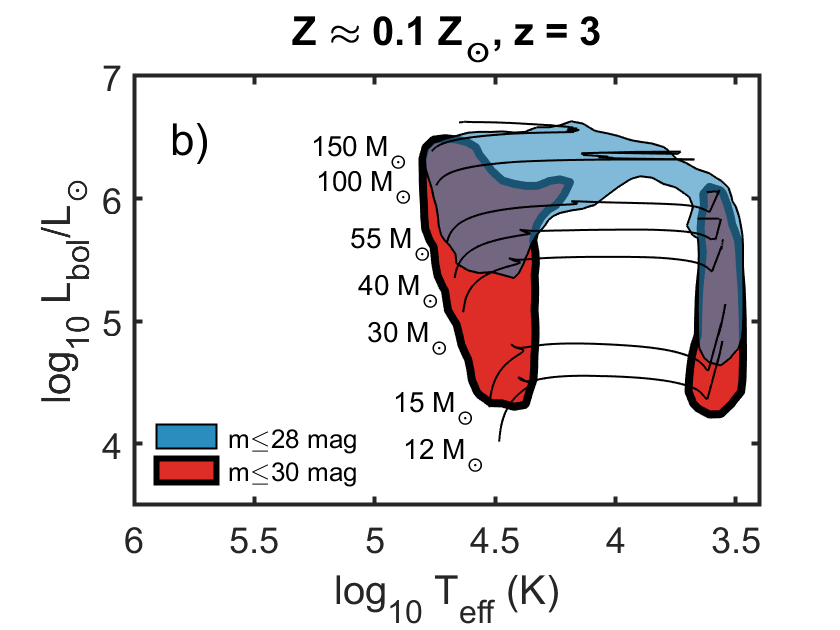
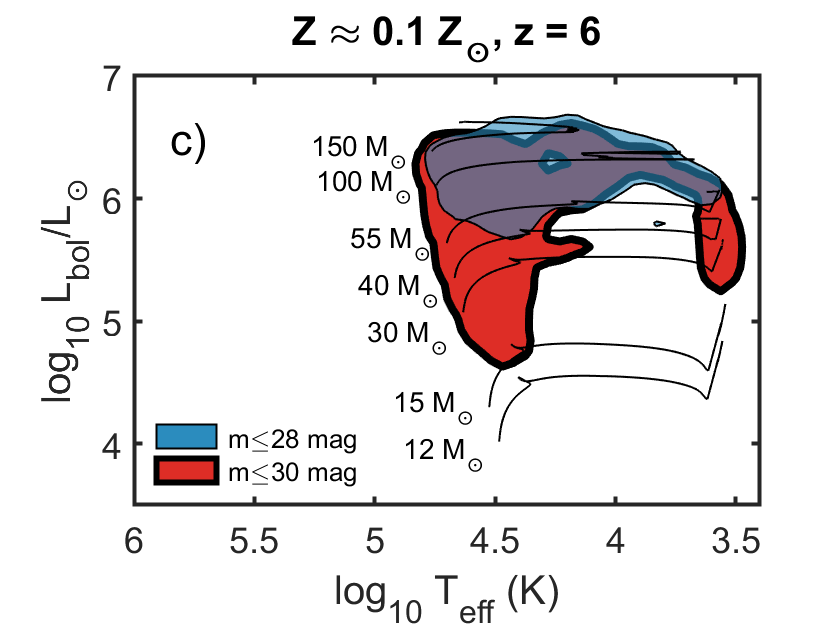
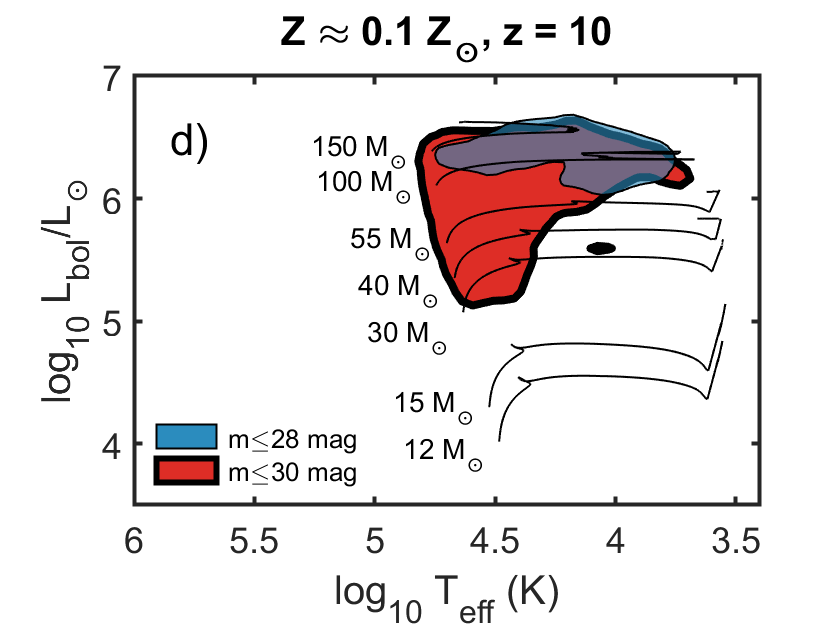
Using , we in Fig. 3 indicate the most likely regions in the HR diagram for stars to appear at , 3, 6 and 10, in the case of two different JWST photometric surveys depths: 28.0 and 30.0 AB magnitudes. At and with an ultradeep 30.0 AB mag survey limit (red patch in Figure 3a), the distribution is not too dissimilar from the intrinsic distribution of stars (orange patch in Figure 2, but increasing the redshift or changing the detection limit to 28.0 AB mag (blue patches) acts to favour the detection of stars at higher bolometric luminosities (and higher ZAMS masses) and lower . At the chance of detecting red supergiants at quickly diminishes, since the SED peaks of these stars redshift out of JWST/NIRcam range.
It is interesting to note that for the brighter detection limits (27–28 AB mag in Fig. 2 and 3), the relative probability of stars to turn up in the 4000–15000 K range (–4.2) becomes substantial, in agreement with recent JWST detections of lensed stars (Kelly et al., 2018; Welch et al., 2022b; Meena et al., 2023; Furtak et al., 2023; Diego et al., 2023d, c), even though stars in this temperature range are exceedingly rare (mostly luminous blue variables and yellow supergiants).
The limit of imposed in Fig. 3 also has some interesting consequences on the predicted distribution of lensed stars in the HR diagram at the lower redshifts (here –3), since some stars may in principle be rendered detectable at magnifications significantly below this limit. This is most readily seen when comparing the distribution around the 55 track in Fig. 3b with the relative detection probability for 55 stars as a function of in Fig. 1d, where no corresponding lower limit on the magnification was imposed. In the latter case, stars on the red supergiant branch become far more prevalent than in Fig. 3b, since red supergiants at this redshift can be rendered detectable also at (Fig. 1c). Imposing therefore alters the predicted observed ratio of high- to low- stars. Recall that the limit was here adopted to avoid situations in which many stars could attain similar magnifications, thereby potentially manifesting the object as a lensed star cluster rather than a single magnified star. However, some massive stars may be ejected from their birth clusters (e.g. Oh & Kroupa, 2016) and may then be identified as individual stars (or binaries) at any magnification that pushes them above the photometric detection limit. This implies that the observed distribution of lensed star in the HR diagram will to some extent also depend on the clustering of stars as a function of their parameters, i.e., the probability by which they appear in a cluster- vs. field environment.
We stress that we in Figure 3 only show the expected HR diagram distribution of stars with ZAMS mass . However, at the lowest redshifts (e.g., –3), it is possible that stars with ZAMS mass could also enter surveys reaching 28–30 AB mag, since the most likely regions extend down to the lowest-mass tracks plotted.
3.3 Selection bias for Pop III stars with top-heavy IMFs
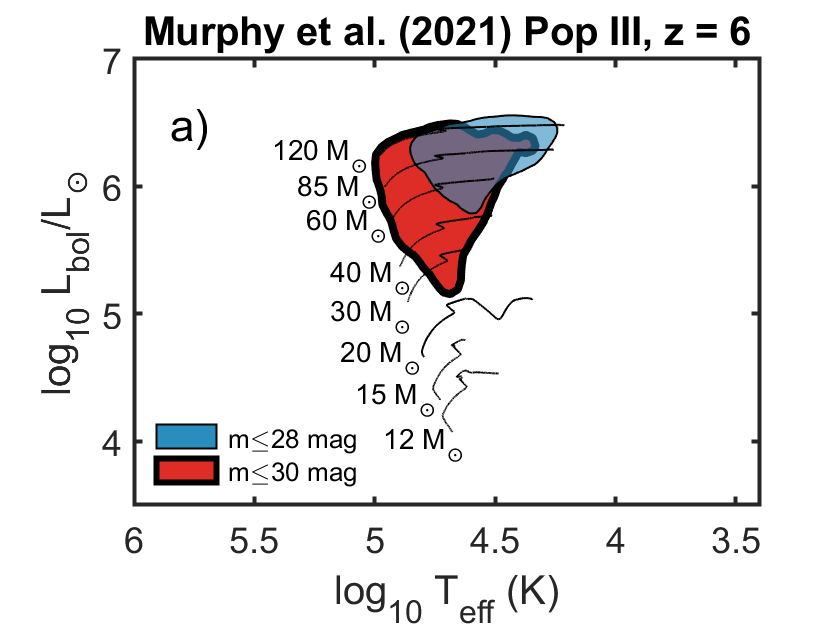
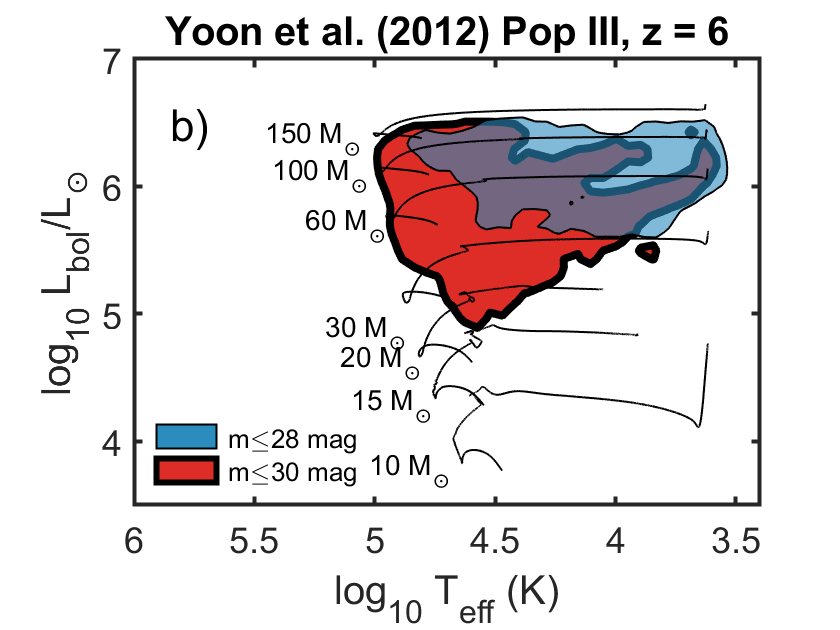
In Figure 4, we depict the same selection bias (here with , 28.0 and 30.0 AB mag) as in the previous section, but now in the case of Pop III tracks from Murphy et al. (2021) and Yoon et al. (2012) with no initial rotation, under the assumption of a top-heavy, log-normal IMF (Tumlinson, 2006, , with characteristic mass and ), for – stars at .
A fundamental difference between the Murphy et al. (2021) and Yoon et al. (2012) tracks is that the latter predict non-rotating Pop III stars to reach a K stage for whereas the former stay above 15000 K until the end of the tracks. As we have previously shown that low- stages, even if very short-lived, can have a significant impact on the detectability of lensed stars, this difference leads to very different predictions on where in the HR diagram lensed Pop III stars are the most likely to be detected.
As a result, the Yoon et al. (2012) tracks predict red supergiants to be detectable in samples with detection limits at both 28.0 and 30.0 AB magnitudes, whereas the Murphy et al. (2021) tracks produce distributions that are limited to the K range.
It is worth noting that the peak temperatures of these Pop III stars at early stages of evolution ( K) are, for both Yoon et al. (2012) and Murphy et al. (2021) tracks, detectable only at a detection limit of 30.0 AB magnitudes. This extension towards very high also represents one of the main difference between the predicted HR-diagram distribution of 10–120 Pop III stars (Figure 4) and the corresponding distribution for metal-enriched stars at (Figure 3c), as the latter do not appear at K () given our chosen set of tracks. However, even if K objects were to appear in a sample of lensed stars, measuring their temperatures sufficiently well to constrain their location to this part of the HR diagram may be extremely challenging at faint magnitudes, as discussed in Sect. 5. Moreover, Wolf-Rayet stars can also attain temperatures of , and alternative sets of tracks for metal-enriched stars that include this phase (e.g. Eldridge & Vink, 2006) would likely shift the predictions to higher than shown in Figure 3c.
Hence, the identification of candidates for lensed Pop III stars based solely on their position in the HR diagram, without any additional metallicity constraints (Section 5), likely requires that the Pop III IMF is sufficiently top-heavy to significantly populate the HR diagram beyond .
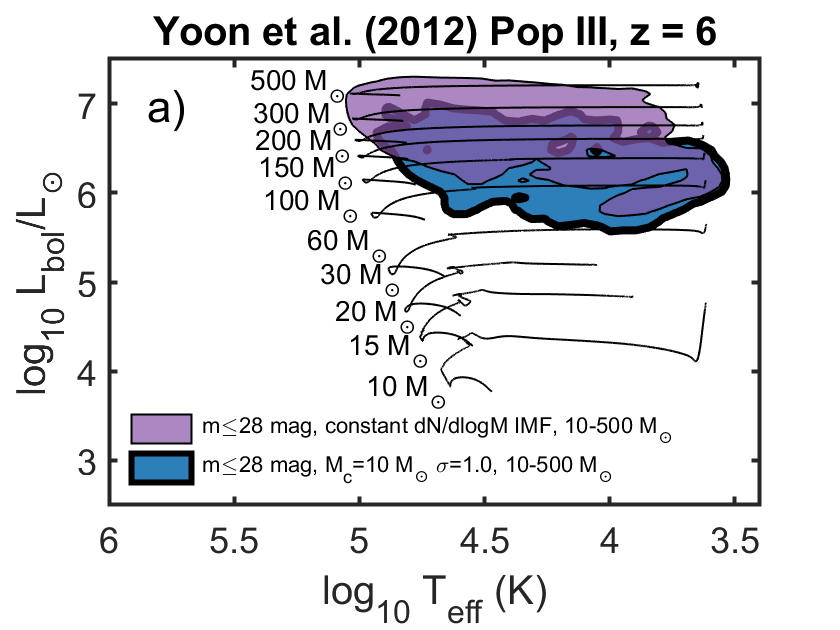
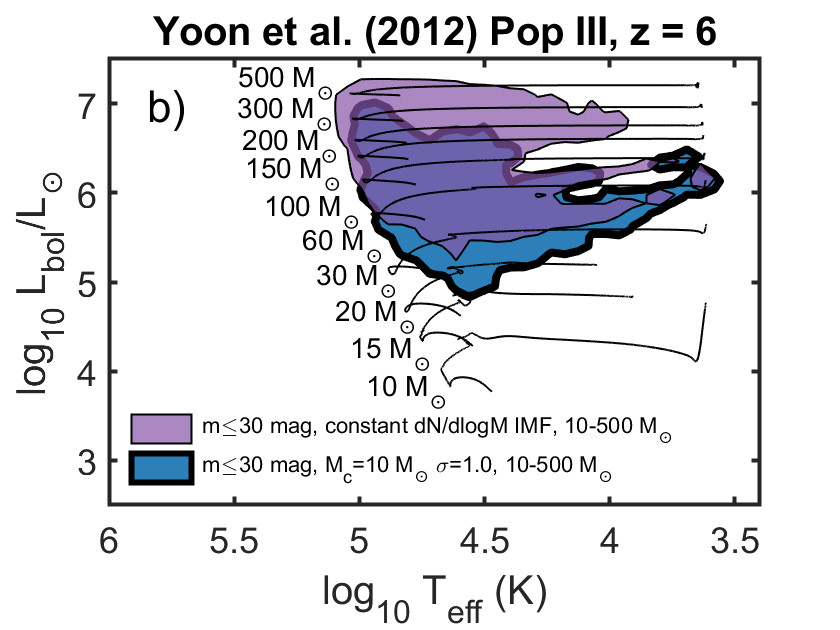
The predicted distribution of lensed Pop III stars across the HR diagram also depends on the shape and upper mass limit of the IMF, which we demonstrate in Fig. 5 in the case of Yoon et al. (2012) tracks. Here, we assume that Pop III stars can form up to a mass of 500 and show the results for two different top-heavy IMFs: a log-normal IMF (Tumlinson, 2006, , with characteristic mass and ) and a IMF (e.g. Schauer et al., 2022). The higher upper mass limit adopted compared to Fig 4 does not have any dramatic effects on the probability distribution of lensed stars across the HR diagram for the log-normal IMF, but allows the IMF to extend the probability density function to higher and , reaching and . If one assumes that the birth of such very massive stars is effectively limited to the Pop III mode of star formation, then the detection of lensed stars in this part of the HR diagram would constitute a strong indication that Pop III objects have been detected even without detailed metallicity measurements (Section 5). However, ensuring that a given lensed star belongs to this part of the diagram requires that is well constrained and that strong upper limits on the magnification can be set to infer a robust lower limit on the luminosity.
4 Predicted detection rates for highly magnified Pop III stars
While Section 3.1 focused on the relative probability distribution of stars in the HR diagram of lensed stars333which provides answers to questions of the form “if a lensed star is detected at a given redshift, what properties is it most likely to have?”, we here attempt to estimate the absolute probabilities of detecting Pop III stars at in a JWST survey covering a large number of cluster-lens fields.
When imaging cluster-lens fields, highly magnified stars could manifest themselves either as point sources within lensed arcs, or as point sources along the macrolensing critical curve of the cluster lens but without any obvious association to an arc. The latter case applies when the magnification of the star is sufficient to render it detectable, but the host galaxy (which would be subject to a much smaller magnification) remains below the detection threshold. This case has so far not been detected, but it could become increasingly important at the very highest redshifts, where a significant fraction of the cosmic star formation activity will then take place in galaxies that require high () macromagnifications to be rendered observable even in the deepest JWST images. The latter case could also be relevant for Pop III stars forming early on in minihalos, which are not expected to have any association with large galaxies. In both cases, variability due to microlensing by stars in the intracluster medium of the lensing cluster can be expected, although the amplitude of the variations may be small (as has been hypothesized for the lensed star Earendel; Welch et al., 2022a).
In what follows, we will focus on the the momentary brightness of lensed Pop III stars at high redshifts, and attempt to estimate the probability that a lensed Pop III star appears in a single-epoch imaging campaign covering several cluster-lens fields. The timescale over which stars detected this way will remain observable once discovered – which depends on the timescale of the crossing of macrolensing caustics and the impact of microlensing – is outside the scope of the current paper.
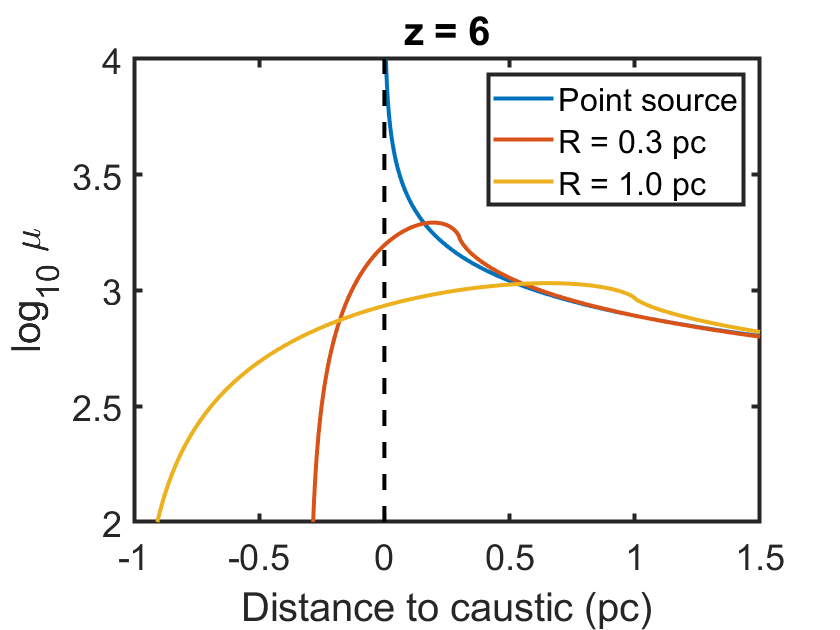
Following, Windhorst et al. (2018), we adopt the relation for fold caustics for the macrolensing magnification as a function of source-plane distance from the caustic in arcseconds:
| (2) |
where is a scaling factor that varies from cluster to cluster, in the –20 arcsec1/2 range for some of the most well-known cluster lenses (Windhorst et al., 2018). Strictly speaking, also varies with source redshift, but the dependence is expected to be very weak in the regime studied in this paper, and we therefore treat it as a constant throughout this paper.
Given an imaging survey with a set of JWST/NIRCam filters with detection limits , one can – for a star with initial (ZAMS) mass , age and intrinsic apparent magnitude – derive the minimum macrolensing magnification required to bring the star with mass and age above the detection limit in at least one filter as:
| (3) |
Neglecting microlensing, the maximum distance from the caustic at which such a star may be detected in this survey is then:
| (4) |
Given this relation and an assumed source-plane length of the caustic in arcseconds, we may estimate the angular surface area (in arcsec2) over which a given star will attain a magnification equal to or higher than (at separations as
| (5) |
By adopting a certain redshift survey depth , this angular surface area can be converted into a redshift-dependent comoving volume inside which objects will attain :
| (6) |
where is the comoving volume at redshift that corresponds to depth per arcsec2. We stress that this treatment only takes macrolensing into account, and neglects the way microlensing is likely to alter the magnification distribution (e.g. Diego, 2019; Palencia et al., 2023)
The number of expected detections of lensed Pop III stars in that slice can then be derived by estimating the number of luminous Pop III stars within the corresponding volume. Since the magnification required for detection changes dramatically as a function of age of Pop III stars, we sum over time steps that represent different evolutionary states of the star, each with a duration , and over all redshift slices for a single cluster:
| (7) |
Here, is the comoving cosmic star formation rate density (in units of yr-1 cMpc-3) of Pop III stars at redshift , is the IMF-dependent mass fraction locked up in Pop III stars with initial mass .
Throughout this paper, we adopt and arcsec as fiducial values for strong-lensing clusters. As long as , can also be directly interpreted as the approximate probability of detection () per cluster field surveyed.
Detecting Pop III stars in JWST surveys of cluster lens fields requires both a relatively high cosmic star formation rate density (SFRD) of Pop III stars at the relevant redshifts, and a top-heavy Pop III IMF. Here, we limit ourselves to , since this is the regime that simulations of Pop III stars typically focus on, and for which numerous Pop III SFRD predictions have been published.
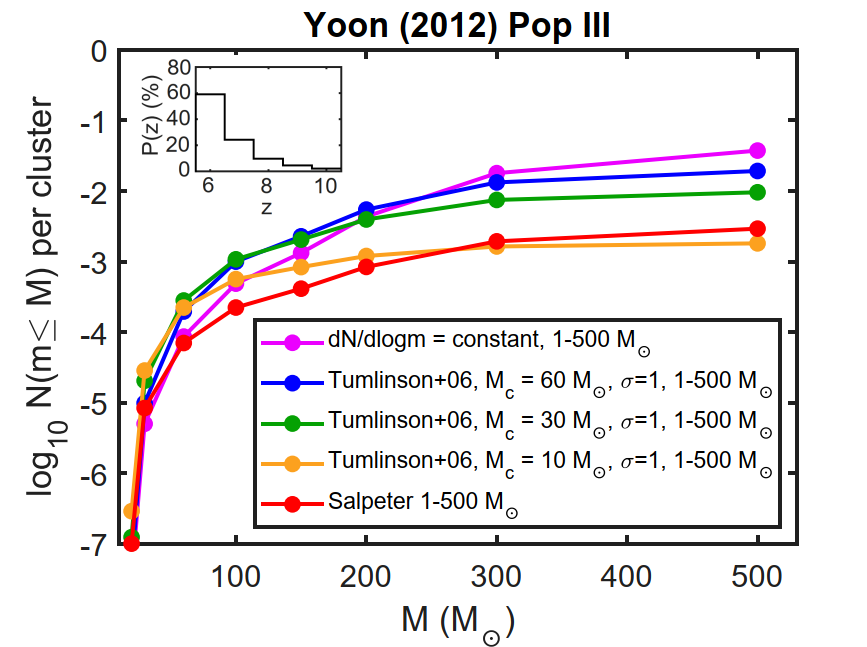
Based on the computational machinery outlined, we find that a SFRD of cMpc-1 yr-1 somewhere in the –10 range is required to make detections likely in the case of very top-heavy IMFs, and that even higher SFRDs are required for the less extreme IMFs. Adopting Liu & Bromm (2020) as our reference SFRD (which reaches a peak of cMpc-1 yr-1 at and drops by a factor of by ) for Pop III stars, we in Fig. 6 show the expected detection rate in a 28.5 AB mag JWST/NIRCam survey for five different IMFs covering the 1–500 mass range, under the assumption of the Yoon et al. (2012) stellar evolutionary tracks for non-rotating Pop III stars. These IMFs include a Salpeter slope IMF, three Tumlinson (2006) log-normal IMFs with and characteristic masses , and 60 , plus the Magg et al. (2016) constant IMF.
In the following, we adopt a microlensing size-magnification limit with and do not allow stars in evolutionary stages where from Equation 3 exceeds from Equation 1 to enter the summation of in Equation 7. However, we note that this only affects the detectability of Yoon et al. (2012) Pop III stars with masses , since the more massive stars can reach the 28.5 AB mag detection limit with much lower magnifications than constrained by this limit. In fact, a 500 star at can be rendered detectable at a magnification as low as in its brightest phase. In order not to underestimate the prospects of detecting any lensed Pop III stars, we here therefore adopt a more generous range of allowed – (unless ) than in Section 3.1 (where – was adopted) in our summation of in Equation 7, but note that the resulting estimate may then include cases where the light from several lensed Pop III stars in the same star cluster blend together.
If we take as the threshold above which the detection of lensed Pop III stars can be assumed to be realistic (giving a detection probability for a survey of clusters fields), Figure 6 suggests that it is only the most massive stars () that have any realistic chance of being detected, and then only for the most top-heavy IMFs considered (Tumlinson 2006 and 60 , plus the Magg et al. 2016 constant IMF), where the mass fraction in stars is .
The most top-heavy IMF considered here () produces a total probability of the detection of a Pop III star of . In this scenario, a survey covering cluster-lensing fields would result in a combined detection probability across the whole survey. This implies for a survey covering 10 cluster fields, for 30 cluster fields and for 50 clusters.
is lower by , 0.6 and 1.3 dex, respectively, for the Tumlinson (2006) , 30 and 10 , IMFs and dex lower for the Salpeter-slope 1–500 IMF (please note that theTumlinson 2006 IMF with and actually predicts slightly fewer stars compared to the Salpeter-slope IMF extending to 500 ). Even in the most pessimistic case ( and ), becomes for an survey.
Although the Liu & Bromm (2020) pop III SFRD peaks at , we in Figure 6 show that the predicted redshift distribution of lensed stars still peaks at (the lowest redshift considered here) and decreases rapidly towards z=10 (the highest redshift considered), primarily due to the progressive loss of the SED peak of the lowest- stars (which, we have argued, are often the easiest to detect) from the NIRCam wavelength window as the redshift is increased. For the Yoon et al. (2012) set of tracks, this redshift evolution in detection probability only show variations at the level of a few percent among the IMFs considered.
4.1 Impact of the Pop III star formation rate density evolution
The redshift evolution of the SFRD of Pop III stars in not well-constrained, and different simulations give rise to radically different SFRD() scenarios – some attain SFRDs in the –10 range lower than that of the Liu & Bromm (2020) model ( cMpc-1 yr-1) adopted in Fig. 6, and some attain higher values (see Klessen & Glover 2023 and Venditti et al. 2023 for recent compilations of simulation results).
To approximately estimate the Pop III IMF and SFRD() limits that would render lensed Pop III stars detectable, we for simplicity here treat the Pop III IMF and the Pop III SFRD() as independent. Naively, one would expect the Pop III IMF to have some impact on the SFRD evolution via feedback and chemical enrichment, but simulations differ significantly in their predictions on this connection. For example, Maio et al. (2010) and Sarmento et al. (2019) finds that a high characteristic mass of Pop III masses leads to lower Pop III SFRD, whereas Mebane et al. (2018) find the opposite trend, and Pallottini et al. (2014) find only very small variations in SFRD with different Pop III IMF prescriptions.
In general, keeping the Pop III IMF fixed but varying the SFRD results in a situation in which the estimates roughly scale with Pop III SFRD, so that a version of the Liu & Bromm (2020) SFRD scaled up or down by some factor would result in an updated probability times this factor. Adopting a constant SFRD() at cMpc-1 yr-1 throughout the –10 interval, similar to the Pop III SFRD of Venditti et al. (2023), leads to a redshift distribution similar to that of Fig. 6, but a a factor of higher than in the Liu & Bromm (2020) case, thereby making even the detection of stars obeying the and IMF possible () in a 50-cluster survey.
On the other hand, if the –10 Pop III SFRD is much lower ( cMpc-1 yr-1), i.e., similar to that derived from the Renaissance void simulations of Xu et al. (2016), then even the most-top heavy IMF we consider here () would give only for a 50-cluster survey.
4.2 Impact of late stages of stellar evolution
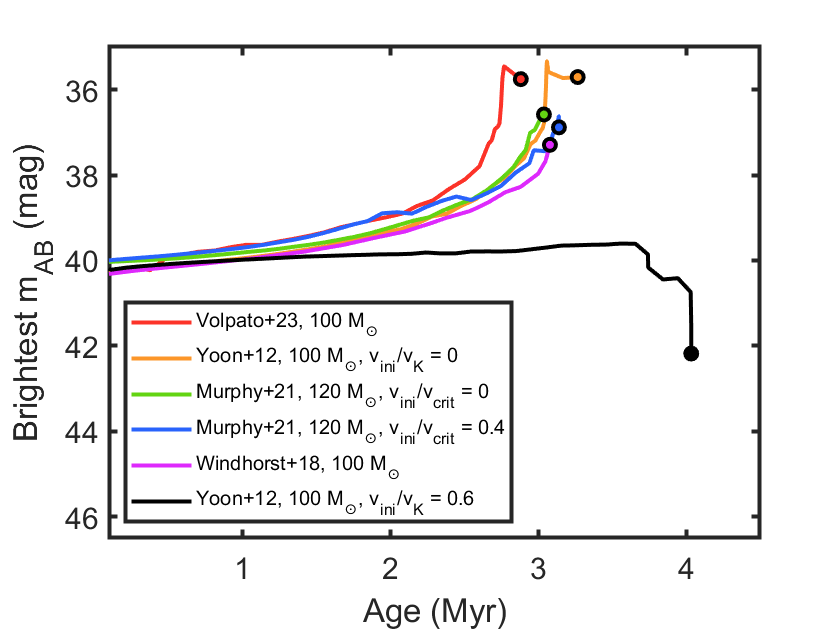
As we have argued in Section 3, the post-main sequence evolution of stars has a pronounced impact on the prospects of detecting lensed stars. Since not all Pop III stellar evolutionary tracks show the low- extension of the Yoon et al. (2012) set, we explore the impact of removing stars from the calculation. This has the effect of lowering the detection prospects of Fig. 6a by more than order of magnitude. Hence, the chances of detecting lensed III stars hinges crucially not just on the IMF, the SFRD but also on the evolutionary paths of these stars in the HR diagram. Because the Volpato et al. (2023) stars also evolve to K, we find that the detection prospects at 100-500 are very similar to those of the Yoon et al. (2012) tracks without rotation. For Pop III evolutionary tracks like those of Windhorst et al. (2018), which at 10–1000 , never evolve to K, and those of Murphy et al. (2021), where non-rotating stars in the 10–120 range never reach K, the detection prospects are considerably worse.
In Figure 7, we illustrate this by the exploring the brightest JWST/NIRCam broadband magnitudes attained at as a function of age for these four sets of tracks at 100–120 , and also show the effects of rotation on the Yoon et al. (2012) and Murphy et al. (2021) versions of these stars. The Windhorst et al. (2018) and the Murphy et al. (2021) Pop III stars attain their peak brightness at levels –1.5 magnitudes fainter than those of the Volpato et al. (2023) and non-rotating Yoon et al. (2012) stars and hence require magnifications –4 times higher to be detected (with corresponding lensing probabilities a factor of –16 lower). The effect of rotation on these results are small for the Murphy et al. (2021) stars at this mass. However, the Yoon et al. (2012) 100 models with behave entirely differently, as these have lifetimes extended by up to Myr and evolve towards higher when they age, eventually reaching K. This makes these model stars significantly fainter than the others in the NIRCam filters at after the first million years of evolution.
4.3 Impact of the survey detection threshold
The use of deeper JWST exposures than assumed in Fig. 6 (28.5 AB mag) increases the probability for detecting lensed Pop III stars per cluster field, thereby allowing for deeper surveys covering a smaller number of clusters to also reach substantial probabilities for detections of Pop III stars. For example, pushing the survey depth to 30.0 AB mag allows the two top-heaviest IMFs to reach per cluster field for Pop III stars. In this case, the calculation does however become significantly affected by the requirement that , since Pop III stars at may in fact reach the detection limit at even lower magnification. It should be noted, however, that lensed Pop III stars that appear at brightness levels as faint as –30 AB mag would be extremely difficult to characterize in detail using the photometric SED, and perhaps impossible to study spectroscopically throughout the foreseeable future (Section 5).
5 The observational signatures of lensed Population III stars
5.1 Photospheric signatures
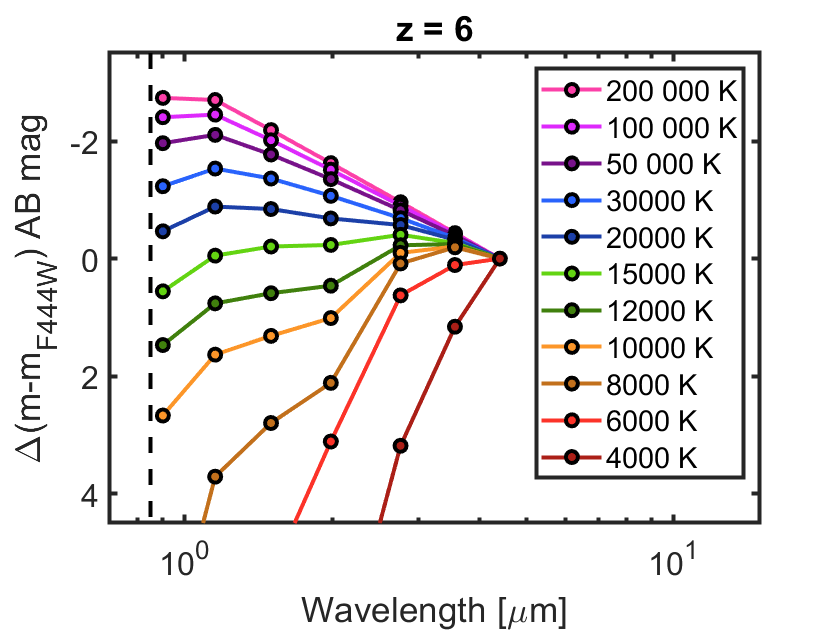
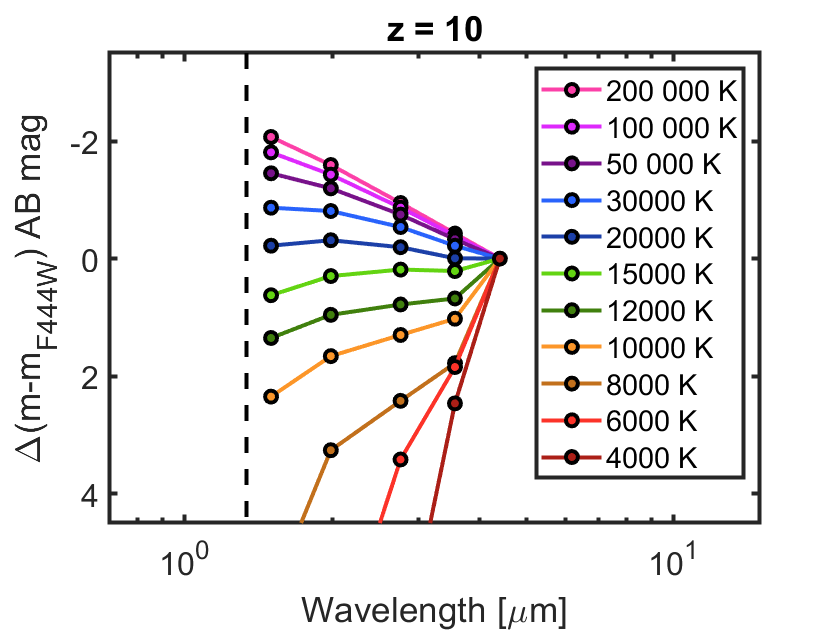
In the case where the light from a lensed, high-redshift star is dominated by its photosphere (as seems to be the case for all observations so far), its JWST broadband-filter SEDs is expected to contain relatively little information on the nature of the object. While the rest-frame shape of the Muspelheim SEDs do show some dependence on , and chemical composition 444Please note that in the present version of Muspelheim, the effects of rotation and mass-loss on the model spectra, beyond those imprinted in the , , evolution, are ignored., the effects of are the dominant ones. Once and redshift has been estimated from the observed shape of a lensed-star SED, the observed flux levels of the SED can be converted into a constraint on , which will allow the object to be placed into the HR diagram, although with substantial error bars coming from uncertainties on , and potentially also from (see below).
The level at which can be determined from the SED of a lensed star at high redshifts depends on its intrinsic position in the HR diagram. In Figure 8, we demonstrate how the JWST/NIRCam colours depend on in the case of lensed stars at and . In general, the prospects of setting meaningful constraints are optimized when is in the range –8000 K (B-type to F-type), since this is the range where the SED develops a prominent Balmer/4000Å break – a feature that cannot easily be mimicked by dust attenuation along the line of sight. At higher temperatures, the coarse spectrum traced by the JWST broadband fluxes appears smooth and blackbody-like. The overall slope of this spectrum becomes increasingly steep in the blueward direction as is increased, but this slope evolution saturates at K which makes it very challenging to determine higher temperature accurately. Any dust attenuation that remains uncorrected for will also act to make the SED seem to have a lower . In the absence of other dust constraints, the derived from a featureless blue slope of a lensed star therefore merely serves as a lower limit on the actual of the object. At K, the SED once again turns almost featureless, with a pronounced red peak towards the longest NIRCam wavelengths. In this case, it becomes unrealistic to determine the redshift from the Ly limit of the star itself, since the flux directly blueward of this edge will be much too low to be detected. Provided that the redshift can be obtained from the spectrum or photometric SED of a gravitational arc to which the star belongs, or from the location of the critical line in the cluster, the temperature may still be fairly accurately constrained at . At , this would require a situation where the star is magnified to a brightness several magnitudes above the detection level in the F444W filter, since this will otherwise be the only NIRCam filter (among those considered here) in which a K star will be detected.
The analysis of a K star is less sensitive to interstellar dust attenuation and reddening along the line of sight than for a high- star, since the peak brightness falls in the rest-frame optical and not the rest-frame ultraviolet. However, circumstellar dust produced by the stars themselves may still complicate the analysis.
While metallicity does have a slight impact on the shape of photometric SEDs of lensed, high-redshift in the rest-frame UV where metal absorption bands can cause a slight reduction of flux longward of the Ly, these changes are typically small and difficult to distinguish from effects of dust attenuation (further discussed in Section 6). The alternative is to attempt to constrain the metallicity of lensed stars through spectroscopy.
Stars with around 15000 K are particularly interesting in this context, both because candidate Pop III stars may potentially be detected at these temperatures (Figure 5; Section 4), because such star remain relatively bright in the part of the rest-frame UV shortward of the Balmer break and because metals imprint a number of absorption features at rest-frame wavelengths –2000 Å that can be probed both by JWST/NIRSpec (in principle up to ) and by future near-IR spectrographs on ground-based ELTs (up to , but potentially with higher sensitivity than JWST).
However, absorption line studies of lensed, high-redshift stars are very challenging in the JWST era, due to relatively low continuum signal-to-noise ratios that one can achieve even for exceptionally bright lensed stars.
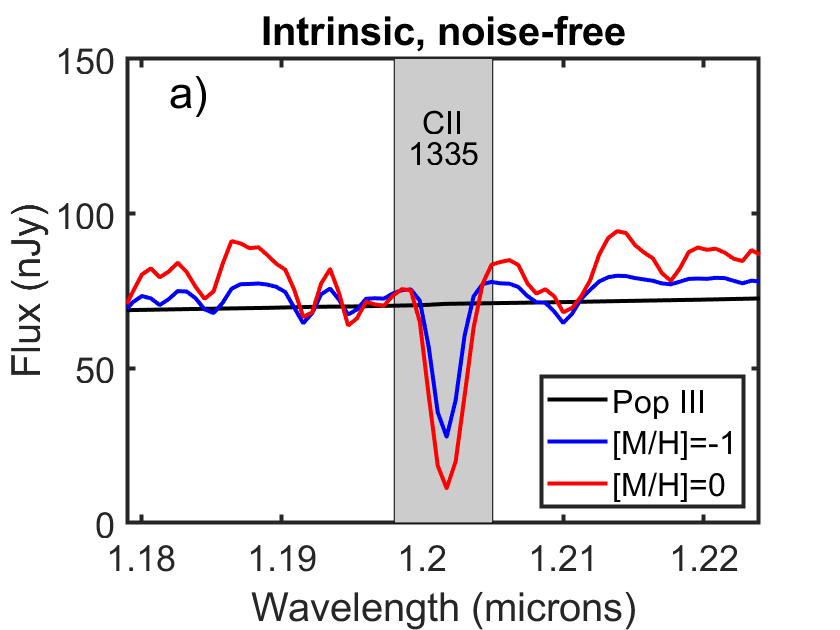
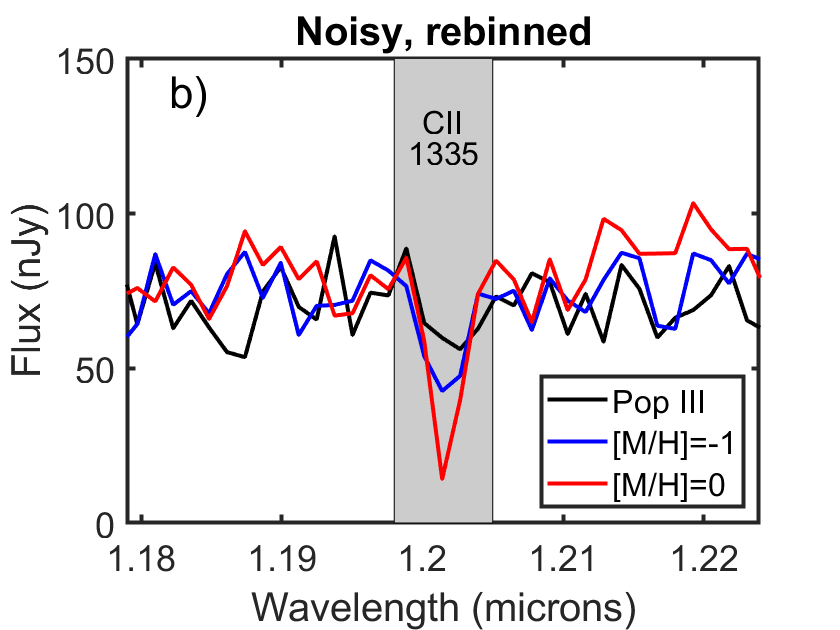
Some of the most interesting UV absorption features, in the sense of being relatively strong and hence potentially detectable even at lower continuum signal-to-noise ratios () than usually required for absorption-line studies (), include the SiII 1260 Å line, the CII 1335 Å line, the SiIV 1393, 1403 Å lines and the FeIII 1893 Å for a supergiant at K (Leitherer et al., 2010). In Figure 9, we show mock JWST/NIRSpec, spectra corresponding to 50 h observations centered on the CII 1335 Å feature in the case of a , K star lensed to 26.5 mag in the JWST/NIRCam F150W filter (this gives a peak brightness in the NIRCam bands of AB mag, which is exceptionally bright; mag brighter than the lensed star Earendel, Welch et al. 2022b). Even for these optimistic conditions (super-deep observations of an unusually bright star), metal lines can only be measured at low confidence. Hence, demonstrating the absence of such lines, which would indicate a primordial chemical composition, will be very difficult. Based on the mock observations presented in Figure 9, it would seem possible to constrain the metallicity to based on the non-detection of the CII 1335 feature feature, but the distinction of a Pop III star from a metal-poor star (e.g. ) would remain difficult in the JWST era. These mock observations are based on TLUSTY spectra which neglect the effect of winds on the UV lines. However, a similar calculation for the CII 1335 features using the PoWR models with various levels of mass-loss (Hainich et al., 2019) shows that while winds may alter the profile of the line and present a more complicated metallicity dependence with line strength, this does not make the line more easily detectable in any radical way. To improve the constraints, data on several metal absorption features would need to be combined. Alternatively, more sensitive spectroscopic data obtained with a future ground-based ELT in the near-IR may also improve the situation.
5.2 Nebular signatures
Pop III stars with K produce enough ionizing photons to produce an emission nebula in the surrounding gas, which in principle may be intrinsically brighter than the star itself at the rest wavelengths probed by JWST at high redshifts (e.g. Rydberg et al., 2013). This nebula is formed as the surrounding gas absorbs the Lyman continuum radiation at rest wavelengths Å and transforms it into nebular continuum and emission lines at Å, with a brightness that strongly depends on – for a K Pop III star, the Lyman continuum makes up of the bolometric luminosity of the star, but this fraction rises to at K.
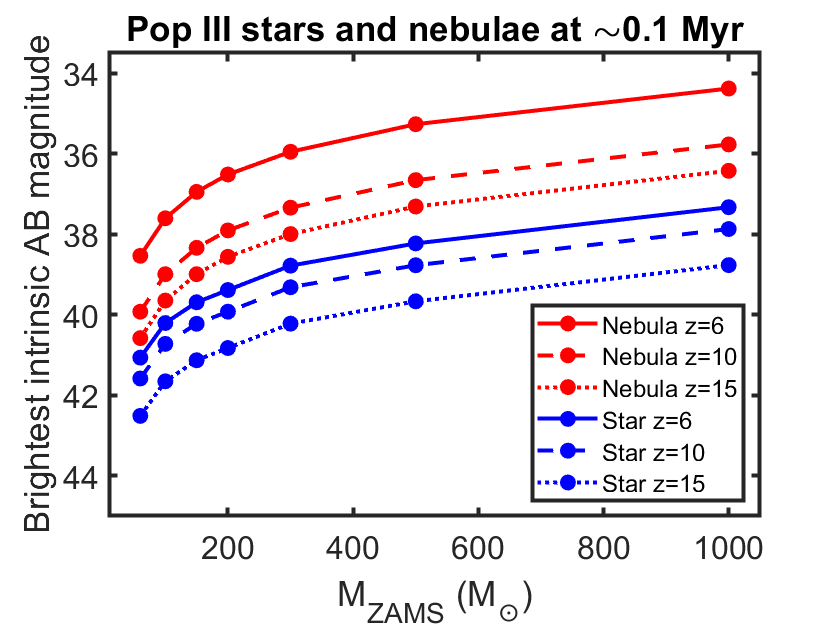
Under the assumption that an ionization-bounded nebula is formed close to the star, we in Fig. 10 plot the brightest AB magnitude attained in the JWST/NIRCam wide-band filters for 60–1000 , non-rotating Pop III stars from the Yoon et al. (2012) set at an age of yr, along with the brightest JWST/NIRCam AB magnitudes of their associated nebulae, at , 10 and 15. Here, we have adopted the Pop III nebular spectrum of a 120 Pop III ZAMS star derived by Rydberg et al. (2013) for the ZAMS parameters from Schaerer (2002), and scaled it to the LyC luminosities of Pop III stars from our sets. As seen in Fig. 10, Pop III nebulae may intrinsically be up to magnitudes brighter than the stars that power them in the NIRCam broadband filters considered here. Even so, any potential impact of this nebular emission on observations of lensed high- stars critically depends on the differential magnification across the star and its nebula, as well as the time scale over which the nebula can be expected to remain compact – issues that Rydberg et al. (2013) did not address in detail.
5.2.1 Differential magnification of Pop III stars and their HII-regions
Because HII-regions are much larger (pc-sized) than stars (, i.e., pc, for Pop III stars at K; Windhorst et al. 2018), they cannot attain as large macrolensing magnifications and can furthermore not be significantly magnified by stellar microlensing. Under the simplifying assumption of a constant-density HII-region in which ionization is balanced by recombination, the size of the nebula may be estimated from the Strömgren radius ():
| (8) |
where is the production rate of LyC photons per second, is the case B recombination rate and is the hydrogen number density.
If one adopts an ISM density close to the Pop III star of cm-3 (often considered a standard value for O star nebulae), and the initial values for non-rotating 60–1000 from Yoon et al. (2012), the radii of the Strömgren sphere around these stars become –4 pc.
Here, we approximate the maximum macrolensing magnification as function of source size as:
| (9) |
derived from eq. 2 at the distance from the caustic at which a circular source attains its maximum magnification (; Miralda-Escude, 1991).
This limits the maximum magnification for nebulae with radii –4 pc at –20 to 500–1500 in the case of , i.e., more than an order of magnitude less than what lensed stars may attain. For a JWST/NIRCam photometric detection limit of AB mag, the faintest Pop III nebula detectable on its own would (without the additional boost of the star) therefore need to reach an intrinsic brightness –36.9 AB mag.
From Fig. 10, we see that this limit is, at , only met by the nebula of the most massive Pop III stars (). At , the Pop III nebulae quickly become fainter because the brightest spectral feature, the H emission line, redshifts out of JWST/NIRCam range, and at , no lensed nebulae of Pop III stars would be detectable on their own in a survey reaching 29 AB mag.
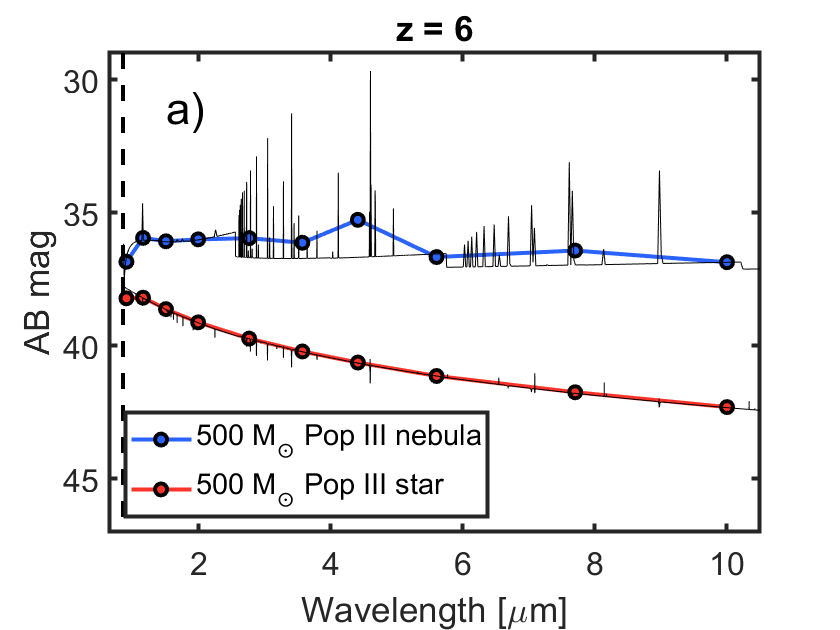
In Figure 11a, we show the intrinsic SEDs of a 0.1 Myr old, 500 Pop III star from Yoon et al. (2012), and its associated nebula, at . In this case, the nebula is intrinsically already mag brighter than the star at m, and progressively becomes more dominant at longer wavelengths due to the different slopes of the SEDs.
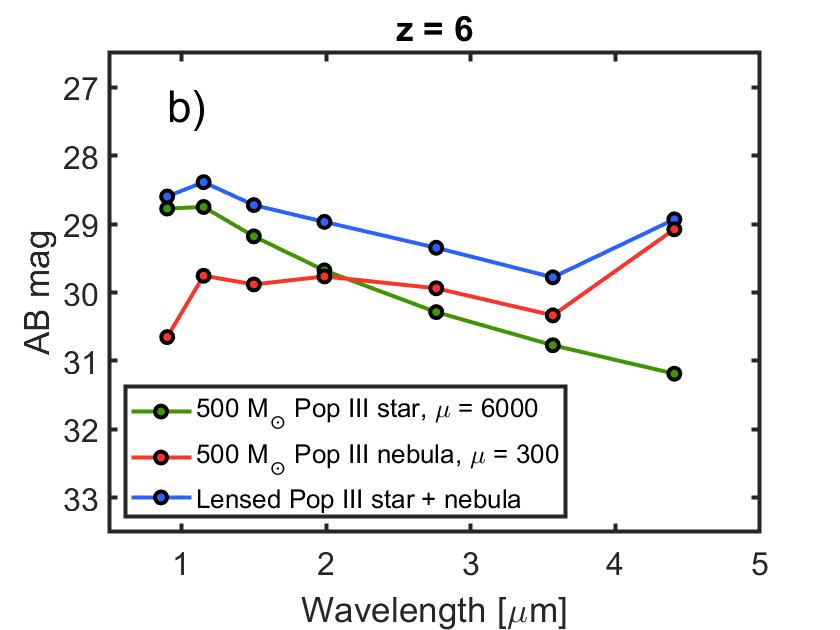
In Figure 11b, we show the differentially magnified SED of a , 0.1 Myr old, 500 star at and its nebula at . In this case, parts of the JWST/NIRCam SED of the compound object can be detected above a AB mag detection threshold at both m and at m, with the overall shape of the SED having significant contributions from both the star and its nebula (including a notable upturn in F444W due to the nebular H emission line). If such situations were common, this would have interesting consequences for the prospects of constraining the metallicity of a lensed star, since strong emission lines from hydrogen and helium could be imprinted on the spectrum, whereas metal lines may be absent.
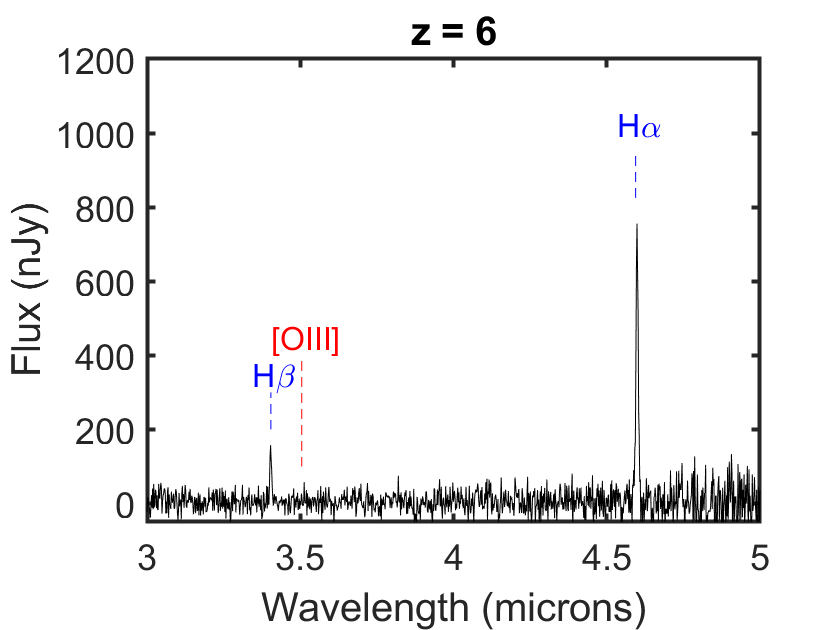
To illustrate this, we in Figure 12, show the simulated JWST/NIRSpec R=1000 spectrum that corresponds to the differentially magnified Pop III star + nebula featured in Fig.11b. Both the H and H emission lines are clearly visible, whereas the typically prominent [OIII]4959,5007 lines are absent. Upper limits on these oxygen lines should make it possible to set considerably stronger upper limits on the metallicity compared to the case for absorption line spectroscopy of the Pop III photosphere. We note that it would be considerably more challenging to detect the HeII 1640 emission line, which is often highlighted as a strong Pop III indicator, due to its relatively low intrinsic flux.
5.2.2 Temporal evolution of the HII-regions around Pop III stars
While the analysis presented in Section 5.2.1 suggests that nebular features in principle could be imprinted in the spectra of lensed Pop III stars, the probability of detecting such features critically depends on the timescales over which the HII-region around Pop III stars can remain sufficiently compact (pc-scale) to allow magnification factors of a several hundreds or more.
Even though the gas densities required to keep the Strömgren sphere contained at parsec scales ( cm-3) are likely to be retained in the vicinity of the star shortly after formation, the hot photoionized HII region that forms around the star will be overpressured compared to the neutral, cooler surroundings and expand. Models for the density evolution of the ionized gas in the HII region around both Pop III stars in minihalos (e.g. Whalen et al., 2004; Alvarez et al., 2006; Sibony et al., 2022) and high-mass, metal-enriched stars in more normal HII regions (e.g. Mellema et al., 2006; Geen et al., 2021) all suggest that the HII region may expand beyond pc already at yr, which makes the timescale for detection perilously short in the lensing scenario considered here.
In Appendix C, we present a simple toy calculation that suggests that if the HII-region around Pop III stars indeed only remains compact (pc-sized) for yr, then the probability for such HII-regions to be magnified to AB mag (as in Fig. 11b and 12) is per cluster-lens field, which is too low for such effects to realistically be detected with JWST. However, the situation could potentially improve if the expansion of the HII-region is hampered by the gravitational field of a more host massive halo (Kitayama et al., 2004), as could be the case if Pop III star formation largely shifts to – HI-cooling halos at , or by the gravitational field of the star itself (Jaura et al., 2022). Moreover, in the case of significant mass loss from a Pop III star (e.g. due to rotation), the wind/outflow may also imprint emission lines on the spectrum of a lensed star.
6 Discussion
6.1 Comparison with other studies
Rydberg et al. (2013) explored the prospects of detecting highly magnified high-redshift Pop III stars with very deep JWST imaging of a single cluster-lens field and came to the conclusion that detections would be highly unlikely, unless essentially all Pop III stars formed at very high masses (and only when considering a maximal flux boost due to nebular emission). However, Rydberg et al. (2013) did not consider Pop III stars beyond the main sequence and therefore did not include the substantial boost in detection rates provided by potential low- states of evolution. Also, the range of Pop III SFRDs explored at –10 was also significantly lower than that predicted by some recent simulations and models e.g., Jaacks et al. (2019); Liu & Bromm (2020); Venditti et al. (2023); Chantavat et al. (2023).
The prospects of detecting lensed Pop III stars was revisited by Windhorst et al. (2018), who did consider post-main sequence of Pop III stars, although not evolution to states as low as those explored in the current paper. Based on the assumption that the cosmic infrared background receives a non-negligible contribution from high-redshift Pop III stars, Windhorst et al. (2018) argue that there is significant chance of detecting highly magnified Pop III stars or, alternatively, the accretion disks around the black holes they leave behind, through caustic-crossing events with JWST if a handful of strong-lensing galaxy clusters are monitored over a few years. However, in scenarios where the contribution from these objects lie far below the current upper limits on the diffuse infrared background, the JWST detection prospects for lensed Pop III stars or their remnant black holes become progressively worse.
Recently, Larkin et al. (2023) presented an extensive study of the magnfications required to detect 1–1000 Pop III stars at –17 with JWST, albeit only for the ZAMS and without assessing the probability for such detections in realistic surveys of lensed fields.
6.2 The effect of dust attenuation
The results presented in this paper assume that lensed stars would not be significantly affected by dust attenuation. However, since the stars detected through gravitational lensing are all likely to be have high-masses and short lifetimes ( Myr) they are likely to be sitting in young, star-forming regions, where the interstellar dust attenuation may be high, especially at very young ages. Moreover, red supergiants may be surrounded by circumstellar dust, as seen in local samples (Massey et al., 2005; Drout et al., 2012). This attenuation of the intrinsic flux of lensed stars has the effect of producing an additional, and likely metallicity-dependent bias affecting where in the HR diagram such stars are likely to be found. To first order, the dust attenuation can potentially be assessed from photometric and/or spectroscopic studies of gravitational arcs in which lensed stars have so far been identified, but it must be kept in mind that the specific star-forming region in which a lensed star is sitting may not be the same as that derived for its host galaxy. In general, the effects of dust attenuation on the observed SED of a lensed star candidate is to render it fainter and redder, thereby – at fixed estimate of the magnification – shifting it to what (in the absence of corrections for dust) would appear to be a lower and lower compared to its intrinsic position.
Since Pop III stars are unlikely to form in dusty surroundings, dust reddening and attenuation is generally expected to be a more severe problem for metal-enriched lensed stars. Even so, Pop III supernovae are expected to produce dust (e.g. Marassi et al., 2015), and dust generated by the most massive and short-lived members of a small cluster of Pop III stars could potentially affect the line of sight to more long-lived Pop III members in the same region.
6.3 Rotation of Pop III stars
A significant fraction of Pop III stars may experience rapid rotation (Hirano & Bromm, 2018), which is expected to give rise to a number of complicated phenomena such as non-spherical stars, mechanical mass loss and possibly the formation of decretion disks (e.g. Marigo et al., 2003; Ekström et al., 2008; Yoon et al., 2012; Murphy et al., 2021). Plane-parallel stellar atmospheres in hydrostatic and radiative equilibrium of the type used here are ill-equipped to model such phenomena, and while such stellar atmosphere models are often used to model the non-ionizing continuum of rotating high-mass stars, the problem becomes more complex when modelling ionizing fluxes, since the outflow of gas from the surface could potentially have a significant impact on the emergent ionizing spectrum (e.g. Schaerer, 2002).
6.4 Binary Pop III stars
Almost all massive stars are in binary systems (see De Marco & Izzard, 2017, for a review), and simulations suggest that Pop III stars may be as well (e.g. Stacy & Bromm, 2013; Sugimura et al., 2020). Aside from having a significant impact on the rotation and evolution of Pop III stars, and hence the overall probability of detecting highly magnified Pop III stars, this also opens up the possibility that what is observed in the case of a Pop III binary located close to a caustic, is the blended contributions from two separate Pop III stars with different properties and potentially slightly different magnifications. This becomes another complication in the analysis of the SEDs of lensed-star candidates, although the two components could potentially be disentangled in the case where of the two components are substantially different (as has been suggested to be the case for the object Earendel; Welch et al., 2022b) or where the radial velocity between the two stars allows for the detection of two sets of absorption lines.
6.5 Surface enrichment of Pop III stars
Even though Pop III stars form at primordial chemical composition, heavy elements are produced from fusion within these stars. Dredge-ups during late stages of Pop III stellar evolution (e.g. Ekström et al., 2008; Volpato et al., 2023), or mixing with fast-rotating Pop III stars (Yoon et al., 2012; Liu et al., 2021) would allow nucleosynthetic products to reach the surface. Since late, low- stages of evolution are favourable for detection, this leads to an addtional problem when attempting to verify the Pop III nature stars based on spectroscopy. Absorption lines from the stellar surface, or a combination of absorption and emission lines from a wind/outflow may in such cases reveal non-zero CNO levels, which would complicate the identification of the lensed star as Pop III object.
6.6 Unsolved problems in the evolution of high-mass stars
We have throughout this paper stressed that existing evolutionary models greatly in their predictions for how Pop III stars move across the HR diagram, and that this has pronounced effects on the detectability of such stars. It must be pointed out, however, that current models for metal-enriched, high-mass stars also suffer from a number of problems, including the lack of observed O-stars close to the predicted ZAMS (e.g. Holgado et al., 2020) and the observed excess of blue supergiants compared to models (e.g. Bellinger et al., 2023). Whatever the resolution to these issues, this is likely to affect the time high-mass stars spend at different and hence forecasts of where in the HR diagram lensed stars are the most likely to be found (Figures 2 and 3). Until such issues have been resolved, caution must be exercised when attempting to interpret observed distributions of lensed stars across the HR diagram in terms of quantities like the star formation history, metallicity or the IMF of the lensed stellar population.
7 Conclusions
Our results can be summarized as follows:
-
•
Surveys for highly magnified, high-redshift stars with JWST are subject to strong selection biases related to the JWST wavelength range and detection limits, the lensing probability distribution and size-magnification limits (Section 3). For stars that require the highest magnifications to be rendered detectable, these biases tend to favour the detection of objects in late, lower- stages of evolution even though stars only spend a small fraction of their lifetime in such states. For example, based on the single-star stellar evolutionary tracks used in this paper, stars with initial masses found by JWST at AB magnitudes are only likely to be detected as red supergiants (Figure 3).
-
•
We argue that highly magnified Pop III stars at may be detectable in small numbers with JWST surveys covering a large number (–50) of cluster-lens fields. However, to make such detections likely, Pop III stars need to obey a number of conditions: The Pop III SFRD at –10 needs to be sufficiently high ( M⊙ cMpc-3 yr-1), the Pop III IMF needs to be very top-heavy and allow a significant mass fraction of the gas converted into Pop III stars to be in objects (mass fraction for SFRD M⊙ cMpc-3 yr-1), and the evolution of Pop III stars must be such that the stars evolve to temperatures K during their lifetimes (Section 4; Figure 6). Several simulations predict Pop III SFRDs up to an order of magnitude higher than our limit (see e.g. Venditti et al., 2023), and the recent stellar evolutionary models by Volpato et al. (2023) do predict evolution into low- states for Pop III stars. Whether the required Pop III IMF is likely to be sufficiently top-heavy to meet our constraints is potentially more controversial, since studies of the abundance patterns of very metal-poor stars in the local Universe do not seem to favour the enrichment signatures that would result from the most top-heavy Pop III IMFs (e.g. Tumlinson, 2006; Koutsouridou et al., 2023).
- •
-
•
Verifying the Pop III nature of highly-magnified stars at high redshifts using metallicity constraints will be very challenging. In situations where the lensed image is dominated by the stellar photosphere, very deep JWST and/or ELT spectroscopy can be used to target strong metal absorption lines to set an upper limit on the metallicity of the candidate. However, the constraint is unlikely to be better than given the capabilities of JWST, which makes it difficult to separate a very low-metallicity star from a genuine Pop III star (Section 5.1; Figure 9). Moreover, Pop III stars may also be self-polluted by metals in the late evolutionary states where many of these stars are likely to be found, thereby complicating the analysis.
-
•
During early stages of evolution, where a Pop III star may be surrounded by a compact HII region, the differentially magnified nebula could make the object brighter and imprint strong hydrogen and helium emission lines in the spectrum (Figure 12). While this opens up the possibility to detect Pop III stars in their earliest states and probe the metallicity more easily than what is possible using absorption line spectroscopy, the probability of such detections is deemed very low, unless the expanding HII region around the star is confined to pc scales for longer than yr (Section 5.2).
-
•
The fact that individual Pop III stars may be rendered detectable by JWST through gravitational lensing in some models has important consequences even in the absence of metallicity constraints on any lensed stars that are found at . As JWST continues to observe an increasing number of cluster-lens fields, it should be possible to use the accumulated photometric detections (or even non-detections) of lensed stars at these redshifts to set combined upper limits on parameters that describe the SFRD, IMF and evolution of Pop III stars, thereby ruling out the most extreme scenarios.
Acknowledgements
EZ acknowledges project grant 2022-03804 from the Swedish Research Council (Vetenskapsrådet) and has also benefited from a sabbatical at the Swedish Collegium for Advanced Study. EZ and AV acknowledge funding from the Swedish National Space Board. AN acknowledge funding from the Olle Engkvist Foundation. GV acknowledges support from Padova University, through the research project PRD 2021. GC acknowledges support from the Agence Nationale de la Recherche grant POPSYCLE number ANR-19-CE31-0022. J.M.D. acknowledges the support of project PID2022-138896NB-C51 (MCIU/AEI/MINECO/FEDER, UE) Ministerio de Ciencia, Investigación y Universidades.
Data Availability
Publicly available grids of Muspelheim models are available from: https://www.astro.uu.se/~ez/muspelheim/muspelheim.html
References
- Alvarez et al. (2006) Alvarez M. A., Bromm V., Shapiro P. R., 2006, ApJ, 639, 621
- Bellinger et al. (2023) Bellinger E. P., de Mink S. E., van Rossem W. E., Justham S., 2023, arXiv e-prints, p. arXiv:2311.00038
- Chantavat et al. (2023) Chantavat T., Chongchitnan S., Silk J., 2023, MNRAS, 522, 3256
- Chen et al. (2019) Chen W., et al., 2019, ApJ, 881, 8
- De Marco & Izzard (2017) De Marco O., Izzard R. G., 2017, Publ. Astron. Soc. Australia, 34, e001
- Diego (2019) Diego J. M., 2019, A&A, 625, A84
- Diego et al. (2018) Diego J. M., et al., 2018, ApJ, 857, 25
- Diego et al. (2022) Diego J. M., Pascale M., Kavanagh B. J., Kelly P., Dai L., Frye B., Broadhurst T., 2022, A&A, 665, A134
- Diego et al. (2023a) Diego J. M., et al., 2023a, arXiv e-prints, p. arXiv:2304.09222
- Diego et al. (2023b) Diego J. M., et al., 2023b, A&A, 672, A3
- Diego et al. (2023c) Diego J. M., et al., 2023c, A&A, 672, A3
- Diego et al. (2023d) Diego J. M., et al., 2023d, A&A, 679, A31
- Drout et al. (2012) Drout M. R., Massey P., Meynet G., 2012, ApJ, 750, 97
- Ekström et al. (2008) Ekström S., Meynet G., Chiappini C., Hirschi R., Maeder A., 2008, A&A, 489, 685
- Eldridge & Vink (2006) Eldridge J. J., Vink J. S., 2006, A&A, 452, 295
- Furtak et al. (2023) Furtak L. J., et al., 2023, MNRAS,
- Geen et al. (2021) Geen S., Bieri R., Rosdahl J., de Koter A., 2021, MNRAS, 501, 1352
- Haemmerlé et al. (2018) Haemmerlé L., Woods T. E., Klessen R. S., Heger A., Whalen D. J., 2018, MNRAS, 474, 2757
- Hainich et al. (2019) Hainich R., Ramachandran V., Shenar T., Sander A. A. C., Todt H., Gruner D., Oskinova L. M., Hamann W. R., 2019, A&A, 621, A85
- Hirano & Bromm (2018) Hirano S., Bromm V., 2018, MNRAS, 476, 3964
- Holgado et al. (2020) Holgado G., et al., 2020, A&A, 638, A157
- Hosokawa et al. (2016) Hosokawa T., Hirano S., Kuiper R., Yorke H. W., Omukai K., Yoshida N., 2016, ApJ, 824, 119
- Hubeny & Lanz (1995) Hubeny I., Lanz T., 1995, ApJ, 439, 875
- Inoue (2011) Inoue A. K., 2011, MNRAS, 415, 2920
- Jaacks et al. (2019) Jaacks J., Finkelstein S. L., Bromm V., 2019, MNRAS, 488, 2202
- Jaura et al. (2022) Jaura O., Glover S. C. O., Wollenberg K. M. J., Klessen R. S., Geen S., Haemmerlé L., 2022, MNRAS, 512, 116
- Kaurov et al. (2019) Kaurov A. A., Dai L., Venumadhav T., Miralda-Escudé J., Frye B., 2019, ApJ, 880, 58
- Kelly et al. (2018) Kelly P. L., et al., 2018, Nature Astronomy, 2, 334
- Kelly et al. (2022) Kelly P. L., et al., 2022, arXiv e-prints, p. arXiv:2211.02670
- Kitayama et al. (2004) Kitayama T., Yoshida N., Susa H., Umemura M., 2004, ApJ, 613, 631
- Klessen & Glover (2023) Klessen R. S., Glover S. C. O., 2023, ARA&A, 61, 65
- Koutsouridou et al. (2023) Koutsouridou I., Salvadori S., Skúladóttir Á., Rossi M., Vanni I., Pagnini G., 2023, MNRAS, 525, 190
- Kroupa (2001) Kroupa P., 2001, MNRAS, 322, 231
- Lanz & Hubeny (2003) Lanz T., Hubeny I., 2003, ApJS, 146, 417
- Lanz & Hubeny (2007) Lanz T., Hubeny I., 2007, ApJS, 169, 83
- Larkin et al. (2023) Larkin M. M., Gerasimov R., Burgasser A. J., 2023, AJ, 165, 2
- Leitherer et al. (2010) Leitherer C., Ortiz Otálvaro P. A., Bresolin F., Kudritzki R.-P., Lo Faro B., Pauldrach A. W. A., Pettini M., Rix S. A., 2010, ApJS, 189, 309
- Lejeune et al. (1997) Lejeune T., Cuisinier F., Buser R., 1997, A&AS, 125, 229
- Liu & Bromm (2020) Liu B., Bromm V., 2020, MNRAS, 497, 2839
- Liu et al. (2021) Liu B., Sibony Y., Meynet G., Bromm V., 2021, MNRAS, 506, 5247
- Magg et al. (2016) Magg M., Hartwig T., Glover S. C. O., Klessen R. S., Whalen D. J., 2016, MNRAS, 462, 3591
- Magg et al. (2018) Magg M., Hartwig T., Agarwal B., Frebel A., Glover S. C. O., Griffen B. F., Klessen R. S., 2018, MNRAS, 473, 5308
- Maio et al. (2010) Maio U., Ciardi B., Dolag K., Tornatore L., Khochfar S., 2010, MNRAS, 407, 1003
- Marassi et al. (2015) Marassi S., Schneider R., Limongi M., Chieffi A., Bocchio M., Bianchi S., 2015, MNRAS, 454, 4250
- Marigo et al. (2003) Marigo P., Chiosi C., Kudritzki R. P., 2003, A&A, 399, 617
- Mas-Ribas et al. (2016) Mas-Ribas L., Dijkstra M., Forero-Romero J. E., 2016, ApJ, 833, 65
- Massey et al. (2005) Massey P., Plez B., Levesque E. M., Olsen K. A. G., Clayton G. C., Josselin E., 2005, ApJ, 634, 1286
- Mebane et al. (2018) Mebane R. H., Mirocha J., Furlanetto S. R., 2018, MNRAS, 479, 4544
- Meena et al. (2023) Meena A. K., et al., 2023, ApJ, 944, L6
- Mellema et al. (2006) Mellema G., Arthur S. J., Henney W. J., Iliev I. T., Shapiro P. R., 2006, ApJ, 647, 397
- Miralda-Escude (1991) Miralda-Escude J., 1991, ApJ, 379, 94
- Murphy et al. (2021) Murphy L. J., et al., 2021, MNRAS, 501, 2745
- Nakajima & Maiolino (2022) Nakajima K., Maiolino R., 2022, MNRAS, 513, 5134
- Oh & Kroupa (2016) Oh S., Kroupa P., 2016, A&A, 590, A107
- Palencia et al. (2023) Palencia J. M., Diego J. M., Kavanagh B. J., Martinez J., 2023, arXiv e-prints, p. arXiv:2307.09505
- Pallottini et al. (2014) Pallottini A., Ferrara A., Gallerani S., Salvadori S., D’Odorico V., 2014, MNRAS, 440, 2498
- Rodney et al. (2018) Rodney S. A., et al., 2018, Nature Astronomy, 2, 324
- Rydberg et al. (2013) Rydberg C.-E., Zackrisson E., Lundqvist P., Scott P., 2013, MNRAS, 429, 3658
- Sarmento et al. (2019) Sarmento R., Scannapieco E., Côté B., 2019, ApJ, 871, 206
- Schaerer (2002) Schaerer D., 2002, A&A, 382, 28
- Schaerer (2003) Schaerer D., 2003, A&A, 397, 527
- Schauer et al. (2020) Schauer A. T. P., Drory N., Bromm V., 2020, ApJ, 904, 145
- Schauer et al. (2022) Schauer A. T. P., Bromm V., Drory N., Boylan-Kolchin M., 2022, ApJ, 934, L6
- Sharda & Krumholz (2022) Sharda P., Krumholz M. R., 2022, MNRAS, 509, 1959
- Sibony et al. (2022) Sibony Y., Liu B., Simmonds C., Meynet G., Bromm V., 2022, A&A, 666, A199
- Song et al. (2020) Song H., Meynet G., Li Z., Peng W., Zhang R., Zhan Q., 2020, ApJ, 892, 41
- Stacy & Bromm (2013) Stacy A., Bromm V., 2013, MNRAS, 433, 1094
- Sugimura et al. (2020) Sugimura K., Matsumoto T., Hosokawa T., Hirano S., Omukai K., 2020, ApJ, 892, L14
- Surace et al. (2018) Surace M., et al., 2018, ApJ, 869, L39
- Surace et al. (2019) Surace M., Zackrisson E., Whalen D. J., Hartwig T., Glover S. C. O., Woods T. E., Heger A., Glover S. C. O., 2019, MNRAS, 488, 3995
- Szécsi et al. (2022) Szécsi D., Agrawal P., Wünsch R., Langer N., 2022, A&A, 658, A125
- Trussler et al. (2023) Trussler J. A. A., et al., 2023, MNRAS, 525, 5328
- Tumlinson (2006) Tumlinson J., 2006, ApJ, 641, 1
- Tumlinson & Shull (2000) Tumlinson J., Shull J. M., 2000, ApJ, 528, L65
- Tumlinson et al. (2001) Tumlinson J., Giroux M. L., Shull J. M., 2001, ApJ, 550, L1
- Tumlinson et al. (2003) Tumlinson J., Shull J. M., Venkatesan A., 2003, ApJ, 584, 608
- Venditti et al. (2023) Venditti A., Graziani L., Schneider R., Pentericci L., Di Cesare C., Maio U., Omukai K., 2023, MNRAS, 522, 3809
- Venumadhav et al. (2017) Venumadhav T., Dai L., Miralda-Escudé J., 2017, ApJ, 850, 49
- Volpato et al. (2023) Volpato G., Marigo P., Costa G., Bressan A., Trabucchi M., Girardi L., 2023, ApJ, 944, 40
- Wang et al. (2022) Wang C., et al., 2022, Nature Astronomy, 6, 480
- Welch et al. (2022a) Welch B., et al., 2022a, Nature, 603, 815
- Welch et al. (2022b) Welch B., et al., 2022b, ApJ, 940, L1
- Whalen et al. (2004) Whalen D., Abel T., Norman M. L., 2004, ApJ, 610, 14
- Windhorst et al. (2018) Windhorst R. A., et al., 2018, ApJS, 234, 41
- Xu et al. (2016) Xu H., Ahn K., Norman M. L., Wise J. H., O’Shea B. W., 2016, ApJ, 832, L5
- Yan et al. (2023) Yan Z., Jerabkova T., Kroupa P., 2023, A&A, 670, A151
- Yoon et al. (2012) Yoon S. C., Dierks A., Langer N., 2012, A&A, 542, A113
- Zackrisson et al. (2011) Zackrisson E., Rydberg C.-E., Schaerer D., Östlin G., Tuli M., 2011, ApJ, 740, 13
- Zitrin et al. (2013) Zitrin A., et al., 2013, ApJ, 762, L30
- de Mink et al. (2009) de Mink S. E., Cantiello M., Langer N., Pols O. R., Brott I., Yoon S. C., 2009, A&A, 497, 243
Appendix A Stellar atmosphere grids
Here we provide further information on the technical procedure for generating SEDs of stars in the Muspelheim models. In Figure 13, we show selected stellar evolutionary tracks overlaid on the - coverage of the stellar atmosphere grids used at and . This illustrates a common problem, in that the most massive stars often venture into a region of parameter space at very low where stellar atmosphere models have failed to converge. In such cases, where data points fall outside the limits of the grid of stellar atmosphere spectra, an interpolation between the two closest grid models is performed in , instead of an attempted extrapolation. In the procedure of interpolating the stellar atmosphere grids, wavelength interpolations are also occasionally required due to differences in wavelength coverage for stellar atmosphere spectra in different parts of these grids. While this is expected not to have any significant impact on broad- and medium-band magnitudes, individual absorption or emission features could get distorted. For this reason, an alternative mode is also implemented, in which the stellar atmosphere spectra that lies the closest in and is instead selected, without any interpolation. While this ensures that the native spectral sampling is always used and that no spurious spectral features are introduced by the interpolation procedure, this implies that quantities like colours, that depend solely on the shape of the SEDs, evolve in a less smooth, step-wise fashion as as these stars evolve through the - grid. By comparing the results from the two strategies, we have checked that the results presented in this paper are not strongly affected by the wavelength interpolation procedure.
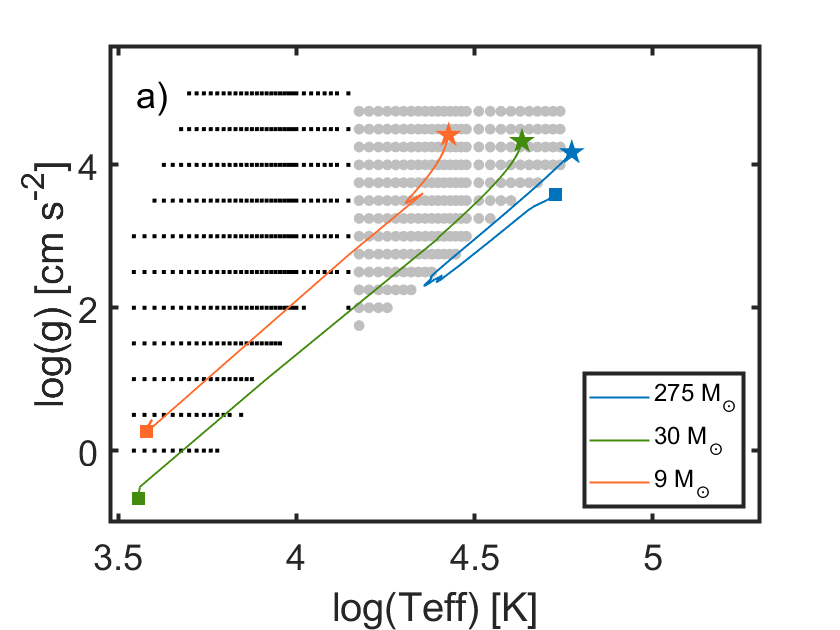
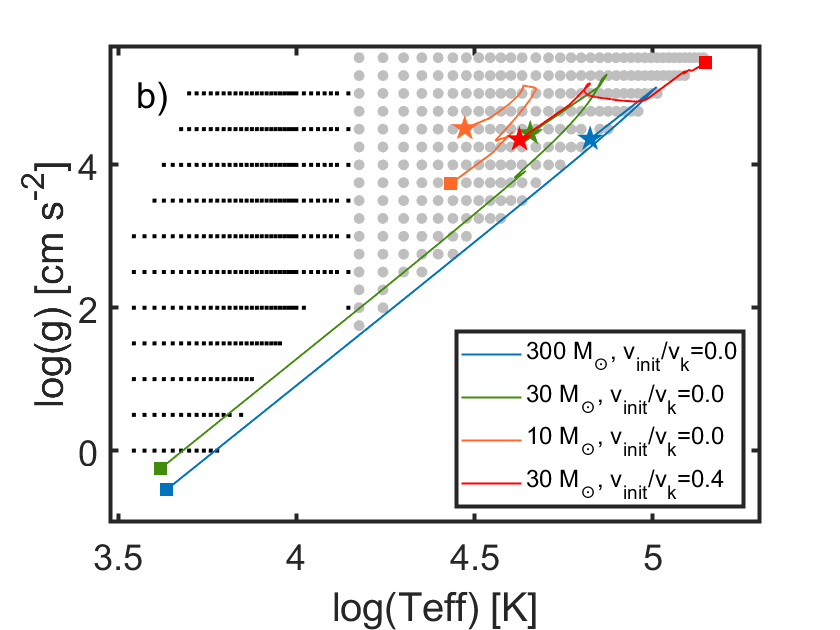
Appendix B Relation between brightness and effective temperature
Here we provide further explanations for why observations of lensed stars will favour the detection of stars in relatively short-lived low-, states over the more long-lived high- states associated with the stellar main sequence. In Figure 14ab, we show the rest-frame evolution in monochromatic luminosity and observed-frame evolution of (expressed in AB magnitudes) of the SED of an artificial star that is assumed to evolve from K to 4000 K at constant . While realistic stars admittedly do not evolve at fixed , this is not far from the truth of Pop III stars, which are often predicted to evolve almost horizontally in the HR diagram (Windhorst et al., 2018; Volpato et al., 2023). Figure 14a indicates a factor of difference in peak when goes from high to low. However, the full wavelength range is not directly observable (at any redshift) due to foreground gas absorption at Å (neutral ISM) or Å (neutral IGM at ) and the wavelength coverage of the most sensitive JWST instruments also limits the relevant range. Figure 14b shows that there is a magnitude difference at in peak brightness in the –5 m window available for JWST NIRCam or NIRSpec observations, between the highest and lowest stars plotted.
As a toy example of how these effects convert into detection probabilities, consider a scenario where this artificial star only has two significant stages during its evolution across the HR diagram – one long-lived K state and one short-lived K state. In Figure 14b, we see that the latter state would be at least mag brighter in the JWST window at . Since both of these stars would intrinsically lie far below the detection threshold of JWST, a substantial magnification boost is required to bring them into the detectable range. Assuming that the magnification probability distribution follows , the magnification required for the K state would be times lower than for the K state, which would make it times more likely to occur. Hence, even if the star only spends 1% of its lifetime in the short-lived K state, it would still be a factor of –3 times more likely to be found in this state rather than in the more long-lived K state.
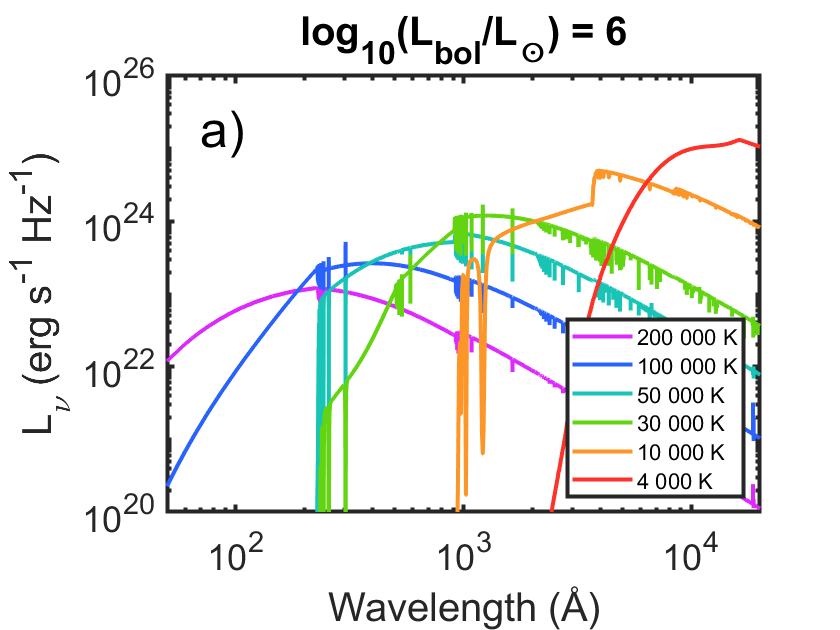
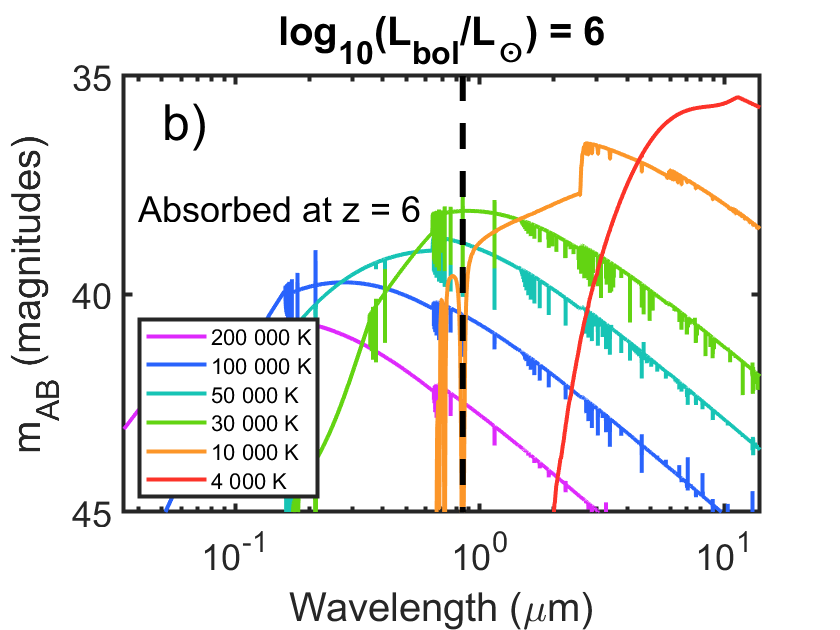
Appendix C Probability of detecting a lensed Pop III nebula
Here, we present a rough estimate of the probability to detect a Pop III nebula lensed above the detection limit of a 29 AB mag JWST/NIRCam detection limit, arguing that this probability is no more than per cluster field if the HII-region remains confined to parsec scales for time scales of yr.
In Figure 15, we use the inverse ray-shooting code of Meena et al. (2023) to plot the macrolensing magnification for different source sizes as a function of distance from the caustic in the MACS J0416.1-2403 galaxy cluster based on the mass model from Zitrin et al. (2013). The behaviour of circular sources with two different sizes relevant for Pop III nebulae ( pc and 1 pc), are compared to the point-source approximation (eq. 5, with at the chosen position along the critical line) which, within the range of magnifications plotted, illustrates the magnification curve of a stellar-sized source.
While the magnification continues to increase to as the stellar-sized source approaches the caustic, the two nebular-sized sources reach their maximum magnifications at a distance of (Miralda-Escude, 1991). Moreover, while the stellar-sized source becomes unobservable at the point of crossing the caustic, the larger sources can retain a relatively high magnification even when the midpoint has passed slightly beyond the caustic.
At a distance pc from the caustic, where the macrolensing magnification in the situation plotted is , a young Pop III star would – owing to its lower intrinsic flux (Figure 10) typically not be rendered detectable by JWST from macrolensing alone, whereas an ionization-bounded nebula around a Pop III star at would (Figure 10). In the absence of an additional microlensing boost to the flux of the star, this would correspond to a case where the observed SED would be nebular dominated. If the star, on the other hand, is highly microlensed at this position, both components could contribute significantly to the SED.
To provide a rough estimate of the probability to detect the lensed Pop III nebula of a single star, we here consider the very optimistic case where all Pop III stars form with a mass of . For the Yoon et al. (2012) non-rotating tracks, we find that a 500 star at age yr would produce an ionizing flux s-1 and a nebula that reaches a peak JWST/NIRCam flux corresponding to AB mag at . To reach a NIRCam detection limit of 29 AB mag, we therefore need a magnification of , which according to eq. 9) can be achieved for source sizes with radii up to pc at this redshift. To contain the Strömgren radius of the HII region within this radius would require a gas density cm-3 (eq. 8), which we assume can be retained for yr.
Using eq. 4 with implies that we can reach at arcsec. If we for simplicity assume that this magnification can approximately be retained from this location and all the way up to the caustic (see figure 15), and moreover adopt a length for the cluster caustic of , we get a source-plane area (eq. 5) arcsec2 over which the nebula may be rendered detectable in a single cluster-lens field. For at , this corresponds to (eq.6) a volume of cMpc-3. Adopting the Liu & Bromm (2020) Pop III SFRD of yr-1 cMpc-3 at and using eq.7 (with and yr), we find that only Pop III nebulae are expected to be detected per cluster field.
Hence, unless the HII-region can remain sufficiently compact to attain magnifications in the hundreds for significantly longer than years, it is unlikely to be detectable. This result is strictly valid only for the volume spanning at , but higher redshifts contribute relatively little to the estimate since H gets redshifted out of the NIRCam window at , thereby rendering the Pop III nebula intrinsically much fainter (see Figure 10).