Depicting Beyond Scores:
Advancing Image Quality Assessment through Multi-modal Language Models
Abstract
We introduce a Depicted image Quality Assessment method (DepictQA), overcoming the constraints of traditional score-based approaches.
DepictQA leverages Multi-modal Large Language Models (MLLMs), allowing for detailed, language-based, human-like evaluation of image quality.
Unlike conventional Image Quality Assessment (IQA) methods relying on scores, DepictQA interprets image content and distortions descriptively and comparatively, aligning closely with humans’ reasoning process.
To build the DepictQA model, we establish a hierarchical task framework, and collect a multi-modal IQA training dataset, named M-BAPPS.
To navigate the challenges in limited training data and processing multiple images, we propose to use multi-source training data and specialized image tags.
Our DepictQA demonstrates a better performance than score-based methods on the BAPPS benchmark.
Moreover, compared with general MLLMs, our DepictQA can generate more accurate reasoning descriptive languages.
Our research indicates that language-based IQA methods have the potential to be customized for individual preferences.
Datasets and codes will be released publicly.
††
∗ Contribute Equally. † Corresponding Author.
Project Page: https://depictqa.github.io.
![[Uncaptioned image]](/html/2312.08962/assets/x1.png)
1 Introduction
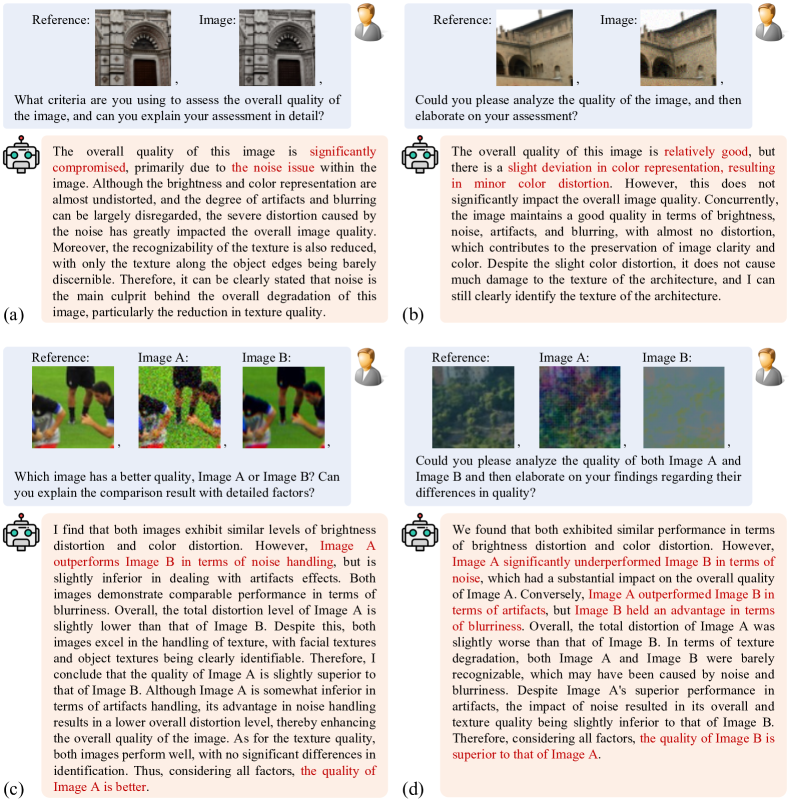
Image Quality Assessment (IQA) is an important and challenging topic of low-level vision research. IQA aims to measure and compare the quality of images, expecting the final results to be aligned with human judgments. Existing IQA methods [49, 55, 38, 15] mainly output the quality or similarity scores, which have apparent shortcomings. First, image quality is affected by different factors that cannot be effectively expressed by a simple score, e.g., noise, color distortion, and artifacts in Fig. 1a and 1b. Second, the reasoning process by human evaluators cannot be well modeled by current IQA methods. For example, in Fig. 1b, humans first identify the image distortions (i.e., noise in Image A, color distortion and artifacts in Image B), then weigh the impacts of these distortions on overall visual quality (color distortion and artifacts in Image B are worse than noise in Image A), and finally conclude that Image A is better than Image B. On the contrary, existing IQA methods simply compare the quality scores of these two images.
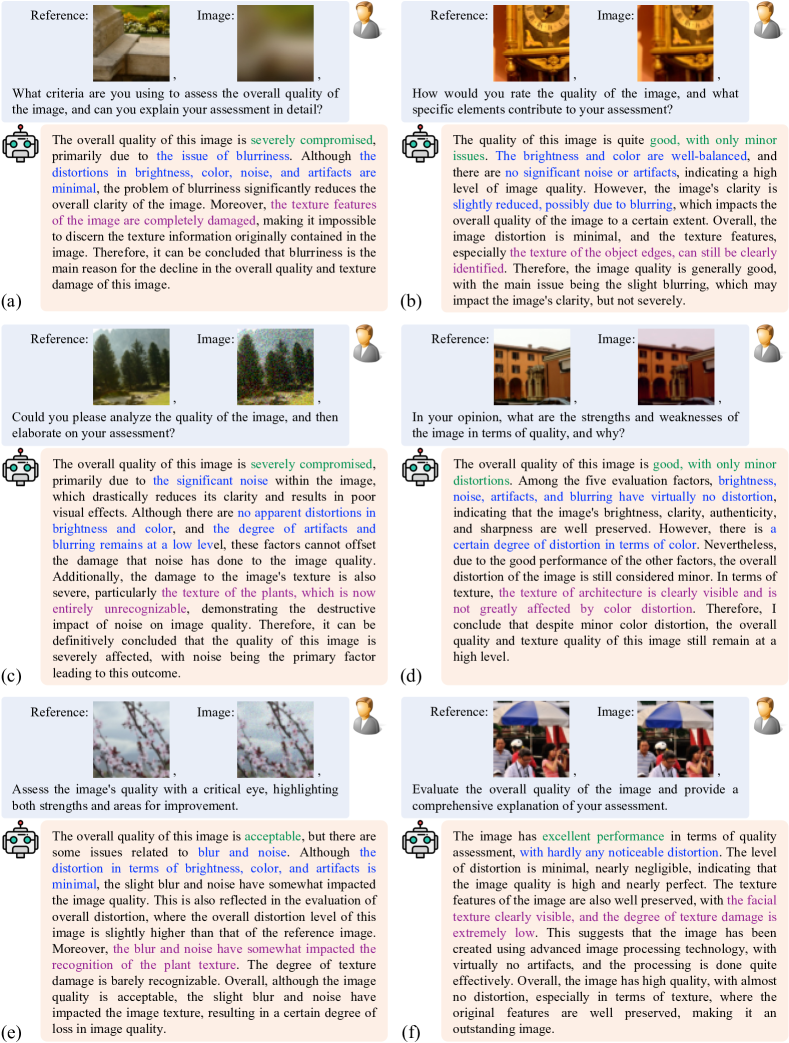
To better align with human evaluators, we explore a new paradigm for IQA, named Depicted image Quality Assessment (DepictQA). Inspired by recent Large Language Models (LLMs) [45, 32] and multi-modal technologies [24, 62], we believe that language is the key to solving the above problems. As shown in Fig. 1, DepictQA takes both images and a question as inputs, then outputs a paragraph that describes the quality of images from multiple aspects. Furthermore, empowered by the reasoning capability of LLMs, DepictQA can weigh the importance of each distortion and make the final judgment. For instance, in Fig. 1a, DepictQA finds that “the texture in Image A is completely damaged” while “Image B remains clear and distinguishable”, thus concludes “Image B is clearly superior to Image A”. Learning this kind of reasoning makes DepictQA better at aligning human judgments than existing methods in complex scenarios like misalignment (Fig. 1a) and multiple distortions (Fig. 1b). Meanwhile, these descriptive outputs can be naturally understood by humans, greatly improving the interpretability.
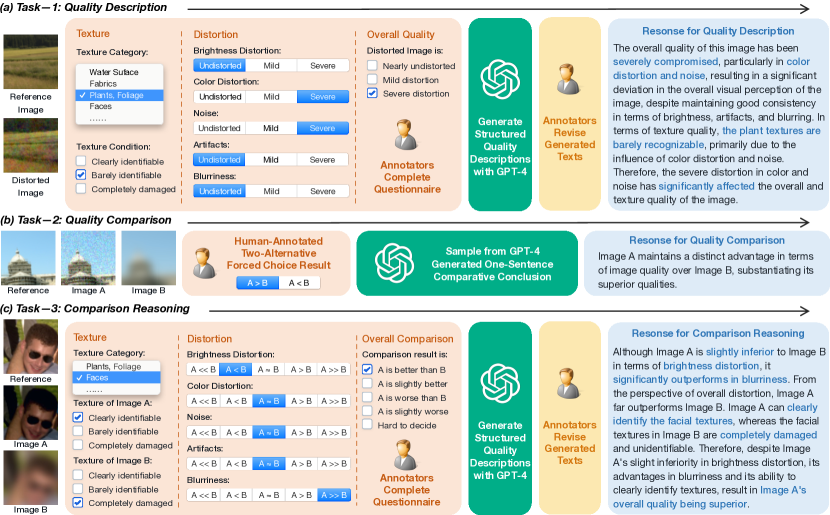
To integrate language into IQA, we establish a hierarchy of tasks for DepictQA, inspired by human evaluation. Humans first perceive the distortions of the image, then use this information to determine the image quality. Also, it is easier for humans to compare the difference between two images in a single dimension (e.g., color distortion) than quantitatively evaluate the overall quality of an image or the similarity between two images, as verified by [36, 37, 38]. Based on this intuition, DepictQA does not produce “scores”, but describes the image quality and compares two images. Specifically, we break DepictQA problem into a hierarchy of three tasks (detailed in Fig. 2): (1) Quality Description, (2) Quality Comparison, and (3) Comparison Reasoning. These designs can reflect humans’ evaluation process.
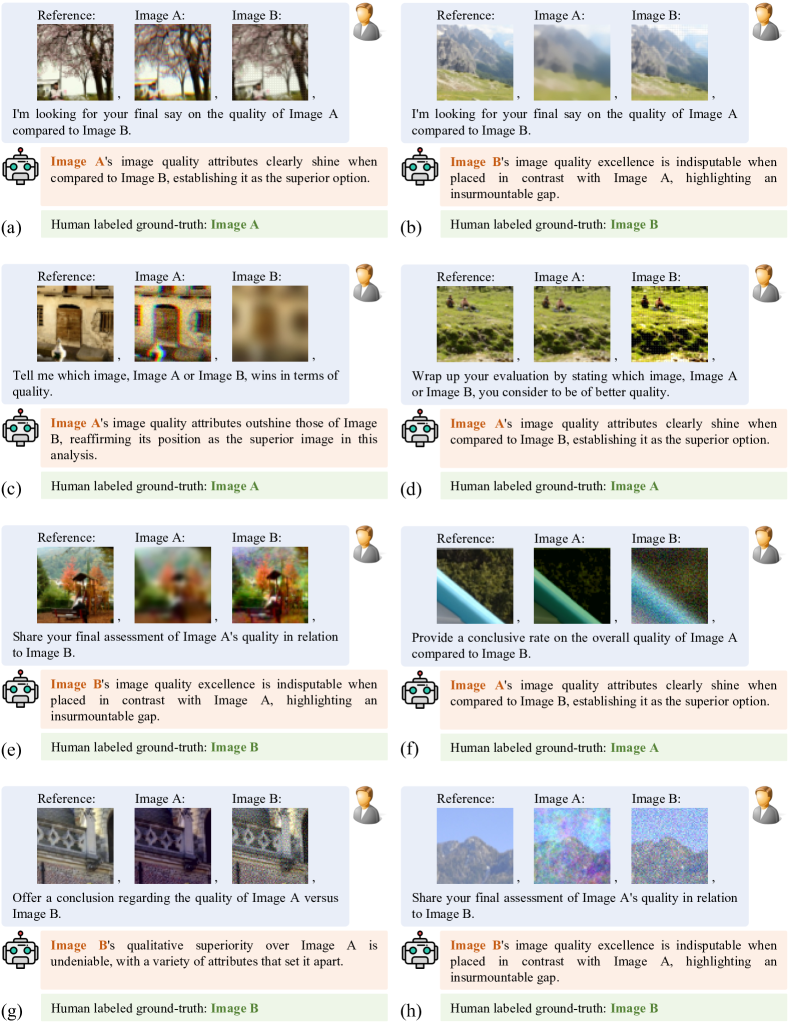
To train the proposed DepictQA, we further construct a multi-modal IQA dataset named M-BAPPS by collecting text descriptions based on the existing BAPPS IQA dataset [55]. Our M-BAPPS dataset contains 5,104 detailed high-quality text descriptions and 115,646 brief descriptions. For high-quality texts, we first collect the quality-related information through a carefully designed questionnaire (details shown in Fig. 2a and 2c), the results of which are further converted into a descriptive paragraph using GPT-4 [32]. To further increase the size of the training set, we also augment the dataset with brief descriptions. Specifically, we convert the existing quality comparison label in BAPPS into a brief description using pre-generated templated texts, such as “Image A maintains a distinct advantage in terms of image quality over Image B”.
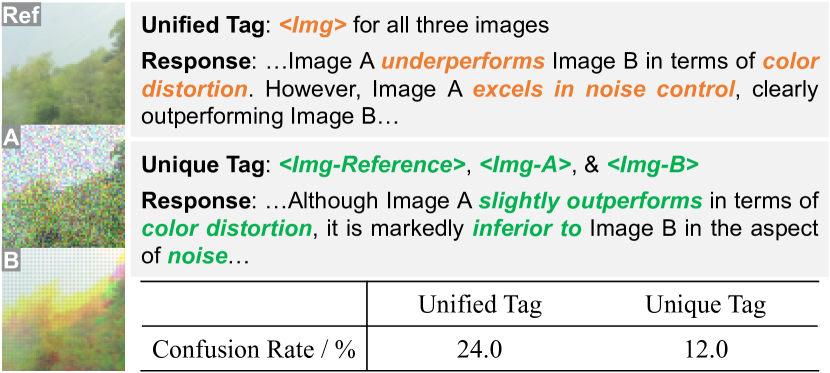
With the dataset mentioned above, we resort to Multi-modal Large Language Models (MLLMs) [24, 62, 18] to bridge the gap between images and descriptive texts. However, directly applying existing MLLMs to our DepictQA faces two challenges. First, there are only limited images with high-quality descriptions, preventing the model from robustly correlating images and text descriptions. In this aspect, we present a multi-source training approach to increase the size of training data. Specifically, two additional sources are used. One is images with only brief templated texts, as mentioned above. The other is external quality-unrelated content description data, the Detailed Description dataset in [53], which contains 48,734 image-text pairs. Although these two datasets are not directly designed for the descriptive reasoning ability, we find that the former one can help bridge images and texts in quality-related tasks, while the latter one can serve as regularization. Second, many MLLMs have difficulty in distinguishing multiple images, but our setup requires two or more images. We solve this problem by employing specialized tags for different images, instead of a unified tag for all images. Empirical results demonstrate that these approaches effectively mitigate the two challenges and bring a better DepictQA model.
At last, we conduct several experiments to prove the effectiveness of DepictQA. Firstly, DepictQA achieves the state-of-the-art performance on the BAPPS benchmark, well aligned with human judgments. Additionally, DepictQA can describe the distortions and texture damages in images and explain the reasoning process when comparing two images, thus generating more accurate descriptions compared with general-purpose MLLMs. Even compared with notably GPT-4V [33], DepictQA has significantly better comparison ability and comparable reasoning ability. Our investigation also shows that DepictQA has the potential to integrate individual preferences into the evaluation process. These results attest to the superiority of the proposed DepictQA, and the research potential of Multi-modal IQA tasks.
2 Related Works
Score-based IQA methods. Most existing IQA methods rely on scores to assess image quality. They can be categorized into full-reference and non-reference methods. (1) Full-reference methods assess image quality by computing the similarity score between a distorted image and a high-quality reference image. Traditional methods rely on human-designed metrics like structural similarity [49], image information [41], phase congruency with gradient magnitude [54], etc. Learning-based methods aim to align with human assessment through data-driven training. LPIPS [55] shows that the learned features can effectively function as a perceptual metric, exhibiting high consistency with human judgments. In alignment with advancements in the deep-learning community, data-driven approaches [38, 4, 10, 11, 6, 52, 61, 13] have similarly spurred innovations in IQA. (2) Non-reference methods evaluate the quality of a distorted image without a reference image. Traditional methods [30, 31, 28, 29, 26, 40, 27, 44] primarily calculate quality scores based on human-designed natural image statistics. Deep-learning-based methods [19, 25, 35, 63, 42, 20, 60] replace hand-crafted statistics by learning quality priors from extensive data. Recent works further enhance the performance by introducing graph representation [43], CLIP pre-training [48], continual learning [57], multitask learning [58], and so on. However, score-based IQA methods exhibit inherent limitations, particularly the inability to reflect the intricate analyses and weights of multiple aspects, as discussed in Sec. 1.
Multi-modal Large Language Models (MLLMs) incorporate other modalities (especially visions) into LLMs by leveraging the emergent ability of LLMs [32]. Early efforts [7, 47] primarily focus on data-efficient fine-tuning, while recent advancements [12, 18] build end-to-end trainable frameworks on web-scale multi-modal corpora. Various approaches choose to train different modules, e.g., the vision-to-text alignment modules [23, 62], the medium-gated layers [1], and the core LLMs [24, 51]. Recent studies emphasize integrating the intermediate features [56, 14, 22], improving in-context learning [59], and establishing comprehensive multi-modal benchmarks [53], etc. Recently, GPT-4V [33] has showcased remarkable capabilities in general visual understanding. However, we demonstrate in Sec. 5.3 that general MLLMs are not good at IQA tasks.
MLLMs for IQA. Q-Bench [50] introduces a comprehensive validation dataset to assess existing MLLMs in low-level perception and understanding tasks. Our work distinguishes itself from Q-Bench in two key aspects. First, in the task definition, our focus lies on quality comparison regarding distortions and texture damages across multiple images, whereas Q-Bench primarily centers on low-level descriptions within individual images. Second, Q-Bench evaluates existing general MLLMs with a newly constructed validation set, whereas we develop a specific MLLM for IQA that substantially outperforms existing general MLLMs.
3 DepictQA Task and Dataset
3.1 Task Description
Before introducing our method, we need to rethink the paradigm of IQA. To reflect the human process of assessing image quality, we intend to apply language as a powerful interactive and logical tool. Intuitively, the proposed DepictQA should have the following abilities.
First, DepictQA needs to identify the distortions and texture damages (Fig. 2a). Humans begin assessing image quality by identifying distortions and texture damages, as this is the basis for any subsequent assessment.
Second, DepictQA is required to compare distorted images like Fig. 2b rather than just calculate scores for individual images. Quantifying image quality has drawbacks, as the information from a single score is quite limited. It has also been verified that humans tend to make a biased quality assessment on a single image, but be more consistent and reliable on comparing two images [15, 16, 37].
Third, DepictQA should additionally weigh and judge multiple aspects that affect image quality. Humans consider many factors when making the image quality comparison. For example, when comparing an underexposed image and a blurry image in Fig. 2c, one may need to consider the actual impacts of these two distortions on the texture representation, and weigh among these considerations. DepictQA should mimic this weighing ability, which distinguishes DepictQA from previous IQA methods.
Based on the above discussion, as described in Fig. 2, we design a hierarchical task paradigm for DepictQA, progressively guiding the model to obtain the above abilities:
-
•
Task–1: Quality Description. Based on the provided reference image and a distorted image, describe the distortions and texture damages in the distorted image, and comment on the overall quality of the distorted image.
-
•
Task–2: Quality Comparison. Based on the provided reference image and two different distorted images, determine which distorted image has a better quality.
-
•
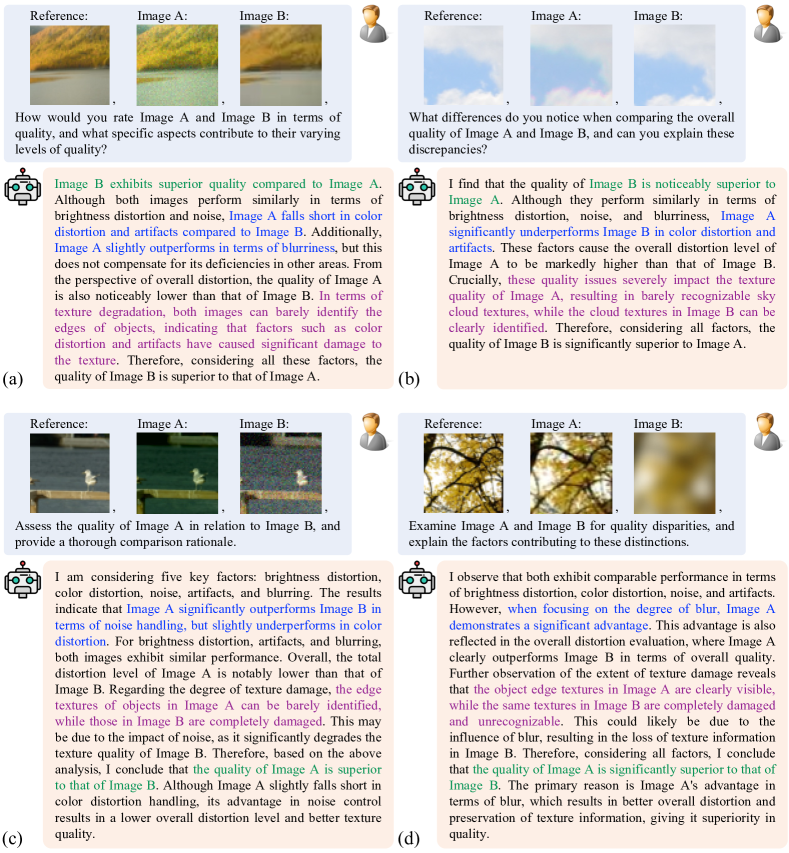
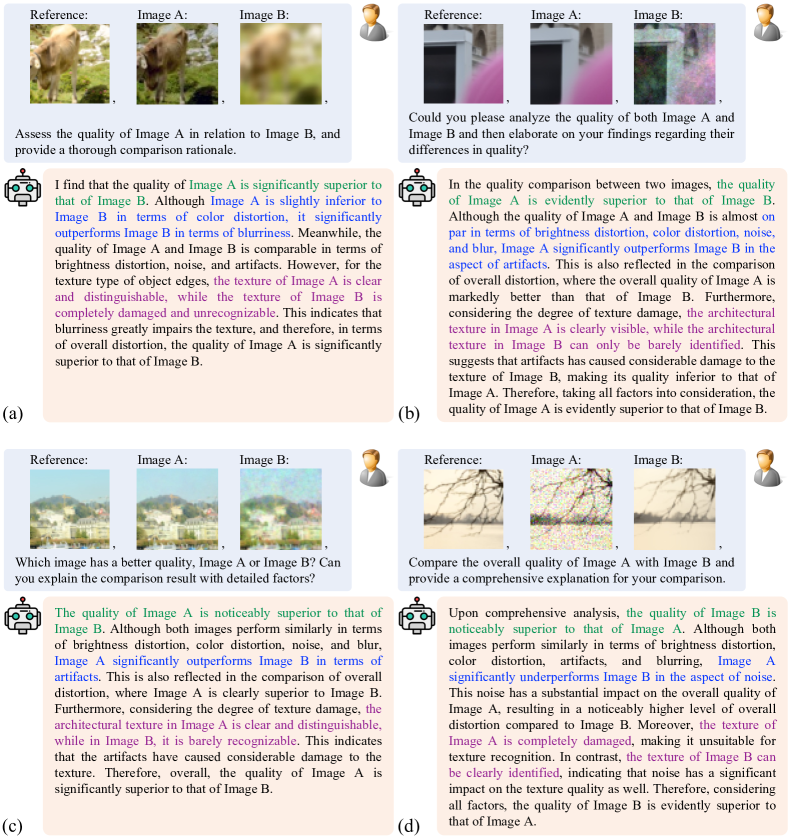
Task–3: Comparison Reasoning. Based on the comparison result, describe the distortions and texture damages of the two distorted images, make inferences, and weigh the pros and cons to justify its judgment on image quality.
3.2 Dataset Construction
Data serves as the key factor for training MLLMs. We follow the scheme of supervised fine-tuning [24, 53] to train DepictQA. Supervised fine-tuning requires collecting {images, question, response} data pairs, where “images” are the ones to be evaluated, “question” describes the task, and “response” is the reference answer. In this section, we describe in detail our selection of images and the collection of questions and responses for the three tasks.
Image collection for the IQA dataset consists of two aspects, one is the selection of reference images, and the other is the collection of distorted images. Existing works usually collect a large number of distorted images on a small number of reference images [37, 38, 15, 16]. However, the semantic richness of the training images are also very important. In our work, we collect reference images and their corresponding distorted images from the BAPPS dataset [55]. BAPPS dataset contains 197k highly diverse samples, meeting the diversity requirements of DepictQA training. For each sample, there is a reference image and its two distorted versions, as given in Fig. 2b and 2c. BAPPS dataset also provides human annotations, indicating which distorted image is more similar to the reference one, i.e., has better perceptual quality. These annotations can be used to build our dataset and validate our newly annotated data.
Question collection. For each task, users may express similar questions in different sentences, like the two questions in Fig. 1. To encourage the robustness of DepictQA to users’ questions, for each task, we first leverage GPT-4 to generate 30 questions. We then manually remove ambiguous and duplicate questions and modify inaccurate questions to form a set of 10 questions (see Appendix). During training and testing, we randomly sample a question from the question set to construct the data pair.
Response collection. A straightforward method to collecting high-quality texts requires manually writing the training texts [46, 34]. However, when annotators are inexperienced or tired, human-written texts can lead to huge biases and uneven quality. In this work, we use advanced LLMs to assist annotators in generating structured training texts, as illustrated in Fig. 2. We first collect the information that we want the texts to describe through a carefully designed questionnaire. Answering questions greatly reduces the possibility of ambiguity among annotators and ensures that the information is structured. We then use GPT-4 to convert our annotated questionnaire results into natural language. Finally, the outputs of GPT-4 are modified and improved by the annotators to correct errors, eliminate ambiguities, and add important information. This process greatly reduces the difficulty of collecting training texts and improves the quality of the training texts. Next, we introduce the details of the questionnaire for different tasks.
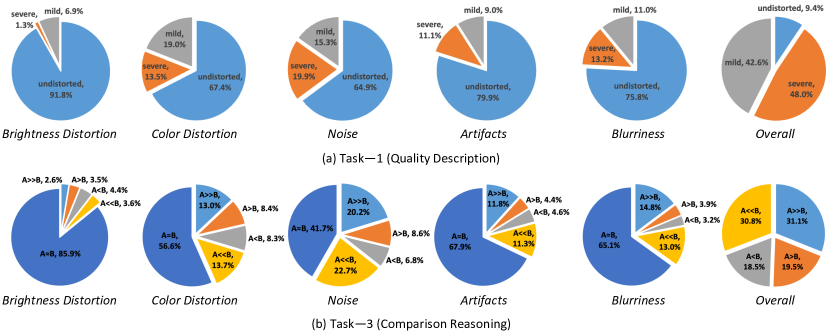
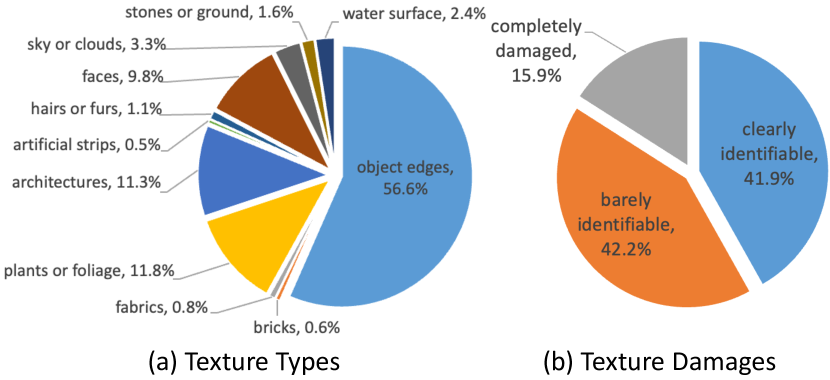
Task–1: Quality Description. A distorted image and its reference image are shown to annotators. Fig. 2a shows our questionnaire with three parts: texture, distortion, and overall quality. For the texture part, annotators are asked to select the one that best matches the image from a list containing 11 typical texture types, including object edges, bricks, fabrics, plants or foliage, architectures, artificial strips, hairs or furs, faces, sky or clouds, stones or ground, and water surface. These 11 types are selected based on the existing IQA [16] and texture recognition [2] research. Additionally, annotators are asked to indicate whether the texture is “clearly identifiable”, “barely identifiable”, or “completely damaged”. Regarding the distortion part, we ask annotators to summarize from the following five aspects: “brightness”, “color”, “noise”, “artifacts”, and “blurriness”. For each distortion, we use three levels for evaluation: “undistorted”, “mild”, and “severe”. This can express most distortions that appear in images. Finally, annotators need to comment on the overall quality of the image into three levels: “nearly undistorted”, “mild distortion”, and “severe distortion”.
Task–2: Quality Comparison. BAPPS dataset already includes binary comparison labels (i.e., Image A or Image B is better) for all image pairs. To convert these comparison labels into textural responses, we first build a response pool using GPT-4, including 20 generated sentences for “Image A is better” and another 20 for “Image B is better”. Then, for each comparison label, we randomly sample one response from the pool, as depicted in Fig. 2b.
Task–3: Comparison Reasoning. As shown in Fig. 2c, annotators are given two distorted images and the reference image. The annotation pipeline is similar to Task–1. Annotators compare two distorted images from the five kinds of distortions and the overall distortion using five options: “superior” (), “slightly superior” (), “roughly equal” (), “slightly inferior” (), and ‘inferior” ().
Dataset statistics. The statistics of our dataset are presented in Tab. 1 (more in Appendix). Our dataset comprises 5,104 detailed high-quality samples (Task–1 and Task–3), along with 115,646 brief templated samples (training set of Task–2). Each training sample is individually annotated by one annotator. In the validation set, samples are annotated by two annotators only if they reach a consensus. As a means of verification, the annotated “Overall Comparison” judgments in Task–3 exhibit a quite high consistency rate of 84.3% with the ground-truth judgments in the BAPPS dataset. For brevity, the three tasks will be shortened to description, comparison, and reasoning in the following.
| # Task–1 | # Task–2 | # Task–3 | |
| Quality Description | Quality Comparison | Comparison Reasoning | |
| Train | 1,115 | 115,646 | 3,739 |
| Validation | 50 | 9, 440 | 200 |
| Total | 1,165 | 125,086 | 3,939 |
4 DepictQA Framework
4.1 Model Architecture
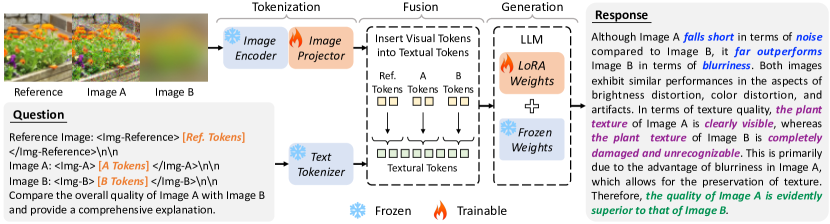
Fig. 3 shows the workflow of our DepictQA. DepictQA takes images and a quality-related question as inputs, and generate descriptive texts as response. In comparison or reasoning tasks, there are three input images: a reference image and Image A and B. In description task, there are two input images: a reference image and a distorted image. The input images and question are first tokenized, then fused, finally processed by the LLM for response generation.
Tokenizing input images and question. As shown in Fig. 3, we employ a frozen CLIP pre-trained ViT-L/14 [39] as the image encoder to represent the input images as visual tokens. Then, the question texts are tokenized to textual tokens by SentencePiece tokenizer [21]. The visual tokens cannot be directly processed by the LLM due to different embedding spaces, so we use a trainable image projector to map visual tokens into the textual space as in [24, 62].
Token fusion. We insert the visual tokens into pre-defined positions within the textual tokens, i.e., [Ref. Tokens], [A Tokens], [B Tokens] in the input question in Fig. 3.
Response generation using LLM. The fused tokens are fed into LLM to generate the final response. We use Vicuna-v1.5-7B [8] as the LLM. Pre-trained LLMs do not work well on IQA tasks, and need to be fine-tuned on our dataset. However, complete LLM fine-tuning is resource-intensive and data-hungry, requiring tens of thousands of high-quality human-written texts [34]. To get around of data shortage issue, we resort to LoRA [17], an efficient LLM fine-tuning technique, which selectively adjusts only a small set of parameters in the LLM. Following [17, 53], we apply LoRA to fine-tune the projection layers in all self-attention modules.
Unique tag to distinguish multiple images. Existing MLLMs [24, 62] are primarily designed to handle a single input image. They insert the visual tokens between the start (e.g., <Img>) and end (e.g., </Img>) tags. A simple extension to multi-image input is using textual cues to distinguish images, e.g., adding “Reference Image:”, “Image A:”, and “Image B:” before visual tokens. However, this simple extension sometimes fails to distinguish images, probably because the proportion of these short textual cues in the full texts is too small. To mitigate this, motivated by [59], we adpot the unique tag for each image. In comparison and reasoning tasks, we select <Img-Reference>, <Img-A>, and <Img-B> as start tags, adhering to the HTML rule by adding a trailing slash (“/”) in the end tags. In description task, the reference image retains the same tags, while the distorted image employs the original tags, <Img></Img>.
4.2 Training Scheme
Multi-source training data. As stated in Sec. 1, our training images come from three sets: (1) 115,646 brief templated data of Task–2 (comparison), (2) 4,854 high-quality data of Task–1 (description) and Task–3 (reasoning), which are duplicated by 10 times to increase the training weights, and (3) 48,734 content description data (Detailed Description dataset in [53]), which are unrelated to IQA. The abundant templated data principally bridge images and descriptive texts in quality-related tasks. The limited yet high-quality data foster the model’s descriptive and reasoning skills. The IQA-unrelated content description data can serve as regularization, given the limited text diversity of our IQA data for an MLLM. Experimental results in Tab. 5 prove the effectiveness of the three sources of training data.
Training objective. Following existing works [5, 53, 24], the training objective of DepictQA is the next token prediction loss: a cross-entropy loss between predicted and ground-truth next tokens. Note that only the tokens within the responses contribute to the loss computation. Also, only the image projection layer and LoRA parameters are optimized, comprising a mere 0.25% of the total parameters.
5 Experiments
This section discusses experimental setups and results. In our experiments, we set the LoRA rank to 16. The image size in BAPPS dataset [55] is , and we zero-pad it to , then encode it into 25 tokens. DepictQA is trained for 3 epochs on 4 GPUs (NVIDIA RTX A100 40G) with batch size 64. Adam optimizer with , weight decay 0.001, and learning rate 0.0005 is used for training. The total training time is around 10 hours.
5.1 Metrics
Unlike traditional score-based IQA, evaluating the descriptive textual results of IQA is not trivial. Therefore, we adopt three different metrics for comprehensive evaluation.
Accuracy. For comparison task, we employ the accuracy metric. Our model produces diverse textual outputs, necessitating transformation to bi-classification results (i.e., Image A or B is better) for accuracy calculation, which is achieved through GPT-3.5. For users without GPT-3.5 access, we offer a pre-trained BERT [9] for classification, with a high consistency level of 97.5% with GPT-3.5.
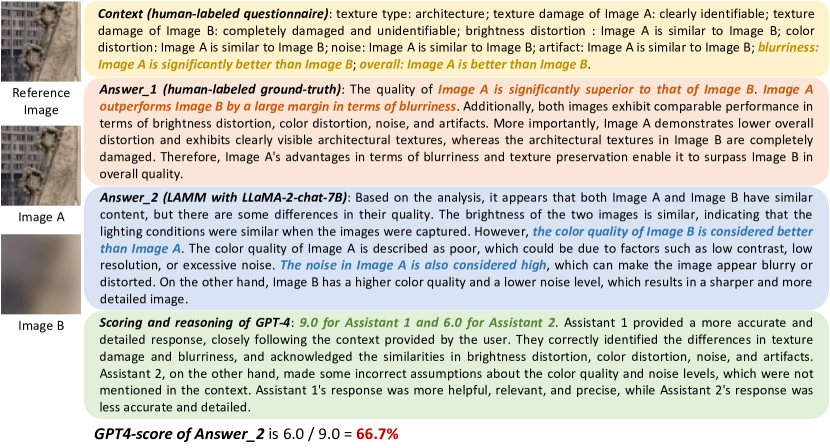
GPT4-score. For description and reasoning tasks, following [8, 24], we utilize the GPT4-score for assessment. Specifically, we provide GPT-4 with all information in the human-labeled questionnaire as context. Then, we give GPT-4 both the model-generated response and the corresponding ground truth response. Based on the context, GPT-4 evaluates the helpfulness, relevance, accuracy, and level of detail of these two responses, and gives an overall score on a scale of 0 to 10, where a higher score indicates better quality. Finally, the relative score with regard to the ground truth response is reported as the GPT4-score.
Reasonable-rate by human evaluators. We observe that the GPT4-score exhibits excessive confidence in low-quality responses. In some cases, a fully wrong response even receives a GPT4-score over 60% (see Appendix). Consequently, for a more comprehensive evaluation, given both the images and responses, human evaluators label each response as reasonable or unreasonable. A reasonable response should adhere to three criteria: indicating major distortions, no severe mistakes, and logical self-consistency, which are detailed in Appendix. The reasonable-rate serves as another metric to assess description and reasoning ability.
5.2 Comparison with Score-based IQA Methods
To demonstrate the effectiveness of DepictQA, we compare it with score-based IQA methods on the validation set of comparison task (Task–2), which is the same as the “Traditional” and “CNN” categories (two sets of distortions) in BAPPS’s validation set. We evaluate four traditional IQA methods including PSNR, SSIM [49], VIF [41], FSIM [54], and four deep-learning-based IQA methods including DeepIQA [3], PieAPP [38], LPIPS [55], and DISTS [10]. The results of PSNR, SSIM, and LPIPS are borrowed from [55], and the results of VIF, FSIM, DeepIQA, PieAPP, and DISTS are borrowed from [10].
Quantitative results of quality comparison on BAPPS are depicted in Tab. 2. Our DepictQA surpasses the best traditional method, FSIM, by a large margin (10%). We also outperform the best deep-learning-based competitors, LPIPS and DISTS. Unlike high-level perception tasks where multi-modal approaches usually lag behind single-modal methods [53], we show that multi-modal IQA methods can surpass score-based counterparts. Nevertheless, the quantitative comparison is not the key issue, we pay more attention to the description and reasoning abilities.
| Type | Method | Distortion Category | Average | |
|---|---|---|---|---|
| Traditional | CNN | |||
| Oracle | Human | 80.8 | 84.4 | 82.6 |
| Traditional | PSNR | 59.9 | 77.8 | 68.9 |
| SSIM [49] | 60.3 | 79.1 | 69.7 | |
| VIF [41] | 55.6 | 74.4 | 65.0 | |
| FSIM [54] | 62.7 | 79.4 | 71.0 | |
| Learning | DeepIQA [3] | 70.3 | 79.4 | 74.8 |
| PieAPP [38] | 72.7 | 77.0 | 74.6 | |
| LPIPS [55] | 76.0 | 82.8 | 79.4 | |
| DISTS [10] | 77.2 | 82.2 | 79.7 | |
| DepictQA (Ours) | 78.4 | 82.7 | 80.6 | |
5.3 Comparison with General Multi-modal LLMs
We further compare DepictQA with general Multi-modal LLMs (MLLMs) on the validation sets of description (Task–1) and reasoning (Task–3) tasks. We also transform the reasoning responses to bi-classification results to calculate the comparison accuracy. We choose three MLLMs as baselines: LLaVA [24], MiniGPT4 [62], and LAMM [53]. The model weights are obtained from their official GitHub repositories. We provide explicit and comprehensive task instructions to inform the MLLMs of the task definition.
Quantitative results are illustrated in Tab. 3. LLaVA-v1 and MiniGPT4 (LLaMA-2-chat) fail in IQA tasks, yielding either nearly identical results or irrelevant results across most samples. Other general MLLMs also exhibit poor performance, indicating their inadequacy for IQA tasks. However, after fine-tuning on our M-BAPPS dataset, our DepictQA achieves significantly improved performance.
Qualitative results. Three qualitative results of reasoning task are depicted in Fig. 1 and Fig. 3. More qualitative results and failure cases of description, comparison, and reasoning tasks are illustrated in Appendix.
| Method | LLM (7B) | Description | Comparison | Reasoning |
|---|---|---|---|---|
| LLaVA-v1 [24] | LLaMA-2-chat | fail | fail | fail |
| LLaVA-v1.5 [24] | Vicuna-v1.5 | 18.0 / 65.8 | 43.0 / 50.6 | 7.0 / 63.9 |
| MiniGPT4 [62] | Vicuna-v0 | 16.0 / 49.9 | 38.0 / 46.3 | 1.0 / 42.4 |
| MiniGPT4 [62] | LLaMA-2-chat | fail | fail | fail |
| LAMM [53] | Vicuna-v0 | 12.0 / 62.5 | 53.0 / 55.8 | 4.0 / 58.1 |
| LAMM [53] | LLaMA-2-chat | 8.0 / 57.4 | 44.0 / 48.9 | 5.0 / 52.4 |
| DepictQA (ours) | Vicuna-v1.5 | 64.0 / 76.2 | 82.0 | 53.0 / 76.4 |
5.4 Comparison with GPT-4V
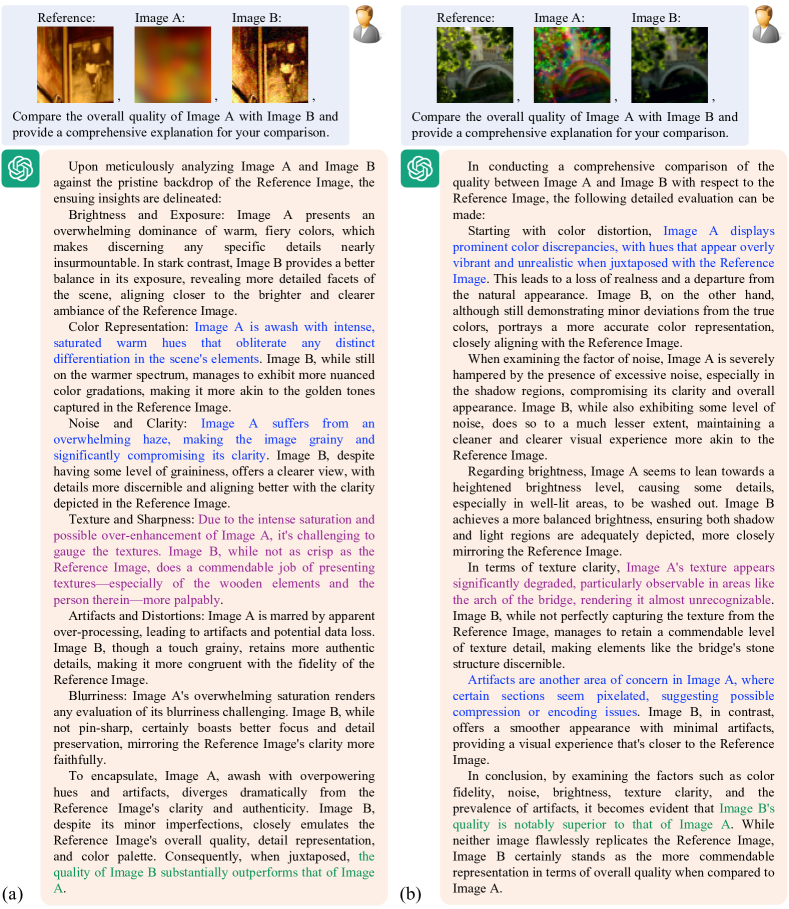
We compare DepictQA with GPT-4V [33] on the first 100 samples in the validation set of Task–3 (reasoning). We request GPT-4V to complete both comparison and reasoning tasks. GPT-4V is given detailed instructions and two human-labeled examples for task description. As shown in Tab. 4, our DepictQA and GPT-4V have mutual advantages and disadvantages. The GPT4-score of GPT-4V is quite high, even higher than human-annotated responses (100%), because of the linguistic fluency and detailed description of image contents. However, we achieve comparable performance at the human-evaluated reasonable-rate. Moreover, the quality comparison ability of DepictQA is significantly better than GPT-4V. Note that GPT-4V is close-source and expensive to access, thus developing an effective MLLM for IQA is worthwhile. See Appendix for qualitative results and failure cases of GPT-4V.
5.5 Ablation Studies
In this section, we conduct extensive ablation studies to verify the effectiveness of our methodologies.
Effects of multi-source training data are detailed in Tab. 5. (1) Inclusion of Task-2 data (comparison) remarkably improves comparison accuracy (#2 vs. #4). Even though these texts are brief and templated, the abundant samples still help better bridge the images and texts in quality-related tasks. (2) As evidenced by #1 vs. #4 and #3 vs. #5, Task-3 data (reasoning) are necessary for a robust reasoning ability. Examination of #4 against #5 indicates that Task-1 data (description) boost both comparison and reasoning metrics, mainly by helping identify distortions. Therefore, the high-quality texts of Task–1 and Task–3 are necessary for DepictQA to depict the image quality with language. (3) Integrating content description data advances the performance (#5 vs. #6) by serving as regularization in light of M-BAPPS’s limited text variety for an MLLM. Additionally, the content description data also helps enrich the text diversity, as shown in Appendix.
| # | Training Data | Comparison | Reasoning | |||
| Task–2 | Task–1 | Task–3 | Content | |||
| 1 | ✓ | 77.2 / 81.4 | N/A | |||
| 2 | ✓ | 66.4 / 65.4 | 31.0 / 74.2 | |||
| 3 | ✓ | ✓ | 77.4 / 81.9 | N/A | ||
| 4 | ✓ | ✓ | 77.6 / 80.6 | 41.0 / 74.3 | ||
| 5 | ✓ | ✓ | ✓ | 78.1 / 82.1 | 45.0 / 77.2 | |
| 6 | ✓ | ✓ | ✓ | ✓ | 78.4 / 82.7 | 53.0 / 76.4 |
Unique tag effectively mitigates the confusion problem, detailed in Fig. 4. Confusion occurs when distortions in one image are mistakenly attributed to another. To quantify this, we manually review 50 responses and compute the confusion rate. With the unified tag, the model needs to distinguish images through textual hinds, as stated in Sec. 4.1, leading to a 24% confusion rate. Adding a unique tag for each image significantly reduces the confusion rate to 12%.
The size of training data is studied in Fig. 5. As the size of training data increases, the comparison performance gradually increases. Thus the quantity of the training data still plays a key role in the MLLM-based method.

LLMs and the initialization methods are studied in Tab. 6. For random initialization, we retrain the image projector and LoRA parameters from scratch. For high-level initialization, trainable parameters are pre-trained on high-level perception tasks (e.g., detection). (1) Results from #1, #3, and #5 show that with random initialization, the effects of changing the LLM are negligible. (2) For advanced LLMs like Vicuna-v1.5 or LLaMA-2-chat, pre-training on high-level perceptual tasks (#4 and #6) markedly degrades the performance. These models’ responses are more likely to describe content rather than assess quality. Hence, we suspect that for advanced LLMs, the distance between the optimal parameters of high-level perception tasks and IQA tasks is substantial. This leads to a convergence at a local optimal proximal to the pre-trained weights.
| # | LLM | Initialization | Comparison |
|---|---|---|---|
| 1 | Vicuna-v0-7B | Random | 78.3 / 82.4 |
| 2 | Vicuna-v0-7B | High-level | 78.1 / 82.1 |
| 3 | Vicuna-v1.5-7B | Random | 78.4 / 82.7 |
| 4 | Vicuna-v1.5-7B | High-level | 70.6 / 73.1 |
| 5 | LLaMA-2-chat-7B | Random | 78.2 / 82.7 |
| 6 | LLaMA-2-chat-7B | High-level | 63.3 / 63.7 |
6 Extension and Limitations
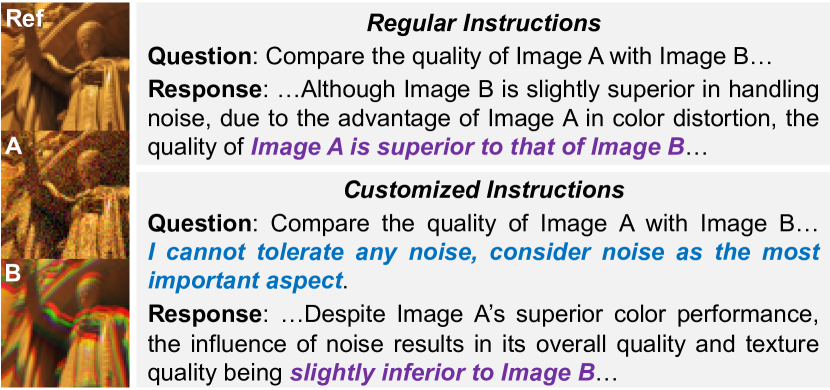
Extension. Given various instructions, DepictQA has the potential to be a customized IQA tool. To demonstrate this potential, as shown in Fig. 6, we append the specific human preference (e.g., cannot tolerate any noise) to the instructions, DepictQA adapts its comparison results accordingly. How to better induce this ability is our future work.
Limitations. In this preliminary attempt, we demonstrate the possibility of depicting image quality with MLLMs. There is still a long way to go for real-world application. (1) The amount and coverage of data are not sufficient, limiting the generalization to real-world images. (2) The performance in description and reasoning tasks is not satisfying, particularly in human-evaluated reasonable-rate. (3) The distortion types can be more than five, even not pre-defined. Also, more fine-grained comparisons focusing on local details are preferred. (4) Finally, whether MLLM-based IQA methods can take the place of score-based ones is still an open question. These belong to our future works.
7 Conclusion
We propose DepictQA, employing MLLMs for descriptive and human-like IQA. DepictQA differs from score-based methods by describing and comparing image distortions and texture damages with languages, well aligned with the human evaluation process. For DepictQA development, we create a hierarchical task paradigm and gather a multi-modal IQA dataset. To address issues in limited data and multiple image processing, we employ multi-source data and specific image tags. DepictQA surpasses score-based approaches in the BAPPS benchmark. Compared to general MLLMs, DepictQA outputs more precise description and reasoning results. Our work also reveals the adaptability of MLLM-based IQA methods for individual preferences.
References
- Alayrac et al. [2022] Jean-Baptiste Alayrac, Jeff Donahue, Pauline Luc, Antoine Miech, Iain Barr, Yana Hasson, Karel Lenc, Arthur Mensch, Katherine Millican, Malcolm Reynolds, et al. Flamingo: a visual language model for few-shot learning. In NeurIPS, 2022.
- Bell et al. [2015] Sean Bell, Paul Upchurch, Noah Snavely, and Kavita Bala. Material recognition in the wild with the materials in context database. In CVPR, 2015.
- Bosse et al. [2017] Sebastian Bosse, Dominique Maniry, Klaus-Robert Müller, Thomas Wiegand, and Wojciech Samek. Deep neural networks for no-reference and full-reference image quality assessment. IEEE TIP, 2017.
- Bosse et al. [2018] Sebastian Bosse, Dominique Maniry, Klaus-Robert Müller, Thomas Wiegand, and Wojciech Samek. Deep neural networks for no-reference and full-reference image quality assessment. IEEE TIP, 2018.
- Brown et al. [2020] Tom Brown, Benjamin Mann, Nick Ryder, Melanie Subbiah, Jared D Kaplan, Prafulla Dhariwal, Arvind Neelakantan, Pranav Shyam, Girish Sastry, Amanda Askell, et al. Language models are few-shot learners. In NeurIPS, 2020.
- Cao et al. [2022] Yue Cao, Zhaolin Wan, Dongwei Ren, Zifei Yan, and Wangmeng Zuo. Incorporating semi-supervised and positive-unlabeled learning for boosting full reference image quality assessment. In CVPR, 2022.
- Chen et al. [2022] Jun Chen, Han Guo, Kai Yi, Boyang Li, and Mohamed Elhoseiny. Visualgpt: Data-efficient adaptation of pretrained language models for image captioning. In CVPR, 2022.
- Chiang et al. [2023] Wei-Lin Chiang, Zhuohan Li, Zi Lin, Ying Sheng, Zhanghao Wu, Hao Zhang, Lianmin Zheng, Siyuan Zhuang, Yonghao Zhuang, Joseph E Gonzalez, et al. Vicuna: An open-source chatbot impressing gpt-4 with 90%* chatgpt quality. https://vicuna.lmsys.org, 2023.
- Devlin et al. [2018] Jacob Devlin, Ming-Wei Chang, Kenton Lee, and Kristina Toutanova. Bert: Pre-training of deep bidirectional transformers for language understanding. arXiv preprint arXiv:1810.04805, 2018.
- Ding et al. [2020] Keyan Ding, Kede Ma, Shiqi Wang, and Eero P Simoncelli. Image quality assessment: Unifying structure and texture similarity. IEEE TPAMI, 2020.
- Ding et al. [2021] Keyan Ding, Yi Liu, Xueyi Zou, Shiqi Wang, and Kede Ma. Locally adaptive structure and texture similarity for image quality assessment. In ACM MM, 2021.
- Driess et al. [2023] Danny Driess, Fei Xia, Mehdi SM Sajjadi, Corey Lynch, Aakanksha Chowdhery, Brian Ichter, Ayzaan Wahid, Jonathan Tompson, Quan Vuong, Tianhe Yu, et al. Palm-e: An embodied multimodal language model. arXiv preprint arXiv:2303.03378, 2023.
- Ghildyal and Liu [2022] Abhijay Ghildyal and Feng Liu. Shift-tolerant perceptual similarity metric. In ECCV, 2022.
- Gong et al. [2023] Tao Gong, Chengqi Lyu, Shilong Zhang, Yudong Wang, Miao Zheng, Qian Zhao, Kuikun Liu, Wenwei Zhang, Ping Luo, and Kai Chen. Multimodal-gpt: A vision and language model for dialogue with humans. arXiv preprint arXiv:2305.04790, 2023.
- Gu et al. [2020a] Jinjin Gu, Haoming Cai, Haoyu Chen, Xiaoxing Ye, Jimmy Ren, and Chao Dong. Image quality assessment for perceptual image restoration: A new dataset, benchmark and metric. arXiv preprint arXiv:2011.15002, 2020a.
- Gu et al. [2020b] Jinjin Gu, Haoming Cai, Haoyu Chen, Xiaoxing Ye, Jimmy Ren, and Chao Dong. Pipal: a large-scale image quality assessment dataset for perceptual image restoration. arXiv preprint arXiv:2007.12142, 2020b.
- Hu et al. [2021] Edward J Hu, Phillip Wallis, Zeyuan Allen-Zhu, Yuanzhi Li, Shean Wang, Lu Wang, Weizhu Chen, et al. Lora: Low-rank adaptation of large language models. In ICLR, 2021.
- Huang et al. [2023] Shaohan Huang, Li Dong, Wenhui Wang, Yaru Hao, Saksham Singhal, Shuming Ma, Tengchao Lv, Lei Cui, Owais Khan Mohammed, Qiang Liu, et al. Language is not all you need: Aligning perception with language models. arXiv preprint arXiv:2302.14045, 2023.
- Kang et al. [2014] Le Kang, Peng Ye, Yi Li, and David Doermann. Convolutional neural networks for no-reference image quality assessment. In CVPR, 2014.
- Ke et al. [2021] Junjie Ke, Qifei Wang, Yilin Wang, Peyman Milanfar, and Feng Yang. Musiq: Multi-scale image quality transformer. In CVPR, 2021.
- Kudo and Richardson [2018] Taku Kudo and John Richardson. Sentencepiece: A simple and language independent subword tokenizer and detokenizer for neural text processing. In Proceedings of the 2018 Conference on Empirical Methods in Natural Language Processing: System Demonstrations, 2018.
- Li et al. [2023a] Bo Li, Yuanhan Zhang, Liangyu Chen, Jinghao Wang, Jingkang Yang, and Ziwei Liu. Otter: A multi-modal model with in-context instruction tuning. arXiv preprint arXiv:2305.03726, 2023a.
- Li et al. [2023b] Junnan Li, Dongxu Li, Silvio Savarese, and Steven Hoi. Blip-2: Bootstrapping language-image pre-training with frozen image encoders and large language models. arXiv preprint arXiv:2301.12597, 2023b.
- Liu et al. [2023] Haotian Liu, Chunyuan Li, Qingyang Wu, and Yong Jae Lee. Visual instruction tuning. arXiv preprint arXiv:2304.08485, 2023.
- Liu et al. [2017] Xialei Liu, Joost van de Weijer, and Andrew D. Bagdanov. RankIQA: Learning from rankings for no-reference image quality assessment. In ICCV, 2017.
- Ma et al. [2017] Chao Ma, Chih-Yuan Yang, Xiaokang Yang, and Ming-Hsuan Yang. Learning a no-reference quality metric for single-image super-resolution. Computer Vision and Image Understanding, 2017.
- Mittal et al. [2012] Anish Mittal, Anush Krishna Moorthy, and Alan Conrad Bovik. No-reference image quality assessment in the spatial domain. IEEE TIP, 2012.
- Mittal et al. [2013] Anish Mittal, Rajiv Soundararajan, and Alan C. Bovik. Making a “completely blind” image quality analyzer. IEEE Sign. Process. Letters, 2013.
- Mittal et al. [2022] Anish Mittal, Anush Krishna Moorthy, and Alan Conrad Bovik. No-reference image quality assessment in the spatial domain. IEEE TIP, 2022.
- Moorthy and Bovik [2010] Anush Krishna Moorthy and Alan Conrad Bovik. A two-step framework for constructing blind image quality indices. IEEE Sign. Process. Letters, 2010.
- Moorthy and Bovik [2011] Anush Krishna Moorthy and Alan Conrad Bovik. Blind image quality assessment: From natural scene statistics to perceptual quality. IEEE TIP, 2011.
- Openai [2023] Openai. Gpt-4 technical report. arXiv preprint arXiv:2303.08774, 2023.
- OpenAI [2023] OpenAI. GPT-4V(ision) system card. https://openai.com/research/gpt-4v-system-card, 2023.
- Ouyang et al. [2022] Long Ouyang, Jeffrey Wu, Xu Jiang, Diogo Almeida, Carroll Wainwright, Pamela Mishkin, Chong Zhang, Sandhini Agarwal, Katarina Slama, Alex Ray, et al. Training language models to follow instructions with human feedback. In NeurIPS, 2022.
- Pan et al. [2018] Da Pan, Ping Shi, Ming Hou, Zefeng Ying, Sizhe Fu, and Yuan Zhang. Blind predicting similar quality map for image quality assessment. In CVPR, 2018.
- Ponomarenko et al. [2009] Nikolay Ponomarenko, Vladimir Lukin, Alexander Zelensky, Karen Egiazarian, Marco Carli, and Federica Battisti. Tid2008-a database for evaluation of full-reference visual quality assessment metrics. Advances of modern radioelectronics, 2009.
- Ponomarenko et al. [2015] Nikolay Ponomarenko, Lina Jin, Oleg Ieremeiev, Vladimir Lukin, Karen Egiazarian, Jaakko Astola, Benoit Vozel, Kacem Chehdi, Marco Carli, Federica Battisti, et al. Image database tid2013: Peculiarities, results and perspectives. Signal processing: Image communication, 2015.
- Prashnani et al. [2018] Ekta Prashnani, Hong Cai, Yasamin Mostofi, and Pradeep Sen. Pieapp: Perceptual image-error assessment through pairwise preference. In CVPR, 2018.
- Radford et al. [2021] Alec Radford, Jong Wook Kim, Chris Hallacy, Aditya Ramesh, Gabriel Goh, Sandhini Agarwal, Girish Sastry, Amanda Askell, Pamela Mishkin, Jack Clark, et al. Learning transferable visual models from natural language supervision. In ICML, 2021.
- Saad et al. [2012] Michele A Saad, Alan C Bovik, and Christophe Charrier. Blind image quality assessment: A natural scene statistics approach in the dct domain. IEEE TIP, 2012.
- Sheikh and Bovik [2006] Hamid R Sheikh and Alan C Bovik. Image information and visual quality. IEEE TIP, 2006.
- Su et al. [2020] Shaolin Su, Qingsen Yan, Yu Zhu, Cheng Zhang, Xin Ge, Jinqiu Sun, and Yanning Zhang. Blindly assess image quality in the wild guided by a self-adaptive hyper network. In CVPR, 2020.
- Sun et al. [2022] Simen Sun, Tao Yu, Jiahua Xu, Wei Zhou, and Zhibo Chen. GraphIQA: Learning distortion graph representations for blind image quality assessment. IEEE TMM, 2022.
- Tang et al. [2011] Huixuan Tang, Neel Joshi, and Ashish Kapoor. Learning a blind measure of perceptual image quality. In CVPR, 2011.
- Touvron et al. [2023a] Hugo Touvron, Thibaut Lavril, Gautier Izacard, Xavier Martinet, Marie-Anne Lachaux, Timothée Lacroix, Baptiste Rozière, Naman Goyal, Eric Hambro, Faisal Azhar, et al. Llama: Open and efficient foundation language models. arXiv preprint arXiv:2302.13971, 2023a.
- Touvron et al. [2023b] Hugo Touvron, Louis Martin, Kevin Stone, Peter Albert, Amjad Almahairi, Yasmine Babaei, Nikolay Bashlykov, Soumya Batra, Prajjwal Bhargava, Shruti Bhosale, et al. Llama 2: Open foundation and fine-tuned chat models. arXiv preprint arXiv:2307.09288, 2023b.
- Tsimpoukelli et al. [2021] Maria Tsimpoukelli, Jacob L Menick, Serkan Cabi, SM Eslami, Oriol Vinyals, and Felix Hill. Multimodal few-shot learning with frozen language models. In NeurIPS, 2021.
- Wang et al. [2023] Jianyi Wang, Kelvin CK Chan, and Chen Change Loy. Exploring clip for assessing the look and feel of images. In AAAI, 2023.
- Wang et al. [2004] Zhou Wang, Alan C Bovik, Hamid R Sheikh, and Eero P Simoncelli. Image quality assessment: from error visibility to structural similarity. IEEE TIP, 2004.
- Wu et al. [2023] Haoning Wu, Zicheng Zhang, Erli Zhang, Chaofeng Chen, Liang Liao, Annan Wang, Chunyi Li, Wenxiu Sun, Qiong Yan, Guangtao Zhai, et al. Q-bench: A benchmark for general-purpose foundation models on low-level vision. arXiv preprint arXiv:2309.14181, 2023.
- Ye et al. [2023] Qinghao Ye, Haiyang Xu, Guohai Xu, Jiabo Ye, Ming Yan, Yiyang Zhou, Junyang Wang, Anwen Hu, Pengcheng Shi, Yaya Shi, et al. mplug-owl: Modularization empowers large language models with multimodality. arXiv preprint arXiv:2304.14178, 2023.
- Yin et al. [2022] Guanghao Yin, Wei Wang, Zehuan Yuan, Chuchu Han, Wei Ji, Shouqian Sun, and Changhu Wang. Content-variant reference image quality assessment via knowledge distillation. In AAAI, 2022.
- Yin et al. [2023] Zhenfei Yin, Jiong Wang, Jianjian Cao, Zhelun Shi, Dingning Liu, Mukai Li, Lu Sheng, Lei Bai, Xiaoshui Huang, Zhiyong Wang, et al. Lamm: Language-assisted multi-modal instruction-tuning dataset, framework, and benchmark. arXiv preprint arXiv:2306.06687, 2023.
- Zhang et al. [2011] Lin Zhang, Lei Zhang, Xuanqin Mou, and David Zhang. FSIM: A feature similarity index for image quality assessment. IEEE TIP, 2011.
- Zhang et al. [2018] Richard Zhang, Phillip Isola, Alexei A Efros, Eli Shechtman, and Oliver Wang. The unreasonable effectiveness of deep features as a perceptual metric. In CVPR, 2018.
- Zhang et al. [2023a] Renrui Zhang, Jiaming Han, Aojun Zhou, Xiangfei Hu, Shilin Yan, Pan Lu, Hongsheng Li, Peng Gao, and Yu Qiao. Llama-adapter: Efficient fine-tuning of language models with zero-init attention. arXiv preprint arXiv:2303.16199, 2023a.
- Zhang et al. [2022] Weixia Zhang, Dingquan Li, Chao Ma, Guangtao Zhai, Xiaokang Yang, and Kede Ma. Continual learning for blind image quality assessment. IEEE TPAMI, 2022.
- Zhang et al. [2023b] Weixia Zhang, Guangtao Zhai, Ying Wei, Xiaokang Yang, and Kede Ma. Blind image quality assessment via vision-language correspondence: A multitask learning perspective. In CVPR, 2023b.
- Zhao et al. [2023] Haozhe Zhao, Zefan Cai, Shuzheng Si, Xiaojian Ma, Kaikai An, Liang Chen, Zixuan Liu, Sheng Wang, Wenjuan Han, and Baobao Chang. Mmicl: Empowering vision-language model with multi-modal in-context learning. arXiv preprint arXiv:2309.07915, 2023.
- Zheng et al. [2021] Heliang Zheng, Jianlong Fu, Yanhong Zeng, Zheng-Jun Zha, and Jiebo Luo. Learning conditional knowledge distillation for degraded-reference image quality assessment. ICCV, 2021.
- Zhou and Wang [2022] Wei Zhou and Zhou Wang. Quality assessment of image super-resolution: Balancing deterministic and statistical fidelity. In ACM MM, 2022.
- Zhu et al. [2023] Deyao Zhu, Jun Chen, Xiaoqian Shen, Xiang Li, and Mohamed Elhoseiny. MiniGPT-4: Enhancing vision-language understanding with advanced large language models. arXiv preprint arXiv:2304.10592, 2023.
- Zhu et al. [2020] Hancheng Zhu, Leida Li, Jinjian Wu, Weisheng Dong, and Guangming Shi. MetaIQA: deep meta-learning for no-reference image quality assessment. In CVPR, 2020.
Appendix
Appendix A Overview
This Appendix is structured as follows. Dataset details are described in Appendix B, followed by the methodology details in Appendix C. Appendix D provides additional ablation studies. More quantitative results, qualitative results, and failure cases are presented in Appendix E.
Appendix B Dataset Details
In this section, we provide additional descriptions and statistics of the introduced M-BAPPS dataset.
In-context learning for response generation. As detailed in the main paper, GPT-4 [32] is employed to convert human-annotated questionnaire options into a natural language paragraph. Yet, GPT-4 tends to produce responses that are overly verbose and potentially misleading. To mitigate this, we supply GPT-4 with two human-written examples to align the generated responses with a consistent writing style. Empirically, in-context learning effectively resolves these issues, yielding high-quality responses.
Questions in the question set. We show various question examples in the qualitative results of Task–1 (quality description, Fig. A8 & A9), Task–2 (quality comparison, Fig. A10 & A11), and Task–3 (comparison reasoning, Fig. A12, A13, & A14). This corroborates that users may express similar questions in different sentences, as discussed in the main paper.
Statistics of the response length in our M-BAPPS dataset are illustrated in Tab. A1. We present metrics on both word count and string length. For the evaluation of Task–2 (quality comparison), only the bi-classification ground-truth is utilized, so there is no need for statistics of the validation set. The distribution of word length in our M-BAPPS dataset is depicted in Fig. A1.
| Task–1 | Task–2 | Task–3 | |
|---|---|---|---|
| Quality Description | Quality Comparison | Comparison Reasoning | |
| Train | 135.1 / 888.9 | 19.0 / 131.7 | 143.3 / 886.4 |
| Validation | 143.8 / 947.3 | -† | 140.0 / 883.3 |

Statistics of questionnaire options are presented in Fig. A2 and Fig. A3. As detailed in the main paper, when annotating, annotators first complete a carefully designed questionnaire. Here we provide statistical breakdowns of the questionnaire’s options. Distortion-related option statistics appear in Fig. A2. Due to the distinct distortion options in Task–1 (quality description) and Task–3 (comparison reasoning), their counts are presented separately. Texture-related option statistics are outlined in Fig. A3.
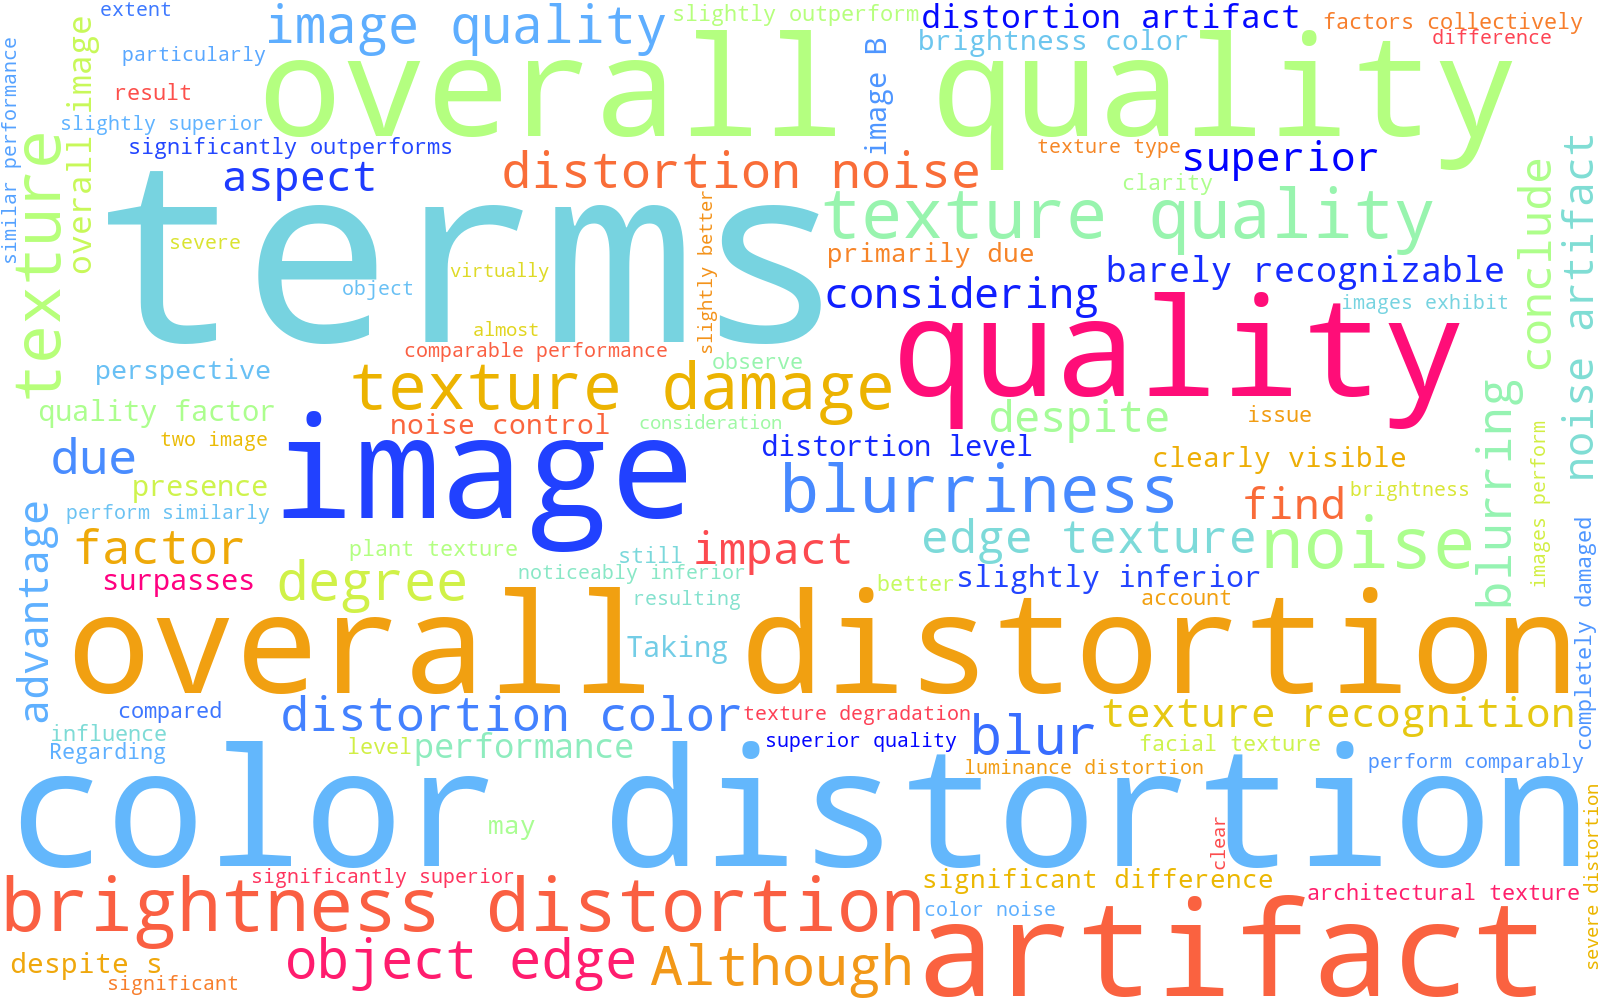
Wordcloud of M-BAPPS dataset is depicted in Fig. A4. We manually exclude “Image A” and “Image B” from Fig. A4, as they are constant proper nouns across all texts.
Appendix C Methodology Details
In this section, we describe in detail the setup of model architecture and the calculation of metrics.
C.1 Architecture
Model setup. The image size in the BAPPS dataset [55] is , and we pad it to with zero-padding. Subsequently, we partition the image into 25 patches, with each sized at . We encode the image patches into 25 visual tokens using the CLIP pre-trained ViT-L/14 [39], with each token having the channel of 1024. To accommodate the smaller image size of , as opposed to the standard , we truncate the position embeddings in ViT accordingly. The image projection layer projects these visual tokens to the hidden dimension of the Vicuna-v1.5-7B [8], which is 4096. In LoRA, the rank and scale factor are both set as 16. There are 32 attention layers in Vicuna-v1.5-7B in total. In each attention layer, the projection weights of “query”, “key”, “value”, and “output” are adjusted using two delta parameters with the shape of and , respectively.
C.2 Metrics
Accuracy. We deploy GPT-3.5 to convert varied textual comparison results into binary classification results (i.e., determining whether A or B is better) for accuracy computation. Upon gathering approximately 10k textual comparison results and their binary classifications, we train a BERT [9] model, achieving 97.5% agreement with GPT-3.5 in the test dataset. This model will be made available for those lacking access to GPT-3.5. However, the BERT model is tailored to evaluate the model trained on our data. Its performance on out-of-distribution data is not guaranteed.
GPT4-score. To compute the GPT4-score for one response, we input GPT-4 with the following contents: “context”, “question”, “answer_1”, “answer_2”, and “instruction”. The “instruction” directs GPT-4 to assess two answers (“answer_1” and “answer_2”) to the same “question” using the “context” knowledge, and then rate each answer on a scale of . The “context” contains all information in the human-labeled questionnaire, which is the correct knowledge for GPT-4 to evaluate answers. The “question” refers to the quality-related question posed to the MLLMs. The “answer_1” is actually the ground-truth response, which is labeled by human-evaluators. The “answer_2” is the response of the MLLM to be evaluated. Then, the score of “answer_2” (i.e., the MLLM to be evaluated) relevant to “answer_1” (i.e., the ground-truth) serves as the GPT4-score of “answer_2”. We calculate the final metric by averaging the scores across all samples. As discussed in the main paper, the GPT4-score tends to be overly generous for low-quality responses, resulting in inflated scores. One example is shown in Fig. A5, where a fully wrong response still receives a GPT4-score of 66.7%.
Reasonable-rate evaluated by humans. Human evaluators are requested to label each response as either reasonable or unreasonable, based on the provided images and corresponding responses. One “reasonable” response should adhere to three criteria. (1) The response must accurately identify the most important quality issue that directly influences the comparison result. (2) The response should avoid serious false positive distortions conflicting with human evaluation. (3) The response’s description, reasoning, and conclusion should align closely. Minor errors not violating these three rules are permissible.
Appendix D Ablation Studies
In this section, we conduct more ablation studies to verify the effectiveness of our methodologies.
Influences of LoRA rank are illustrated in Tab. A2. Our DepictQA is insensitive to this hyper-parameter, and the best performance is achieved with the LoRA rank as 16.
| LoRA Rank | 8 | 12 | 16 | 24 | 32 |
|---|---|---|---|---|---|
| Traditional | 77.8 | 77.1 | 78.4 | 78.2 | 77.2 |
| CNN | 81.0 | 81.1 | 82.7 | 82.3 | 81.5 |
| Average | 79.4 | 79.1 | 80.6 | 80.3 | 79.4 |
Different methods to distinguish multiple images. In addition to the unique tag method introduced in the main paper, we investigate alternative strategies for managing multiple images. (1) Image embedding. We add a trainable embedding to visual tokens for each image type. In comparison and reasoning tasks, distinct embeddings are assigned to the reference image, Image A, and Image B. For the description task, the embeddings for the reference image and Image A are added to the tokens of the reference images and distorted images, respectively. (2) Unique image projector. We utilize unique image projectors for varied image categories. These projectors are specifically initialized for the reference image, Image A, and Image B in comparison and reasoning tasks. In the description task, only projectors for the reference image and Image A are employed. The experimental results are illustrated in Tab. A3. The performance of image embedding and unique projector is obviously inferior to unique tag. We suspect that the reason could be that changing the visual tokens differently for various images may confuse the model.
| Method | Comparison | Reasoning |
|---|---|---|
| Image Embedding | 67.0 / 66.9 | 26.0 |
| Unique Projector | 75.1 / 77.2 | 40.0 |
| Unique Tag | 78.4 / 82.7 | 53.0 |
Comparison of global feature and local feature map. The ViT-L/14 image encoder produces a singular global feature token and a multi-token local feature map. Either can function as visual tokens of the MLLM. We analyze the performance differences between the global feature and local feature map in Tab. A4. The global feature demonstrates lesser effectiveness than the local feature map, particularly in reasoning tasks. This disparity might come from the global feature’s singular visual token, which restricts the amount of information conveyed.
| Comparison | Reasoning | |
|---|---|---|
| Global Feature | 76.7 / 80.8 | 34.0 |
| Local Feature Map | 78.4 / 82.7 | 53.0 |
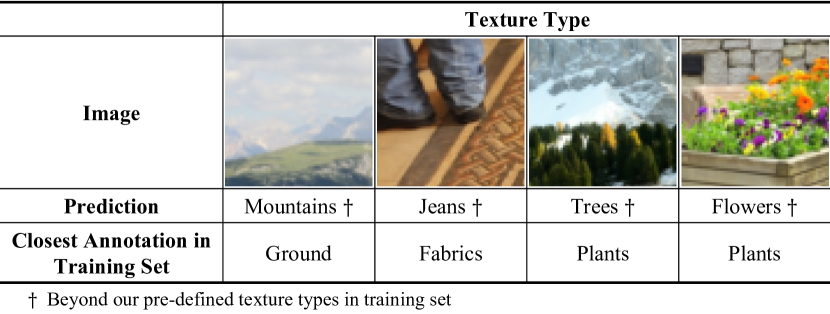
Impacts of content description data on texture diversity. Incorporating external content description data, specifically the Detailed Description Dataset in [53], stably enhances the performance, as discussed in the main paper. Training with content description data also enriches the diversity of texture types recognized, even beyond the pre-defined categories in our training set, as depicted in Fig. A6. For instance, in the last two examples in Fig. A6, though the texture types of “trees” and “flowers” are usually annotated as “plants” in the training set, we still correctly predict these fine-grained texture types.
Appendix E More Results
More quantitative results, qualitative results, and failure cases are presented in this section.
E.1 More Results of Quality Description
E.2 More Results of Quality Comparison
Consistency with the tendencies of human annotators. The ground-truth scores in the BAPPS dataset [55] represent the proportion of annotators favoring Image B. In the validation set of BAPPS, there are 5 annotators in total, so the value of the ground-truth score varies across [0, 0.2, 0.4, 0.6, 0.8, 1.0]. As shown in Tab. A5, when we exclude the samples with high label uncertainty in the BAPPS dataset, the comparison accuracy of our DepictQA improves significantly, indicating that our model behaves consistently with the tendencies of human annotators.
| Excluded Labels | |||
|---|---|---|---|
| Traditional | 78.4 | 84.7 | 90.2 |
| CNN | 82.7 | 88.4 | 93.3 |
| Average | 80.6 | 86.6 | 91.8 |
E.3 More Results of Comparison Reasoning
E.4 Failure Cases
Failure cases of DepictQA in quality description and comparison reasoning tasks are presented in Fig. A15. (1) Fig. A15a and A15b show DepictQA incorrectly identifying distortion types, leading to wrong quality assessments in the quality description task. (2) In Fig. A15c, DepictQA mistakenly attributes the noise in Image A to Image B, resulting in an incorrect comparison result. As reflected in Fig. 4 in the main paper, the unique tag approach does not completely resolve the confusion issue. (3) In Fig. A15d, DepictQA fails to recognize an unusual distortion (i.e., complete semantic content washout in Image B). This is primarily due to the absence of such distortions in the training set.
E.5 More Results of GPT-4V
Qualitative results of GPT-4V [33] in comparison reasoning task are shown in Fig. A16. GPT-4V gives quite detailed comparison reasoning results, which is the main reason for its excellent GPT4-score (see Tab. 4 in the main paper).
Failure cases of GPT-4V in comparison reasoning task are given in Fig. A17. Despite GPT-4V providing detailed reasoning texts, it mistakenly describes distortions, texture damages, and comparison results.
E.6 Extension
Potential to localize distorted regions. In Fig. A7, we visualize decoder attention weights between the texts that describe distortions and the visual tokens. Our model focuses on relevant regions containing text-described distortions. This invites our future research into precise distortion localization based on textual outputs.