Local Volume dwarf Cas I: gas metallicity, extinction and distance
Abstract
Cas I is a Local Volume (LV) dwarf irregular galaxy with a wide range of suggested distances. Tikhonov (2019), using the HST images and the Tip of Red Giant Branch (TRGB) method, places Cas I at = 1.60.1 Mpc. Besides, he estimates the stellar metallicity of Cas I at the level of z 0.0004 (or Z(stars) Z⊙/50). Such a nearby extremely low-metallicity dwarf, if real, would be a very valuable object for detailed studies. An alternative TRGB distance of Cas I, of 4.50.2 Mpc, based on the deeper HST images, was presented in the Extragalactic Distance Database (EDD). It places Cas I midway between groups of IC342 (D 3.3 Mpc) and Maffei1 and 2 (D 5.7 Mpc). We wish to check the suggested extremely low metallicity of Cas I, to improve the estimate of the large Milky Way (MW) extinction in its direction and to use this data to improve the distance estimate to Cas I. We use the SAO 6-m telescope (BTA) spectroscopy to estimate gas metallicity in two representative Hii regions in Cas I and to derive, via their observed Balmer decrements, the independent upper limit to the value of the MW extinction. We derive the values of 12+log(O/H) = 7.830.1 dex and 7.580.1 dex in two Hii regions of Cas I, which correspond to Z(gas) of 5–10 times higher than Z(stars) estimated for its resolved stars. The measured Balmer decrements in these Hii regions, result in the maximal MW extinction in this direction of AB = 3.060.14 mag in comparison to AB = 3.690.4 derived via the IR dust emission and is used in other estimates of the distance to Cas I. This reduces the original EDD distance till 4.1 Mpc. The relation of Berg et al. (2012) for the LV late-type galaxies, between their 12+log(O/H) and blue absolute magnitude, MB, is used to bracket MB for Cas I. This, in turn, allows one to get an independent estimate of the distance to Cas I, of 1.64 Mpc, albeit with the large 1 uncertainty of factor 2.17. The combination of the above distance estimates, accounting for their uncertainties, results in the most probable value of D3.65 Mpc, what favours Cas I to reside in the environs of IC342.
keywords:
galaxies: dwarf – galaxies: individual: Cas I (PGC100169 = KK019 = ZOAG129.56+07.09)– galaxies: evolution – galaxies: photometry – galaxies: abundances1 Introduction
The galaxy population of the Local Volume (LV) is one of the best studied thanks to its proximity and due to its importance as the benchmark sample for many extragalactic and near-field cosmology studies. We are especilly interested in the better understanding of the properties of the LV galaxies which reside in the Nearby Voids, that is are a subgroup of the Nearby Void Galaxy (NVG) sample from Pustilnik et al. (2019). The recent results of our probing the gas metallicity of the NVG sample galaxies are presented in papers of Pustilnik et al. (2020, 2021) and in Pustilnik et al (2023, MNRAS, in press). Eleven of these galaxies were found to be extremely ow-metallicity, with 12+log(O/H) 7.0 – 7.2 dex, or Z(gas) Z⊙/50 - - Z⊙/30.111We adopt the solar Oxygen abundance of 12+log(O/H) = 8.69 dex as in Asplund et al. (2009)
The LV dIrr galaxy Cas I, since its discovery in the Zone of Avoidence (ZoA) by Weinberger (1995), has a long story of its distance determination. The suggested estimates of the distance range from 0.8 to 4.5 Mpc (Tikhonov, 1996; Karachentsev et al., 1997; Weinberger & Suarer, 1998; Karachentsev et al., 2013; Tikhonov, 2019; Anand et al., 2021).
In the time, when we collected the NVG sample, Cas I was assigned to belong to the environs of the luminous spiral IC342 (Karachentsev et al., 2013), situated at the distance of 3.30.13 Mpc (Anand et al., 2021), and therefore did not enter to the NVG sample. After the NVG sample was published, Tikhonov (2019) presented an alternative distance of Cas I. Based on the Hubble Space Telescope (HST) Colour-Magnitude Diagram (CMD), he used the well-known Tip of Red Giant branch (TRGB) method to derive its distance of D=1.60.1 Mpc. While this distance appears substantially smaller than that of IC342 group, at this position Cas I falls to a rather isolated environment within the boundaries of the void No.8 (Ori-Tau) from the list of the nearby voids (Pustilnik et al., 2019).
Besides, via the fitting of the CMD with the theoretical stellar isochorones, Tikhonov (2019) finds the very low stellar metallicity in this galaxy, of z = 0.0004 – 0.0007 (or Z Z⊙/50 – Z⊙/30).
Our primary motivation was to clear up the issue of Cas I very low metallicity as possibly related to its assumed the low-density environment. Besides, Cas I is situated at the low galactic latitude of bII = +7.1° (in the ZoA), where estimates of the MW extinction have rather large uncertainties. The commonly accepted MW extinction is based on the paper by Schlafly & Finkbeiner (2011). This gives for Cas I the value of E = 0.900 mag. The related values of AB = 4.1E3.7 mag and A2.8 mag, have, according to Schlegel et al. (1998), the internal uncertainties of at least 10 per cent. That is, for the case of Cas I, (AB,AV) 0.3–0.4 mag.
This rather large uncertainty may affect the determination of Cas I global parameters and its distance. The only independent estimate of A2.5 mag (Weinberger & Suarer, 1998) is based on the Balmer decrement in one of Cas I Hii regions, derived from the observed flux ratio of only two lines, H and H. Therefore, the second task of this work was to obtain an independent upper limit of the MW extinction via the new measurement of Balmer decrement in two different Hii regions.
Meantime, the results of the recent HST imaging, about 1.5 mag deeper than the data used by Tikhonov (2019), were presented in the Extragalactic Distance Database (EDD)222https://edd.ifa.hawaii.edu/dfirst.php?. They give an alternative TRGB distance of 4.50.2 Mpc. Their estimate seems does not take into account the error of the adopted extinction in band, minimum of 0.15 mag, according to Schlegel et al. (1998).
The spectra of Hii regions allow one to obtain an independent estimate of the sight-line extinction via the observed Balmer decrement, and thus, to potentially improve the accuracy of the derived absolute magnitude and other affected parameters of Cas I. Therefore, the attempt to derive an independent estimate of the MW extinction with as high as possible accuracy appears rather actual. To this end, we obtained spectra of two Hii regions, seen in the available images of its H emission (Kaisin & Karachentsev, 2019) and also marked by Tikhonov (2019) on the HST images.
The rest of the paper is arranged as follows. In Sec. 2, the spectral observations and data reduction are outlined. In Sec. 3, the results of the analysis of the BTA spectra are presented. In Sec. 4, we discuss properties of the studied star-forming regions in Cas I, including their gas metallicity and extinction as well as the application of the reference relation of O/H(gas) versus MB from Berg et al. (2012). In Sec. 5 we summarize our results and conclude. The linear scale at the adopted distance to Cas I of 3.6 Mpc is 17.5 pc in 1 arcsec.
2 Observations and data processing
| Date | Grism | Expos. | Air | |
|---|---|---|---|---|
| time, s | arcsec | mass | ||
| 2023.10.22 | VPHG1200B | 4800 | 1.7 | 1.10 |
| 2023.10.22 | VPHG1200R | 2600 | 1.7 | 1.11 |
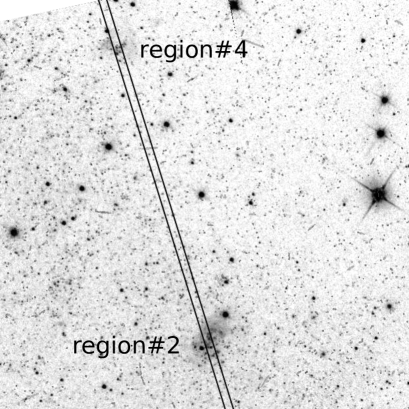
We obtained two optical spectra of Cas I with the BTA multimode instrument SCORPIO-1 (Afanasiev & Moiseev, 2005) during the night 2023 October 22, under photometric conditions and seeing of 1.7 arcsec (see Table 1). The long slit with the length of 6 arcmin and width of 1.2 arcsec, with the scale along the slit of 0.36 arcsec pixel-1 (after binning by 2) was positioned on the Cas I Hii region 2 (in the nomenclature of Tikhonov (2019)).
To minimize the light loss due to the differential atmospheric refraction (e.g. Filippenko, 1982), the position andgle (PA) of the slit is recommended to keep close to the direction of atmosperic refraction, that is close to the parallactic position angle, PApar. We observed Cas I near the meridian, so that the average PApar during observations was –7°. The air masses during the time of this observation was rather small: of 1.10–1.11. Therefore, the relatively small difference of the real PA and that of PApar should give the negligible effect on the resulting relative line fluxes.
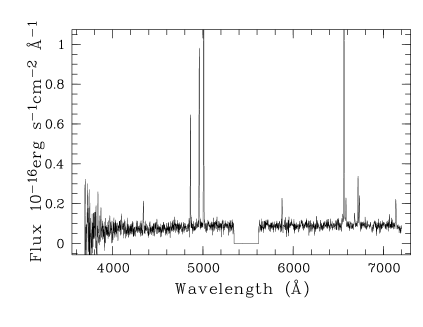
With these estimates in hand, we put the slit PA = 17.2° so that the slit crossed another relatively bright Hii region of Cas I, namely 4 at 50 arcsec to the NE. See Fig. 1 with the slit position superimposed on the HST F606W image, taken from the EDD data base. The grisms VPHG1200B and VPHG1200R with the 2K2K CCD detector E2V 42-40 (13.513.5 m pixel) provided the spectrum coverage of 3650–5450 Å and 5700–7500 Å, respectively, with the spectral resolution of FWHM 5.5 Å. We obtained spectra with both grisms at the same slit position and under the similar conditions.
Due to a bit different value of seeing, one expects the related different light loss on the slit for blue and red grisms. Indeed, we found that the continuum level in the red part of spectrum runs a bit higher than its continuation from the ’yellow’ edge. To eliminate, at first approximation, this difference between the two parts of the spectrum, before to combine both parts, we multiply the red part fluxes by a factor of 0.89.
The main procedures of the data reduction are described in Pustilnik et al. (2016). Here we briefly outline them. Our standard pipeline with the use of IRAF333IRAF: the Image Reduction and Analysis Facility is distributed by the National Optical Astronomy Observatory, which is operated by the Association of Universities for Research in Astronomy, Inc. (AURA) under cooperative agreement with the National Science Foundation (NSF). and MIDAS444MIDAS is an acronym for the European Southern Observatory package – Munich Image Data Analysis System. was applied for reduction of the long-slit spectra. It includes the following steps: removal of cosmic ray hits, bias subtraction, flat-field correction, wavelength calibration, night-sky background subtraction. Spectrophotometric standard star BD+28°4211, observed before Cas I, was used for the flux calibration.
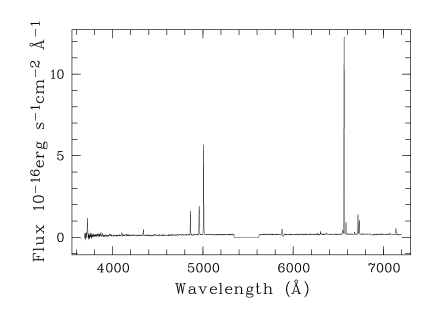
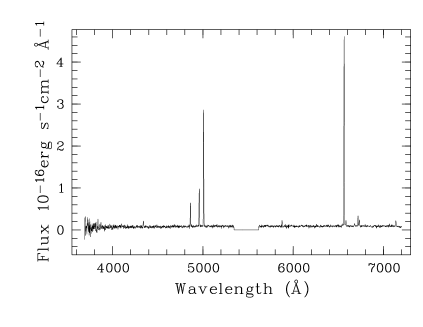
In the resulting 2d spectra with both grisms, the main bright emission lines in both Hii regions, 2 and 4, are well seen. The 1d spectra of these regions were extracted, summing up 21 pixels (7.5 arcsec) and 19 pixels (6.8 arcsec), respectively, without weights, centred on the maximum of the H line signal.
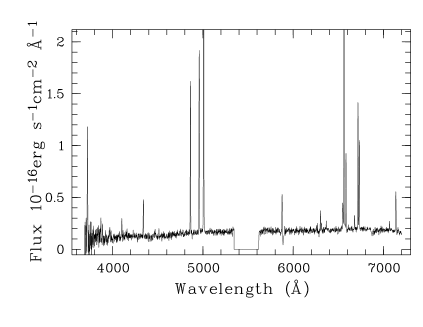
The resulting 1d spectra are shown in the top and bottom (close-up to show the level of continuum and the faint emission lines) panels of Fig. 2 for region 2 and Fig. 3 – for 4.
| Region | 2 | 4 | ||
|---|---|---|---|---|
| (Å) Ion | F()/F(H) | I()/I(H) | F()/F(H) | I()/I(H) |
| 3727 [O ii] | 0.8680.055 | 1.9940.142 | 0.3170.086 | 0.6700.205 |
| 4101 H | 0.1010.010 | 0.2950.051 | 0.1080.019 | 0.3040.070 |
| 4340 H | 0.2680.036 | 0.4570.071 | 0.2580.023 | 0.4470.049 |
| 4861 H | 1.0000.033 | 1.0000.038 | 1.0000.042 | 1.0000.049 |
| 4959 [O iii] | 1.2220.038 | 1.0480.037 | 1.5480.059 | 1.3220.057 |
| 5007 [O iii] | 3.8310.203 | 3.1790.100 | 4.7390.164 | 3.9270.153 |
| 5876 He i | 0.2220.009 | 0.1080.005 | 0.1880.017 | 0.0950.010 |
| 6300 [O i] | 0.0940.007 | 0.0370.003 | 0.0430.018 | 0.0170.007 |
| 6312 [Siii] | 0.0420.006 | 0.0160.002 | … | … |
| 6548 [N ii] | 0.1700.029 | 0.0580.011 | 0.0830.065 | 0.0310.027 |
| 6563 H | 8.1890.200 | 2.8270.084 | 7.5080.244 | 2.7880.111 |
| 6584 [N ii] | 0.5120.034 | 0.1730.013 | 0.2610.073 | 0.0950.030 |
| 6678 He i | 0.0890.006 | 0.0290.002 | 0.1400.019 | 0.0490.008 |
| 6717 [S ii] | 0.8190.027 | 0.2670.009 | 0.3860.020 | 0.1350.007 |
| 6731 [S ii] | 0.5630.018 | 0.1830.006 | 0.2670.019 | 0.0930.007 |
| 7136 [Ar iii] | 0.2700.010 | 0.0720.003 | 0.2500.018 | 0.0720.006 |
| C(H) dex | 1.2950.032 | 1.1900.042 | ||
| EW(abs) Å | 4.900.60 | 4.550.63 | ||
| F(H)a | 8.990.19 | 3.720.11 | ||
| EW(H) Å | 54.851.30 | 45.511.40 | ||
| Rad. vel. km s-1 | 2012 | 286 | ||
| (OIII)(K) | 144111169 | 172301339 | ||
| (OII)(K) | 13584678 | 14734316 | ||
| (SIII)(K) | 140181252 | 166041022 | ||
| (SII)(cm-3) | 1010 | 1010 | ||
| O+/H+(105) | 2.4870.452 | 0.6430.210 | ||
| O++/H+(105) | 3.8610.818 | 3.1050.558 | ||
| O/H(105) | 6.3480.935 | 3.7480.596 | ||
| 12+log(O/H)(mse,c) | 7.810.12 | 7.590.12 | ||
| 12+log(O/H)(PT05) | 7.850.10 | 7.560.10 | ||
| a in units of 10-16 ergs s-1cm-2. | ||||
3 Results
3.1 Emission line parameters
The results of emission line measurements and analysis for the both spectra are presented in Table 2. In the left column we give the measured line fluxes relative to that of H. In the right column we give the relative line intensities corrected for the extinction and the underlying Balmer line absorbtion in the stellar continuum of the both Hii regions. The latter procedure is performed by the method described in Izotov et al. (1994), via variation of both C(H) and EW(abs) in the wide ranges and finding the best combination of the two parameters for a given electron temperature Te. Then, with several iterations of Te, the best combination Te, C(H) and EW(abs) is found that reproduces the theoretical intensities of Balmer emissions in Case B recombination, in terms of minimum of .
We recall that in further we assume the two-zone model of an Hii region as described by Stasińska (e.g. 1990); Izotov et al. (e.g. 1994).
Since the faint temperature-sensitive auroral line [Oiii]4363 is not detected in our spectra, we can not use the direct method of determination of Te. Therefore, we employ the modified (see below) semi-empirical method of Izotov & Thuan (2007) and the empirical method Pilyugin & Thuan (2005) to derive the parameter 12+log(O/H) from the available line intensities.
The semi-empirical method of Izotov & Thuan (2007) is based on the emprical relation between Te and the parameter R23. The latter is the ratio of [I([Oii]3727) + I([Oiii]4959) + I([Oiii]5007)]/I(H). In this method, on the first step the parameter Te is estimated via parameter R23, and then O/H is calculated with this Te as in the classical direct method (e.g. Izotov et al., 2006).
We revised the method of Izotov & Thuan (2007) in Pustilnik et al. (2021) to account for the substantial dependence of the derived Te on the excitation parameter O32. The latter is defined as the ratio of line fluxes I([Oiii]5007)/I([Oii]3727). This modified semi-empirical method (called hereafter ’mse’) is applicable in the range of 12+log(O/H) 7.0–8.1 dex. Its internal scatter (log(O/H),mse) = 0.09 dex.
The second method is the well known empirical method of Pilyugin & Thuan (2005). It uses both parameters R23 and P, the analog of the above excitation parameter O32. Their parameter P is defined as P = R3/R23, where R3 = [I([Oiii]4959)+I([Oiii]5007)]/I(H). In terms of O32, we can write P = O32/(0.75+O32). The internal scatter of the Pilyugin & Thuan (2005) method is 0.1 dex. We use their formula (24) for the so-called lower branch, what is valid for the range of 12+log(O/H) 8.2 dex. The method is well calibrated for the range of P = 0.55–0.97. Our case, with P 0.68 and 0.89, and 12+log(O/H) 7.6 – 7.8 dex, corresponds well to these limitations.
One of the by-products of the Hii spectrum analysis is the independent determination of the extinction inherent to the studied regions. The derived values of C(H) are 1.2950.032 and 1.1900.042, for regions 2 and 4, respectively. Since they are close within their uncertainties, we adopt the average C(H)mean = 1.250.05. Then, using the well-known relation between C(H) and the colour excess: = 0.68 C(H), we obtain = 0.85 0.034. Then, from the relation of AB = 4.1 , we obtain AB = 3.48 0.14 mag and AV = 2.64 0.11 mag. The latter value of AB is somewhat smaller than AB,MW = 3.690.37 mag, related to the Milky Way extinction in this direction according to Schlafly & Finkbeiner (2011). However, the two values are consistent within the cited uncertainties.
It is worth mentioning the value of extinction in Hii region 2, derived by Weinberger & Suarer (1998). From the ratio of line fluxes of H and H, they derive the value of AV = 2.5. Judging from the S-to-N in the H line, the probable error of their AV is at least 5 per cent, or 0.12 mag. Their AV is somewhat smaller than our, but is consistent with our AV = 2.64 mag within one combined error of 0.15 mag.
Thus, summarising, our estimate of extinction in the direction of Cas I, based on the Balmer decrement in two Hii regions, is midway between the two independent estimates via the dust emission (Schlafly & Finkbeiner, 2011) and via the Balmer decrement in the same Hii region 2 (Weinberger & Suarer, 1998). Having in mind that our estimate of AB has the error of at least 2.5 times smaller than AB, predicted in paper by Schlafly & Finkbeiner (2011), we will use in further discussion AB = 3.48 0.14 mag and the related extinction in other bands.
| Property | Value | Refs |
|---|---|---|
| RA (J2000) | 02 06 05.39 | 2 |
| Dec (J2000) | +62 00 12 | 2 |
| Rad. velocity (2,4), km s-1 | 325 | 1 |
| Rad. velocity (Hi), km s-1 | 351 | 2 |
| , Mpc | 3.65 | 1 |
| (Tikhonov 2019), Mpc | 1.60.1 | 3 |
| (EDD, original), Mpc | 4.510.22 | 4 |
| (EDD, corrected), Mpc | 4.110.36 | 1 |
| B (mag) | 15.30 | 2 |
| AB (mag) | 3.690.37 | 5 |
| AB(Balmer) (mag) | 3.480.14 | 1 |
| AB(Balmer, corrected) (mag) | 3.200.14 | 1 |
| 12+log(O/H)(2) | 7.830.10 | 1 |
| 12+log(O/H)(4) | 7.590.10 | 1 |
| 12+log(O/H)(aver.2,4) | 7.710.10 | 1 |
| (mag)(12+log(O/H)=7.71) | –13.441.68 | 1 |
| (mag arcsec2) | 23.3 | 2 |
| S(Hi) (Jy km s-1) | 50.0 | 2 |
| M(Hi) (in 107 M⊙) | 16.1(D/3.7)2 | 1 |
| M(Hi)/LB (M⊙/L⊙) | 0.53 | 1 |
| 1. This work 2. Karachentsev et al. (2013) and its update: https://www.sao.ru/lv/lvgdb. 3. Tikhonov (2019) 4. http://edd.ifa.hawaii.edu 5. The Milky Way extinction after Schlafly & Finkbeiner (2011). | ||
4 Discussion
4.1 Environment
The dwarf galaxy Cas I resides rather close in projection to two massive galaxies, IC342 at the angular distance of 5° and Maffei1 (PGC009892) at 3.5°. The differences of their heliocentric velocities are also rather small, of 48 km s-1 and 31 km s-1, respectively. Groups of IC342 and Maffei1/Maffei2 are currently considered as the different aggregates with the distance of IC342 of 3.3 Mpc (Anand et al., 2021) and the distance of Maffei1/Maffei2 of 5.73 Mpc. The latter distance was first revised by Tikhonov, Galazutdinova (2015) and later was corrected by Anand et al. (2019). Giving this information, we can consider in principle both options of the distance to Cas I. If Cas I is situated at the distance close to that of IC342, its projected distance to IC342 correponds to 0.29 Mpc. If, alternatively, it is situated closer to Maffei1, the respective projected distance is 0.35 Mpc.
Thus, if we use only celestial coordinates and the radial velocity of Cas I, based on the probable membership in groups of either IC342, or of Maffei1/Maffei2, we expect its distance to be close either to 3.3 or to 5.7 Mpc. On the other hand, there are two descripant direct distance determinations via the TRGB method: D = 1.60.1 Mpc (Tikhonov, 2019) and 4.50.20 Mpc (EDD), which fall well outside of the environs of these aggregates. In Sections 4.2, 4.3, we use our estimate of gas O/H in Cas I and the improved estimates of the MW extinction in order to add arguments in favour some of these variants.
4.2 Gas metallicity versus the global parameters and the expected MB
The gas metallicity of late-type galaxies in the LV follows the trend described by the relation of ’O/H versus MB’ from Berg et al. (2012). See its illustration in Fig. LABEL:fig:ZvsL_Cas1. The respective linear regression reads as 12+log(O/H) = 6.272 – 0.107 MB, with the rms scatter of log(O/H) of 0.15 dex. It extends over the range of MB = [–9.0,–19.0]. The great majority of this LV reference sample belongs to typical groups and their close environs. As shown in Pustilnik et al. (2016, 2021), the late-type dwarfs in the nearby voids have, on average, the reduced values of log(O/H) by 0.14 dex (or by 30 percent, with the rms scatter of 0.18 dex) relative to this reference relation. This finding was interpreted as an evidence of the slower galaxy evolution in voids. Consistently with this idea, void galaxies have also the elevated Hi content, on average by 40 percent (Pustilnik, Martin, 2016).
As mentioned in Introduction, Cas I did not fall within the nearby voids defined in Pustilnik et al. (2019). However, if it would be situated at D = 1.6 Mpc, it should be a void object and one could expect its reduced metallicity. In any case, we expect that the above relation of Berg et al. (2012) is applicable to Cas I at first approximation. Thus, having its gas O/H with a good accuracy, we can get an estimate of the most probable range of its MB. Adopting the average metallicity of two Hii regions as 12+log(O/H) = 7.710.10 dex, we derive the expected value of MB = –13.44 1.68 mag. The latter uncertainty accounts for the r.m.s. scatter of the above Berg et al. (2012) relation (0.15 dex) and the accuracy of the derived average O/H in Cas I.
4.3 Implications for the distance of Cas I
In the further estimate we use the most probable range of the absolute blue magnitude corresponding to the gas metallicity of Cas I from the previous section. To derive its distance modulus and the respective distance, we adopt its total blue magnitude Btot = 15.30, as in Table 3. Then, the corrected for the Milky Way extinction, with the adopted AB = 3.480.16 mag, Btot,c it equal to 11.82 0.16 mag. The respective distance modulus (m–M) = 11.82 + 13.44 = 25.261.68 mag. This m–M corresponds to the distance derived from the relation of Berg et al. (2012), D(O/H) = 1.27 Mpc. The large 1 uncertainty in m–M corresponds to a large uncertainty of D(O/H) by a factor of 2.17. That is the range 1=1.68 mag in m–M, corresponds to the range of D(O/H) from 0.58 to 2.75 Mpc. Thus, despite the gas metallicity of Cas I allows a very wide range of its probable distance, this can provide the additional arguments for the choice between the various distance options.
First, this metallicity-based distance, D(O/H), is too hard to agree with the distance of 5.7 Mpc to the Maffei 1,2 group. Second, we adopt that the recent EDD determination of the Tip of RGB in -band, mI(TRGB) = 25.75, due to its deepness, is much more reliable than that of Tikhonov (2019). We also adopt as a first approximation, the corrected MW extinction, derived in this work from the Balmer decrement (AB = 3.480.14). This implies the reduced extinction AI = 1.447 in comparison to the EDD value of 1.532. This difference of 0.085 mag transforms to the reduction by 4.2 percent of DTRGB(EDD) =4.51 Mpc. That is an improved estimate of the MW extinction gives an independent estimate of DTRGB = 4.320.39 Mpc.
However, the latter value of AB = 3.48 mag should be treated as a strict upper limit, since it does not account for the internal extinction in the studied Hii regions. The internal extinction in extragalactic Hii regions is commonly not large, typically of C(H)0.2 (e.g. Guseva et al., 2017). If we adopt for the two Hii regions in Cas I, a median internal C(H)0.1 (as in Guseva et al., 2017), we need to further reduce the measured above C(H)=1.25 by 0.10, or by 8 per cent of this C(H), in order to treat this as a purely MW extinction. This changes the adopted above value AI = 1.447 mag, to the new one of 1.340 mag, that is by 0.107 mag smaller. This further reduces the DTRGB = 4.32 by 5 per cent. Thus, the doubly corrected original DTRGB(EDD)=4.51 Mpc transforms to 4.110.36 Mpc. This correction also applies to AB, resulting in the value of 3.20 mag. This reduces the corrected Btot,c to 13.100.16 and increases the parameter m–M to 25.54 mag. So that the related distance D(O/H) shifts to 1.64 Mpc.
Summarizing, we arrive to two independent distance estimates of Cas I, DTRGB = 4.110.36 Mpc and D(O/H) = 1.64 Mpc, with 1 uncertainty of factor of 2.17. In the probabilistic approach, they can be consistent each to other, if the real value of D(Cas I) is somewhere midway with the account of the strongly different 1 error for the two methods. Namely, the values of D(O/H) 1 = 3.56 Mpc, and DTRGB – 1 = 3.75 Mpc are very close. So that, at the first approximation, albeit with some tension, D(Cas I) 3.65 Mpc will be the best match to the both independent estimates of this parameter. This naturally assigns Cas I to the environs of IC342.
In Table 3 we summarise the basic parameters of Cas I as well as parameters, discussed in the paper, that allows to catch them in one glimps.
5 Summary and conclusions
Summarising the data, analysis, and discussion presented above, we arrive at the following conclusions.
-
1.
We conducted BTA spectroscopy of two Hii regions in the LV dIrr galaxy Cas I (2 and 4 from Tikhonov (2019)) and measured their Oxygen abundance of 12+log(O/H) = 7.83 and 7.590.10 dex, respectively. Their average of 12+log(O/H) = 7.71 correponds to the gas metallicity of Z(gas) Z⊙/10, a factor of 3–5 higher than the extremely low metallicity of stars as estimated by Tikhonov (2019), Z(stars) 0.02–0.03 Z⊙.
-
2.
We use the observed Balmer decrement in the obtained spectra to address the issue of the large MW extinction. The total extinction, derived via Balmer decrement, is qualitatively consistent but somewhat smaller and of the higher accuracy than the large extinction derived via the dust IR emission by Schlegel et al. (1998); Schlafly & Finkbeiner (2011). We then additionally account for a small internal extinction typical of Hii regions C(H)(Hii) 0.10, of AB(Hii) 0.28 mag. This finally results in AB(Balmer) = 3.060.14 versus AB(dust)=3.690.4, about 20 per cent lower than adopted for the distance estimate in EDD. This way improved estimate of the MW extinction is applied to correct the distance of Cas I derived via the TRGB method. This re-evaluation of the MW extinction results in the reduction of D(TRGB) to Cas I from 4.51 to 4.110.36 Mpc.
-
3.
Gas metallicity in the LV late-type galaxies, according to Berg et al. (2012), is rather tightly related to their luminosity and mass. We use the derived estimate of O/H in Cas I to bracket its blue absolute magnitude using the reference relation of 12+log(O/H) versus MB from Berg et al. (2012). This gives us MB(Cas I) = –13.441.68 mag. Having the total apparent Btot, one obtains an independent estimate of the distance modulus (m–M), and the related distance to Cas I, D(O/H) 1.64 Mpc, with the 1 uncertainty of multiplication factor 2.17.
-
4.
Both distance estimates, D(TRGB) = 4.110.2 Mpc and D(O/H) = 1.64 Mpc, can be consistent each to other with a small tension (with 1 downward and upward, respectively), at the average of D(Cas I) 3.65 Mpc. The latter distance estimate clearly favours the hypothesis on Cas I to reside in the environs of IC342.
Acknowledgements
The reported study was funded by Russian Science Foundation according to the research project 22-22-00654. The authors thank N.A. Tikhonov for sharing his results on very low metallicity of stars in Cas I prior publication. Observations with the SAO RAS telescopes are supported by the Ministry of Science and Higher Education of the Russian Federation. The renovation of telescope equipment is currently provided within the national project ”Science and Universities”. This research is partly based on observations made with the NASA/ESA Hubble Space Telescope obtained from the Space Telescope Science Institute, which is operated by the Association of Universities for Research in Astronomy, Inc., under NASA contract NAS 5-26555. These observations are associated with program SNAP-15922. We acknowledge the use for this work of the database HyperLEDA555http://leda.univ-lyon1.fr. This research has made use of the NASA/IPAC Extragalactic Database (NED) which is operated by the Jet Propulsion Laboratory, California Institute of Technology, under contract with the National Aeronautics and Space Administration.
Data availability
The HST/ACS data used in this article are available in the STScI data archive.
References
- Afanasiev & Moiseev (2005) Afanasiev V.L., Moiseev A.V., 2005, Astron. Lett., 31, 193
- Anand et al. (2019) Anand G.S., Tully R.B., Rizzi L., Karachentsev I.D., 2019, ApJ Letters, 872, L4
- Anand et al. (2021) Anand G.S., Rizzi L., Tully R.B. et al. 2021, AJ, 162, 80
- Asplund et al. (2009) Asplund M., Grevesse N., Sauval A.J. Scott P., 2009, Ann.Rev.Astron.Astrophys., 47, 481
- Berg et al. (2012) Berg D.A., Skillman E., Marble A. et al. 2012, ApJ, 754, 98
- Filippenko (1982) Filippenko A.V., 1982, PASP, 94, 715
- Guseva et al. (2017) Guseva N.G., Izotov Y.I., Fricke K.J., Henkel C., 2017, A&A, 599, A65
- Izotov et al. (1994) Izotov Y.I., Thuan T.X., Lipovetsky V.A., 1994, ApJ, 435, 647
- Izotov et al. (2006) Izotov Y.I., Stasińska G., Meynet G., et al., 2006, A&A, 448, 955
- Izotov & Thuan (2007) Izotov Y.I., Thuan T.X., 2007, ApJ, 665, 1115
- Kaisin & Karachentsev (2019) Kaisin S.S., Karachentsev I.D., 2019, Astropys.Bull., 74, 1
- Karachentsev et al. (1997) Karachentsev I., Drozdovsky I., Kaisin S., Takalo L.O., Heinamaki P., Valtonen M., 1997, A&AS, 124, 559
- Karachentsev et al. (2013) Karachentsev I.D., Makarov D.I., Kaisina E.I., 2013, AJ, 145, 101
- Pilyugin & Thuan (2005) Pilyugin L.S., Thuan T.X., 2005, ApJ, 631, 231
- Pustilnik, Martin (2016) Pustilnik S.A., Martin J.-M., 2016, A&A, 596, A86
- Pustilnik et al. (2016) Pustilnik S.A., Perepelitsyna Y.A., Kniazev A.Y., 2016, MNRAS, 463, 670
- Pustilnik et al. (2019) Pustilnik S.A., Tepliakova A.L., Makarov D.I., 2019, MNRAS, 482, 4329
- Pustilnik et al. (2020) Pustilnik S.A., Kniazev A.Y., Perepelitsyna Y.A., Egorova E.S., 2020, MNRAS, 493, 830
- Pustilnik et al. (2021) Pustilnik S.A., Egorova E.S., Kniazev A.Y., Perepelitsyna Y.A., Tepliakova A.L., Burenkov A.N., Oparin D.V., 2021, MNRAS, 507, 944
- Schlafly & Finkbeiner (2011) Schlafly E.F., Finkbeiner D.P., 2011, ApJ, 737, 103
- Schlegel et al. (1998) Schlegel D.J., Finkbeiner D.P., Douglas M., 1998, ApJ, 500, 525
- Stasińska (1990) Stasińska G., 1990, A&AS, 83, 501
- Tikhonov (1996) Tikhonov N.A., 1996, Astronomische Nachrichten, 317, 175
- Tikhonov, Galazutdinova (2015) Tikhonov N.A., Galazutdinova O.A., 2015, Astropysical Bulletin, 73, 279
- Tikhonov (2019) Tikhonov N.A., 2019, Astropysical Bulletin, 74, 396
- Weinberger (1995) Weinberger R., 1995, PASP, 107, 58
- Weinberger & Suarer (1998) Weinberger R., Suarer W., 1998, A&A, 332, 523-525