Precise Mass Measurements of Isobars with the Canadian Penning Trap: Resolving the anomaly at 133Te
Abstract
We report precision mass measurements of 133Sb, 133g,mTe, and 133g,mI, produced at CARIBU at Argonne National Laboratory’s ATLAS facility and measured using the Canadian Penning Trap mass spectrometer. These masses clarify an anomaly in the 133Te -decay. The masses reported in the 2020 Atomic Mass Evaluation (M. Wang et al., 2021) produce Te)=2920(6) keV; however, the highest-lying 133I level populated in this decay is observed at keV, resulting in an anomalous keV. Our new measurements give keV, a factor of five more precise, yielding keV, a 3 shift from the previous results. This resolves the anomaly and indicates the possibility of an ultralow -value decay in this system.
[1]organization=Physics Division, Argonne National Laboratory, city=Lemont, state=Illinois, postcode=60439, country=USA
[2]organization=Department of Physics and Astronomy, University of Manitoba, city=Winnipeg, state=Manitoba, postcode=R3T 2N2, country=Canada
[3]organization=Department of Physics and Astronomy, University of Notre Dame, city=Notre Dame, state=Indiana, postcode=46556, country=USA
[4]organization=Nuclear and Chemical Sciences Division, Lawrence Livermore National Laboratory, city=Livermore, state=California, postcode=94550, country=USA
[5]organization=Nuclear Science Division, Lawrence Berkeley National Laboratory, city=Berkeley, state=California, postcode=94720, country=USA
[6]organization=Department of Physics, University of Chicago, city=Chicago, state=Illinois, postcode=60637, country=USA
1 Introduction
Mass is a basic property of the atomic nucleus and can be measured with high-precision by various mass-spectrometry techniques [1]. Nuclear masses give direct access to the binding energy in a given nucleus and to the energy available for a given nuclear reaction. Thus, nuclear masses are important for understanding many nuclear structure and reaction phenomena, including the origin of the elements in the universe.
In radioactive decay, the masses of the parent and daughter nuclei determine the maximum decay energy, the so-called value, which restricts the energy window available for the decay to proceed.
Often, excited energy levels () are populated in the daughter nuclei and these can be near . Conservation of energy dictates that for populated levels, . This can result in relatively low effective values of . Such decays are of interest to neutrino physics research, as low value decays have enhanced sensitivity to non-zero neutrino masses and the current most stringent limits on the neutrino mass come from the lowest ground-state-to-ground-state decays [2]. Ultralow value decays, those to excited states where keV, are possible, and are of interest to neutrino physics research and to the study of atomic interference effects in the nuclear decay processes [3, 4]. Promising candidates, such as 115In [5, 6, 7], 159Dy [8], and 131I [9] have been identified.
An unusual case of such decays occurs in the decay of the 133gTe ground state (Iπ=3/2+, T1/2=12.5(3) min [10]). According to the 2020 edition of the Atomic Mass Evaluation (AME2020), Te)=2920(6) keV [11]. However, the highest-lying level in the daughter nucleus 133I populated in this decay is observed at =2935.83(15) keV [12, 13], which results in anomalous keV. A schematic diagram of this decay can be seen in Fig. 1. Such an nonphysical result must come from either an incorrect decay scheme or from inaccurate mass data used in the determination of .

The 2935.83(15) keV level is assigned I in Ref. [12] and it is associated with the decay of the low-spin 133gTe ground state [12, 13]. The known -decaying isomer in 133mTe (Iπ=11/2-, T1/2=55.4 (5) min, Em=334.26 (4) keV [10]) decays to relatively high-spin (I=9/2, 11/2 or 13/2) levels in 133I where the last one is located at 3051.30 (8) keV [14, 12].
The AME2020 value for 133gTe is primarily derived from the masses of 133gTe and 133gI measured using Penning traps and the time-of-flight ion-cyclotron-resonance (TOF-ICR) technique by Hakala et al. [15] (93% significance) and Van Schelt et. al. [16] (84% significance), respectively. It should be noted, however, that the mass of 133gTe reported by Hakala et al. [15] is 38(7) keV smaller than that reported by Van Schelt et al. [16]. Given the inconsistency between the decay spectroscopy and mass spectrometry data, the disagreement between the different mass measurements (see Table 1), and the improvement in precision in Penning trap mass spectrometry through the rise of the phase imaging ion-cyclotron-resonance (PI-ICR) technique [17] facilitating the separation of isomeric states since these mass measurements were taken, new measurements of both masses are needed to resolve the anomaly.
2 Experimental Setup and Analysis
In this Letter, we report new mass measurements for three neutron-rich isobars produced at the CAlifornium Rare Isotope Breeder Upgrade (CARIBU) [18, 19] at Argonne National Laboratory’s ATLAS facility and then measured using the Canadian Penning Trap mass spectrometer (CPT) [20]. Beam production at CARIBU begins with the spontaneous fissioning of a Ci source; fission fragments were slowed with a thin gold foil and then stopped in a helium-filled large-volume gas catcher. Preliminary separation is accomplished using a high-resolution coupled-magnetic-dipole mass separator [21], which for this experiment were tuned for , producing a beam with , , and as the primary components. This continuous beam from the gas catcher was injected into a radiofrequency quadrupole (RFQ) cooler-buncher where the emittance and energy spread of the ions was reduced through collisions with moderate-pressure high-purity helium gas. The ions were then accumulated and released in bunches every 50 ms. These bunches were injected into a multi-reflection time-of-flight mass separator (MR-TOF) [22] for approximately 14.5 ms, allowing for the separation of individual species of the ions of interest from isobaric contaminants with a resolving power using a Bradbury-Nielsen gate after the MR-TOF exit. Stable beams of , which was used as the calibrant for all three isotopes of interest, were produced using the CPT’s Stable Ion Source, a thermal alkali source located upstream of the CPT tower. Both of these low-energy beams were delivered to the CPT experimental setup, where they are first captured and further cooled in a linear RFQ trap before being injected into the CPT.
Once captured in the Penning trap, the PI-ICR technique [17] was used to conduct a direct mass measurement. A detailed description of the identification and measurement scheme as implemented at the CPT can be found in Ref. [23], but in brief, the cyclotron frequency () of an ion is determined through a simultaneous measurement of the reduced cyclotron frequency and the magnetron frequency. This is done through two classes of measurement for a fixed total time in the trap. First, a measurement of a reference phase where only magnetron motion is accumulated during the time in the trap. Subsequently, a final phase measurement is conducted, where reduced cyclotron motion is allowed to accumulate for some time and then the motion is converted to magnetron motion which then accumulates for the rest of the time in the trap. The cyclotron frequency can then be determined by:
| (1) |
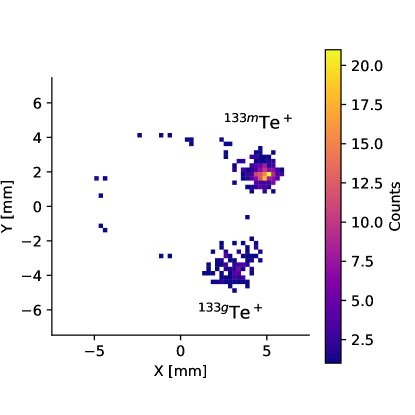
where is the measured difference between the final and reference phase, and is the number of complete revolutions the ion undergoes in . After several shorter , from single to hundreds of ms, are used to identify all beam components, including isomeric states, a longer measurement is done to produce a final measurement, following the techniques described by Ref. [23] to minimize potential systematic uncertainties. A sample result for a final phase measurement for ms of with all the visible beam components identified can be seen in Fig. 2; spots were then clustered and analyzed using a Gaussian mixture model code [24].
As the ions of interest and the calibrant were isobaric, this eliminates most potential sources of systematic uncertainties. One remaining source of error is in the reference phase measurement, from the small but different accumulation of mass-dependent phase during the excitation period for the ground and isomeric states. This is corrected by following the method described in Ref. [23], following an iterative process where this correction is recalculated based on the newly-calculated cyclotron frequency until the change in the correction is more than an order of magnitude smaller than the statistical uncertainty; for these data, this correction was smaller that a part in .
| Present work | Literature values, [keV] | ||||||
|---|---|---|---|---|---|---|---|
| Nuclide | Iπa) | T1/2a) | ME [keV] | MEa,b) | MEc) | MEe) | |
| (7/2+) | 2.34 (5) m | 1.000073910 (9) | -78 920.9 (11) | -78 924 (3) | -78 921.3 (76) | -78 921.0 (40) | |
| 3/2+# | 12.5 (3) m | 1.000041494 (6) | -82 934.0 (7) | -82 937.1 (21) | -82 899.8 (65) | -82 938.2 (22) | |
| (11/2-) | 55.4 (5) m | 1.000044209 (6) | -82 597.8 (7) | -82 602.8 (21) | -82 599.1 (24)d) | -82 595.8 (24)f) | |
| 7/2+ | 20.83 (8) h | 1.000017788 (7) | -85 868.7 (9) | -85 857 (6) | -85 858.2 (64) | ||
| (19/2-) | 9 (2) s | 1.000031003 (46) | -84 232.8 (57) | -84 223 (6) | |||
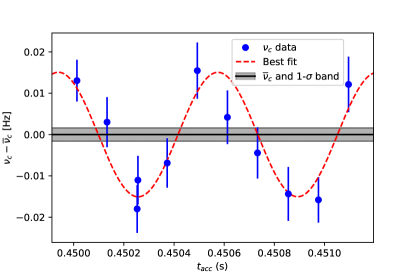
As discussed in Ref. [23], the most evident systematic effect is a clear -dependence to the measured that is described as a sinusoidal oscillation at the magnetron frequency around the true ; because of this, measurements of the were taken across approximately one and a half magnetron periods and fit with the model described in Ref. [23] to produce the true . For the case of low-yield two measurements were taken at a half-magnetron-period of difference and a weighted average was calculated instead. A sample plot of the eleven final phase measurements of with between 450.013 ms and 451.096 ms and the fit for the true cyclotron frequency can be seen in Fig. 3. Additional possible systematic uncertainties associated with temporal instabilities in the magnetic field, the electric field in the Penning trap, ion-ion interactions, and the non-circular final projection of the phase have been studied [27] and determined to have a cumulative effect smaller than 4 parts in ; this was added in quadrature.
To determine the mass of isotope , the magnetic field strength was then calibrated with the well-known mass of [11], and then the ratio of these two frequencies is used,
| (2) |
where is the electron mass. A summary of masses measured in this work and a comparison with previously measured values is presented in Table 1.
3 Results
3.1 133Sb
The result for 133Sb is in very good agreement with the Penning trap measured masses by Hakala et al. [15] and Van Schelt et al. [16], as well as with the recommended AME2020 value, but it is better than a factor of two more precise. Due to its shorter half-life, the 16.54(19) s isomeric state in 133Sb [10] could not be seen.
3.2 133g,mTe
The mass excess of 133gTe has a tension with the value reported by Hakala et al. [15] and it is in a severe disagreement with the previous CPT result by Van Schelt et al. [16]. The present value for the 133mTe isomer is in good agreement with the direct mass measurement of this state by Kankainen et al. [26] and with the previous CPT result by Van Schelt et al. [25] but is a factor of three more precise. For production of 133Te from a spontaneously-fissioning 252Cf source, we observed that the higher-spin isomeric state was more abundant than the ground state, which could explain why previous results are in better agreement with each other and with our new result for the isomer than for the ground state. Overall, the present results for 133g,mTe are factor of 3 more precise than the values recommended in AME2020. From the presently measured 133g,mTe masses, the excitation energy of the 133mTe isomer is determined as =336.2(10) keV, which is close to the more precise NUBASE2020 value of 334.26(4) keV.
3.3 133g,mI
The mass excess of 133gI is a factor of six more precise and shows a tension with the previously reported CPT results by Van Schelt et al. [16], as well as with the AME2020 recommended data. The value for 133mI has the same precision as that in Ref. [10], and the deduced excitation energy of =1636 (6) keV is consistent with the recommended high-precision excitation energy of 1634.148(10) keV [10].
4 Discussion
The masses of 133gTe and measured in this present work can be used to determine new keV, which is about 16 higher and a factor of 6 more precise compared to the AME2020 value. These new data resolve the anomaly at the =2935.83(15) keV level in 133I, resulting in the revised keV. This offers the possibility that this state might be an ultralow Q-value decay. In order to improve this value and better determine this, mass measurements with a precision better than 100 eV would be needed. It should also be pointed out that using keV, determined from the present data, and the -decay branching intensity reported in Ref. [12] of 0.129(33)% to the 2935.83(15) keV level, an anomalously-small 3.10-6 value to this level can be obtained using the LOGFT code [28]. Similarly, unusually small values can also be determined for several other highly-excited levels in 133I using the branching intensities of Ref. [12]. Future -decay spectroscopy studies of 133g,mTe are necessary in order to confirm their decay schemes and branching intensities.
Acknowledgments
This work was performed with the support of US Department of Energy, Office of Nuclear Physics under Contract No. DE-AC02-06CH11357 (ANL), the Natural Sciences and Engineering Research Council of Canada under Grant No. SAPPJ-2018-00028, and the US National Science Foundation under Grant No. PHY-2011890. This research used resources of ANL’s ATLAS facility, which is a DOE Office of Science User Facility.
References
- [1] T. Yamaguchi, H. Koura, Y. Litvinov, M. Wang, Masses of exotic nuclei, Prog. Part. Phys. 120 (2021) 103882. doi:https://doi.org/10.1016/j.ppnp.2021.103882.
-
[2]
M. Aker, A. Beglarian, J. Behrens, A. Berlev, U. Besserer, B. Bieringer,
F. Block, B. Bornschein, L. Bornschein, M. Böttcher, T. Brunst,
T. Caldwell, R. Carney, L. La Cascio, S. Chilingaryan, W. Choi, K. Debowski,
M. Deffert, M. Descher, D. D. Barrero, P. Doe, O. Dragoun, G. Drexlin,
K. Eitel, E. Ellinger, R. Engel, S. Enomoto, A. Felden, J. Formaggio,
F. Fränkle, G. Franklin, F. Friedel, A. Fulst, K. Gauda, W. Gil,
F. Glück, R. Grössle, R. Gumbsheimer, V. Gupta, T. Höhn,
V. Hannen, N. Haussmann, K. Helbing, S. Hickford, R. Hiller, D. Hillesheimer,
D. Hinz, T. Houdy, A. Huber, A. Jansen, C. Karl, F. Kellerer, J. Kellerer,
M. Klein, C. Köhler, L. Köllenberger, A. Kopmann, M. Korzeczek,
A. Kovalík, B. Krasch, H. Krause, N. Kunka, T. Lasserre, T. Le,
O. Lebeda, B. Lehnert, A. Lokhov, M. Machatschek, E. Malcherek, M. Mark,
A. Marsteller, E. Martin, C. Melzer, A. Menshikov, S. Mertens, J. Mostafa,
K. Müller, S. Niemes, P. Oelpmann, D. Parno, A. Poon, J. Poyato,
F. Priester, M. Röllig, C. Röttele, R. Robertson, W. Rodejohann,
C. Rodenbeck, M. Ryšavý, R. Sack, A. Saenz, P. Schäfer,
A. Schaller, L. Schimpf, K. Schlösser, M. Schlösser, L. Schlüter,
S. Schneidewind, M. Schrank, B. Schulz, A. Schwemmer, M. Šefčík, V. Sibille, D. Siegmann, M. Slezák, M. Steidl, M. Sturm,
M. Sun, D. Tcherniakhovski, H. Telle, L. Thorne, T. Thümmler, N. Titov,
I. Tkachev, K. Urban, K. Valerius, D. Vénos, A. V. Hernández,
C. Weinheimer, S. Welte, J. Wendel, J. Wilkerson, J. Wolf, S. Wüstling,
W. Xu, Y.-R. Yen, S. Zadoroghny, G. Zeller,
Direct neutrino-mass measurement
with sub-electronvolt sensitivity, Nature Phys. 18 (2) (2022) 160–166.
doi:10.1038/s41567-021-01463-1.
URL https://hal.science/hal-03247998 -
[3]
D. K. Keblbeck, R. Bhandari, N. D. Gamage, M. Horana Gamage, K. G. Leach,
X. Mougeot, M. Redshaw,
Updated
evaluation of potential ultralow -value -decay
candidates, Phys. Rev. C 107 (2023) 015504.
doi:10.1103/PhysRevC.107.015504.
URL https://link.aps.org/doi/10.1103/PhysRevC.107.015504 -
[4]
M. T. Mustonen, J. Suhonen,
Nuclear and atomic
contributions to beta decays with ultra-low q values, J. Phys. G 37 (6)
(2010) 064008.
doi:10.1088/0954-3899/37/6/064008.
URL https://dx.doi.org/10.1088/0954-3899/37/6/064008 -
[5]
C. Cattadori, M. De Deo, M. Laubenstein, L. Pandola, V. Tretyak,
Observation
of decay of 115in to the first excited level of 115sn, Nucl. Phys. A
748 (1) (2005) 333–347.
doi:https://doi.org/10.1016/j.nuclphysa.2004.10.025.
URL https://www.sciencedirect.com/science/article/pii/S0375947404011509 -
[6]
B. J. Mount, M. Redshaw, E. G. Myers,
value of
: The
lowest known energy decay, Phys. Rev. Lett. 103 (2009)
122502.
doi:10.1103/PhysRevLett.103.122502.
URL https://link.aps.org/doi/10.1103/PhysRevLett.103.122502 -
[7]
J. S. E. Wieslander, J. Suhonen, T. Eronen, M. Hult, V.-V. Elomaa, A. Jokinen,
G. Marissens, M. Misiaszek, M. T. Mustonen, S. Rahaman, C. Weber,
J. Äystö,
Smallest known
value of any nuclear decay: The rare
decay of
,
Phys. Rev. Lett. 103 (2009) 122501.
doi:10.1103/PhysRevLett.103.122501.
URL https://link.aps.org/doi/10.1103/PhysRevLett.103.122501 -
[8]
Z. Ge, T. Eronen, K. S. Tyrin, J. Kotila, J. Kostensalo, D. A. Nesterenko,
O. Beliuskina, R. de Groote, A. de Roubin, S. Geldhof, W. Gins, M. Hukkanen,
A. Jokinen, A. Kankainen, A. Koszorús, M. I. Krivoruchenko,
S. Kujanpää, I. D. Moore, A. Raggio, S. Rinta-Antila, J. Suhonen,
V. Virtanen, A. P. Weaver, A. Zadvornaya,
electron-capture: A new candidate for neutrino mass determination, Phys.
Rev. Lett. 127 (2021) 272301.
doi:10.1103/PhysRevLett.127.272301.
URL https://link.aps.org/doi/10.1103/PhysRevLett.127.272301 -
[9]
T. Eronen, Z. Ge, A. de Roubin, M. Ramalho, J. Kostensalo, J. Kotila,
O. Beliushkina, C. Delafosse, S. Geldhof, W. Gins, M. Hukkanen, A. Jokinen,
A. Kankainen, I. Moore, D. Nesterenko, M. Stryjczyk, J. Suhonen,
High-precision
measurement of a low q value for allowed –decay of 131i related to
neutrino mass determination, Phys. Lett. B 830 (2022) 137135.
doi:https://doi.org/10.1016/j.physletb.2022.137135.
URL https://www.sciencedirect.com/science/article/pii/S0370269322002696 -
[10]
F. G. Kondev, M. Wang, W. Huang, S. Naimi, G. Audi,
The nubase2020 evaluation
of nuclear physics properties, Chin. Phys. C 45 (3) (2021) 030001.
doi:10.1088/1674-1137/abddae.
URL https://dx.doi.org/10.1088/1674-1137/abddae -
[11]
M. Wang, W. Huang, F. Kondev, G. Audi, S. Naimi,
The ame 2020 atomic mass
evaluation (ii). tables, graphs and references*, Chin. Phys. C 45 (3) (2021)
030003.
doi:10.1088/1674-1137/abddaf.
URL https://dx.doi.org/10.1088/1674-1137/abddaf -
[12]
Y. Khazov, A. Rodionov, F. G. Kondev,
Nuclear
data sheets for A = 133, Nucl. Data Sheets 112 (4) (2011) 855–1113.
doi:https://doi.org/10.1016/j.nds.2011.03.001.
URL https://www.sciencedirect.com/science/article/pii/S0090375211000202 -
[13]
H. Hicks, J. Landrum, E. Henry, R. Meyer, S. Brant, V. Paar,
Population of
133i from the beta decay of fission product 133gte and the
cluster-vibration model, Phys. Rev. C 27 (1983) 2203.
doi:10.1103/PhysRevC.27.2203.
URL https://link.aps.org/doi/10.1103/PhysRevC.27.2203 -
[14]
W. B. Walters, E. A. Henry, R. A. Meyer,
Gamma-ray cascade
population of the isomer in the decay of
to levels of , Phys. Rev. C 29
(1984) 991–1004.
doi:10.1103/PhysRevC.29.991.
URL https://link.aps.org/doi/10.1103/PhysRevC.29.991 -
[15]
J. Hakala, J. Dobaczewski, D. Gorelov, T. Eronen, A. Jokinen, A. Kankainen,
V. S. Kolhinen, M. Kortelainen, I. D. Moore, H. Penttilä, S. Rinta-Antila,
J. Rissanen, A. Saastamoinen, V. Sonnenschein, J. Äystö,
Precision mass
measurements beyond : Anomalous behavior of odd-even
staggering of binding energies, Phys. Rev. Lett. 109 (2012) 032501.
doi:10.1103/PhysRevLett.109.032501.
URL https://link.aps.org/doi/10.1103/PhysRevLett.109.032501 -
[16]
J. Van Schelt, D. Lascar, G. Savard, J. A. Clark, P. F. Bertone, S. Caldwell,
A. Chaudhuri, A. F. Levand, G. Li, G. E. Morgan, R. Orford, R. E. Segel,
K. S. Sharma, M. G. Sternberg,
First results
from the caribu facility: Mass measurements on the -process path, Phys.
Rev. Lett. 111 (2013) 061102.
doi:10.1103/PhysRevLett.111.061102.
URL https://link.aps.org/doi/10.1103/PhysRevLett.111.061102 -
[17]
S. Eliseev, K. Blaum, M. Block, C. Droese, M. Goncharov, E. Minaya Ramirez,
D. A. Nesterenko, Y. N. Novikov, L. Schweikhard,
Phase-imaging
ion-cyclotron-resonance measurements for short-lived nuclides, Phys. Rev.
Lett. 110 (2013) 082501.
doi:10.1103/PhysRevLett.110.082501.
URL https://link.aps.org/doi/10.1103/PhysRevLett.110.082501 -
[18]
G. Savard, S. Baker, C. Davids, A. Levand, E. Moore, R. Pardo, R. Vondrasek,
B. Zabransky, G. Zinkann,
Radioactive
beams from gas catchers: The caribu facility, Nucl. Instrum. Methods. Phys.
Res. B 266 (19) (2008) 4086–4091, proceedings of the XVth International
Conference on Electromagnetic Isotope Separators and Techniques Related to
their Applications.
doi:https://doi.org/10.1016/j.nimb.2008.05.091.
URL https://www.sciencedirect.com/science/article/pii/S0168583X08006848 - [19] G. Savard, R. Pardo, S. Baker, C. Davids, A. Levand, D. Peterson, D. Phillips, T. Sun, R. Vondrasek, B. Zabransky, G. Zinkann, CARIBU: a new facility for the study of neutron-rich isotopes, Hyperfine Interact. 199 (1-3) (2011) 301–309. doi:10.1007/s10751-011-0325-5.
- [20] G. Savard, R. C. Barber, C. Boudreau, F. Buchinger, J. Caggiano, J. Clark, J. E. Crawford, H. Fukutani, S. Gulick, J. C. Hardy, A. Heinz, J. K. P. Lee, R. B. Moore, K. S. Sharma, J. Schwartz, D. Seweryniak, G. D. Sprouse, J. Vaz, The canadian penning trap spectrometer at argonne, Hyperfine Interact. 132 (1) (2001) 221–228.
-
[21]
C. N. Davids, D. Peterson,
A
compact high-resolution isobar separator for the caribu project, Nucl.
Instrum. Meth. B 266 (19) (2008) 4449–4453, proceedings of the XVth
International Conference on Electromagnetic Isotope Separators and Techniques
Related to their Applications.
doi:https://doi.org/10.1016/j.nimb.2008.05.148.
URL https://www.sciencedirect.com/science/article/pii/S0168583X08007544 -
[22]
T. Y. Hirsh, N. Paul, M. Burkey, A. Aprahamian, F. Buchinger, S. Caldwell,
J. A. Clark, A. F. Levand, L. L. Ying, S. T. Marley, G. E. Morgan,
A. Nystrom, R. Orford, A. P. Galván, J. Rohrer, G. Savard, K. S. Sharma,
K. Siegl,
First
operation and mass separation with the caribu mr-tof, Nucl. Instrum. Meth. B
376 (2016) 229–232, proceedings of the XVIIth International Conference on
Electromagnetic Isotope Separators and Related Topics (EMIS2015), Grand
Rapids, MI, U.S.A., 11-15 May 2015.
doi:https://doi.org/10.1016/j.nimb.2015.12.037.
URL https://www.sciencedirect.com/science/article/pii/S0168583X15012835 -
[23]
R. Orford, J. Clark, G. Savard, A. Aprahamian, F. Buchinger, M. Burkey,
D. Gorelov, J. Klimes, G. Morgan, A. Nystrom, W. Porter, D. Ray, K. Sharma,
Improving
the measurement sensitivity of the canadian penning trap mass spectrometer
through pi-icr, Nucl. Instrum. Methods. Phys. Res. B 463 (2020) 491–495.
doi:https://doi.org/10.1016/j.nimb.2019.04.016.
URL https://www.sciencedirect.com/science/article/pii/S0168583X19302009 -
[24]
C. M. Weber, D. Ray, A. A. Valverde, J. A. Clark, K. S. Sharma,
Gaussian
mixture model clustering algorithms for the analysis of high-precision mass
measurements, Nucl. Instrum. Methods. Phys. Res. A 1027 (2022) 166299.
doi:https://doi.org/10.1016/j.nima.2021.166299.
URL https://www.sciencedirect.com/science/article/pii/S0168900221011190 - [25] J. V. Schelt, Precision mass measurements of neutron-rich nuclei and limitations on the r-process environment, Ph.D. thesis, The University of Chicago (2012).
-
[26]
A. Kankainen, J. Hakala, T. Eronen, D. Gorelov, A. Jokinen, V. S. Kolhinen,
I. D. Moore, H. Penttilä, S. Rinta-Antila, J. Rissanen, A. Saastamoinen,
V. Sonnenschein, J. Äystö,
Isomeric states
close to doubly magic 132sn studied with the double penning trap
jyfltrap, Phys. Rev. C 87 (2013) 024307.
doi:10.1103/PhysRevC.87.024307.
URL https://link.aps.org/doi/10.1103/PhysRevC.87.024307 - [27] D. Ray, Mass measurements of neutron-rich nuclides for the astrophysical r process using the canadian penning trap mass spectrometer, Ph.D. thesis, University of Manitoba (2022).
- [28] N. Gove, M. Martin, Log-f tables for beta decay, Nucl. Data Tables 10 (3) (1971) 205.