subject
Article\Year2024 \MonthJanuary \Vol67 \No1 \DOI10.1007/s11433-023-2219-7 \ArtNo219511 \ReceiveDateJune 20, 2023 \AcceptDateSeptember 8, 2023 \OnlineDateDecember 8, 2023
FASHI
Zhang C.-P.
Zhang C.-P., et al
The FAST All Sky H I Survey (FASHI): the first release of catalog
Abstract
The FAST All Sky H I survey (FASHI) was designed to cover the entire sky observable by the Five-hundred-meter Aperture Spherical radio Telescope (FAST), spanning approximately 22000 square degrees of declination between and , and in the frequency range of 1050-1450 MHz, with the expectation of eventually detecting more than 100000 H I sources. Between August 2020 and June 2023, FASHI had covered more than 7600 square degrees, which is approximately 35% of the total sky observable by FAST. It has a median detection sensitivity of around 0.76 and a spectral line velocity resolution of 6.4 at a frequency of 1.4 GHz. As of now, a total of 41741 extragalactic H I sources have been detected in the frequency range 1305.5-1419.5 MHz, corresponding to a redshift limit of . By cross-matching FASHI sources with the Siena Galaxy Atlas (SGA) and the Sloan Digital Sky Survey (SDSS) catalogs, we found that 16972 (40.7%) sources have spectroscopic redshifts and 10975 (26.3%) sources have only photometric redshifts. Most of the remaining 13794 (33.0%) H I sources are located in the direction of the Galactic plane, making their optical counterparts difficult to identify due to high extinction or high contamination of Galactic stellar sources. Based on current survey results, the FASHI survey is an unprecedented blind extragalactic H I survey. It has higher spectral and spatial resolution and broader coverage than the Arecibo Legacy Fast ALFA Survey (ALFALFA). When completed, FASHI will provide the largest extragalactic H I catalog and an objective view of H I content and large-scale structure in the local universe.
keywords:
Key Words: surveys, redshifts, galaxies, telescope, radio lines, H I line95.80.+p, 98.62.Py, 98.52.-b, 95.55.Jz, 95.30.Ky, 98.58.Ge
1 Introduction
Neutral hydrogen (H I) is a significant component of the interstellar medium within disk galaxies. The measurement of its abundance and kinematics, via the 21 cm emission line, has been employed to address numerous astrophysical issues, including studies on the large-scale distribution of galaxies and their secular evolution (e.g., Wong et al., 2006; Cheng et al., 2020; Xu et al., 2022). The line emission from H I provides crucial information about the distribution of neutral gas and its velocity field within a galaxy (e.g., Springob et al., 2005). H I line offers a way to obtain redshifts, gas masses, and rotational widths for standard galaxies, tracing the evolution of tidal phenomena, and furnish quantitative assessment of the potential for future star formation through H I content. Moreover, because of its relatively simple physics, the H I line provides a valuable means of tracing cool gas mass and star formation potential in nearby galaxies, and enables the investigation of low-luminosity, gas-rich object populations. Low surface brightness, dwarf, and gas-rich galaxy populations are often underrepresented in optical or infrared surveys. Although public wide-area optical or infrared surveys and their associated spectroscopic surveys are good at detecting luminous ellipticals, bright spirals, and bursting or active galaxies, they are substantially less complete in tracing the low surface brightness, dwarf, and gas-rich galaxy populations which actually dominate the local population. Thus, large-scale extragalactic H I surveys remain necessary to take stock of gas-rich galaxies in the proximity of the local universe (e.g., Koribalski et al., 2004; Meyer et al., 2004; Wong et al., 2006; Giovanelli & Haynes, 2015; Haynes et al., 2011, 2018).
Over the past decade, a number of significant surveys have been conducted on the H I line providing insights into the properties of the extragalactic population in the local universe (Giovanelli & Haynes, 2015). The Arecibo Legacy Fast ALFA Survey (ALFALFA) was the most sensitive, large scale extragalactic H I survey and the first of its kind (Giovanelli et al., 2005; Haynes et al., 2018). The ALFALFA survey utilized the seven-beam Arecibo -band Feed Array (ALFA) to conduct a drift-scan survey, and covered an area of approximately 7000 deg2 over a redshift range of and cataloged 31502 galaxies. Its beam size is , and the final spectral resolution is 10 at 1420 MHz (Haynes et al., 2011, 2018). The ALFALFA survey has provided important measurements to determine the faint-end profile of the H I mass function (HIMF) (e.g., Martin et al., 2010; Jones et al., 2018), the HIMF variation with the environment (e.g., Moorman et al., 2014; Jones et al., 2016, 2018), the HI-bearing population differing from optically selected objects (Huang et al., 2012a, b; Gavazzi et al., 2013), and establishing metrics for the normal H I content of galaxies (e.g., Toribio et al., 2011; Odekon et al., 2016). Another large extragalactic H I survey before ALFALFA was the H I Parkes All Sky Survey (HIPASS; Barnes et al., 2001). It has also made a great census of the local extragalactic H I galaxy distribution in a coverage of about 30000 deg2, identifying more than 5000 galaxies, which are mainly included in the HIPASS Bright Galaxy Catalogue (BGC; Koribalski et al., 2004), the southern HIPASS Catalogue (HICAT; Meyer et al., 2004), and the Northern HIPASS Catalogue (NHICAT; Wong et al., 2006), respectively.
However, to deal with a number of open questions a significant improvement over HIPASS and even ALFALFA is required. These surveys could not sample a cosmologically fair volume since their average depth was inadequate, and their angular and spectral resolution as well as sensitivity were limited. Consequently, earlier surveys on H I have mainly focused on H I-rich galaxies that are local, massive, and situated at the upper end of the HIMF. For instance, these surveys did not detect sufficient H I components from the population of dwarf galaxies. Typically, dwarf galaxies exhibit weak H I signals with narrow H I widths. As a result, higher sensitivity is required with smaller velocity bins. Furthermore, sensitivity limitations prevent the identification of the vast H I morphology of bright local galaxies. This understanding is critical to discern their recent formation or merger history (e.g., Zhou et al., 2023).
The Widefield ASKAP L-band Legacy All-sky Blind Survey (WALLABY) is expected to survey 75% of the sky in the 21-cm line of neutral atomic hydrogen gas at a resolution of 30′′. It is projected to detect approximately half a million galaxies in the local universe (Koribalski et al., 2020). As the next-generation extragalactic survey in the 21-cm H I line, WALLABY is expected to be the most powerful survey in observing the local universe. However, it will take years to complete the WALLABY survey.
The Five-hundred-meter Aperture Spherical radio Telescope (FAST) has the distinction of being designated as the most powerful single dish telescope. It is located at a geographic latitude of . Its observable maximum zenith angle is about (Nan et al., 2011; Jiang et al., 2019, 2020). The FAST All Sky H I survey (FASHI) will cover the entire sky that can be detected by FAST telescope, ranging a declination of to , and has a frequency range of GHz, achieves a median detection sensitivity of 0.76 at velocity resolution of 6.4 (Jiang et al., 2019, 2020). A pilot FASHI drift scan survey released and compared a total of 544 extragalactic H I sources with the ALFALFA survey (Kang et al., 2022). The FASHI and ALFALFA surveys have consistent observational parameters, including flux and velocity. However, in sensitivity, efficiency, and resolution, the FASHI project outperforms the ALFALFA significantly. Furthermore, the FASHI survey has successfully mapped extragalactic H I sources, such as M106 (Zhu et al., 2021), M51 (Yu et al., 2023a), DDO 168 (Yu et al., 2023b), M94 (Zhou et al., 2023), NGC 4490/85 (Liu et al., 2023). This further demonstrates the significant scientific value of FASHI data for both statistical studies and targeted investigations.
Being a blind H I survey, FASHI avoids bias towards high surface brightness galaxies, which are usually present in optical galaxy catalogs, and offers better angular and spectral resolution in comparison to any previous single telescope. FASHI’s extensive coverage overlaps with several other prominent surveys, including the Sloan Digital Sky Survey (SDSS; Abazajian et al., 2009), the Panoramic Survey Telescope and Rapid Response System (Pan-STARRS; Chambers et al., 2016), the Two Micron All Sky Survey (2MASS; Skrutskie et al., 2006), and the NRAO VLA Sky Survey (NVSS; Condon et al., 1998). The catalog products generated by FASHI will be highly valuable for multiwavelength data mining, extending far beyond those currently engaged in the FASHI project itself. The program aims to provide legacy data products that have broad applications and maximize the potential for scientific research.
In this paper, we mainly present the FASHI project and its catalogued extragalactic H I sources. Moreover, Section 2 explains the scientific objectives, survey strategy, and observational setup of the FASHI project. Section 3 discusses data reduction, which includes baseline correction, radio frequency interference (RFI) mitigation, source extraction, and distance calibration. Section 4 describes the FASHI catalog that has been released. It outlines the approach used for source characterisation. It also provides an overview of the basic parameters of the detected sources and presents the methods used for optical counterpart identification. Section 5 comprises of the evaluation of the reliability and completeness of the FASHI sources. It also provides some caveats and comments for the users of the FASHI catalog. A summary is provided in Section 6. This paper adopts the Hubble constant value of H0 = 75 Mpc-1, , and . In addition, we adopt AB magnitude system (Oke & Gunn, 1983) throughout this paper.
2 The FASHI project
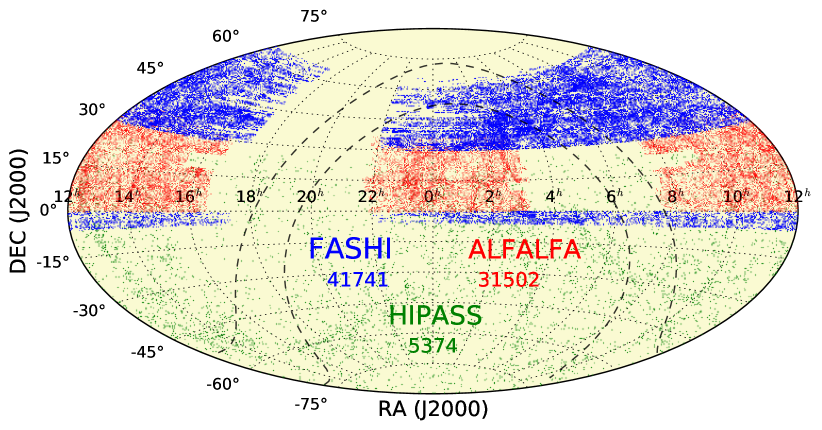

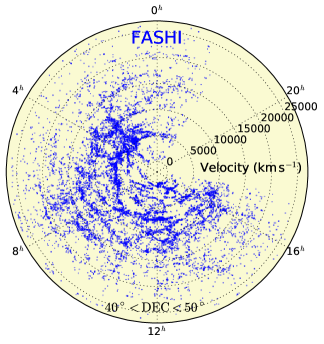
The FASHI project aims to observe the entire detectable sky of the FAST in the declination range of to at a frequency between 1050 and 1450 MHz, as illustrated in Figure 1. The first data release of the FASHI project mainly concentrates on extragalactic areas that lie predominantly outside the observable regions of the Arecibo telescope. Between August 2020 and June 2023, the FASHI project observed an approximate area of 7600 square degree of the sky and detected 41741 extragalactic H I sources, as shown in Figure 1. This indicates a detection rate of approximately 5.5 sources per square degree. Based on this detection rate, FASHI is expected to detect over 100000 extragalactic H I galaxies in the approximately 22000 square degree region detectable by FAST, up to a redshift of approximately 0.35. Currently, we mainly use datasets in the frequency range of 1305.5-1419.5 MHz due to serious RFI and relatively low sensitivity at low frequency ranges. Table 1 summarizes the technical details of the FASHI project.
| Parameters | Values |
|---|---|
| Planed RA range | (see Figure 1) |
| Planed DEC range | (see Figure 1) |
| Current RA range | , |
| Current DEC range | , |
| Receiver | 19-beam array |
| Polarizations per beam | 2 linear (XX, YY) |
| Beam size (FWHM) | 29 at 1420 MHz |
| Gain | 13-17 K Jy-1 |
| 16-19 K | |
| Total frequency coverage | 1050-1450 MHz |
| Released frequency range | 1305.5-1419.5 MHz (in this work) |
| c range | 200-26323 (in this work) |
| Bandwidth (total) | 400 MHz |
| Spectral channels | 65536 (before smoothing) |
| Channel spacing | 7.629 kHz or 1.6 at 1420 MHz |
| Spectral resolution | 6.4 (after smoothing) |
| Spectral median rms | 1.50 mJy at 6.4 resolution |
| Map median sensitivity | 0.76 at 6.4 resolution |
Notes. The spectral median rms is estimated from the baseline measurement of each integrated spectrum. The map median sensitivity of the map is estimated from the integrated map.
2.1 Science goals
The primary survey strategy of the FASHI project is to utilize the high sensitivity and rapid survey speed of FAST to perform a comprehensive inventory of the H I gas in the neighbouring universe. Additionally, the project aims to observe at leas 100000 H I galaxies.
The ALFALFA project identified 31502 extragalactic H I sources, determined the HIMF of the local universe, established measurements for the typical H I content of galaxies, and derived the clustering properties of H I galaxies (e.g., Haynes et al., 2011; Toribio et al., 2011; Odekon et al., 2016; Jones et al., 2018). Nevertheless, the studies concerning the low-mass end of the HIMF from ALFALFA still face detection limitations. Increasing the H I detection number by an order of magnitude towards low masses is necessary to investigate the faint end of the HIFM, particularly the properties of the H I faint targets, which include dwarf galaxies and the passive galaxy population. According to Huang et al. (2012b), the population detected by H I surveys presents an overall higher star formation rate at a fixed stellar mass. However, for low-mass star-forming galaxies (blue dwarf galaxies) and quiescent galaxies, the H I detection rate is relatively low. According to a study by Ai & Zhu (2018) of H I gas in galaxy groups and clusters using FASHI data, the detection rate of H I is less than 30% for member galaxies in groups with . This low detection rate poses a significant challenge to statistical studies of H I gas properties in optically selected samples. There is no doubt that deeper surveys, such as FASHI, can help to improve the detection rate for H I deficient galaxies.
The FASHI project focuses on providing a more comprehensive and extensive coverage of the local universe, as visualized in Figure 2. Additionally, it aims to achieve a survey volume that is comparable to current optical surveys such as the SDSS. The project would enable the study of the HIMF across various cosmic environments, making it possible to find more low-mass dwarf galaxies and map the local Voids accurately in order to sample multiple low-density environments. FASHI is sensitive to large-scale diffuse gas structure, which could be missed by interferometric surveys. One of the ultimate goals of the FASHI project is to combine the FAST data with the data from ongoing or planned surveys employing interferometric arrays, which will enable sampling of the extragalactic H I sky with significantly increased resolution. This will provide crucial information regarding the large-scale H I structures, leading to a better understanding of the role of H I in galaxy formation and evolution. Therefore, single-dish large-scale surveys like FASHI are still indispensable even in the era of interferometric large-scale surveys.
It has been demonstrated by ALAFALA that a blind H I survey has the potential to discover uncommon objects like the nearby faint dwarf Leo P (Giovanelli et al., 2013), nearly dark galaxies, and galaxies with extraordinarily high H I-to-stellar mass ratios (e.g., Adams et al., 2015; Janowiecki et al., 2015; Janesh et al., 2015, 2017). In the local universe, deeper surveys of larger volumes may detect additional such objects and even new types of species. FAST’s sensitivity could enable the identification of H I clouds, close to , in the Local Group, within a few minutes of integration time. In several case studies (e.g., Zhu et al., 2021; Yu et al., 2023a, b; Zhou et al., 2023; Liu et al., 2023), FASHI has detected intergalactic and surrounding diffuse gas that has not been detected by other telescopes. The work of Xu et al. (2023b) shows that FASHI can potentially discover more candidates of “dark galaxies” that do not form any star due to low-density gas and, therefore, reveal the mystery of dark halo substructure.
Deep H I observations using mapping techniques have the potential to reveal filamentary gas features (e.g., Zhu et al., 2021) and large-scale distributions (refer to Figure 2) of matter in the Local Group and nearby universe. This can provide more insight into the distribution and properties of dark matter. The H I gas that is faint and diffuse, and cannot be detected by an interferometer, can be easily searched using FAST. There will be no restriction on the survey’s depth level, and the scope of exploration will be expanded in certain areas based on the discovery of significant characteristics.
In addition, the FASHI project will also cover a section of the Milky Way. This will provide an opportunity to detect numerous radio recombination lines and high-velocity Galactic H I clouds with exceptional sensitivity.
2.2 Survey strategy
Survey efforts of this scale and scope require careful optimization of their operational strategy towards achieving the science objectives within the constraints imposed by practical observing conditions and requirements. In this paper, the available observation time for the FASHI project mainly comes from the schedule-filler time, i.e., the observations were carried out as a time-filler project when there are no other programs in the FAST observing queue. Although such type of observations cannot be planned for specified targets, we can still do a blind search for H I emission. Our observational setup was to fix the sky declination and do drift scans during the project time. We also used some commissioning time to do calibration observations. In this mode, we can not control the sky coverage uniformly, but it makes full use of all available time to increase the sample of H I galaxies. Some areas will be sampled multiple times and can go deeper than other areas. Such strategy has the advantage of finding more dwarf galaxies and H I poor galaxies. As this is the first data release of the survey, it is not a high priority for us to achieve a uniform sky coverage. Instead, we made full use of all available time to increase the coverage area. We plan to standardize the survey depth for this ongoing project and will showcase the results in the next data release.
2.3 Observational setup
FAST has a 19-beam receiver enabling efficient scan observations that can cover multiple areas of observation simultaneously. The FAST spectral-line backend is equipped with two linear polarizations, XX and YY. The spectral-line backend has a full wideband that covers a frequency range of 1050 to 1450 MHz. The FASHI project used the low-resolution mode with 64 k channels, resulting in a frequency resolution of 7630 Hz. The sampling time for each spectral line in FASHI is 1 second. The FAST has an aperture of 500 m with an effective aperture of approximately 300 m, resulting in an HPBW of 29 at a frequency of 1.4 GHz. The pointing error is less than or equal to . To calibrate intensity, a high-noise signal with an amplitude of 11 K was injected into the entire FASHI observation for a period of 32 seconds. The factor of degrees per flux unit (DPFU) is relevant for 19 beams, with a value of K Jy-1 at a frequency of 1400 MHz, as detailed in (Nan et al., 2011; Jiang et al., 2019, 2020; Qian et al., 2020; Han et al., 2021). The technical details for the FASHI measurements are listed in Table 1.
2.3.1 DecDriftWithAngle mode
Although FAST has an active reflector that enables the telescope to cover a larger part of the sky, the motion of the reflector panels is driven by over 2000 actuators, which consume a substantial amount of electricity. The drift mode has been extensively used at the Arecibo telescope, and the ALFALFA survey has shown that it can deliver high-quality data with a very good baseline. Thus, the FASHI project is predominantly performed using the drift scan mode (DecDriftWithAngle).
The FASHI survey was mainly carried out using a drift scan observational mode called DecDriftWithAngle, utilizing 19-beam receivers (Li et al., 2018; Jiang et al., 2019, 2020). The drift scan method helped minimize complexities in system control and self-generated RFI, ensuring relatively accurate pointing, full FAST gain, and stable status for the primary surface and focal cabin during the surveys. Throughout the survey, the telescope’s azimuth arm was positioned on the meridian at a pre-assigned J2000 declination, with a spacing of between primary drift centers. The feed array was rotated by to enable super-Nyquist sampling of Earth-rotation drift-scan tracks of individual beams in the declination of J2000 coordinates, with sampling rates smaller than half the FWHM.
2.3.2 MultiBeamOTF mode
Among all the FAST approved projects, the FASHI project has the lowest priority of observation. For the FASHI project to proceed, it relies solely on the schedule-filler observable time. Please refer to section 2.2 for details. As a consequence of this, the observed RA ranges during the FASHI drift survey appear relatively random. While some sky ranges have been scanned repeatedly, some others cannot be covered at all. To cover the portions of the sky that remained uncovered in the drift-scan mode, the MultiBeamOTF scan mode was employed (Jiang et al., 2020). The observational setup used in the MultiBeamOTF mode in FASHI is almost identical to that in the DecDriftWithAngle mode (see Section 2.3.1), with the exception of a specified declination range.
3 Data reduction
The FASHI data were reduced mainly using the FAST spectral data reduction pipeline named as HiFAST (Jing et al., 2023; Xu et al., 2023a). The HiFAST pipeline combines several useful data reduction packages including antenna temperature correction, baseline correction, RFI mitigation, standing-waves correction, gridding, flux correction, and fits cube generation. For the FASHI data, the spectral resolution was smoothed to 6.4 per channel, and the fits cubes were gridded into a pixel scale of 1′, meeting the Nyquist sample criterion. The conversion from antenna temperature to flux density was carried out using the fitted gain curves for FAST 19-beams when gain varied with different zenith angles (), as reported by Jiang et al. (2019). All other parameters used for data reduction were set to default values as specified in the HiFAST pipeline cookbook111https://hifast.readthedocs.io/.
3.1 The arPLS for baseline correction
In the HiFAST pipeline (Jing et al., 2023), we utilized the Asymmetrically Reweighted Penalized Least Squares algorithm (arPLS; Baek et al., 2015) to adjust the entire 500 MHz spectral baseline. This method permits us to modify a parameter, “weight”, repeatedly to calculate the baseline. A significant weight is applied automatically when the signal falls below an already fitted baseline. Conversely, no weight or a small weight is assigned when an emission line is present above the fitted baseline as it may be part of the spectral peak. A preset coefficient can control the balance between fitness and smoothness, based on the total spectral channel number. This method can iteratively estimate the noise level and adjust the weights accordingly (Baek et al., 2015). Thankfully, the FASHI data contains only a few instances of weak and narrow absorption dips throughout the entire 500 MHz band. Therefore, it is highly suitable to implement the arPLS method for reducing the FAST spectral data. In fact, the arPLS baseline fitting method has been effectively employed for many FAST spectral analyses (e.g., Zeng et al., 2021; Zhang et al., 2021, 2022a). Nevertheless, there is a drawback in the arPLS algorithm for baseline correction. Our findings revealed that a small indentation occasionally appears in the baseline close to the line wings of the strong emission and wide line profile with intensities over 40 mJy and velocities over 150 . This could lead to a slight underestimation (5%) of the integrated flux only for bright sources. In general, arPLS is the best choice for baseline correction when reducing broadband data from large scale surveys.
3.2 Radio frequency interference
The quality of antenna observational data is seriously affected by RFI. Mitigating RFI is an essential procedure in any observation. However, strong RFI from sources such as broadcast radio and TV, communication satellites, and navigation satellites are extremely difficult to avoid in FASHI. As a result, the existing RFI have made several wide frequency bands completely useless. Zhang et al. (2022a) conducted a statistical analysis of the probabilities of RFI distribution, derived from approximately 300 hours of blind survey data, across the wideband FAST spectrum from 1050 to 1450 MHz. RFI is relatively severe below 1305 MHz, whereas the frequency band above 1305 MHz is relatively clear. At approximately 1382 MHz, a strong RFI is present due to the GPS L3 signal. This corresponds to a distance of around 112 Mpc as shown in Figure 3. Thankfully, the probability of the strong RFI appearing is less than 10%. These occasional RFIs have been removed reasonably well during the data reduction process. We flag RFIs in FAST spectra employing four strategies - flagging extremely strong RFIs, long-lasting RFIs, polarized RFIs, and beam-combined RFIs, as detailed in Zhang et al. (2022a). Therefore, we publish only the extragalactic sources that are located within the frequency band of 1305.5-1419.5 MHz in the first released FASHI data.
Several frequency periods (1 MHz, 2 MHz, and 0.04 MHz) of standing waves are inhabited in the FASHI spectral data. The spectral quality can be significantly improved if the standing wave is completely corrected. Standing waves are predominantly fitted and subtracted using the SW package (Xu et al., 2023a) in the HiFAST pipeline (Jing et al., 2023). To find standing waves at the frequency periods in the FAST spectra, the SW package uses the Fourier transform method. To prevent confusion from the Galactic H I emission, the velocity range of was masked and excluded from the spectral data reduction, as a further measure. The effect obtained after implementing the SW package correction shows that the standing wave is almost disappear. This treatment turns out to be highly effective for both standing wave correction and source extraction.
3.3 Source extraction
The process of extracting sources for FASHI consists of two steps, involving both automated and interactive procedures. The application used for finding sources in H I data cubes is called the H I Source Finding Application222https://github.com/SoFiA-Admin/SoFiA-2 (SoFiA) in version 2. SoFiA is a pipeline that was initially intended for detecting and characterising galaxies in extragalactic H I data cubes in a three-dimensional space (Serra et al., 2015; Westmeier et al., 2021, 2022). The SoFiA source finding algorithm involves smoothing the data on various spatial and spectral scales specified by the user and measuring the noise level in each smoothing iteration. Subsequently, a user-defined flux threshold is applied relative to the noise to retain all pixels with statistically significant flux density. SoFiA is a fully automated and reliable source finding tool, making it crucial for the scientific success of surveys (e.g., Westmeier et al., 2022).
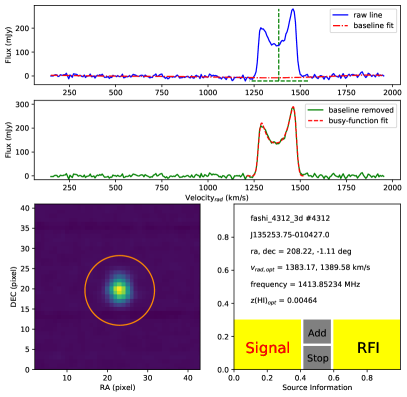
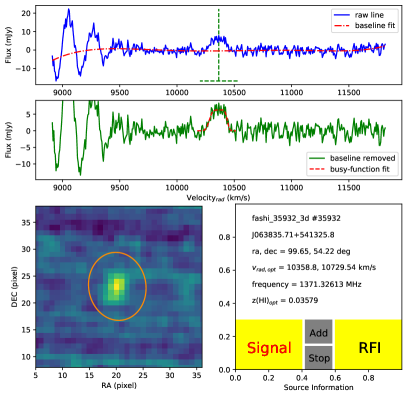
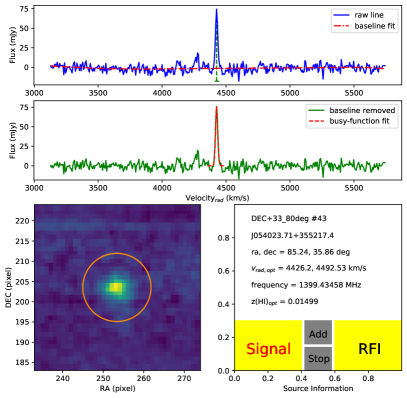
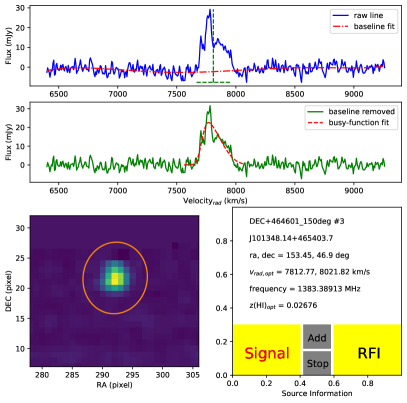
In the FASHI source search, we first used version 2 of SoFiA to generate a list of initial candidates. In the SoFiA setup, the detection threshold is 4.5 ( means the local noise level within the bounding box of the source in native units of the data cube; see the SoFiA cookbook); the smoothing kernels are kernelsXY = 0, 3, 6 and kernelsZ = 0, 3, 7, 15 respectively; in the linking parameters, the minimum size of the sources in the spatial dimension is 5 pixels/channel each in XY and Z space, while the maximum size is 50 pixels in XY space, but not limited in Z space; furthermore, we set the reliability.enable as false so that artefacts such as RFI and bad baselines occasionally remain in the spectral data. Based on the above setup, we found that the the source candidates found by SoFiA found contain some false signals. Therefore, a manual interactive source extraction has to be done, judging by the source moment maps, spectral profile, signal to noise ratio and so on. In addition, in the cases of double or multiple sources very close in position and redshift and low intensity level between two peaks, SoFiA has difficulty distinguishing them and often prefers to fit them with a wide double horn profile rather than two different single line profiles. For the cases of bad baselines produced by the HiFAST pipeline, we used a high-order polynomial fit to correct each source baseline again. In this step (see also Figure 12) we extend the integrated area to 2.0-2.5 times (see analysis in Section 4.1) the 4.5 region size (see above for the definition of 4.5) for measuring each source integrated spectrum to include most of the flux from H I sources. The size of the integrated area also depends on the SNR of each H I line. If SoFiA did not fit the source position and size well, we would manually use an ellipse or circle of an appropriate size to measure the integrated spectrum of the source. The ellipse or circle size would try to include 100% of each source’s integrated flux, but a high enough SNR () for each source should be guaranteed first. Finally, we use the busy function to fit the integrated spectra. The velocity, line width and flux density would be derived by the busy function fitting code (Westmeier et al., 2014). Although all detections made by SoFiA were visually inspected to discard obvious false positives caused by noise peaks or artefacts, a small number of false detections are likely to remain in the final catalog.
3.4 Source aperture
A source aperture, defined as an ellipse () with major and minor radii, and a position angle, is used for measuring flux. The entire H I flux of each source is integrated within the ellipse, providing an estimate of the size of each H I source. Usually, the size of the ellipse is set to be approximately 2.0-2.5 times larger than the area covered by the 4.5 region (refer to Section 3.3 for the definition of 4.5). Approximately 95% of the measured effective diameter () in our catalog is larger than 50, with a median value of 83 which indicates that the current ellipse size is large enough compared to the beam size (29) to encompass most of the emission from each H I source. Furthermore, the size of the integrated area is dependent on the signal-to-noise ratio (SNR) of each H I line. The catalog indicates that 94% of sources have an SNR of at least 10, ensuring sufficient SNR for most sources. Reducing the size of the ellipse would lead to the loss of flux, whereas increasing it would introduce more noise. Our statistical analysis shows that changing the aperture of each source in the catalog by 10% results in a decrease or increase in the included source flux of only 2.5% or 2.0% respectively. Similarly, the flux uncertainty reduces by roughly 11.5% or 13.0%, respectively. Furthermore, the current source aperture fulfils the criterion that the flux uncertainty is less than 10% of each source flux. An increase of the source aperture by 10% will elevate the contribution of flux uncertainty to roughly 12% of the total flux of each source. Overall, the current setup of the ellipse size proves to be a highly suitable solution.
3.5 Distance calculation
The peculiar motions of galaxies interfere with distance calibration in the local universe because of their gravitational interaction with the underlying density field of matter. This can be observed in the large-scale structures (e.g., Figure 2) of the local universe (Branchini et al., 1999; Masters, 2005; Masters et al., 2006). Peculiar velocities of galaxies provide a powerful and unbiased method to comprehend the dynamics and structure of the local universe. Cosmicflows333https://edd.ifa.hawaii.edu/ is a program that compiles galaxy distances and breaks down observed velocities into components due to the expansion of the universe and the residual effects of gravitational interactions (Graziani et al., 2019; Kourkchi et al., 2020). Galaxy test particle peculiar motions can be used to derive inferences about the large-scale structure of the universe (Tully et al., 2008, 2013, 2016). The Cosmicflows program derives two Distance-Velocity Calculators that establish the connections between the distances and velocities of galaxies, based on smoothed versions of the velocity fields, with the aid of the Extragalactic Distance Database (Tully et al., 2009). One of this calculator is limited to a distance of 38 Mpc and is based on a fully nonlinear analysis. The other calculation extends to a distance of 200 Mpc and is derived from an analysis in the linear dynamical region (Graziani et al., 2019; Kourkchi et al., 2020). The distance measurement of the sources in FASHI mainly combines two distance calculators: the Cosmicflows-3 Distance-Velocity Calculators and the Hubble flow distance, with H0 = 75 Mpc-1. Details about the combination for the distance calculators are presented in Section 4.1. The derived distance parameters are presented in Table 2 and illustrated in Figure 3.
4 The FASHI extragalactic source catalog
4.1 Extragalactic H I catalog
| [1] | [2] | [3] | [4] | [5] | [6] | [7] | [8] | [9] | [10] | [11] | [12] | [13] | [14] |
|---|---|---|---|---|---|---|---|---|---|---|---|---|---|
| FASHI ID | RA | DEC | c | ell | W50 | W20 | SNR | log | |||||
| deg | deg | mJy | mJy | mJy | mJy | Mpc | |||||||
| 20230000823 | 166.736 | -6.193 | 6802.1 | 3.7, 3.7, 0 | 164.0 | 172.6 | 9.0 | 1.8 | 1179.4 | 1046.8 | 20.3 | 98.2 | 9.4 |
| 20230000824 | 113.607 | -6.193 | 10797.4 | 4.4, 4.4, 0 | 149.7 | 199.5 | 16.5 | 2.9 | 2221.2 | 2150.5 | 25.0 | 143.7 | 10.0 |
| 20230000825 | 166.377 | -6.187 | 7596.6 | 5.0, 4.9, 106 | 33.0 | 46.5 | 33.2 | 2.4 | 1118.9 | 1098.3 | 31.9 | 108.3 | 9.5 |
| 20230042078 | 169.097 | -6.182 | 24776.7 | 5.0, 5.0, 0 | 94.5 | 120.8 | 7.6 | 2.8 | 648.5 | 568.0 | 9.4 | 327.6 | 10.2 |
| 20230000826 | 111.686 | -6.182 | 19246.1 | 2.3, 2.3, 0 | 198.6 | 216.4 | 2.4 | 1.2 | 474.5 | 504.0 | 11.2 | 253.7 | 9.8 |
| 20230042079 | 165.515 | -6.178 | 9428.8 | 6.0, 3.8, 174 | 249.8 | 284.5 | 7.1 | 2.7 | 1403.0 | 1201.0 | 13.2 | 134.6 | 9.8 |
| 20230000828 | 163.988 | -6.174 | 10202.9 | 5.8, 5.4, 33 | 170.9 | 176.9 | 23.4 | 3.4 | 2407.1 | 2550.6 | 21.2 | 143.9 | 10.1 |
| 20230000831 | 58.707 | -6.171 | 10984.3 | 3.3, 3.3, 0 | 133.7 | 231.8 | 7.8 | 2.5 | 1022.5 | 984.2 | 13.7 | 152.0 | 9.7 |
| 20230042080 | 125.705 | -6.169 | 14644.7 | 5.5, 4.5, 142 | 70.7 | 101.2 | 13.9 | 3.6 | 994.4 | 715.8 | 13.1 | 196.1 | 9.9 |
| 20230000829 | 110.411 | -6.163 | 1641.4 | 6.7, 6.5, 109 | 183.1 | 258.9 | 16.0 | 4.2 | 3078.2 | 3119.5 | 21.4 | 24.5 | 8.6 |
| … … |
Notes. The complete catalog containing 41741 sources can be accessed in the online Supplementary material or at https://fast.bao.ac.cn/cms/article/271/ and https://zcp521.github.io/fashi, with additional columns available for download.

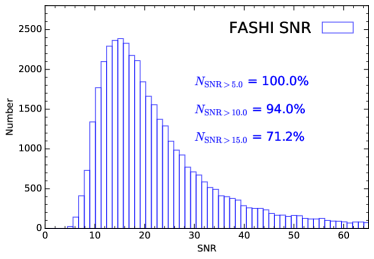
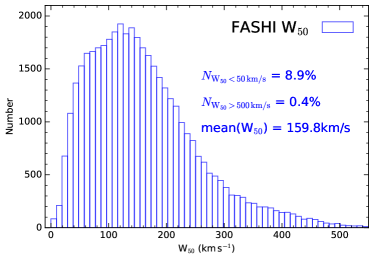
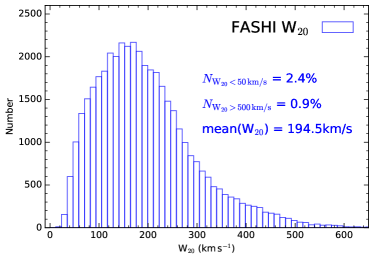
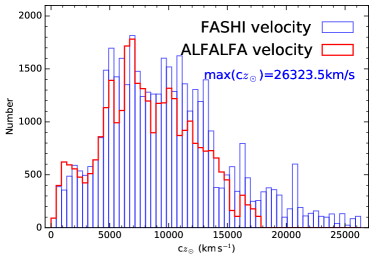
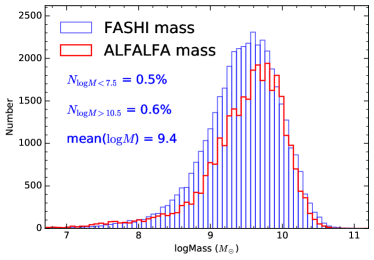
Table 2 presents the key findings of the FASHI extragalactic H I survey. The complete contents of Table 2 can be downloaded in the online Supplementary material or at https://fast.bao.ac.cn/cms/article/271/ and https://zcp521.github.io/fashi. It comprises of 41741 sources having multiple columns of observed and calculated parameters. The full online table provides high-precision and detailed information such as the centroid coordinate (J2000) in format of Jhhmmss.ssddmmss.s, spectral line central frequency in MHz, radio-defined velocity, integrated velocity range, detection sensitivity, and uncertainty. The introduction of each column in Table 2 and the parameters that are only included in the online table, are all introduced in the relevant column as follows:
-
•
Column 1: Index number for each FASHI extragalactic source. This index number is unique to each FASHI source.
-
•
Column 2-3: Right ascension (RA) and declination (DEC) in unit deg of FASHI source centroid (J2000). The distribution of the spatial flux of the sources often displays an irregular structure, or RFI and nearby objects can influence it, causing the source position offset to exceed the telescope pointing accuracy of approximately 7.9′′ (Jiang et al., 2020). However, it should generally be less than 1′, as evidenced by the position separation between FASHI and SDSS sources in Figure 9. For each FASHI source, the positional accuracy listed in the online table can be estimated by dividing the beam size (29) by the H I signal-to-noise ratio (e.g., Koribalski et al., 2004). In addition, the centroid coordinate (J2000) is only listed in the online table, formatted as Jhhmmss.ssddmmss.s.
-
•
Column 4: Heliocentric velocity of each H I source, c in unit of . Values have been converted to the optical definition from the “radio” one (). The c histogram of all FASHI sources is shown in Figure 4, where the strange gaps of the FASHI targets at 14300 are probably caused by relatively low sample completeness. The velocity uncertainty is estimated with , where is the spectral resolution, and is a measure of the steepness of the profile edges (Fouque et al., 1990; Koribalski et al., 2004). The spectral line centre frequency, radio velocity, redshift, and their uncertainties, corresponding to the heliocentric velocity, are only given in the online table.
-
•
Column 5: Ellipse, , with major, minor radius and position angle, in units of arcmin, arcmin, and degree, respectively. The ellipse indicates the measurement aperture of the integrated source in RA and DEC space for estimating the source flux. It does not represent the properties of the galaxy.
-
•
Column 6: Velocity width of the H I line profile, in , measured at 50% level of every peak by busy-function fitting. The uncertainty is estimated with . The histogram of FASHI sources is shown in Figure 4.
-
•
Column 7: Velocity width of the H I line profile, in , measured at 20% level of every peak by busy-function fitting. The uncertainty is estimated with . The histogram of FASHI sources is displayed in Figure 4.
-
•
Column 8: H I line flux intensity at the peak of each integrated spectrum, in mJy, measured by busy-function fitting. The uncertainty is estimated with the measured listed in Column 9.
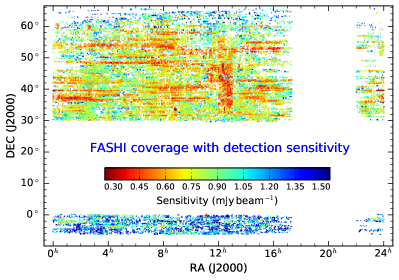
Figure 5: FASHI coverage and detection sensitivity. The detection sensitivity is estimated from each detected source with the H I line noise () in column 9 and the source size () in column 5 of Section 4.1. It roughly shows the distribution of the map rms for each velocity channel. -
•
Column 9: H I line noise level for the spatially integrated spectral profile, in mJy. The measurement was taken from the signal- and RFI-free sections of the integrated H I spectrum at a spectral resolution of 6.4 . Figure 4 displays the histogram of FASHI sources. Furthermore, we can estimate the detection sensitivity based on the H I line noise () of each detected source. At a spectral resolution of 6.4 , the median detection sensitivity is 0.76 . The detection sensitivity at each FASHI source is listed in the online table, while the relevant image is shown in Figure 5. As shown in Figure 5, the detection sensitivities at different regions are currently uneven due to the constraint of the adopted schedule-filler mode.
-
•
Column 10: Integrated H I line flux density, in by busy-function fitting. The SNR and log, respectively in Column 12 and 14, are calculated based on in this column rather than in Column 11. The uncertainty is estimated with , where is the channel number of each spectrum only including the H I signal, and .
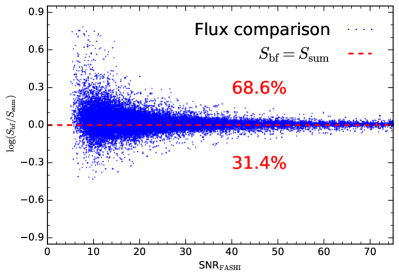
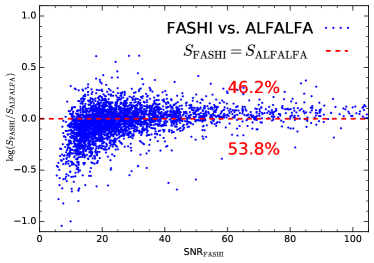
Figure 6: Comparisons of the measured integrated H I line flux density by busy function fitting () and direct summation of all velocity channels containing signal () from each integrated spectrum. The velocity ranges are only listed in the online table. The red dashed line indicates the position of . The percentages of occupied sources are shown below and above the red dashed line. -
•
Column 11: Integrated H I line flux density, in by summing all velocity channels containing signal within an appropriate velocity range from each integrated spectrum. Velocity ranges are only listed in the online table. Both and in Column 10 have the same level of uncertainty. Figure 6 illustrates the comparison of and at different signal-to-noise ratios (SNRs), revealing a noticeable systematic bias, particularly for sources with low SNR values (SNR 15). Among all sources, approximately one third exhibit measured flux densities () higher than the flux densities () obtained by summing velocity channels through busy-function fitting. The disparity among sources may have resulted from the combined effect of signal-to-noise ratio (SNR), baseline, integrated velocity range, and spectral profile, based on the examination of a large sample.
-
•
Column 12: Signal-to-noise ratio (SNR) of the detection, estimated as
(1) where is the integrated flux density in . is a smoothing width expressed as the number of spectral resolution bins of 6.4 bridging half of the signal width (e.g., Haynes et al., 2018). is the rms noise across the spectrum measured in mJy at 6.4 spectral resolution. The SNR histogram of FASHI sources is shown in Figure 4.
-
•
Column 13: Distance, in Mpc. For FASHI sources with c , their distance are estimated as c. Here, c is the recessional velocity measured in the Cosmic Microwave Background reference frame (Lineweaver et al., 1996) and H0 is the Hubble constant, which is adopted to be 75 Mpc-1. For objects with , we use the CF3 calculator (Graziani et al., 2019; Kourkchi et al., 2020). For objects with , we utilized the NAM calculator (Graziani et al., 2019; Kourkchi et al., 2020). The Cosmicflows-3 Distance-Velocity Calculator employs a hierarchical Bayesian model to deduce the peculiar velocity field and matter distribution within using the Cosmicflows-3 galaxy distance catalog (Graziani et al., 2019). Additionally, there are 869 nearby galaxies with individual distance measurements within 11 Mpc or corrected radial velocities (Karachentsev et al., 2013), which was applied to the distance estimate with the highest priority. The uncertainty in distance is estimated at 5% of the distance, with a focus on the Hubble constant’s uncertainty. Figure 3 shows the distance distribution of FASHI sources.
-
•
Column 14: Logarithm of the H I mass, log in unit of solar mass, computed via the formula (e.g., Meyer et al., 2017; Catinella et al., 2010)
(2) where the adopted distance is given in Column 13 of Table 2, and the factor is applied for cosmological corrections (e.g., Haynes et al., 2018). The error on the mass of H I is estimated by combining the uncertainties in distance and integrated flux density. Figure 4 shows the mass histogram of FASHI sources.
4.2 Comparison with ALFALFA sources
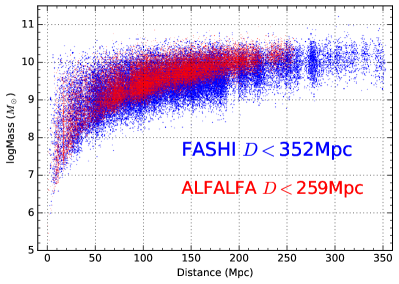
The spatial distribution of the FASHI, ALFALFA, and HIPASS sources is shown in Figure 1. The current FASHI project focuses on the unobserved sky that the ALFALFA survey did not cover (see also Figure 2). Currently, the FASHI survey has detected a total of 41741 sources in 7600 deg2 (or 5.5 sources per deg2), while the ALFALFA survey observed 31502 objects in 7000 deg2 (or 4.5 sources per deg2). Although HIPASS has covered a larger area of the sky compared to FASHI, it has only detected 5374 H I sources. The FASHI and ALFALFA mass-distance diagrams are presented in Figure 3. The FASHI has detected sources located at greater distances (see also Figure 2) and sources with lower masses than the ones detected by ALFALFA at different distances (see also Figure 4). This indicates that FASHI has better detection sensitivity compared to the ALFALFA H I survey.
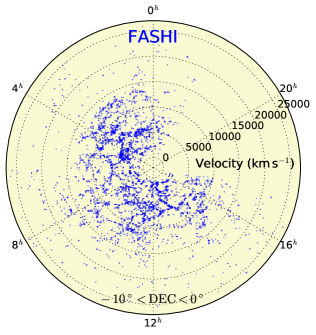
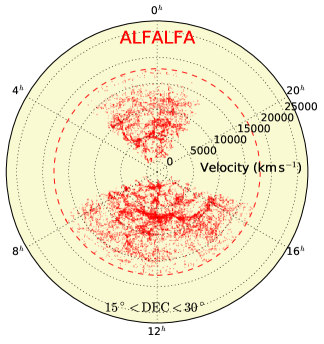
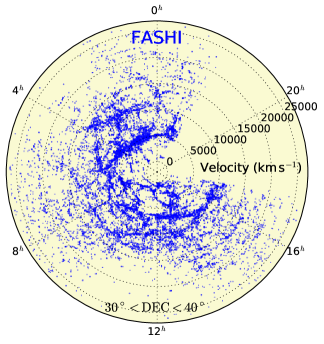
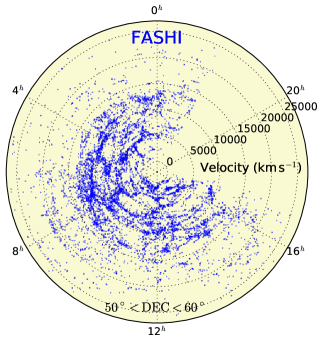
Figure 2 shows the distribution of large-scale structures from FASHI and ALFALFA sources in different declination ranges. It covers and extends to a c range of 26323 . The FASHI data shows clearer structures from void to filament compared to the ALFALFA data. The FASHI filamentary structure is much more elongated than that of the ALFALFA in different declination spaces due to the better RA coverage in FASHI. The new FASHI data would contribute important clues to investigate the large-scale process of local universe evolution.
The histograms of the measured spectral noise level (), signal to noise ratio (SNR), line width ( and ), heliocentric velocity (c) and source mass distributions for the released FASHI and ALFALFA catalogs are displayed in Figure 4. Some useful statistical results of the FASHI sources are given in each panel. For comparison, the source mass measured by ALFALFA has been roughly corrected with the same Hubble constant as that used by FASHI. The velocity and mass histograms suggest a little lower source count for FASHI compared to ALFALFA in certain velocity and mass () ranges. This discrepancy may be due to the removal of 2000 candidates from the current published catalogue due to severe RFI on some frequencies and unreliable sources. Li et al. (2022) shows that ALFALFA could underestimate the number of low HI mass galaxies below due to cosmic variance, while the FASHI has detected more sources in the mass range of than the ALFALFA. FASHI can detect more low mass galaxies and improve this. The FASHI will eventually provide a larger H I population of low-mass galaxies than the ALFALFA when the 2000 candidates are confirmed with high detection sensitivities.
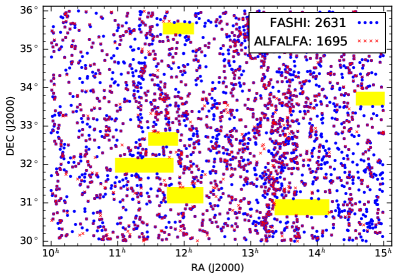
The comparison of all the FASHI and ALFALFA detected source distributions within the ranges of and is shown in Figure 7. The FASHI and ALFALFA detected source numbers are 2631 and 1695, respectively. This indicates that within the same region, the FASHI detected source number is approximately 1.5 times higher than the ALFALFA source number. However, we must acknowledge that the current FASHI catalog also fails to detect some sources. For instance, within the ranges of and , the FASHI catalog fails to detect approximately 120 sources. This accounts for around 7.0% of the total sources and is mainly due to three reasons. Firstly, FASHI was unable to detect faint sources due to a high level of noise in certain areas. Such unreliable and low-quality sources were removed from the current FASHI catalog. These sources require additional verification through future optical and H I observations. Secondly, FASHI observations have not yet effectively covered some of ALFALFA’s regions due to serious RFI and limited observation time. Thirdly, there is a very small number (1%) of ALFALFA catalog samples that even at high sensitivity, FASHI was unable to detect.
| FASHI | ALFALFA | ||||||
| FASHI ID | RA | DEC | c | AGCNr | RA | DEC | c |
| deg | deg | deg | deg | ||||
| 20230013594 | 162.753 | 36.195 | 7131.45 | 5951 | 162.766 | 36.179 | 7109 |
| 20230013570 | 213.934 | 36.177 | 7408.96 | 245480 | 213.943 | 36.172 | 7427 |
| 20230013560 | 8.515 | 36.171 | 4809.24 | 104543 | 8.502 | 36.165 | 4809 |
| 20230013506 | 167.184 | 36.169 | 8246.72 | 216420 | 167.186 | 36.170 | 8177 |
| 20230058952 | 41.349 | 36.163 | 14472.05 | 124857 | 41.349 | 36.163 | 14466 |
| 20230054697 | 45.278 | 36.162 | 8158.04 | 132238 | 45.288 | 36.162 | 8207 |
| 20230052360 | 210.480 | 36.162 | 5123.18 | 245319 | 210.491 | 36.171 | 5141 |
| 20230013536 | 36.907 | 36.157 | 10740.81 | 1919 | 36.904 | 36.156 | 10755 |
| 20230013521 | 146.329 | 36.151 | 6555.41 | 190478 | 146.345 | 36.157 | 6537 |
| 20230013518 | 214.888 | 36.149 | 7419.97 | 9173 | 214.900 | 36.151 | 7426 |
| … … | |||||||
Notes. The full catalog including 3620 sources could be downloaded in the online Supplementary material or at https://fast.bao.ac.cn/cms/article/271/ and https://zcp521.github.io/fashi.

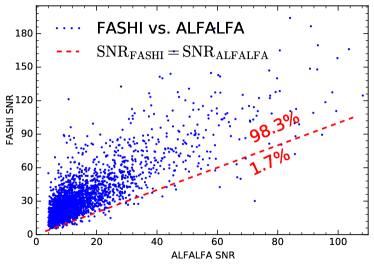

Through cross-matching FASHI and ALFALFA sources while satisfying the condition of , and , we obtained a total of 3620 sources. The cross-matching results are presented in Table 3. The entire catalog is available for download online. This sample is sufficiently large for comparing the parameters between FASHI and ALFALFA sources. Figure 8 displays the comparison of the measured rms, SNR, integrated flux, and distance parameters between FASHI and ALFALFA sources using the cross-matched sample. According to Figure 8, it can be observed that a lower noise level is found in 88.3% of FASHI sources, and 98.3% of FASHI sources have higher SNR than cross-matched ALFALFA sources with the same spectral resolution of 10 . Furthermore, we find that the integrated flux distributions of the two survey sources are in good agreement. We also compared the integrated H I lines of these bright sources () with those obtained from ALFALFA. The FASHI’s integrated bright point sources show a flux excess of approximately 10% compared to the ALFALFA sources for sources with . Perhaps the FASHI sources, due to their extremely high sensitivity, include more tidal clouds and can provide a more accurate measurement for bright sources than the ALFALFA according to Hoffman et al. (2019). For sources with relatively low SNR (), the FASHI’s measured flux distribution is lower than that of the ALFALFA’s. Sources with low SNR are typically associated with very faint sources. Due to 98.3% of FASHI sources having better SNR compared to ALFALFA sources, the latter will have significantly lower SNR than the faint sources in FASHI. Measuring a very faint source often leads to high levels of uncertainties. It is possible that FASHI provides more accurate measurements than ALFALFA for faint sources (see also analysis in Jing et al., 2023).
In addition, the measured distances in Figure 8 show a consistent relationship after correction with between FASHI and ALFALFA, because ALFALFA source distances are estimated using a different Hubble constant H0 = 70 Mpc-1 from FASHI (see details for distance calculation in Sections 3.5 and 4.1). This further suggests that the released FASHI catalogs are highly reliable.
4.3 Optical counterparts
Due to the discrepancy between the spatial resolution of the optical image (typically 1′′) and the large beam size (29) of FAST, it may be difficult to detect trustworthy optical counterparts, especially for merging systems where only one H I target is present in the FASHI catalog but there are several optical galaxies at similar redshifts. Furthermore, the long extended H I tail of galaxies can be regarded as one H I bright target, which lacks clear optical counterparts. In order to identify reliable optical counterparts, conducting high-resolution H I follow-up observations is necessary. Nonetheless, this is excessively costly for large blind H I survey projects like FASHI. To gain an initial understanding of the FASHI galaxy properties, we cross-matched the FASHI targets with the findings of optical galaxy surveys.
To identify bright galaxy counterparts that may be saturated or masked in wide-field galaxy surveys such as the SDSS, we first compared the FASHI catalog with the local galaxy sample Siena Galaxy Atlas444https://www.legacysurvey.org/sga/sga2020/ (SGA), which contains 383620 galaxies with . For each FASHI H I target, we searched for SGA counterparts under the condition , and . If more than one candidate galaxy was present, we selected the optical counterpart with the shortest distance. From the SGA we obtained 14072 counterparts, which are listed in Table 4. For the other 27669 H I targets, we cross-matched with the SDSS spectroscopic redshift catalog (Abazajian et al., 2009) using the same strategy as for the SGA cross-match, yielding 2900 targets, which are listed in Table 5. In total, we found 16972 optical counterparts from the SGA and SDSS spectroscopic redshift catalogs.
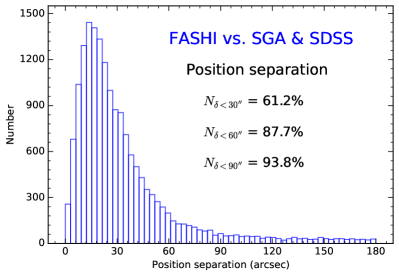
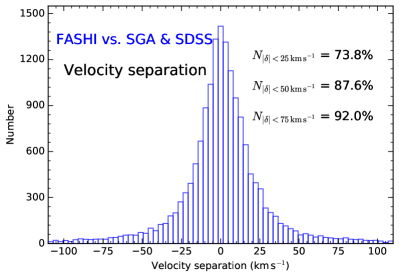
Figure 9 reports the measured position and velocity separations along with statistical results of the cross-matched sample of 16972 sources from the FASHI and SGA & SDSS projects. The statistical results indicate that the position and absolute velocity separations of 87.7% and 87.6%, respectively, of the FASHI sources are less than 60′′ and 50 compared to the cross-matched SGA & SDSS sources. The small offset between the FASHI sources and the optical counterparts suggests that the nearest candidates are statistically appropriate for our purpose. Both separations are consistent with the cross-match results obtained by the SGA and SDSS. The SGA and SDSS spectroscopic data are deemed highly reliable. This observation implies that FASHI sources have more accurate position and velocity measurements.
To obtain complete optical counterparts for all FASHI targets, we performed a further cross-match with the SDSS photometric catalog using CasJobs555http://mastweb.stsci.edu/mcasjobs/ to identify all SDSS galaxies within 3′ of each FASHI target. For each SDSS galaxy within the FAST beam (assuming the r-band Petrosian magnitude and the distance to the H I center is arcsec), we considered the probability of the serendipitous counterparts based on the surface number density in the r band, which is , where is the surface number density brighter than (Downes et al., 1986; Zhang et al., 2022b). If the SDSS target is faint, the expected number of galaxies that randomly appear in the area of would be high. Therefore, such a faint galaxy would be more likely to be randomly associated with the H I target and, thus, less likely to be the counterpart. Moreover, the distribution of the RA and DEC offset also shows that it is more likely to find counterparts with less center offset. Therefore, we treated the offset as a probability , assuming a Gaussian distribution of the offsets, with the center and from the SGA offset results. Thus, the optical counterpart probability () of each SDSS galaxy within the beam is . We emphasize that this is a relative probability used to filter out unlikely optical counterparts within the FAST beam.
Using the probability method above, we will always find an SDSS target as the most likely counterpart to the H I target. However, for the optically faint galaxies (Leisman et al., 2017; Xu et al., 2023b; Gray et al., 2023), the SDSS image is not deep enough to detect the targets, or the low surface brightness galaxies are not detected by the SDSS pipeline. On the other hand, for a H I target with SDSS coverage but no SDSS spec- counterparts, the optical counterpart would be fainter than . Finally, cross-matching with SDSS photometric data yielded 10975 optical counterparts. The derived results of the cross-match with the photometric catalog are listed in Table 6.
The FASHI coverage includes part of the Galactic plane where there is little SDSS coverage. Although these regions () are covered by the Pan-STARRS project, the crowded foreground star overlap and the strong dust extinction from the Milky Way limit the accuracy of the Galactic photometry. In this paper we have only matched the FASHI targets with SGA and SDSS, and have not identified optical counterparts for the remaining 13794 FASHI targets.
| FASHI | SGA | ||||||
| FASHI ID | RA | DEC | SGA | RA | DEC | ||
| deg | deg | deg | deg | ||||
| 20230000823 | 166.736 | -6.193 | 0.02269 | PGC1035830 | 166.738 | -6.183 | 0.02290 |
| 20230042079 | 165.515 | -6.178 | 0.03145 | PGC1035861 | 165.504 | -6.180 | 0.03160 |
| 20230060002 | 356.034 | -6.162 | 0.00704 | PGC072252 | 356.044 | -6.170 | 0.00704 |
| 20230000831 | 58.707 | -6.171 | 0.03664 | PGC1036048 | 58.703 | -6.163 | 0.03644 |
| 20230000832 | 169.267 | -6.141 | 0.04476 | PGC1036233 | 169.281 | -6.148 | 0.04532 |
| 20230000833 | 171.782 | -6.140 | 0.02999 | PGC035230 | 171.789 | -6.139 | 0.02995 |
| 20230000834 | 168.912 | -6.137 | 0.01945 | PGC1036364 | 168.917 | -6.137 | 0.02020 |
| … … | |||||||
Notes. The complete catalog including 14072 sources could be downloaded in the online Supplementary material or at https://fast.bao.ac.cn/cms/article/271/ and https://zcp521.github.io/fashi.
| FASHI | SDSS | ||||||
|---|---|---|---|---|---|---|---|
| FASHI ID | RA | DEC | OBJID | RA | DEC | ||
| deg | deg | deg | deg | ||||
| 20230053284 | 48.425 | -6.073 | 0.03144 | 1237649964065161287 | 48.429 | -6.084 | 0.03125 |
| 20230060070 | 37.368 | -5.847 | 0.04766 | 1237679439889301650 | 37.364 | -5.848 | 0.04810 |
| 20230060087 | 36.523 | -5.777 | 0.03241 | 1237679439888908518 | 36.530 | -5.781 | 0.03209 |
| 20230060106 | 35.641 | -5.708 | 0.03285 | 1237679341105971489 | 35.638 | -5.713 | 0.03276 |
| 20230001011 | 54.560 | -5.652 | 0.02203 | 1237652901845598378 | 54.566 | -5.659 | 0.02183 |
| 20230001046 | 54.542 | -5.535 | 0.02211 | 1237652901845598221 | 54.554 | -5.540 | 0.02215 |
| 20230060210 | 58.242 | -5.077 | 0.01724 | 1237652901847171254 | 58.241 | -5.080 | 0.01735 |
| … … | |||||||
Notes. The complete catalog including 2900 sources could be downloaded in the online Supplementary material or at https://fast.bao.ac.cn/cms/article/271/ and https://zcp521.github.io/fashi.
| FASHI | SDSS | ||||||
|---|---|---|---|---|---|---|---|
| FASHI ID | RA | DEC | OBJID | RA | DEC | ||
| deg | deg | deg | deg | ||||
| 20230042080 | 125.705 | -6.169 | 0.04885 | 1237674460407923463 | 125.731 | -6.163 | 0.848 |
| 20230042081 | 126.961 | -6.160 | 0.02162 | 1237673708252234978 | 126.971 | -6.155 | 0.936 |
| 20230000830 | 172.136 | -6.156 | 0.01670 | 1237671142014648688 | 172.146 | -6.146 | 0.994 |
| 20230000845 | 44.275 | -6.107 | 0.03168 | 1237679438818574478 | 44.286 | -6.143 | 0.969 |
| 20230000841 | 122.921 | -6.115 | 0.03842 | 1237673710935081236 | 122.928 | -6.125 | 0.996 |
| 20230060006 | 191.710 | -6.096 | 0.01264 | 1237671763173310839 | 191.721 | -6.116 | 0.860 |
| 20230042084 | 46.376 | -6.103 | 0.02957 | 1237679339500011708 | 46.377 | -6.101 | 0.999 |
| … … | |||||||
Notes. The complete catalog including 10975 sources could be downloaded in the online Supplementary material or at https://fast.bao.ac.cn/cms/article/271/ and https://zcp521.github.io/fashi.

To validate our matching method, we applied it to match the FASHI H I catalog to the SDSS spectroscopic redshift and SDSS photometric catalogs. We used the same methods as for the SGA catalog match and the SDSS photometry match. Since the spectroscopic redshift results are more reliable for the optical counterparts, we selected sources that have both photometry data and spectroscopic redshift. We then compared the photometry matching results with the spectroscopic redshift catalog. The derived distribution of the recovery rate of the counterparts is shown in Figure 10. We found that the recovery rate is about 80% for targets with AB mag, and the rate decreases for fainter targets.
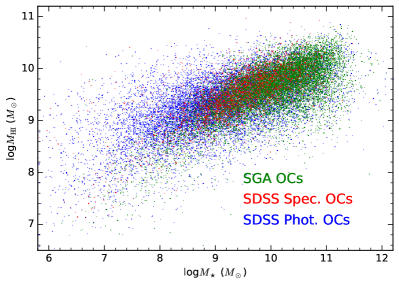
To provide a first overview of the optical properties of the FASHI sample, we present the H I and stellar mass diagram in Figure 11. The stellar mass was estimated using the mass-to-light ratio from Bell et al. (2003), with a factor of 1.6 applied to convert the Salpeter initial mass function (IMF) to the Chabrier IMF (Chabrier, 2003). As expected, the SGA counterparts are associated with more massive galaxies, while the SDSS photometric counterparts are mainly associated with less massive galaxies.
Since the SDSS photometric counterparts are mainly associated with low-mass galaxies, whose H I mass is also subject to detection reliability, it may be more effective to use future spectroscopic redshift survey projects, such as DESI (DESI Collaboration et al., 2022) and PFS (Wang et al., 2020), to identify fainter optical counterparts and explore their optical properties, rather than relying solely on improving the algorithm for selecting optical counterparts from the photometric catalog.
4.4 Extragalactic OH megamasers
OH Megamasers (OHM) are powerful sources of line emission detected at L band, originating from the starburst nuclei in merging galaxy systems (Darling & Giovanelli, 2002, 2006; Giovanelli & Haynes, 2015). Approximately 130 such sources have been discovered to date (e.g., Darling & Giovanelli, 2002; Haynes et al., 2018; Roberts et al., 2021; Suess et al., 2016). OHM lines shifted from their rest frequencies, which are 1612.231, 1665.402, 1667.359, and 1720.530 MHz, into the targeted H I bandpass may contaminate blind H I line surveys of the local universe. The FAST with its Ultra-Wide Bandwidth (UWB) receiver can simultaneously cover frequencies ranging from 500 to 3300 MHz and is expected to be an influential instrument for detecting OH emission from the Milky Way and extragalaxies (Zhang et al., 2023). For FASHI, the redshift range of the 1667.359 MHz OHM line corresponds to 0.150 0.278 within a frequency range of 1305-1450 MHz. Essentially, the extragalactic H I and OHM lines exhibit similar spectral profiles at various redshifts. Moreover, the 1612.231 and 1720.530 MHz lines are consistently too weak to be recognized by FASHI, and the 1665.402 and 1667.359 MHz lines blend together due to their broad line width. Therefore, it is impossible to distinguish them based solely on the line profile for large sample identifications. In cases where optical redshifts are provided, the OHM can be easily identified among the extracted H I candidates (refer to the OHM sample in Figure 12). Alternatively, we are considering employing WISE infrared colours and magnitudes to distinguish OHMs from H I line emitters (refer to Suess et al., 2016). The identified OHM candidates with optical redshifts have been removed from the FASHI catalog, and their details will be presented in a forthcoming work. It is likely to that there still exist OHM sources remaining in the current FASHI catalog.
4.5 Radio recombination lines
Radio recombination lines (RRLs) originate from gas ionized by young massive stars in the Galactic H II regions (Zhang et al., 2014, 2021; Hou et al., 2022). Galactic RRLs typically have narrower line widths (FWHM 50 ) than most extragalactic H I spectral lines (see RRL sample in Figure 12). The frequency band of FAST (1050-1450 MHz) can simultaneously cover at most 23 RRLs for H, C, and He (principal quantum number ), respectively. According to Zhang et al. (2021), 21 RRLs of H and C at 1050-1450 MHz have been simultaneously detected with strong emission signals. The FASHI coverage towards the Galactic direction can aid in building a more expansive sample of RRLs from the Milky Way. The RRLs from the FASHI data have been identified using the criteria that the same spatial position should have consistent flux density and line width at different transition frequencies. The line frequencies of 1326.792, 1350.414, 1399.368, and 1374.600 MHz are relevant within the frequency range of the currently released data (1305.5-1419.5 MHz). As the first released FASHI catalog concentrates on the extragalactic H I source, we have excluded the Galactic RRL targets from the catalog.
4.6 Galactic high velocity cloud
Galactic high velocity clouds (HVCs) are gas clouds located nearby the Galactic plane, which move at speeds ( ) substantially different from the rotation of the disk of the Milky Way galaxy (Adams et al., 2013, 2016; Moss et al., 2013; Verschuur, 1973). HVCs are thought to be clouds of material falling into the Galaxy from the outside the Galactic plane (Wakker & van Woerden, 1997). Additionally, HVCs might potentially have extragalactic origins and they may be very similar to the low-mass population of failed galaxies. HVCs share some features with the nearby extragalactic sources (Haynes et al., 2018). And it is not possible to identify any stellar counterparts in HVCs. Therefore, the first released FASHI catalog includes the HVCs, although these are not identified.
4.7 Accessing FASHI data
In addition to the catalog listed in Table 2, the corresponding integrated 1D H I line spectra and 2D moment maps for all sources have been extracted from the 3D fits cube over at least a 400 velocity channel window. The entire FASHI H I catalog will be made directly available to any user upon publication of this paper. The reduced 1D cubelets may be accessed reasonably by contacting the corresponding authors. The reduced 2D and 3D data cubes are currently provided only to internal users. Furthermore, all the raw data of the FASHI project will be freely accessible to any user after a twelve-month privileged period666The twelve-month privileged period is after each scan observation, not after the entire survey is completed. as per the FAST data release policy777See details in https://fast.bao.ac.cn/cms/article/129/.
5 Discussion
5.1 Reliability
The released catalog (Table 2) contains sources extracted using SoFiA at a 4.5 threshold. The sources were inspected through interactive manual source extraction for reliability, based on the 0th, 1st, and 2nd moments, integrated spectral profile, and SNR (). Human intervention was used to optimize the measurement accuracy and improve the catalog’s reliability by rejecting spurious detection that corresponds to low-level RFI, poorly sampled data, and residual baseline fluctuations. The optical counterpart of each source was identified and listed in Tables 4, 5, and 6 (see Section 4.3 for details). Sources located near the cube’s edge, blanked pixels, or frequency were removed. As a result, all published FASHI sources are of relatively high confidence.
5.2 Completeness
In the first released FASHI H I catalog, the sensitivities for detection displayed in Figure 5 are uneven across different regions. This is because FASHI could only use the schedule-filler time, as detailed in Section 2.2. As a result, the completeness becomes relatively low at a high detection sensitivity or at a relatively high redshift. Additionally, the strange gaps of the FASHI targets at 190, 210 and 266 Mpc are also resulted in a relatively low completeness. Moreover, approximately 2000 sources, which have low reliability due to low signal-to-noise ratio () or being located at the edge of velocity (channel) or spatial (pixel), have been removed from FASHI catalog and need more time for identification. Thus, if completeness analysis is needed, the completeness levels should be estimated at different detection sensitivity levels.
5.3 Caveats and comments
Despite the high quality of most FASHI data, caution should be exercised when using the source catalog presented in Table 2. Some of caveats and comments are listed below:
-
•
Caveats: In some double peak spectra in FASHI data, the W50 values measured by busy-function are multiple times lower than the W20 values when the lower peak intensity is less than 50% of the higher peak intensity. If using such W50 values for calculations and statistics, they should be further corrected. There are approximately 2000 sources that have low reliability due to low signal-to-noise ratio () or being located at the edge of velocity (channel) or spatial (pixel). Low-reliability sources have been excluded from the current FASHI catalog. Future optical and H I observations need to be conducted to ensure their accuracy. Some negative sources (absorption lines) have been detected, but they are not included in this released catalog. More time is required for the data reduction of the negative H I sources.
-
•
The FASHI project covers certain regions of the Milky Way galaxy. Despite our best efforts, some of the Galactic RRLs might still be present in the catalog. Additionally, the extragalactic OHMs have been excluded from the catalog only if the SDSS catalog contains a matching known spectroscopic redshift.
6 Summary
The FASHI project intends to scan the entire sky visible from the FAST observatory, which covers an area of approximately 22000 square degrees across a declination range of to . The FASHI project is expected to detect over 105 H I sources across the portion of the FAST sky with a frequency range of 1050-1450 MHz. This detection was possible up to a redshift of . FASHI has surveyed an area of approximately 7600 square degrees from August 2020 to June 2023. The median detection sensitivity achieved was 0.76 at a resolution of 6.4 at 1.4 GHz. The frequency range used for the search was approximately 1305.5-1419.5 MHz. In total, 41741 H I sources were detected and identified. Our detection rate is 5.5 sources per deg2, which is slightly higher than that of the ALFALFA survey. This is thanks to the higher sensitivity of FAST. FASHI is sampling a wide range of hosts galaxies from local, very low H I mass dwarfs to gas-rich massive galaxies seen to . The FASHI survey provides the largest extragalactic H I catalog, offering an unbiased view of H I content and structures in the universe. Up to now, FASHI is the most sensitive, comprehensive, and previously unheard of blind extragalactic H I survey of the FAST sky, with a higher spectral and spatial resolution, and broader coverage than the ALFALFA. We cross-matched SGA and SDSS spectroscopic redshift data, together with SDSS photometric data, to identify optical counterparts for 27947 FASHI sources. Approximately 59.3% of the complete FASHI catalog lacks coverage by any spectroscopic redshift survey. This presents a large number of candidates for future spectroscopic redshift and photometric surveys, such as DESI and PFS.
Acknowledgements
This work is supported by the National Key R&D Program of China (Nos. 2018YFE0202900 and 2022YFA1602901). CPZ acknowledges support by the West Light Foundation of the Chinese Academy of Sciences (CAS). CC is supported by the National Natural Science Foundation of China, Nos. 11803044, 11933003, and 12173045. This work is sponsored (in part) by the Chinese Academy of Sciences (CAS), through a grant to the CAS South America Center for Astronomy (CASSACA). We acknowledge the science research grants from the China Manned Space Project with No. CMS-CSST-2021-A05. FAST is a Chinese national mega-science facility, operated by the National Astronomical Observatories of Chinese Academy of Sciences (NAOC). The Siena Galaxy Atlas was made possible by funding support from the U.S. Department of Energy, Office of Science, Office of High Energy Physics under Award Number DE-SC0020086 and from the National Science Foundation under grant AST-1616414. Funding for the Sloan Digital Sky Survey IV has been provided by the Alfred P. Sloan Foundation, the U.S. Department of Energy Office of Science, and the Participating Institutions. SDSS acknowledges support and resources from the Center for High-Performance Computing at the University of Utah. The SDSS web site is www.sdss4.org. SDSS is managed by the Astrophysical Research Consortium for the Participating Institutions of the SDSS Collaboration including the Brazilian Participation Group, the Carnegie Institution for Science, Carnegie Mellon University, Center for Astrophysics — Harvard & Smithsonian (CfA), the Chilean Participation Group, the French Participation Group, Instituto de Astrofísica de Canarias, The Johns Hopkins University, Kavli Institute for the Physics and Mathematics of the Universe (IPMU) / University of Tokyo, the Korean Participation Group, Lawrence Berkeley National Laboratory, Leibniz Institut für Astrophysik Potsdam (AIP), Max-Planck-Institut für Astronomie (MPIA Heidelberg), Max-Planck-Institut für Astrophysik (MPA Garching), Max-Planck-Institut für Extraterrestrische Physik (MPE), National Astronomical Observatories of China, New Mexico State University, New York University, University of Notre Dame, Observatório Nacional / MCTI, The Ohio State University, Pennsylvania State University, Shanghai Astronomical Observatory, United Kingdom Participation Group, Universidad Nacional Autónoma de México, University of Arizona, University of Colorado Boulder, University of Oxford, University of Portsmouth, University of Utah, University of Virginia, University of Washington, University of Wisconsin, Vanderbilt University, and Yale University.
The authors declare that they have no conflict of interest.
References
- Abazajian et al. (2009) Abazajian, K. N., Adelman-McCarthy, J. K., Agüeros, M. A., et al. 2009, ApJS, 182, 543
- Adams et al. (2013) Adams, E. A. K., Giovanelli, R., & Haynes, M. P. 2013, ApJ, 768, 77
- Adams et al. (2016) Adams, E. A. K., Oosterloo, T. A., Cannon, J. M., Giovanelli, R., & Haynes, M. P. 2016, A&A, 596, A117
- Adams et al. (2015) Adams, E. A. K., Faerman, Y., Janesh, W. F., et al. 2015, A&A, 573, L3
- Ai & Zhu (2018) Ai, M., & Zhu, M. 2018, ApJ, 862, 48
- Baek et al. (2015) Baek, S.-J., Park, A., Ahn, Y.-J., & Choo, J. 2015, The Analyst, 140 1, 250
- Barnes et al. (2001) Barnes, D. G., Staveley-Smith, L., de Blok, W. J. G., et al. 2001, MNRAS, 322, 486
- Bell et al. (2003) Bell, E. F., McIntosh, D. H., Katz, N., & Weinberg, M. D. 2003, ApJS, 149, 289
- Branchini et al. (1999) Branchini, E., Teodoro, L., Frenk, C. S., et al. 1999, MNRAS, 308, 1
- Catinella et al. (2010) Catinella, B., Schiminovich, D., Kauffmann, G., et al. 2010, MNRAS, 403, 683
- Chabrier (2003) Chabrier, G. 2003, PASP, 115, 763
- Chambers et al. (2016) Chambers, K. C., Magnier, E. A., Metcalfe, N., et al. 2016, arXiv e-prints, arXiv:1612.05560
- Cheng et al. (2020) Cheng, C., Ibar, E., Du, W., et al. 2020, A&A, 638, L14
- Condon et al. (1998) Condon, J. J., Cotton, W. D., Greisen, E. W., et al. 1998, AJ, 115, 1693
- Darling & Giovanelli (2002) Darling, J., & Giovanelli, R. 2002, AJ, 124, 100
- Darling & Giovanelli (2006) Darling, J., & Giovanelli, R. 2006, AJ, 132, 2596
- DESI Collaboration et al. (2022) DESI Collaboration, Abareshi, B., Aguilar, J., et al. 2022, AJ, 164, 207
- Downes et al. (1986) Downes, A. J. B., Peacock, J. A., Savage, A., & Carrie, D. R. 1986, MNRAS, 218, 31
- Fouque et al. (1990) Fouque, P., Durand, N., Bottinelli, L., Gouguenheim, L., & Paturel, G. 1990, A&As, 86, 473
- Gavazzi et al. (2013) Gavazzi, G., Fumagalli, M., Fossati, M., et al. 2013, A&A, 553, A89
- Giovanelli & Haynes (2015) Giovanelli, R., & Haynes, M. P. 2015, A&A Rev., 24, 1
- Giovanelli et al. (2005) Giovanelli, R., Haynes, M. P., Kent, B. R., et al. 2005, AJ, 130, 2598
- Giovanelli et al. (2013) Giovanelli, R., Haynes, M. P., Adams, E. A. K., et al. 2013, AJ, 146, 15
- Gray et al. (2023) Gray, L. M., Rhode, K. L., Leisman, L., et al. 2023, AJ, 165, 197
- Graziani et al. (2019) Graziani, R., Courtois, H. M., Lavaux, G., et al. 2019, MNRAS, 488, 5438
- Han et al. (2021) Han, J. L., Wang, C., Wang, P. F., et al. 2021, Research in Astronomy and Astrophysics, 21, 107
- Haynes et al. (2011) Haynes, M. P., Giovanelli, R., Martin, A. M., et al. 2011, AJ, 142, 170
- Haynes et al. (2018) Haynes, M. P., Giovanelli, R., Kent, B. R., et al. 2018, ApJ, 861, 49
- Hoffman et al. (2019) Hoffman, G. L., Dowell, J., Haynes, M. P., & Giovanelli, R. 2019, AJ, 157, 194
- Hou et al. (2022) Hou, L., Han, J., Hong, T., Gao, X., & Wang, C. 2022, Science China Physics, Mechanics, and Astronomy, 65, 129703
- Huang et al. (2012b) Huang, S., Haynes, M. P., Giovanelli, R., & Brinchmann, J. 2012b, ApJ, 756, 113
- Huang et al. (2012a) Huang, S., Haynes, M. P., Giovanelli, R., et al. 2012a, AJ, 143, 133
- Janesh et al. (2017) Janesh, W., Rhode, K. L., Salzer, J. J., et al. 2017, ApJ, 837, L16
- Janesh et al. (2015) Janesh, W., Rhode, K. L., Salzer, J. J., et al. 2015, ApJ, 811, 35
- Janowiecki et al. (2015) Janowiecki, S., Leisman, L., Józsa, G., et al. 2015, ApJ, 801, 96
- Jiang et al. (2019) Jiang, P., Yue, Y., Gan, H., et al. 2019, Science China Physics, Mechanics, and Astronomy, 62, 959502
- Jiang et al. (2020) Jiang, P., Tang, N.-Y., Hou, L.-G., et al. 2020, Research in Astronomy and Astrophysics, 20, 064
- Jing et al. (2023) Jing, Y., Wang, J., Liu, Z., Zhu, M., & Jiang, P. 2023, SCPMA, prep, prep
- Jones et al. (2018) Jones, M. G., Haynes, M. P., Giovanelli, R., & Moorman, C. 2018, MNRAS, 477, 2
- Jones et al. (2016) Jones, M. G., Papastergis, E., Haynes, M. P., & Giovanelli, R. 2016, MNRAS, 457, 4393
- Kang et al. (2022) Kang, J., Zhu, M., Ai, M., Yu, H., & Sun, C. 2022, Research in Astronomy and Astrophysics, 22, 065019
- Karachentsev et al. (2013) Karachentsev, I. D., Makarov, D. I., & Kaisina, E. I. 2013, AJ, 145, 101
- Koribalski et al. (2004) Koribalski, B. S., Staveley-Smith, L., Kilborn, V. A., et al. 2004, AJ, 128, 16
- Koribalski et al. (2020) Koribalski, B. S., Staveley-Smith, L., Westmeier, T., et al. 2020, Ap&SS, 365, 118
- Kourkchi et al. (2020) Kourkchi, E., Courtois, H. M., Graziani, R., et al. 2020, AJ, 159, 67
- Leisman et al. (2017) Leisman, L., Haynes, M. P., Janowiecki, S., et al. 2017, ApJ, 842, 133
- Li et al. (2018) Li, D., Wang, P., Qian, L., et al. 2018, IEEE Microwave Magazine, 19, 112
- Li et al. (2022) Li, X., Li, C., Mo, H. J., Xiao, T., & Wang, J. 2022, ApJ, 941, 48
- Lineweaver et al. (1996) Lineweaver, C. H., Tenorio, L., Smoot, G. F., et al. 1996, ApJ, 470, 38
- Liu et al. (2023) Liu, Y., Zhu, M., Yu, H., et al. 2023, MNRAS, 523, 3905
- Martin et al. (2010) Martin, A. M., Papastergis, E., Giovanelli, R., et al. 2010, ApJ, 723, 1359
- Masters (2005) Masters, K. L. 2005, Galaxy flows in and around the Local Supercluster, PhD thesis, Cornell University, New York
- Masters et al. (2006) Masters, K. L., Springob, C. M., Haynes, M. P., & Giovanelli, R. 2006, ApJ, 653, 861
- Meyer et al. (2004) Meyer, M. J., Zwaan, M. A., Webster, R. L., et al. 2004, MNRAS, 350, 1195
- Meyer et al. (2017) Meyer, M., Robotham, A., Obreschkow, D., et al. 2017, PASP, 34, 52
- Moorman et al. (2014) Moorman, C. M., Vogeley, M. S., Hoyle, F., et al. 2014, MNRAS, 444, 3559
- Moss et al. (2013) Moss, V. A., McClure-Griffiths, N. M., Murphy, T., et al. 2013, ApJS, 209, 12
- Nan et al. (2011) Nan, R., Li, D., Jin, C., et al. 2011, International Journal of Modern Physics D, 20, 989
- Odekon et al. (2016) Odekon, M. C., Koopmann, R. A., Haynes, M. P., et al. 2016, ApJ, 824, 110
- Oke & Gunn (1983) Oke, J. B., & Gunn, J. E. 1983, ApJ, 266, 713
- Qian et al. (2020) Qian, L., Yao, R., Sun, J., et al. 2020, The Innovation, 1, 100053
- Roberts et al. (2021) Roberts, H., Darling, J., & Baker, A. J. 2021, ApJ, 911, 38
- Serra et al. (2015) Serra, P., Westmeier, T., Giese, N., et al. 2015, MNRAS, 448, 1922
- Skrutskie et al. (2006) Skrutskie, M. F., Cutri, R. M., Stiening, R., et al. 2006, AJ, 131, 1163
- Springob et al. (2005) Springob, C. M., Haynes, M. P., Giovanelli, R., & Kent, B. R. 2005, ApJS, 160, 149
- Suess et al. (2016) Suess, K. A., Darling, J., Haynes, M. P., & Giovanelli, R. 2016, MNRAS, 459, 220
- Toribio et al. (2011) Toribio, M. C., Solanes, J. M., Giovanelli, R., Haynes, M. P., & Martin, A. M. 2011, ApJ, 732, 93
- Tully et al. (2016) Tully, R. B., Courtois, H. M., & Sorce, J. G. 2016, AJ, 152, 50
- Tully et al. (2009) Tully, R. B., Rizzi, L., Shaya, E. J., et al. 2009, AJ, 138, 323
- Tully et al. (2008) Tully, R. B., Shaya, E. J., Karachentsev, I. D., et al. 2008, ApJ, 676, 184
- Tully et al. (2013) Tully, R. B., Courtois, H. M., Dolphin, A. E., et al. 2013, AJ, 146, 86
- Verschuur (1973) Verschuur, G. L. 1973, A&A, 22, 139
- Wakker & van Woerden (1997) Wakker, B. P., & van Woerden, H. 1997, ARA&A, 35, 217
- Wang et al. (2020) Wang, S.-Y., Huang, P.-J., Chen, H.-Y., et al. 2020, in Society of Photo-Optical Instrumentation Engineers (SPIE) Conference Series, Vol. 11447, Society of Photo-Optical Instrumentation Engineers (SPIE) Conference Series, 114477V
- Westmeier et al. (2014) Westmeier, T., Jurek, R., Obreschkow, D., Koribalski, B. S., & Staveley-Smith, L. 2014, MNRAS, 438, 1176
- Westmeier et al. (2021) Westmeier, T., Kitaeff, S., Pallot, D., et al. 2021, MNRAS, 506, 3962
- Westmeier et al. (2022) Westmeier, T., Deg, N., Spekkens, K., et al. 2022, PASA, 39, e058
- Wong et al. (2006) Wong, O. I., Ryan-Weber, E. V., Garcia-Appadoo, D. A., et al. 2006, MNRAS, 371, 1855
- Xu et al. (2023a) Xu, C., Jing, Y., Wang, J., et al. 2023a, RAA, prep, prep
- Xu et al. (2022) Xu, C. K., Cheng, C., Appleton, P. N., et al. 2022, Nature, 610, 461
- Xu et al. (2023b) Xu, J.-L., Zhu, M., Yu, N., et al. 2023b, ApJ, 944, L40
- Yu et al. (2023a) Yu, H., Zhu, M., Xu, J.-L., et al. 2023a, MNRAS, 521, 2719
- Yu et al. (2023b) Yu, N.-P., Zhu, M., Xu, J.-L., et al. 2023b, MNRAS, 521, 737
- Zeng et al. (2021) Zeng, Q., Chen, X., Li, X., et al. 2021, MNRAS, 500, 2969
- Zhang et al. (2014) Zhang, C.-P., Wang, J.-J., Xu, J.-L., Wyrowski, F., & Menten, K. M. 2014, ApJ, 784, 107
- Zhang et al. (2021) Zhang, C.-P., Xu, J.-L., Li, G.-X., et al. 2021, Research in Astronomy and Astrophysics, 21, 209
- Zhang et al. (2022a) Zhang, C.-P., Xu, J.-L., Wang, J., et al. 2022a, Research in Astronomy and Astrophysics, 22, 025015
- Zhang et al. (2023) Zhang, C.-P., Jiang, P., Zhu, M., et al. 2023, Research in Astronomy and Astrophysics, 23, 075016
- Zhang et al. (2022b) Zhang, L., Vieira, J. D., Ajello, M., et al. 2022b, ApJ, 939, 117
- Zhou et al. (2023) Zhou, R., Zhu, M., Yang, Y., et al. 2023, ApJ, 952, 130
- Zhu et al. (2021) Zhu, M., Yu, H., Wang, J., et al. 2021, ApJ, 922, L21