Axion limits from the 10-year gamma-ray emission 1ES 1215+303
Abstract
We present the limits on photon to axionlike particle (ALP) coupling from the 10-year period observations of the TeV BL Lacertae blazar 1ES 1215+303 (with redshift ). The contemporaneous gamma-ray spectra are measured by the collaborations Fermi-LAT and VERITAS with five flux phases from 2008 to 2017, including four low states and one flare. Using these flux phases, we show the spectral energy distributions (SEDs) under the null/ALP hypotheses and set the combined limit on ALP. The 95% combined limit set by 1ES 1215+303 with the 10-year gamma-ray data is roughly at the photon-ALP coupling constant for the ALP mass .
I Introduction
Axions are well motivated candidates for physics beyond the standard model (BSM) of particle physics. The QCD axion was first postulated to solve the strong CP problem in the SM Peccei and Quinn (1977a, b); Weinberg (1978); Wilczek (1978), which simultaneously provides a source for cold dark matter (CDM) through the misalignment mechanism Preskill et al. (1983); Abbott and Sikivie (1983); Dine and Fischler (1983). Additionally, the axionlike particle (ALP), arising in a variety of theories Arvanitaki et al. (2010); Svrcek and Witten (2006), is also attractive CDM candidate Cadamuro and Redondo (2012); Arias et al. (2012); Chao et al. (2022), but not associated to the solution of the strong CP problem.
The interaction between the ALP and very high energy (VHE) photon in the astrophysical magnetic fields could lead to some detectable effects, such as a reduced TeV opacity of the Universe Mirizzi et al. (2007); Fairbairn et al. (2011); Hooper and Serpico (2007); Simet et al. (2008). The VHE gamma-ray emissions from the extragalactic sources, , the active galactic nuclei (AGN), are mainly affected by the extragalactic background light (EBL) absorption effect through the electron-positron pair production process . In this case, the photon-ALP interaction provides a natural mechanism to reduce the EBL absorption Horns and Meyer (2012); Meyer et al. (2013). The common mechanism is considering the photon-ALP conversions and back-conversions in the different astrophysical magnetic fields Belikov et al. (2011); Dominguez et al. (2011); De Angelis et al. (2011); Horns et al. (2012); Wouters and Brun (2012); Marsh et al. (2022); Li (2022a); Carenza et al. (2023); Cao et al. (2023a), see also Ref. Galanti and Roncadelli (2022) for a review. If we observe a significant photon-ALP oscillation effect, then the Universe would appear to be more transparent than previously thought based on the pure EBL absorption Aharonian et al. (2007); Aliu et al. (2008). In addition, it also provides a natural mechanism to constrain the ALP properties with the ALP mass and the photon-ALP coupling constant Abramowski et al. (2013); Ajello et al. (2016); Kohri and Kodama (2017); Ivanov et al. (2019); Zhang et al. (2018); Liang et al. (2019); Libanov and Troitsky (2020); Long et al. (2020); Guo et al. (2021); Li et al. (2021, 2022); Cheng et al. (2021); Li (2022b); Dessert et al. (2022); Jacobsen et al. (2023); Li (2022c); Mastrototaro et al. (2022); Noordhuis et al. (2023); Li and Chao (2023); Pant et al. (2023); Gao et al. (2023a); Cao et al. (2023b); Gao et al. (2023b); Chattopadhyay et al. (2023); Caputo et al. (2023); O’HARE (2020).
In this paper, we investigate the photon-ALP oscillation effects from the TeV blazar 1ES 1215+303 with the 10-year period gamma-ray observations. The source 1ES 1215+303 (, , J2000), also known as other names, , Ton 605, ON 325, B2 1215+30, and S3 1215+30, is classified as an intermediate-frequency-peaked BL Lac (IBL) or a high-synchrotron-peaked BL Lac (HBL) object, which was first discovered at VHE by the MAGIC telescopes Aleksic et al. (2012). The redshift of this source was measured to be Paiano et al. (2017); Furniss et al. (2019), and we take in this work. Recently, its long-term contemporaneous gamma-ray spectra are measured by the collaborations Fermi-LAT and the Very Energetic Radiation Imaging Telescope Array System (VERITAS) with several low state and flare flux phases from 2008 to 2017 Valverde et al. (2020). Using these 10-year gamma-ray flux phases, we consider the photon-ALP oscillation effects on the gamma-ray spectral energy distributions (SEDs) and present the ALP limits in the plane.
This paper is organized as follows. In Sec. II, we describe the long-term gamma-ray data of 1ES 1215+303 and show the SEDs without the ALP. In Sec. III, we introduce the photon-ALP oscillation effects and set the combined limit on ALP with these gamma-ray spectra. The conclusion is given in Sec. IV.
II Long-term gamma-ray observations of 1ES 1215+303
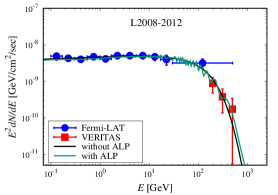
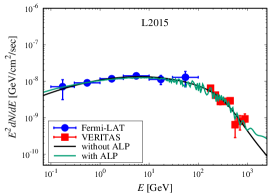
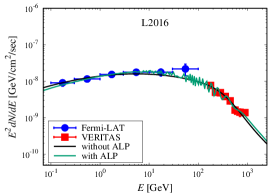
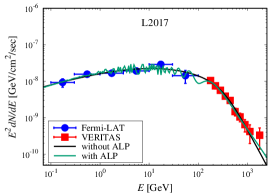
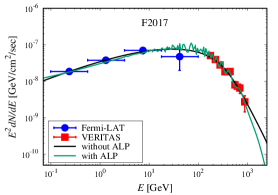
In this section, we describe the long-term TeV gamma-ray observations of 1ES 1215+303. In Ref. Valverde et al. (2020), the 10-year (2008-08-04 2017-09-05) non-flare gamma-ray spectra of 1ES 1215+303 measured by Fermi-LAT and VERITAS are defined as the flux phases L2008-2012, L2015, L2016, and L2017, respectively. Note that these four flux phases are low states of the source, and there are still several flares in the observations. Since the flares are almost either in GeV or TeV and have a short duration, we just consider one GeV-TeV flare in 2017, which is defined as the flux phase F2017. See Fig. 1 for the experimental data of Fermi-LAT and VERITAS.
In this work, the VHE gamma-ray intrinsic spectrum with the energy is selected as the power law with a superexponential cut-off (SEPWL) model, which is described by
| (1) |
where is a normalized constant, is the spectral index, , and are free parameters. Then the chi-square value is given by
| (2) |
where is the gamma-ray spectral point number, is the expected spectrum, and are the detected flux and its uncertainty, respectively, which is taken from the experimental data. Since the main effect on VHE photon in the extragalactic space is the EBL photon absorption effect with a factor , where is the optical depth, then the expected spectrum can be described by
| (3) |
In this work, the spectrum of the EBL is taken as the model Franceschini-08 Franceschini et al. (2008).
Then we show the best-fit TeV gamma-ray SEDs of 1ES 1215+303 in Fig. 1 with above five flux phases L2008-2012, L2015, L2016, L2017, and F2017. The black lines represent the best-fit SEDs under the null hypothesis. We also list the corresponding best-fit chi-square values in Table 1. Due to the large uncertainty in the observed spectrum of VERITAS, the value of the flux phase L2008-2012 is significantly lower than the other phases.
| Flux phase (points) | |||
|---|---|---|---|
| L2008-2012 (14) | 3.71 | 0.37 | 2.50 |
| L2015 (14) | 12.25 | 1.23 | 4.61 |
| L2016 (14) | 10.44 | 1.04 | 4.29 |
| L2017 (16) | 6.91 | 0.58 | 2.61 |
| F2017 (12) | 5.75 | 0.72 | 2.91 |
| combined | 39.06 | 28.50 |
III Photon-ALP oscillations
In the following, we consider the photon-ALP oscillation effects on the VHE gamma-ray propagations. Generally, in the homogeneous magnetic field, the photon-ALP oscillation probability is given by , where is the transverse magnetic field, is the oscillation wave number, and is the photon/ALP propagation direction. See also Refs. De Angelis et al. (2011); Li (2022a). When considering the propagation of photon-ALP from the gamma-ray source to the Earth, this process can be divided into three parts, () the source region, () the extragalactic space, and () the Milky Way. For the propagation distance , the final photon-ALP-photon oscillation probability is
| (4) |
where is the whole transfer matrix, , is the photon-ALP initial density matrix, and is the final density matrix.
We first discuss the photon-ALP oscillations in () the source region of 1ES 1215+303. As the BL Lac object, the blazar jet magnetic field can be described by the poloidal and toroidal components. We consider a transverse magnetic field model and a electron density model , where represents the distance between the source central black hole and the VHE emission region, and correspond to the core magnetic field and electron density at , respectively. The parameter is given by , with the radius of the VHE emission region , and the angle between the jet axis and the line of sight . For the jet region , the magnetic field is taken as zero. The energy transformation between the laboratory and co-moving frames, and , should also be considered with the Doppler factor . For the four low state flux phases of the source 1ES 1215+303 Valverde et al. (2020), we take , , , , , and ; While for the one flare flux phase, we take , and make other parameters unchanged. In addition, for the host galaxy region of 1ES 1215+303, we neglect the photon-ALP oscillations in this region.
Then in () the extragalactic space, the main effect on photon-ALP propagation is the EBL absorption effect on VHE photon through the pair-production process. Due to the weak magnetic field strength in this region, suggesting the upper limit Ade et al. (2016); Pshirkov et al. (2016), here we also neglect the photon-ALP oscillations.
While in () the Milky Way, we consider the photon-ALP oscillations again in the Galactic magnetic field. This magnetic field can be modeled as the disk and halo components (both parallel to the Galactic plane), and the “X-field” component (out-of-plane) at the Galactic center Jansson and Farrar (2012a, b); Adam et al. (2016).
After considering above photon-ALP oscillation effects, we can derive the final photon-ALP-photon oscillation probability for different ALP parameters . Then the expected gamma-ray spectrum under the ALP hypothesis is given by
| (5) |
where is the gamma-ray intrinsic spectrum. In this case , we have the chi-square value
| (6) |
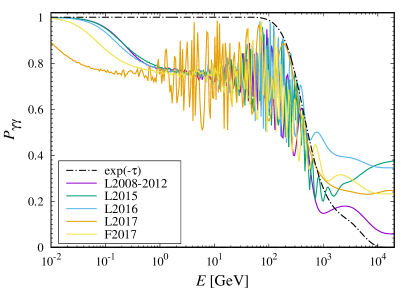
For one ALP parameters set, we can derive the corresponding best-fit chi-square . Then we can obtain a distribution of the best-fit chi-square in the plane, in which the minimum chi-square is defined as . We show the best-fit gamma-ray SEDs corresponding to in Fig. 1 (green lines) with the flux phases L2008-2012, L2015, L2016, L2017, and F2017. The values of in these phases are listed in Table 1. Compared with the null hypothesis (black lines), the minimum best-fit chi-square under the ALP hypothesis can be significantly depressed. We also show the distributions of the final photon-ALP-photon oscillation probability corresponding to in Fig. 2.
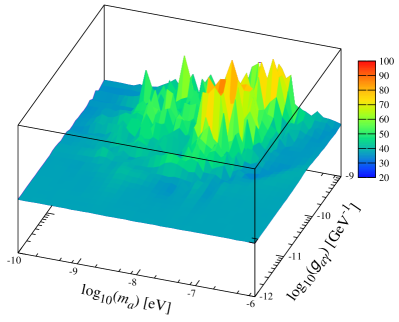
Here we set the combined limit on ALP with the five flux phases together. This is a common method of the ALP analysis for the same source with multiple flux phases Li et al. (2021). We show the best-fit chi-square distribution in the plane for the ALP combined analysis in Fig. 3. The corresponding best-fit chi-square values are also listed in Table 1.
In order to set the 95% confidence level () limit on ALP, , to obtain the threshold chi-square , we simulate 400 sets of the TeV gamma-ray observations of 1ES 1215+303 in the pseudoexperiments by Gaussian samplings to derive the test statistic (TS) distribution. The TS obeys the non-central chi-square distribution with the effective and the non-centrality , which is given by , where and are the best-fit chi-square of the null and ALP hypotheses in the Monte Carlo simulations, respectively. Generally, this TS distribution can be approximated with the ALP hypothesis and we use it to derive the 95% chi-square difference . Finally, we have the relation , corresponding to the 95% threshold chi-square.
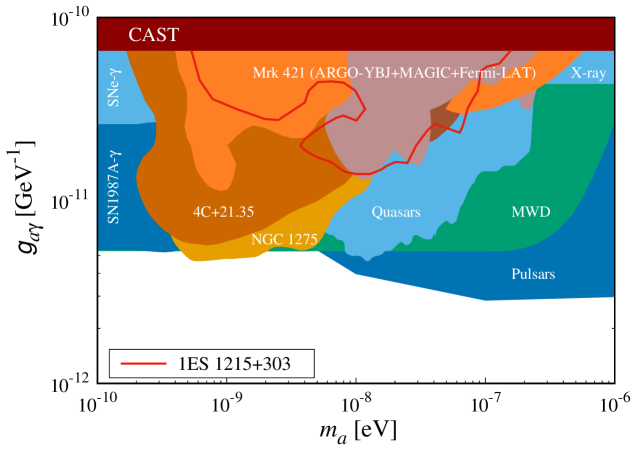
In our ALP combined analysis, we have the effective with the non-centrality , suggesting the threshold chi-square . Then we show the 95% combined limit result in the plane, see Fig. 4. The red contour represents the 95% combined limit set by 1ES 1215+303 with the 10-year gamma-ray observations measured by Fermi-LAT and VERITAS, which is roughly at the photon-ALP coupling constant
| (7) |
for the ALP mass
| (8) |
The other latest photon-ALP constraints in this plane are also shown, see Ref. O’HARE (2020) for more details.
Finally, we briefly comment on the impact of parameter uncertainties on the ALP limits. According to our previous studies Li et al. (2021, 2022), the parameters that have the greatest impact on the final results are the blazar jet magnetic field parameters and . Both large and will lead to more stringent limit. See also Ref. Li (2022c). In addition, the redshift uncertainty of the source also has an impact, both the underestimated and overestimated redshifts can affect the final results Li and Chao (2023).
IV Conclusion
In this paper, we have presented the photon-ALP limits from the 10-year period observations of the blazar 1ES 1215+303. The long-term TeV gamma-ray spectra are measured by Fermi-LAT and VERITAS with four low states (L2008-2012, L2015, L2016, and L2017) and one flare (F2017) from 2008 to 2017. For comparison, we show the SEDs of these flux phases under the null and ALP hypotheses. Then we set the 95% combined limit in the ALP parameters plane. The 95% photon-ALP combined limit set by 1ES 1215+303 is roughly at the photon-ALP coupling constant for the ALP mass . This result is consistent with the limits set by the long-term gamma-ray observations of the source Mrk 421 Li et al. (2021, 2022).
Acknowledgments. We thank Qi Feng, Janeth Valverde, and Olivier Hervet for generously sharing the experimental data of Fermi-LAT and VERITAS with us. W.C. is supported by the National Natural Science Foundation of China (NSFC) (Grants No. 11775025 and No. 12175027). Y.F.Z. is supported by the National Key R&D Program of China (Grant No. 2017YFA0402204), the CAS Project for Young Scientists in Basic Research YSBR-006, and the NSFC (Grants No. 11821505, No. 11825506, and No. 12047503).
References
- Peccei and Quinn (1977a) R. Peccei and H. R. Quinn, Phys. Rev. D 16, 1791 (1977a).
- Peccei and Quinn (1977b) R. Peccei and H. R. Quinn, Phys. Rev. Lett. 38, 1440 (1977b).
- Weinberg (1978) S. Weinberg, Phys. Rev. Lett. 40, 223 (1978).
- Wilczek (1978) F. Wilczek, Phys. Rev. Lett. 40, 279 (1978).
- Preskill et al. (1983) J. Preskill, M. B. Wise, and F. Wilczek, Phys. Lett. B 120, 127 (1983).
- Abbott and Sikivie (1983) L. Abbott and P. Sikivie, Phys. Lett. B 120, 133 (1983).
- Dine and Fischler (1983) M. Dine and W. Fischler, Phys. Lett. B 120, 137 (1983).
- Arvanitaki et al. (2010) A. Arvanitaki, S. Dimopoulos, S. Dubovsky, N. Kaloper, and J. March-Russell, Phys. Rev. D 81, 123530 (2010), arXiv:0905.4720 [hep-th] .
- Svrcek and Witten (2006) P. Svrcek and E. Witten, JHEP 06, 051 (2006), arXiv:hep-th/0605206 .
- Cadamuro and Redondo (2012) D. Cadamuro and J. Redondo, JCAP 02, 032 (2012), arXiv:1110.2895 [hep-ph] .
- Arias et al. (2012) P. Arias, D. Cadamuro, M. Goodsell, J. Jaeckel, J. Redondo, and A. Ringwald, JCAP 06, 013 (2012), arXiv:1201.5902 [hep-ph] .
- Chao et al. (2022) W. Chao, M. Jin, H.-J. Li, and Y.-Q. Peng, (2022), arXiv:2210.13233 [hep-ph] .
- Mirizzi et al. (2007) A. Mirizzi, G. G. Raffelt, and P. D. Serpico, Phys. Rev. D 76, 023001 (2007), arXiv:0704.3044 [astro-ph] .
- Fairbairn et al. (2011) M. Fairbairn, T. Rashba, and S. V. Troitsky, Phys. Rev. D 84, 125019 (2011), arXiv:0901.4085 [astro-ph.HE] .
- Hooper and Serpico (2007) D. Hooper and P. D. Serpico, Phys. Rev. Lett. 99, 231102 (2007), arXiv:0706.3203 [hep-ph] .
- Simet et al. (2008) M. Simet, D. Hooper, and P. D. Serpico, Phys. Rev. D 77, 063001 (2008), arXiv:0712.2825 [astro-ph] .
- Horns and Meyer (2012) D. Horns and M. Meyer, JCAP 02, 033 (2012), arXiv:1201.4711 [astro-ph.CO] .
- Meyer et al. (2013) M. Meyer, D. Horns, and M. Raue, Phys. Rev. D 87, 035027 (2013), arXiv:1302.1208 [astro-ph.HE] .
- Belikov et al. (2011) A. V. Belikov, L. Goodenough, and D. Hooper, Phys. Rev. D 83, 063005 (2011), arXiv:1007.4862 [astro-ph.HE] .
- Dominguez et al. (2011) A. Dominguez, M. A. Sanchez-Conde, and F. Prada, JCAP 11, 020 (2011), arXiv:1106.1860 [astro-ph.CO] .
- De Angelis et al. (2011) A. De Angelis, G. Galanti, and M. Roncadelli, Phys. Rev. D 84, 105030 (2011), [Erratum: Phys.Rev.D 87, 109903 (2013)], arXiv:1106.1132 [astro-ph.HE] .
- Horns et al. (2012) D. Horns, L. Maccione, M. Meyer, A. Mirizzi, D. Montanino, and M. Roncadelli, Phys. Rev. D 86, 075024 (2012), arXiv:1207.0776 [astro-ph.HE] .
- Wouters and Brun (2012) D. Wouters and P. Brun, Phys. Rev. D 86, 043005 (2012), arXiv:1205.6428 [astro-ph.HE] .
- Marsh et al. (2022) M. C. D. Marsh, J. H. Matthews, C. Reynolds, and P. Carenza, Phys. Rev. D 105, 016013 (2022), arXiv:2107.08040 [hep-ph] .
- Li (2022a) H.-J. Li, JCAP 11, 045 (2022a), arXiv:2208.04605 [astro-ph.CO] .
- Carenza et al. (2023) P. Carenza, R. Sharma, M. C. D. Marsh, A. Brandenburg, and E. Ravensburg, Phys. Rev. D 108, 103029 (2023), arXiv:2208.04333 [hep-ph] .
- Cao et al. (2023a) Q.-H. Cao, Z. Liu, and J.-C. Wang, (2023a), arXiv:2307.15602 [hep-ph] .
- Galanti and Roncadelli (2022) G. Galanti and M. Roncadelli, Universe 8, 253 (2022), arXiv:2205.00940 [hep-ph] .
- Aharonian et al. (2007) F. Aharonian et al. (H.E.S.S.), Astron. Astrophys. 475, L9 (2007), arXiv:0709.4584 [astro-ph] .
- Aliu et al. (2008) E. Aliu et al. (MAGIC), Science 320, 1752 (2008), arXiv:0807.2822 [astro-ph] .
- Abramowski et al. (2013) A. Abramowski et al. (H.E.S.S.), Phys. Rev. D 88, 102003 (2013), arXiv:1311.3148 [astro-ph.HE] .
- Ajello et al. (2016) M. Ajello et al. (Fermi-LAT), Phys. Rev. Lett. 116, 161101 (2016), arXiv:1603.06978 [astro-ph.HE] .
- Kohri and Kodama (2017) K. Kohri and H. Kodama, Phys. Rev. D 96, 051701 (2017), arXiv:1704.05189 [hep-ph] .
- Ivanov et al. (2019) M. M. Ivanov, Y. Y. Kovalev, M. L. Lister, A. G. Panin, A. B. Pushkarev, T. Savolainen, and S. V. Troitsky, JCAP 02, 059 (2019), arXiv:1811.10997 [astro-ph.CO] .
- Zhang et al. (2018) C. Zhang, Y.-F. Liang, S. Li, N.-H. Liao, L. Feng, Q. Yuan, Y.-Z. Fan, and Z.-Z. Ren, Phys. Rev. D 97, 063009 (2018), arXiv:1802.08420 [hep-ph] .
- Liang et al. (2019) Y.-F. Liang, C. Zhang, Z.-Q. Xia, L. Feng, Q. Yuan, and Y.-Z. Fan, JCAP 06, 042 (2019), arXiv:1804.07186 [hep-ph] .
- Libanov and Troitsky (2020) M. Libanov and S. Troitsky, Phys. Lett. B 802, 135252 (2020), arXiv:1908.03084 [astro-ph.HE] .
- Long et al. (2020) G. Long, W. Lin, P. Tam, and W. Zhu, Phys. Rev. D 101, 063004 (2020), arXiv:1912.05309 [astro-ph.HE] .
- Guo et al. (2021) J. Guo, H.-J. Li, X.-J. Bi, S.-J. Lin, and P.-F. Yin, Chin. Phys. C 45, 025105 (2021), arXiv:2002.07571 [astro-ph.HE] .
- Li et al. (2021) H.-J. Li, J.-G. Guo, X.-J. Bi, S.-J. Lin, and P.-F. Yin, Phys. Rev. D 103, 083003 (2021), arXiv:2008.09464 [astro-ph.HE] .
- Li et al. (2022) H.-J. Li, X.-J. Bi, and P.-F. Yin, Chin. Phys. C 46, 085105 (2022), arXiv:2110.13636 [astro-ph.HE] .
- Cheng et al. (2021) J.-G. Cheng, Y.-J. He, Y.-F. Liang, R.-J. Lu, and E.-W. Liang, Phys. Lett. B 821, 136611 (2021), arXiv:2010.12396 [astro-ph.HE] .
- Li (2022b) H.-J. Li, JCAP 02, 025 (2022b), arXiv:2112.14145 [astro-ph.HE] .
- Dessert et al. (2022) C. Dessert, D. Dunsky, and B. R. Safdi, Phys. Rev. D 105, 103034 (2022), arXiv:2203.04319 [hep-ph] .
- Jacobsen et al. (2023) S. Jacobsen, T. Linden, and K. Freese, JCAP 10, 009 (2023), arXiv:2203.04332 [hep-ph] .
- Li (2022c) H.-J. Li, Phys. Lett. B 829, 137047 (2022c), arXiv:2203.08573 [astro-ph.HE] .
- Mastrototaro et al. (2022) L. Mastrototaro, P. Carenza, M. Chianese, D. F. G. Fiorillo, G. Miele, A. Mirizzi, and D. Montanino, Eur. Phys. J. C 82, 1012 (2022), arXiv:2206.08945 [hep-ph] .
- Noordhuis et al. (2023) D. Noordhuis, A. Prabhu, S. J. Witte, A. Y. Chen, F. Cruz, and C. Weniger, Phys. Rev. Lett. 131, 111004 (2023), arXiv:2209.09917 [hep-ph] .
- Li and Chao (2023) H.-J. Li and W. Chao, Phys. Rev. D 107, 063031 (2023), arXiv:2211.00524 [hep-ph] .
- Pant et al. (2023) B. P. Pant, Sunanda, R. Moharana, and S. S., Phys. Rev. D 108, 023016 (2023), arXiv:2210.12652 [astro-ph.HE] .
- Gao et al. (2023a) L.-Q. Gao, X.-J. Bi, J.-G. Guo, W. Lin, and P.-F. Yin, (2023a), arXiv:2309.02166 [astro-ph.HE] .
- Cao et al. (2023b) Z. Cao et al. (LHAASO), Sci. Adv. 9, adj2778 (2023b), arXiv:2310.08845 [astro-ph.HE] .
- Gao et al. (2023b) L.-Q. Gao, X.-J. Bi, J. Li, R.-M. Yao, and P.-F. Yin, (2023b), arXiv:2310.11391 [astro-ph.HE] .
- Chattopadhyay et al. (2023) D. S. Chattopadhyay, B. Dasgupta, A. Dighe, and M. Narang, (2023), arXiv:2311.14298 [hep-ph] .
- Caputo et al. (2023) A. Caputo, S. J. Witte, A. A. Philippov, and T. Jacobson, (2023), arXiv:2311.14795 [hep-ph] .
- O’HARE (2020) C. O’HARE, “cajohare/axionlimits: Axionlimits,” (2020).
- Aleksic et al. (2012) J. Aleksic et al. (MAGIC), Astron. Astrophys. 544, A142 (2012), arXiv:1203.0490 [astro-ph.HE] .
- Paiano et al. (2017) S. Paiano, M. Landoni, R. Falomo, A. Treves, R. Scarpa, and C. Righi, Astrophys. J. 837, 144 (2017), arXiv:1701.04305 [astro-ph.GA] .
- Furniss et al. (2019) A. Furniss, G. Worseck, M. Fumagalli, C. A. Johnson, D. A. Williams, P. Pontrelli, and J. X. Prochaska, Astron. J. 157, 41 (2019).
- Valverde et al. (2020) J. Valverde et al. (Fermi-LAT, VERITAS), Astrophys. J. 891, 170 (2020), arXiv:2002.04119 [astro-ph.HE] .
- Franceschini et al. (2008) A. Franceschini, G. Rodighiero, and M. Vaccari, Astron. Astrophys. 487, 837 (2008), arXiv:0805.1841 [astro-ph] .
- Ade et al. (2016) P. Ade et al. (Planck), Astron. Astrophys. 594, A19 (2016), arXiv:1502.01594 [astro-ph.CO] .
- Pshirkov et al. (2016) M. Pshirkov, P. Tinyakov, and F. Urban, Phys. Rev. Lett. 116, 191302 (2016), arXiv:1504.06546 [astro-ph.CO] .
- Jansson and Farrar (2012a) R. Jansson and G. R. Farrar, Astrophys. J. 757, 14 (2012a), arXiv:1204.3662 [astro-ph.GA] .
- Jansson and Farrar (2012b) R. Jansson and G. R. Farrar, Astrophys. J. Lett. 761, L11 (2012b), arXiv:1210.7820 [astro-ph.GA] .
- Adam et al. (2016) R. Adam et al. (Planck), Astron. Astrophys. 596, A103 (2016), arXiv:1601.00546 [astro-ph.GA] .