Shapley Values-enabled Progressive Pseudo Bag Augmentation for Whole Slide Image Classification
Abstract
In computational pathology, whole slide image (WSI) classification presents a formidable challenge due to its gigapixel resolution and limited fine-grained annotations. Multiple instance learning (MIL) offers a weakly supervised solution, yet refining instance-level information from bag-level labels remains complex. While most of the conventional MIL methods use attention scores to estimate instance importance scores (IIS) which contribute to the prediction of the slide labels, these often lead to skewed attention distributions and inaccuracies in identifying crucial instances. To address these issues, we propose a new approach inspired by cooperative game theory: employing Shapley values to assess each instance’s contribution, thereby improving IIS estimation. The computation of the Shapley value is then accelerated using attention, meanwhile retaining the enhanced instance identification and prioritization. We further introduce a framework for the progressive assignment of pseudo bags based on estimated IIS, encouraging more balanced attention distributions in MIL models. Our extensive experiments on CAMELYON-16, BRACS, and TCGA-LUNG datasets show our method’s superiority over existing state-of-the-art approaches, offering enhanced interpretability and class-wise insights. We will release the code upon acceptance.
1 Introduction
Recent advancements in digital pathology and artificial intelligence have significantly expanded the potential for analyzing whole-slide images (WSIs) in diagnostic contexts, prognostic evaluations, and various clinical tasks [2, 32, 4, 28, 27, 24, 40]. A key area within this domain is WSI classification [30, 3, 6, 8, 16, 12, 29], a fundamental and vital process distinguished by the gigapixel resolution of WSIs, setting it apart from typical natural image classification. This complexity necessitates specialized approaches like multiple instance learning (MIL) [25, 11, 47, 19, 43] for effective WSI classification, where at least a positive instance in one bag marks the bag positive, otherwise negative. Most of the current research in MIL builds on the essential idea of distilling more instance-level information from bag-level labels to auxiliarly train MIL models or further finetune feature encoders [36, 9, 31, 45, 46, 20]. In this paradigm, the attention score for each instance in the bag, derived from attention-based pooling [14], emerges as a logical choice for estimating the contribution of each instance, as we termed as instance importance score (IIS). For instance, CLAM [22] introduces an additional cluster branch founded on IIS estimated by attention scores to distinguish features via projection. Wang et al. [39] apply contrastive learning to facilitate the interaction of intra-WSI and inter-WSI information using attention scores to filter positive, negative, and hard negative instances. BCL [42] assigns slide-level labels to patches garnering the highest attention to finetune the feature encoder through an auxiliary patch classification task. Li et al. [18] selected instances with top-ranking attention scores for end-to-end MIL training, addressing the information bottleneck. Nevertheless, our empirical investigations, as illustrated in Figure 1 (a) and (b), expose the challenges encountered by attention-based MIL, namely: (1) Extreme distribution of attention, where a limited number of instances account for a majority ( 75%) of , leading to inadequate training. (2) Inaccurate ranking of positive instances, introducing noise for training or finetuning.
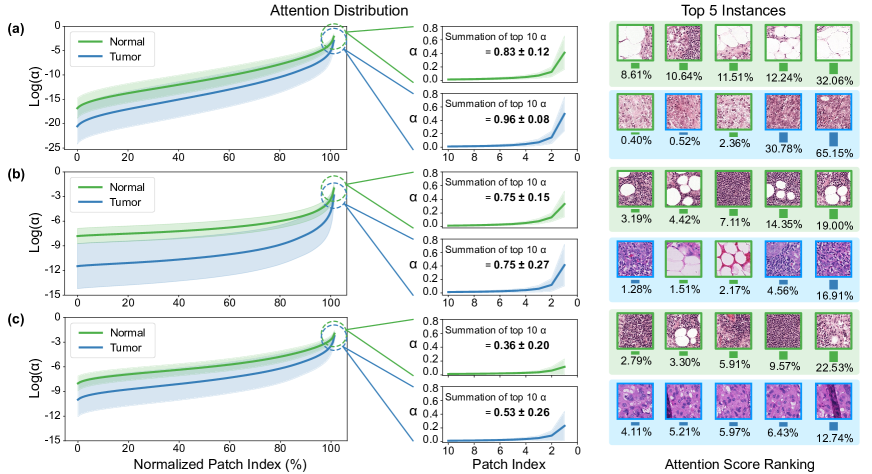
Addressing the challenge of extreme attention distribution, a notable strategy involves dividing the regular bag into several pseudo bags [33, 41]. This approach encourages MIL models to learn from a greater variety of bags. Existing pseudo bag-based approaches adopted a random partition strategy. For instance, DTFD [44] proposed a Tier-2 MIL model upon features distilled from pseudo bags to solve the mislabeling issue. As depicted in Figure 1 (b), DTFD smoothed out the attention distribution compared to other non-pseudo-bag-augmented MIL methods, which verifies the efficacy of pseudo bag augmentation to some extent. PseMix [21] combined the random pseudo bag assignment with the MixUp strategy for training. However, these methods fail to fundamentally solve the inherent mislabeling issue associated with random pseudo bag assignment.
In the context of the inaccurate instance ranking issue, the Shapley value offers a solution by quantifying the contribution of each instance based on its interactions with others [35, 26, 38]. Javed et al. [15] applied the Shapley value as an alternative to attention scores for MIL training and inference, considering it as the weighting score of each feature. However, this approach falls short of addressing the substantial computational demands of calculating Shapley values. Given their exponential complexity, these calculations often become prohibitively resource-intensive, posing a significant challenge in practical applications.
In this study, we introduce the Shapley value as a means of IIS estimation and accelerate its computation process under MIL principles. Then we propose a progressive pseudo bag augmented MIL framework termed PMIL, which incorporates progressive pseudo bag assignment based on estimated IIS. This approach divides a regular bag into a series of pseudo bags in a reasonable manner, thereby reducing the intrinsic noise associated with pseudo bag creation and improving the model’s generalization ability. In summary, our main contributions are as follows:
-
•
Acknowledging the limitations of attention score-based IIS in terms of ranking accuracy and interpretation, we introduce the Shapley value to measure IIS for the first time in the context of multiple instance learning.
-
•
With Shapley value-based IIS, We propose a progressive pseudo bag augmented multiple instance learning framework, effectively bolstering MIL performance.
-
•
Extensive experiments on the CAMELYON-16, BRACS, and TCGA-LUNG datasets demonstrate that our method outperformed other state-of-the-art methods and provided class-wise interpretation with Shapley value-based IIS.
2 Method
In this section, we will first retrospect the MIL paradigm and pseudo bag augmentation technique, then introduce Shapley value-based IIS to improve pseudo bag assignment, and finally propose our framework.
2.1 Problem and Notation
MIL in WSI classification. In this task, the training set of labeled WSIs is denoted as , where represents the -th bag (slide) comprising instances after feature extraction. Our objective is to learn the mapping: , where is the bag space, and is the label space. The conventional MIL classifier maps the aggregated bag-level representation to a prediction as:
| (1) |
where and represent the aggregator and the fully connected (FC) layer in the MIL classifier, respectively.
Attention-based MIL Methods. In attention-based MIL models, the attention score derived from the pooling operation proposed in [14] is commonly used to measure IIS. Specifically, the attention score, denoted as , is calculated for each instance in the bag, providing a measure of its significance in the overall classification decision. Thus, the attention-based aggregation can be expressed as:
| (2) |
where represents the attention score assigned to the -th instance in the -th bag. By incorporating these attention scores, the model not only improves its predictive accuracy but also offers insights into which instances most significantly influence the classification outcome.
Pseudo Bag Augmentation for MIL. Consider the pseudo bag augmented MIL, a regular bag is randomly split into pseudo bags, and each pseudo bag inherits the label from its parent bag, resulting in an expanded training set , where is the number of bags. By obtaining via Equation 1, the objective function for pseudo bag augmented MIL is defined:
| (3) |
where represents the parameter of the MIL classifier, and represents the cross-entropy loss function. Nevertheless, the label inherited from the parent bag does not always align with the actual label of the pseudo bag. Thus, the objective function in Equation 3 can be further divided into two parts:
| (4) | ||||
where is the number of pseudo bags with incorrectly assigned labels. Equation 4 reveals a trade-off between bolstering the diversity of instances and introducing extra noise. Existing MIL methods [33, 44, 21, 41] employ a strategy of randomly splitting bags into pseudo bags, leading to suboptimal outcomes.
2.2 Shapley Value-based IIS Estimation
Our observation in Figure1 reveals that might not accurately reflect the ranking of importance. Thus, we introduce the Shapley value as an alternative method in contrast to the attention score to estimate IIS:
| (5) | ||||
where is the -th feature in the -th bag to calculate Shapley value , is the full feature set of the -th bag, are all available subsets.
Upon scrutinizing Equation 5, the computational complexity of the original Shapley value formulation escalates exponentially with the number of instances, which is prohibitively time-intensive in WSI classification as each bag encompasses thousands of instances. To hasten this process, several methodologies have been developed to approximate Shapley values effectively [37, 23, 7, 1]. Notably, according to the principle of MIL, it is the positive instances that determine the bag label. Under this premise, we leave the less significant instances in the order of attention scores, and focus on rearranging the importance ranking of instances with high attention scores by their Shapley value-based IIS:
| (6) |
where and denote the instance subset with high and low attention scores, and is the universal set of all instances. For the sake of simplicity, the instance number in is set to , and the sampling number for is set to . Under the assumption that the reasoning time per bag for the model approximates a constant , we quantify the computational complexity of different IIS estimations:
| (7) |
| (8) |
| (9) |
where is the asymptotic lower bound of the computational complexity, and is the combination value. Derived from Equation 5, the calculation of the Shapley value involves exponential computational complexity, while that of the attention score exhibits linear complexity. By employing our approximation technique, we are capable of transforming the Shapley-based IIS computation into a linear complexity as depicted in Equation 9, while ensuring its ranking accuracy remains intact within the realm of multiple instance learning.
2.3 IIS-based Pseudo Bag Augmentation
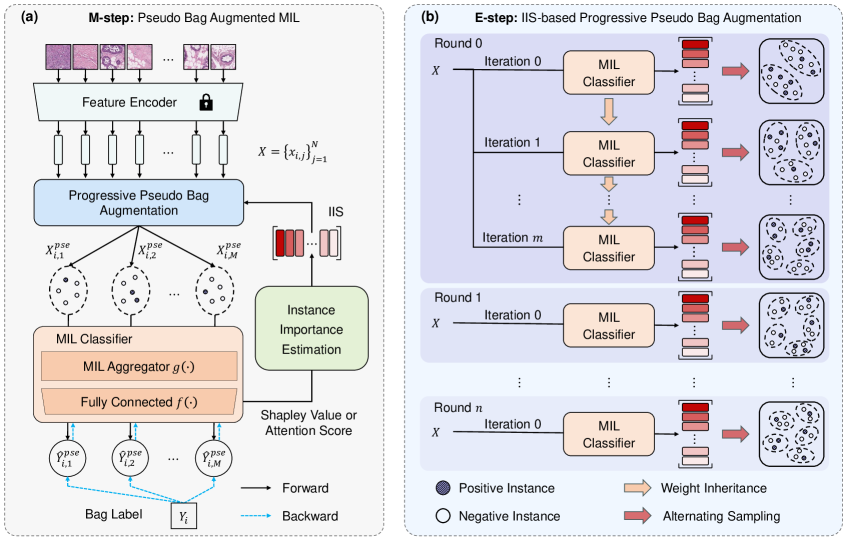
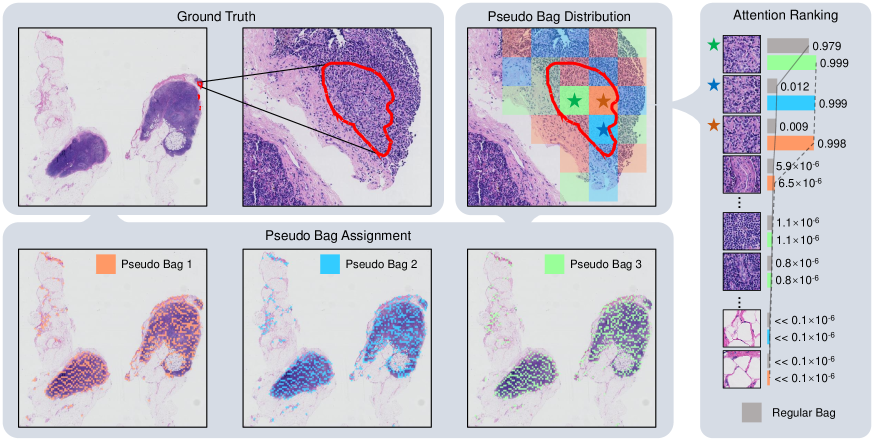
As illustrated in Figure 2 (b), instances within each bag are rearranged according to the ranking of IIS, denoted as . And these instances are evenly interleaved into pseudo bags by using the modulo function to constrain to satisfy , resulting in that each pseudo bag denotes as a sample from . By fixing the parameter of MIL models, the optimization of can be approximated as:
| (10) | ||||
where is the instance importance distribution of with estimated IIS and is Kullback-Leibler divergence function. Thus, the optimization of is translated to that of , where the IIS estimation plays a decisive role.
| Method | CAMELYON-16 | BRACS | TCGA-LUNG | ||||||
| ACC | AUC | F1 | ACC | AUC | F1 | ACC | AUC | F1 | |
| MeanMIL | |||||||||
| MaxMIL | |||||||||
| ABMIL [14] | |||||||||
| DSMIL [17] | |||||||||
| CLAM [22] | |||||||||
| TransMIL [34] | |||||||||
| DTFD [44] | |||||||||
| PMIL | |||||||||
Furthermore, it is important to consider progressive strategies concerning the quantity and initialization of pseudo bags. Splitting a regular bag into a large number of pseudo bags can introduce excessive noise, which may lead to training instability, particularly when regular bags contain only a limited number of positive instances. To address this issue, we progressively increase the number of pseudo bags once the MIL model converges during training:
| (11) | ||||
where signifies the convergence iteration, denotes the increment in the number of pseudo bags, and and represent the initial and maximum numbers of pseudo bags, respectively. In addition, the initial assignment of pseudo bags significantly influences subsequent training, especially when dealing with challenging datasets. To address this issue, we gradually leverage the well-trained MIL model from the previous round to enhance the initial pseudo bag augmentation by calculating instance importance scores.
2.4 Progressive Pseudo Bag Augmented MIL
Under the guidance of IIS estimated by Shapley values instead of attention scores used in the existing architectures, we propose a progressive pseudo bag augmented MIL framework termed PMIL. To alleviate the mislabeling issue in Equation 4, we incorporate the Expectation-Maximization (EM) algorithm [10] to obtain optimal pseudo bag label assignment. Specifically, the parameter of the MIL model can be learned via Equation 3 as the M-step, and the minimization problem for is translated into an assignment optimization for pseudo bags via Equation 10 as the E-step. As illustrated in Figure 2 (b), this iterative optimization is implemented within training rounds.
3 Experiments
3.1 Datasets and Evaluation Metrics
Our experimental setup employs three publicly available datasets to assess the performance of our proposed method.
CAMELYON-16 focuses on detecting lymph node metastasis in early-stage breast cancer. It comprises 399 WSIs, with 270 allocated for training and 129 for testing. The official training set follows a 5-fold cross-validation protocol to generate training and validation sets.
BRACS [5] is curated for breast cancer subtyping and contains 547 WSIs. The classification task involves benign tumors, atypical tumors (AT), and malignant tumors (MT). We adhere to the official dataset split, with 395 for training, 65 for validating, and 87 for testing. We conduct five separate experiments with different random seeds.
TCGA-LUNG comprises 1034 WSIs, encompassing 528 lung adenocarcinoma (LUAD) and 506 lung squamous cell carcinoma (LUSC) cases. We adopt a 5-fold cross-validation protocol for both training and testing.
We present the evaluation metrics as the mean one-versus-rest area under the curve (AUC), mean slide-level accuracy (ACC), and mean macro F1 score.
3.2 Implementation Details
In the preprocessing stage, we utilize OTSU’s thresholding method to detect and localize tissue regions for patch generation. We create non-overlapping patches measuring 256×256 pixels at magnifications of 20× for CAMELYON-16 and TCGA-LUNG, and 5× for BRACS. This process results in an average of approximately 7156, 11951, and 714 patches per bag for these datasets, respectively.
All experiments were performed on a workstation equipped with NVIDIA RTX 3090 GPUs. We employed ResNet50 [13] as the encoder and ABMIL [14] as the primary MIL model. The Adam optimizer, with a weight decay of 1e-5, was selected. We also implemented an early stopping strategy, setting the patience parameter to 20 epochs. The initial learning rate was established at 3e-4 and subsequently reduced to 1e-4 for fine-tuning purposes. For the CAMELYON-16 dataset, we limited the maximum number of pseudo bags to 8; for BRACS, the limit was 10; and for TCGA-LUNG, it was 14. The increment in the number of pseudo bags is set to 4. In terms of Shapley value computation acceleration, we set the parameter to 10 and to 3. The total EM training round is set to 10.
3.3 Evaluation and Comparison
We present the experimental results of our proposed PMIL framework built on the ABMIL [14] backbone for CAMELYON-16, BRACS, and TCGA-LUNG datasets, comparing them with the following methods: (1) Conventional instance-level MIL, including the Mean-Pooling MIL and Max-Pooling MIL. (2) The vanilla attention-based MIL, ABMIL [14]. (3) Two variants of ABMIL, including non-local attention pooling DSMIL [17], single-attention-branch CLAM-SB [22]. (4) transformer-based MIL, TransMIL [34]. (5) Pseudo bag augmented MIL, DTFD [44].
As shown in Table 1, our proposed PMIL framework demonstrates remarkable performance, achieving AUC scores of 90.1% for CAMELYON-16, 84.0% for BRACS, and 95.6% for TCGA-LUNG. These scores consistently exceed those of all other methods included in the comparison. Notably, on the complex BRACS dataset, our approach exhibits significant superiority. The generation of progressively refined pseudo bags contributes to enhanced training diversity and a reduction in the number of instances per bag. This strategy effectively improves the proficiency of the model in learning from positive instances.
3.4 Visualization and Class-Wise Interpretation
To assess the effectiveness of our progressive pseudo bag augmentation in shifting the network’s focus toward more positive instances, we analyzed the attention distribution of our method. Figure 1 (c) shows that PMIL achieves a more evenly spread attention distribution compared to ABMIL, CLAM, and DTFD. Additionally, the total of the top 10 attention scores is reduced to 0.36 in normal cases and to 0.53 in tumor cases. A specific instance of pseudo bag assignment in PMIL is depicted in Figure 3. In the case of micro-metastasis, PMIL successfully identifies three crucial patches. The random partitioning approach only has a 2/9 chance of accurately allocating positive instances across three different pseudo bags, which could otherwise contribute noise to the training. In contrast, our method confidently places these patches into pseudo bags, significantly increasing the diversity of positive instances.
| Metrics | CAMELYON-16 | BRACS | TCGA-LUNG | ||||||
| ACC | AUC | F1 | ACC | AUC | F1 | ACC | AUC | F1 | |
| Random | |||||||||
| Attention Score | |||||||||
| Shapley Value | |||||||||
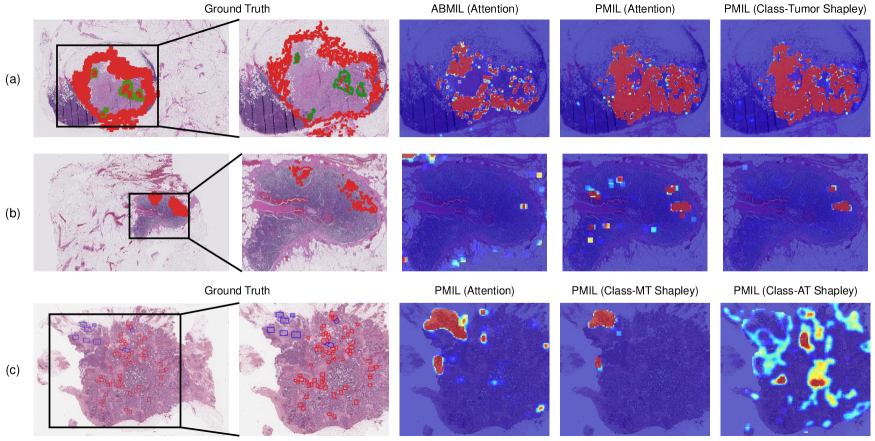
To emphasize the limitations of the attention score-based IIS, we conducted a comparative analysis, as illustrated in Figure 4 (a) and (b). In cases of macro metastasis, both ABMIL and our model show effective performance. However, in micro metastasis scenarios, the attention score-based IIS suggests that both ABMIL and our model erroneously focus on some noncancerous areas, which eludes logical interpretation. Conversely, using Shapley value-based IIS, our model precisely excludes noncancerous regions and accurately pinpoints cancerous areas.
Distinct from attention scores, the computation of Shapley values encompasses the entire MIL classifier, incorporating diverse category information, thereby enabling interpretations on a class-wise basis. As shown in Figure 4 (c), the IIS estimated by attention scores and class-MT Shapley values predominantly focus on malignant tumor regions. Meanwhile, the heatmaps generated using class-AT Shapley values predominantly emphasize atypical tumor regions, aligning with the slide-level labels. Although the heatmaps might not be entirely accurate for the BRACS dataset, this finding highlights the robust interpretability of Shapley value-based IIS in multiple classification tasks.
In summary, the visualization results indicate that while attention score-based IIS often produces a noisy ranking of instance importance and is limited to a single target category, Shapley value-based IIS ensures a more accurate ranking of instance importance and enables class-wise interpretations, leveraging the full capacity of the MIL classifier.
3.5 Ablation study
3.5.1 IIS Measure Metrics
In this ablation study, we evaluated both the attention score and the Shapley value as methods for estimating Instance Importance Scores (IIS) for subsequent training, using random splitting as the baseline for pseudo bag augmentation. According to the results presented in Table 2, Shapley value-based IIS estimation demonstrates superior performance on the CAMELYON-16 and TCGA-LUNG datasets. Conversely, on the BRACS dataset, the attention score-based estimation yielded better results. This variation in effectiveness is likely due to the direct acquisition of attention scores via pooling operations. In contrast, calculating the Shapley value requires an additional fully connected (FC) layer, which may be less robust when the overall performance of the MIL classifier is not particularly high. Therefore, the Shapley value estimation is more advantageous with datasets that pose fewer learning challenges.
| Pseudo Bag Strategy | CAMELYON-16 | BRACS | TCGA-LUNG | |||||||
| Number | Initialization | ACC | AUC | F1 | ACC | AUC | F1 | ACC | AUC | F1 |
| Constant | Constant | |||||||||
| Progressive | Constant | |||||||||
| Constant | Progressive | |||||||||
| Progressive | Progressive | |||||||||
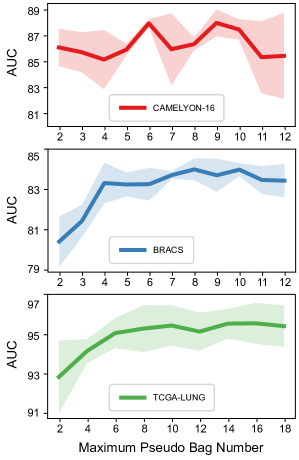
3.5.2 Maximum Pseudo Bag Number
The optimal number of pseudo bags, , varies across datasets due to differences in magnification levels of the patches and the sizes of tumor regions. As depicted in Figure 5, on the CAMELYON-16 dataset, our model exhibits peak performance with an of approximately 9, experiencing a sharp decline in effectiveness when exceeds this value. Similarly, the ideal or the BRACS and TCGA-LUNG datasets is found to be 10 and 14, respectively. The smaller on CAMELYON-16 can be attributed to the prevalence of micro metastasis slides containing few positive instances, even at a 20× magnification. In such scenarios, pseudo bag augmentation must balance between introducing additional noise to the training set and enhancing training diversity. Conversely, the larger cancer (subtype) regions in the BRACS and TCGA-LUNG datasets allow for division into more pseudo bags without compromising stability.
3.5.3 Progressive Pseudo Bag Augmentation
To ascertain the efficacy of progressively increasing the pseudo bag count and refining the initial pseudo bag assignment, we carried out a series of experiments. For this, we set the pseudo bag increment to 4, with the training rounds, as 5 for the CAMELYON-16 and TCGA-LUNG datasets, and extended to 10 for the more intricate BRACS dataset. The results, as indicated in Table 3, show that models incorporating both progressive tactics achieve the highest levels of performance. The CAMELYON-16 dataset is particularly sensitive to the number of pseudo bags, necessitating precise calibration to prevent the introduction of undue noise. Conversely, the BRACS dataset’s sensitivity lies in the initial setup of pseudo bags, owing to the challenge of distinguishing between subtypes. A more sophisticated initial setup significantly aids the model in accurately recognizing positive instances, leading to enhanced performance.
From these ablation studies, we summarize several key insights as follows:
Selection of IIS Metrics. The selection of IIS estimation methods depends on the characteristics of the dataset. While attention score-based IIS is commonly employed, its ranking accuracy can sometimes be compromised. In contrast, Shapley value-based IIS tends to show improved performance in less complex datasets as its effectiveness largely relies on precise classification outcomes.
Sensitivity to Maximum Pseudo Bag Number. The optimal maximum pseudo bag number varies with each dataset and is highly dependent on the number of positive instances present. For datasets with larger tumor regions within bags, a higher is recommended. On the other hand, in datasets with fewer positive instances per bag, a smaller is more effective, avoiding the introduction of unnecessary complexity.
Progressive Strategies. A progressive increase in the number of pseudo bags is effective for challenging datasets or those with only a limited number of positive instances in each bag. While this approach is less appealing for datasets with substantial tumor regions. Conversely, progressive initialization represents a significant improvement across various datasets, especially on more challenging ones.
4 Conclusion
In this study, we tackle attention-related challenges within multiple instance learning for whole slide image classification, particularly the extreme distribution of attention and inaccurate ranking of positive instances. To overcome these challenges, we introduce the Shapley value, which quantifies the contribution of each instance, to estimate IIS for the first time. This novel approach facilitates a more logical allocation of pseudo bags. Furthermore, we present a progressive pseudo bag augmented multiple instance learning framework that incorporates Shapley value-based IIS and utilizes the expectation-maximization algorithm. This approach systematically improves pseudo bag augmentation, thus significantly enhancing the efficacy of MIL. Extensive experiments on three publicly available datasets demonstrate that our methodology surpasses existing state-of-the-art techniques. Additionally, the Shapley value-based IIS offers valuable class-wise interpretability for pathological whole-slide images. In future research, we plan to investigate alternative metrics for the precise and efficient estimation of instance importance scores, aiming to further refine the robustness and versatility of our proposed framework.
References
- Ancona et al. [2019] Marco Ancona, Cengiz Oztireli, and Markus Gross. Explaining deep neural networks with a polynomial time algorithm for shapley value approximation. In International Conference on Machine Learning, pages 272–281. PMLR, 2019.
- Ba et al. [2022] Wei Ba, Shuhao Wang, Meixia Shang, Ziyan Zhang, Huan Wu, Chunkai Yu, Ranran Xing, Wenjuan Wang, Lang Wang, Cancheng Liu, et al. Assessment of deep learning assistance for the pathological diagnosis of gastric cancer. Modern Pathology, 35(9):1262–1268, 2022.
- Bejnordi et al. [2017] Babak Ehteshami Bejnordi, Mitko Veta, Paul Johannes Van Diest, Bram Van Ginneken, Nico Karssemeijer, Geert Litjens, Jeroen AWM Van Der Laak, Meyke Hermsen, Quirine F Manson, Maschenka Balkenhol, et al. Diagnostic assessment of deep learning algorithms for detection of lymph node metastases in women with breast cancer. Jama, 318(22):2199–2210, 2017.
- Bera et al. [2019] Kaustav Bera, Kurt A Schalper, David L Rimm, Vamsidhar Velcheti, and Anant Madabhushi. Artificial intelligence in digital pathology—new tools for diagnosis and precision oncology. Nature reviews Clinical oncology, 16(11):703–715, 2019.
- Brancati et al. [2022] Nadia Brancati, Anna Maria Anniciello, Pushpak Pati, Daniel Riccio, Giosuè Scognamiglio, Guillaume Jaume, Giuseppe De Pietro, Maurizio Di Bonito, Antonio Foncubierta, Gerardo Botti, et al. Bracs: A dataset for breast carcinoma subtyping in h&e histology images. Database, 2022:baac093, 2022.
- Campanella et al. [2019] Gabriele Campanella, Matthew G Hanna, Luke Geneslaw, Allen Miraflor, Vitor Werneck Krauss Silva, Klaus J Busam, Edi Brogi, Victor E Reuter, David S Klimstra, and Thomas J Fuchs. Clinical-grade computational pathology using weakly supervised deep learning on whole slide images. Nature medicine, 25(8):1301–1309, 2019.
- Chen et al. [2018] Jianbo Chen, Le Song, Martin J Wainwright, and Michael I Jordan. L-shapley and c-shapley: Efficient model interpretation for structured data. arXiv preprint arXiv:1808.02610, 2018.
- Chen et al. [2019] Po-Hsuan Cameron Chen, Krishna Gadepalli, Robert MacDonald, Yun Liu, Shiro Kadowaki, Kunal Nagpal, Timo Kohlberger, Jeffrey Dean, Greg S Corrado, Jason D Hipp, et al. An augmented reality microscope with real-time artificial intelligence integration for cancer diagnosis. Nature medicine, 25(9):1453–1457, 2019.
- Chen et al. [2022] Richard J Chen, Chengkuan Chen, Yicong Li, Tiffany Y Chen, Andrew D Trister, Rahul G Krishnan, and Faisal Mahmood. Scaling vision transformers to gigapixel images via hierarchical self-supervised learning. In Proceedings of the IEEE/CVF Conference on Computer Vision and Pattern Recognition, pages 16144–16155, 2022.
- Dempster et al. [1977] Arthur P Dempster, Nan M Laird, and Donald B Rubin. Maximum likelihood from incomplete data via the em algorithm. Journal of the royal statistical society: series B (methodological), 39(1):1–22, 1977.
- Feng and Zhou [2017] Ji Feng and Zhi-Hua Zhou. Deep miml network. In Proceedings of the AAAI conference on artificial intelligence, 2017.
- Foersch et al. [2023] Sebastian Foersch, Christina Glasner, Ann-Christin Woerl, Markus Eckstein, Daniel-Christoph Wagner, Stefan Schulz, Franziska Kellers, Aurélie Fernandez, Konstantina Tserea, Michael Kloth, et al. Multistain deep learning for prediction of prognosis and therapy response in colorectal cancer. Nature medicine, 29(2):430–439, 2023.
- He et al. [2016] Kaiming He, Xiangyu Zhang, Shaoqing Ren, and Jian Sun. Deep residual learning for image recognition. In Proceedings of the IEEE conference on computer vision and pattern recognition, pages 770–778, 2016.
- Ilse et al. [2018] Maximilian Ilse, Jakub Tomczak, and Max Welling. Attention-based deep multiple instance learning. In International conference on machine learning, pages 2127–2136. PMLR, 2018.
- Javed et al. [2022] Syed Ashar Javed, Dinkar Juyal, Harshith Padigela, Amaro Taylor-Weiner, Limin Yu, and Aaditya Prakash. Additive mil: intrinsically interpretable multiple instance learning for pathology. Advances in Neural Information Processing Systems, 35:20689–20702, 2022.
- Lee et al. [2022] Yongju Lee, Jeong Hwan Park, Sohee Oh, Kyoungseob Shin, Jiyu Sun, Minsun Jung, Cheol Lee, Hyojin Kim, Jin-Haeng Chung, Kyung Chul Moon, et al. Derivation of prognostic contextual histopathological features from whole-slide images of tumours via graph deep learning. Nature Biomedical Engineering, pages 1–15, 2022.
- Li et al. [2021a] Bin Li, Yin Li, and Kevin W Eliceiri. Dual-stream multiple instance learning network for whole slide image classification with self-supervised contrastive learning. In Proceedings of the IEEE/CVF conference on computer vision and pattern recognition, pages 14318–14328, 2021a.
- Li et al. [2023] Honglin Li, Chenglu Zhu, Yunlong Zhang, Yuxuan Sun, Zhongyi Shui, Wenwei Kuang, Sunyi Zheng, and Lin Yang. Task-specific fine-tuning via variational information bottleneck for weakly-supervised pathology whole slide image classification. In Proceedings of the IEEE/CVF Conference on Computer Vision and Pattern Recognition, pages 7454–7463, 2023.
- Li et al. [2021b] Jiayun Li, Wenyuan Li, Anthony Sisk, Huihui Ye, W Dean Wallace, William Speier, and Corey W Arnold. A multi-resolution model for histopathology image classification and localization with multiple instance learning. Computers in biology and medicine, 131:104253, 2021b.
- Lin et al. [2023] Tiancheng Lin, Zhimiao Yu, Hongyu Hu, Yi Xu, and Chang-Wen Chen. Interventional bag multi-instance learning on whole-slide pathological images. In Proceedings of the IEEE/CVF Conference on Computer Vision and Pattern Recognition, pages 19830–19839, 2023.
- Liu et al. [2023] Pei Liu, Luping Ji, Xinyu Zhang, and Feng Ye. Pseudo-bag mixup augmentation for multiple instance learning based whole slide image classification. arXiv preprint arXiv:2306.16180, 2023.
- Lu et al. [2021] Ming Y Lu, Drew FK Williamson, Tiffany Y Chen, Richard J Chen, Matteo Barbieri, and Faisal Mahmood. Data-efficient and weakly supervised computational pathology on whole-slide images. Nature biomedical engineering, 5(6):555–570, 2021.
- Lundberg and Lee [2017] Scott M Lundberg and Su-In Lee. A unified approach to interpreting model predictions. Advances in neural information processing systems, 30, 2017.
- Mahmood et al. [2020] Faisal Mahmood, Daniel Borders, Richard J. Chen, Gregory N. Mckay, Kevan J. Salimian, Alexander Baras, and Nicholas J. Durr. Deep adversarial training for multi-organ nuclei segmentation in histopathology images. IEEE Transactions on Medical Imaging, 39(11):3257–3267, 2020.
- Maron and Lozano-Pérez [1997] Oded Maron and Tomás Lozano-Pérez. A framework for multiple-instance learning. Advances in neural information processing systems, 10, 1997.
- Messalas et al. [2019] Andreas Messalas, Yiannis Kanellopoulos, and Christos Makris. Model-agnostic interpretability with shapley values. In 2019 10th International Conference on Information, Intelligence, Systems and Applications (IISA), pages 1–7. IEEE, 2019.
- Moen et al. [2019] Erick Moen, Dylan Bannon, Takamasa Kudo, William Graf, Markus Covert, and David Van Valen. Deep learning for cellular image analysis. Nature methods, 16(12):1233–1246, 2019.
- Niazi et al. [2019] Muhammad Khalid Khan Niazi, Anil V Parwani, and Metin N Gurcan. Digital pathology and artificial intelligence. The lancet oncology, 20(5):e253–e261, 2019.
- Pati et al. [2022] Pushpak Pati, Guillaume Jaume, Antonio Foncubierta-Rodriguez, Florinda Feroce, Anna Maria Anniciello, Giosue Scognamiglio, Nadia Brancati, Maryse Fiche, Estelle Dubruc, Daniel Riccio, et al. Hierarchical graph representations in digital pathology. Medical image analysis, 75:102264, 2022.
- Pinheiro and Collobert [2015] Pedro O Pinheiro and Ronan Collobert. From image-level to pixel-level labeling with convolutional networks. In Proceedings of the IEEE conference on computer vision and pattern recognition, pages 1713–1721, 2015.
- Qu et al. [2022] Linhao Qu, Manning Wang, Zhijian Song, et al. Bi-directional weakly supervised knowledge distillation for whole slide image classification. Advances in Neural Information Processing Systems, 35:15368–15381, 2022.
- Schapiro et al. [2017] Denis Schapiro, Hartland W Jackson, Swetha Raghuraman, Jana R Fischer, Vito RT Zanotelli, Daniel Schulz, Charlotte Giesen, Raúl Catena, Zsuzsanna Varga, and Bernd Bodenmiller. histocat: analysis of cell phenotypes and interactions in multiplex image cytometry data. Nature methods, 14(9):873–876, 2017.
- Shao et al. [2021a] Wei Shao, Tongxin Wang, Zhi Huang, Zhi Han, Jie Zhang, and Kun Huang. Weakly supervised deep ordinal cox model for survival prediction from whole-slide pathological images. IEEE Transactions on Medical Imaging, 40(12):3739–3747, 2021a.
- Shao et al. [2021b] Zhuchen Shao, Hao Bian, Yang Chen, Yifeng Wang, Jian Zhang, Xiangyang Ji, et al. Transmil: Transformer based correlated multiple instance learning for whole slide image classification. Advances in neural information processing systems, 34:2136–2147, 2021b.
- Shapley et al. [1953] Lloyd S Shapley et al. A value for n-person games. 1953.
- Sharma et al. [2021] Yash Sharma, Aman Shrivastava, Lubaina Ehsan, Christopher A. Moskaluk, Sana Syed, and Donald Brown. Cluster-to-conquer: A framework for end-to-end multi-instance learning for whole slide image classification. In Proceedings of the Fourth Conference on Medical Imaging with Deep Learning, pages 682–698. PMLR, 2021.
- Strumbelj and Kononenko [2010] Erik Strumbelj and Igor Kononenko. An efficient explanation of individual classifications using game theory. The Journal of Machine Learning Research, 11:1–18, 2010.
- Tang et al. [2021] Siyi Tang, Amirata Ghorbani, Rikiya Yamashita, Sameer Rehman, Jared A Dunnmon, James Zou, and Daniel L Rubin. Data valuation for medical imaging using shapley value and application to a large-scale chest x-ray dataset. Scientific reports, 11(1):8366, 2021.
- Wang et al. [2022] Xiyue Wang, Jinxi Xiang, Jun Zhang, Sen Yang, Zhongyi Yang, Ming-Hui Wang, Jing Zhang, Wei Yang, Junzhou Huang, and Xiao Han. Scl-wc: Cross-slide contrastive learning for weakly-supervised whole-slide image classification. Advances in neural information processing systems, 35:18009–18021, 2022.
- Yan et al. [2023] Renao Yan, Qiming He, Yiqing Liu, Peng Ye, Lianghui Zhu, Shanshan Shi, Jizhou Gou, Yonghong He, Tian Guan, and Guangde Zhou. Unpaired virtual histological staining using prior-guided generative adversarial networks. Computerized Medical Imaging and Graphics, 105:102185, 2023.
- Yang et al. [2023] Rui Yang, Pei Liu, and Luping Ji. Protodiv: Prototype-guided division of consistent pseudo-bags for whole-slide image classification. arXiv preprint arXiv:2304.06652, 2023.
- Yu et al. [2023] Jin-Gang Yu, Zihao Wu, Yu Ming, Shule Deng, Qihang Wu, Zhongtang Xiong, Tianyou Yu, Gui-Song Xia, Qingping Jiang, and Yuanqing Li. Bayesian collaborative learning for whole-slide image classification. IEEE Transactions on Medical Imaging, 2023.
- Yufei et al. [2022] Cui Yufei, Ziquan Liu, Xiangyu Liu, Xue Liu, Cong Wang, Tei-Wei Kuo, Chun Jason Xue, and Antoni B Chan. Bayes-mil: A new probabilistic perspective on attention-based multiple instance learning for whole slide images. In The Eleventh International Conference on Learning Representations, 2022.
- Zhang et al. [2022] Hongrun Zhang, Yanda Meng, Yitian Zhao, Yihong Qiao, Xiaoyun Yang, Sarah E Coupland, and Yalin Zheng. Dtfd-mil: Double-tier feature distillation multiple instance learning for histopathology whole slide image classification. In Proceedings of the IEEE/CVF Conference on Computer Vision and Pattern Recognition, pages 18802–18812, 2022.
- Zhang et al. [2023] Yunlong Zhang, Honglin Li, Yuxuan Sun, Sunyi Zheng, Chenglu Zhu, and Lin Yang. Attention-challenging multiple instance learning for whole slide image classification. arXiv preprint arXiv:2311.07125, 2023.
- Zhu et al. [2023] Lianghui Zhu, Huijuan Shi, Huiting Wei, Chengjiang Wang, Shanshan Shi, Fenfen Zhang, Renao Yan, Yiqing Liu, Tingting He, Liyuan Wang, et al. An accurate prediction of the origin for bone metastatic cancer using deep learning on digital pathological images. EBioMedicine, 87, 2023.
- Zhu et al. [2017] Wentao Zhu, Qi Lou, Yeeleng Scott Vang, and Xiaohui Xie. Deep multi-instance networks with sparse label assignment for whole mammogram classification. In International conference on medical image computing and computer-assisted intervention, pages 603–611. Springer, 2017.