Quasi-phase-matched up- and down-conversion in periodically poled layered semiconductors
Chiara Trovatello1,2,∗, Carino Ferrante3, Birui Yang4, Josip Bajo5, Benjamin Braun5, Xinyi Xu1, Zhi Hao Peng1, Philipp K. Jenke5, Andrew Ye6, Milan Delor7, D. N. Basov4, Jiwoong Park6,8,9, Philip Walther5,10, Lee A. Rozema5, Cory Dean4, Andrea Marini3,11, Giulio Cerullo2,∗ and P. James Schuck1,∗
1Department of Mechanical Engineering, Columbia University, New York, NY 10027, USA
2Dipartimento di Fisica, Politecnico di Milano, Piazza L. da Vinci 32, I-20133 Milano, Italy
3CNR-SPIN, c/o Dip.to di Scienze Fisiche e Chimiche, Via Vetoio, Coppito (L’Aquila) 67100, Italy
4Department of Physics, Columbia University, New York, NY 10027, USA
5University of Vienna, Faculty of Physics, Vienna Center for Quantum Science and Technology (VCQ) & Research Network Quantum Aspects of Space Time (TURIS), 1090 Vienna, Austria
6Pritzker School of Molecular Engineering, University of Chicago, Chicago, IL, USA
7Department of Chemistry, Columbia University, New York, NY 10027, USA
8James Franck Institute, University of Chicago, Chicago, IL, USA
9Department of Chemistry, University of Chicago, Chicago, IL, USA
10Christian Doppler Laboratory for Photonic Quantum Computer, Faculty of Physics, University of Vienna, 1090 Vienna, Austria
11Department of Physical and Chemical Sciences, University of L’Aquila, Via Vetoio, 67100 L’Aquila, Italy
∗Corresponding authors. Email: ct2938@columbia.edu, giulio.cerullo@polimi.it, p.j.schuck@columbia.edu
Nonlinear optics lies at the heart of classical and quantum light generationBoyd2020 ; Elshaari2020 ; Boes2023 . The invention of periodic poling revolutionized nonlinear optics and its commercial applications by enabling robust quasi-phase-matching in crystals such as lithium niobateBoes2023 ; Fejer1992 . However, reaching useful frequency conversion efficiencies requires macroscopic dimensions, limiting further technology development and integration. Here we realize a periodically poled van der Waals semiconductor (3R-MoS2)Zhao2016 ; Shi2017 ; Xu2022 . Due to its exceptional nonlinearity, we achieve macroscopic frequency conversion efficiency over a microscopic thickness of only , thinner than current systems with similar performancesBoes2023 ; wang2018 ; suntsov2021watt . Due to unique intrinsic cavity effects, the thickness-dependent quasi-phase-matched second harmonic signal surpasses the usual quadratic enhancement by 50%. Further, we report the broadband generation of photon pairs at telecom wavelengths via quasi-phase-matched spontaneous parametric down-conversion. This work opens the new and unexplored field of phase-matched nonlinear optics with microscopic van der Waals crystals, unlocking applications that require simple, ultra-compact technologies such as on-chip entangled photon-pair sources for integrated quantum circuitry and sensing Elshaari2020 ; Boes2023 ; Santiago-Cruz2022 .
The inherent nonlinear response of matter to external electromagnetic stimuli allows photons of different frequencies incident on a material to interact with each other, enabling a myriad of photonic applications such as frequency conversion and the generation of non-classical states of light. Particularly interesting are second-order nonlinear processes, which occur in non-centrosymmetric media with and are used to produce new light frequencies e.g., in second harmonic generation (SHG), sum and difference frequency generation, and entangled photon pairs in spontaneous parametric down-conversion (SPDC)Boyd2020 ; Shih2016 .
Efficient nonlinear frequency conversion is achieved by fulfilling the so-called phase matching (PM) condition, which implies a zero wave-vector mismatch - i.e., momentum conservation - for the interacting waves (). For both SHG and SPDC, and PM requires matching the refractive indexes of the fundamental wavelength (FW), , and of the second harmonic (SH), . In the absence of PM, the conversion efficiency reaches its maximum for a propagation distance corresponding to the coherence length Lc = /k and then oscillates with period 2LcBoyd2020 . Birefringent phase-matching (BPM) exploits the optical anisotropy of non-centrosymmetric nonlinear crystals by adjusting the propagation direction inside the crystal so that the fields at and with different polarizations experience the same refractive index. For SHG with BPM, the SH intensity grows quadratically with the thickness of the nonlinear medium. While BPM is simple and effective, it can only be applied to a limited number of crystals, such as the prototypical -barium borate (BBO), which display moderate values of a few pm/VBoyd2020 .
There are many crystals with high nonlinearity but low anisotropy, e.g., gallium arsenide (GaAs), for which BPM is not achievable. An alternative to BPM is quasi-phase-matching (QPM), which introduces periodic phase shifts of between the fields at the FW and the SH at every coherence length , restoring the proper phase relationship and the quadratic growth of the SH intensity with propagation lengthFejer1992 ; Myers1995 .
Such a phase shift can be obtained by periodic inversion of the crystallographic orientation during material growth via molecular beam epitaxyKoh1998 ; Eyres2001 ; Grisard2012 , or by cleaving the nonlinear medium slabs along the different crystal planes and diffusion-bonding them into monolithic stacksGordon1993 ; Grisard2012 ; Tanimoto2021 . In ferroelectric crystals like lithium niobate (LN)Feng1980 ; Feisst1985 , lithium tantalate Matsumoto1991 or potassium titanyl phosphate VanDerPoel1990 , QPM can be achieved by periodic poling, i.e., by periodically inverting the sign of the nonlinear coefficient upon high-voltage switching of ferroelectric domains following lithographic patterning of the electrodesHum2007 . The spatial modulation of , which follows the electrode spacing, is the so-called poling period, and it determines the wavelengths for which a certain nonlinear process can be phase matched. For LN, the typical values of the poling periods are between 5 and and the modulation can be extended over crystal thicknesses from millimeters to centimetersHum2007 .
The invention of QPM was a breakthrough in nonlinear optics because it enabled the use of nonlinear crystals with large of the order of 10-20 pm/V, for which BPM cannot be achievedBoes2023 . Periodically poled LN (PPLN) crystals provide the highest conversion efficiency for waveguided SHG ()wang2018 ; suntsov2021watt , optical parametric amplifiers and oscillatorsMyers1997 ; Yang1999 ; lu2021 ; Ledezma2023 and entangled photon sourcesSolntsev2018 ; Zhang2021 . Along with their high conversion efficiencies, standard nonlinear crystals like PPLN can be directly fabricated on silicon-based optical circuits, though their millimeter-to-centimeter thickness limits the number of devices that can be integrated on a single chip. This has spurred recent advances in the development of nonlinear metasurfacesKrasnok2018 ; Wang2022 ; Fedotova2022 ; Santiago-Cruz2022 ; Neshev2023 , thin filmsZhu2021 and nanowaveguidesJankowski2023 , which are now leading a paradigm shift towards more miniaturized, and more tunable, nonlinear optical device platforms.
The rise of quantum and two-dimensional (2D) material scienceGuo2023 ; Wu2017 ; Mueller2018 ; Du2023 ; Ma2023 ; Sheffer2023 has inspired research on less traditional classes of optical crystals including semiconducting transition metal dichalcogenides (TMDs), e.g., MoS2, MoSe2, WS2 and WSe2. These are layered materials comprised of crystalline sheets with strong in-plane covalent bonds but weak out-of-plane van der Waals interactions. Starting from the first reports of SHGMalard2013 ; Li2013 ; Wang2015shg , their exceptional optical nonlinearities (pm/V), 100-1000x higher than standard bulk crystals due in part to favourable quantum geometries, have recently been exploited to demonstrate nonlinear effects at the ultimate thin-ness limit in single-layer TMDsAutere2018 ; Wen2019 ; Liu2020 ; Dogadov2022 . However, in such cases, the overall conversion efficiency is still limited by the sub-nm propagation lengthtrovatello2021optical . In contrast to the most common 2H crystallographic phase, which is centrosymmetric in the bulk (), the 3R polytype is non-centrosymmetric () and can be used to boost the conversion efficiency of second-order nonlinear optical processes by increasing the number of layers in the TMD sample. Using thin 3R-MoS2 flakes (1-6 layers), it has been shown that the SH intensity grows quadratically with the number of layers, i.e., with the thickness of the nonlinear medium ()Zhao2016 .
However, when the number of layers is increased to , the wave vector mismatch results in an inevitable deviation from the enhancementShi2017 ; Xu2022 , and the SH oscillates with the sample thickness, with a semi-period equal to the coherence length Boyd2020 . Recently, the coherence length in 3R-MoS2 has been measured at telecom wavelengthsXu2022 . At () the single-pass SHG efficiency is higher than for a monolayer (), resulting in the highest conversion efficiency per unit length reported to date for a transparent materialXu2022 . Further increasing this value to achieve macroscopic nonlinear conversion efficiencies, while still preserving the micrometer thickness of TMD crystals, remains an open challenge.
Here we bridge this gap using a non-centrosymmetric van der Waals crystal, 3R-MoS2, to achieve QPM in periodically-poled transition metal dichalcogenides (PPTMDs). We flip the sign of the optical nonlinearity by stacking consecutive slabs with opposite dipole orientation. The large nonlinearity of TMDs combined with QPM unlocks single-pass conversion efficiencies for SHG higher than at telecom wavelengths and enables efficient photon-pair generation via SPDC over a microscopic thickness of only – at least two orders of magnitude thinner than BBO and PPLN crystals with similar performances. We observe unique cavity effects prompted by internal reflections of both FW and SH, which increase the conversion efficiency by an additional 50% over standard QPM. Finally, we report the broadband generation of photon pairs at telecom wavelengths via quasi-phase-matched SPDC.
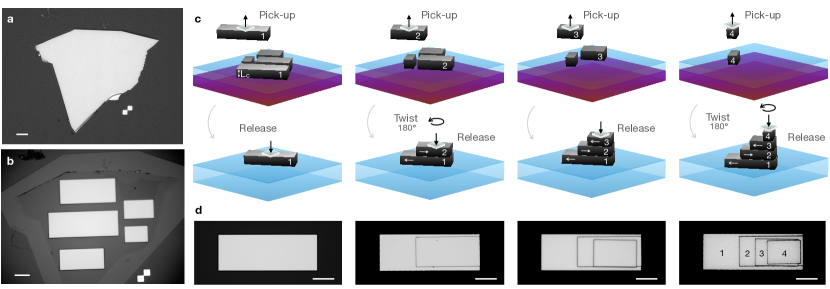
The 3R-MoS2 crystals are mechanically exfoliated from a commercial bulk 3R-MoS2 crystal (HQ graphene) grown by chemical vapor transport on a SiO2/Si substrate. Characterization of the bulk crystal by energy dispersive X-ray analysis and X-Ray diffraction is provided in Ref.Xu2022 . The thickness of the exfoliated flakes is measured using atomic force microscopy (Supplementary Note 4). To fabricate the PPTMD, we select a large flake with lateral size of and thickness , shown in Fig. 1a. We pattern the flake using electron beam lithography and reactive ion etching into smaller portions (Fig. 1b, Supplementary Note 1 for details). By cutting the different slabs out of a single flake, we ensure that all areas have identical thickness and the same macroscopic dipole orientation. Our design and fabrication methodology thus bypasses the need for angle-resolved SHG for crystal orientation characterization.
We choose a flake with thickness of , close to the coherence length measured for a FW at 1450 nm (Supplementary Note 7). The largest portion of the flake (area 1) is transferred onto a -thick transparent fused silica (SiO2) substrate, and the other portions (area 2, 3, 4) are individually stacked on top of each other by keeping an interlayer twist angle of ArxivTwistPM2023 (symmetrically equivalent to and twist angles) to flip the sign of at each coherence length (see Fig. 1c), resulting in an overall thickness of (Supplementary Note 4). The microscope images of the periodically poled crystal at each stacking step are shown in Fig. 1d.
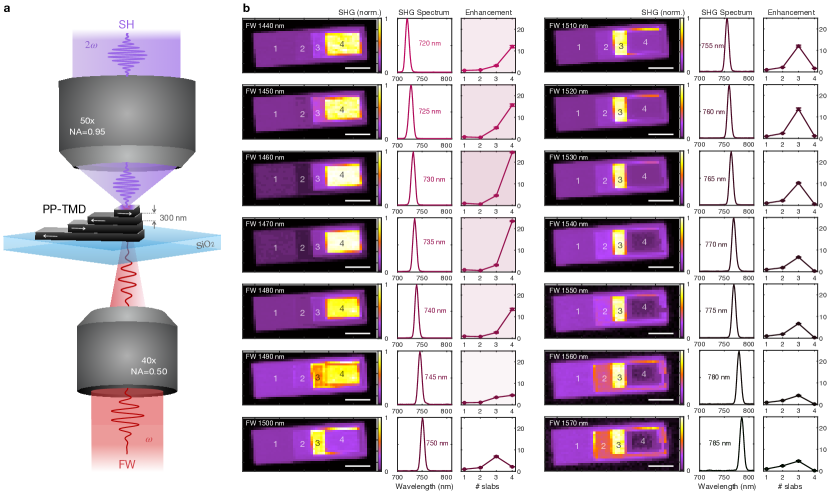
To characterize the nonlinear response of the PPTMD, we use a custom-built transmission microscope (Fig. 2a), illuminated by an optical parametric oscillator (OPO, Coherent Chameleon), emitting pulses at , tunable in the NIR (1000-1600 nm) wavelength range. We use a long working-distance 40x reflective objective with numerical aperture (NA) 0.5 to focus the FW on the sample from the backside of the substrate. The SH is collected by a 50x objective with a 0.95 NA and directed onto a silicon CCD camera (Supplementary Note 2). The FW is tuned from 1430 nm to 1580 nm, and the power is kept fixed at (peak power ). Figure 2b shows the pump wavelength dependent normalized SHG maps, along with the corresponding SHG spectrum. For each pump wavelength, we extract the SH enhancement factor, defined as the SH emission from the regions with 2, 3 and 4 slabs normalized to the SH emission of 1 slab, shown in Fig. 2b. The peak of the SH enhancement is obtained at FW , at approximately the target operation wavelength for this stack. Compared to a standard first-order QPM ( flipped in sign at each coherence length) that predicts a quadratic enhancement of 4, 9 and 16 for 2, 3 and 4 slabs, respectively, the peak enhancement that we obtain is not monotonically increasing with the slab number at each pump wavelength, and it is almost 50% higher in the portion of the stack with 4 slabs. This effect can be explained by considering the modulation of the optical properties caused by interference inside the PPTMD. Multiple reflections of FW and SH radiation at the interfaces between the TMD and the air and glass substrate, acting as optical microcavities, provide nonlinear cavity enhancement effects.
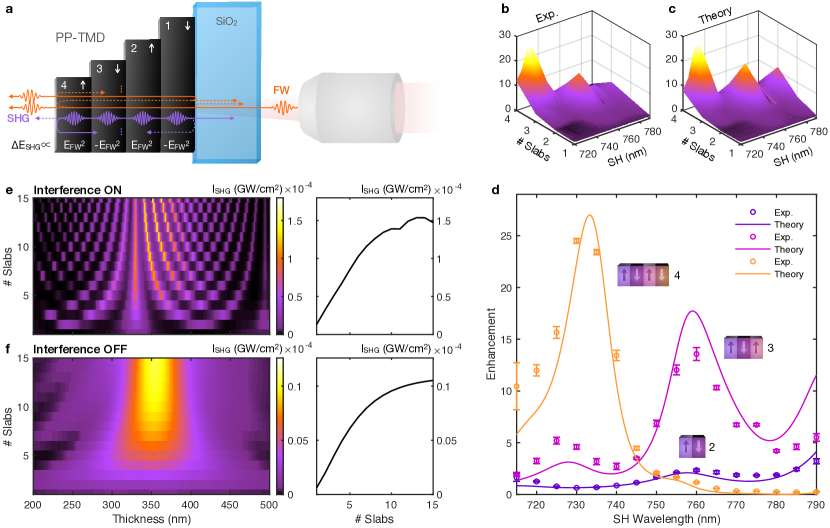
To better understand the unconventional QPM regime we observe in PPTMDs, we analytically model our signal by solving the coupled nonlinear equations considering the interference of FW and SH fields in the slabs, and the SH electric field sign inversion for the different poling conditions (Supplementary Note 6). Specifically, we assume that the SH process does not affect the intensity of the FW (undepleted-pump approximation) and we apply the boundary conditions at the entrance and the exit of the TMD slabs to analytically retrieve the interference effects. Calculating the forward and backward propagating FW electric fields and considering the poling, we are able to evaluate the SH in the system. We calculate the second order non linear polarization in the slabs at induced by FW propagation, and insert this term into Maxwell’s equations to extract the SH electric and magnetic fields. Applying again the boundary condition for the SH, we obtain the forward emitted SH intensity. The analytical calculation is performed assuming a normal propagation in the different slabs. A sketch of the modeled structure is shown in Fig. 3a, in which the interference effects of FW and SH are depicted.
Figure 3b and 3c show the measurements and the theoretical simulations of the SH enhancement factor (i.e., SH emission from slab 2, 3 and 4 normalized to the SH from slab 1) as a function of the SH wavelength and the number of slabs, respectively. For the theoretical simulations, we use the refractive index reported in Fig. S2, and a slab thickness equal to 293 nm (Supplementary Note 6). Figure 3d reports the comparison between experiments and theory for poled structures with 2, 3 and 4 slabs, demonstrating a very good agreement with the data. The theoretical model also accurately reproduces the nonlinear response of PPTMDs with different poling periods (Supplementary Note 8). Data and simulations emphasize the importance of an appropriate choice of the number of slabs for each FW wavelength and a given slab thickness, to maximize the enhancement of SH. In particular, for our 300-nm slab thickness, a configuration with 3 slabs provides a higher enhancement compared to the poled structure with 4 slabs for SH wavelengths above 750 nm.
Figure 3e shows the intensity profile of SH for different slab thicknesses and number of slabs, assuming a FW at 1450 nm, peak power and . The results show a maximum efficiency for a , with a strong dependence on the interference effects of the FW. The optimum poling period is strongly dependent on the FW. For instance, at 1550 nm the maximum efficiency is achieved for (see Supplementary Note 6). We also report the same simulation removing the interference of the FW in the slab (Fig. 3f), which we achieve by setting the real part of refractive index of air after the slabs equal to that of the TMD. In this case, the interference pattern is removed, obtaining a more homogeneous profile. However, the maximum efficiency is notably reduced (more than lower). This comparison highlights the key role played by the intrinsic cavity enhancement effects in PPTMDs.
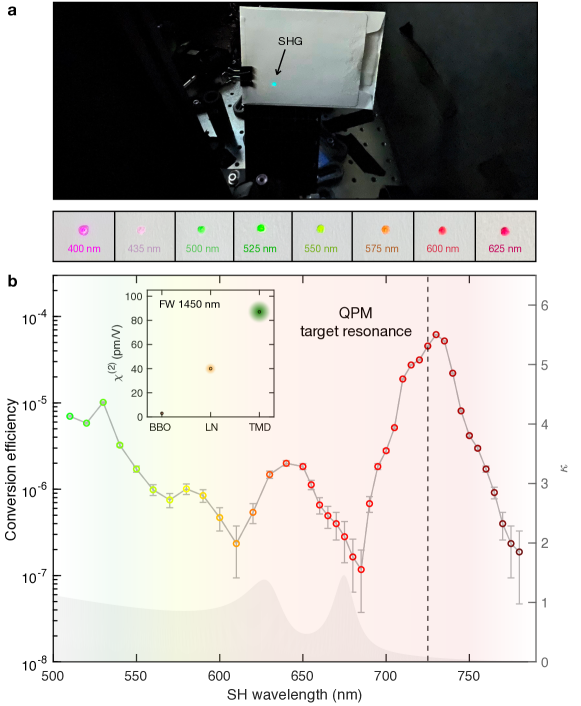
We use the frequency tunable OPO to quantitatively measure the wavelength dependent conversion efficiency of the PPTMD. The photographs of the broadly tunable SH spots of our -thick PPTMD are shown in Fig. 4a. Using a power meter, we measure the SH power emitted by the sample excited with tunable pump and a constant power of (peak intensity ). The measured conversion efficiency for different excitation wavelengths is shown in Fig. 4b. The peak of the conversion efficiency () is recorded at FW ), i.e., the target phase-matched wavelength with the poling period we use. We stress the fact that this macroscopic conversion efficiency is recorded over a sample thickness of only . PPTMDs eclipse the previous thickness-conversion efficiency trade-off curves, and now show macroscopic efficiencies over microscopic thicknesses. At the QPM resonance the extracted nonlinearity is (Supplementary Note 10). With higher compared to BBO/PPLNBoyd2020 ; Schiek2012 (see inset of Fig. 4b), PPTMDs achieve the same efficiency, but over approximately shorter propagation lengths.
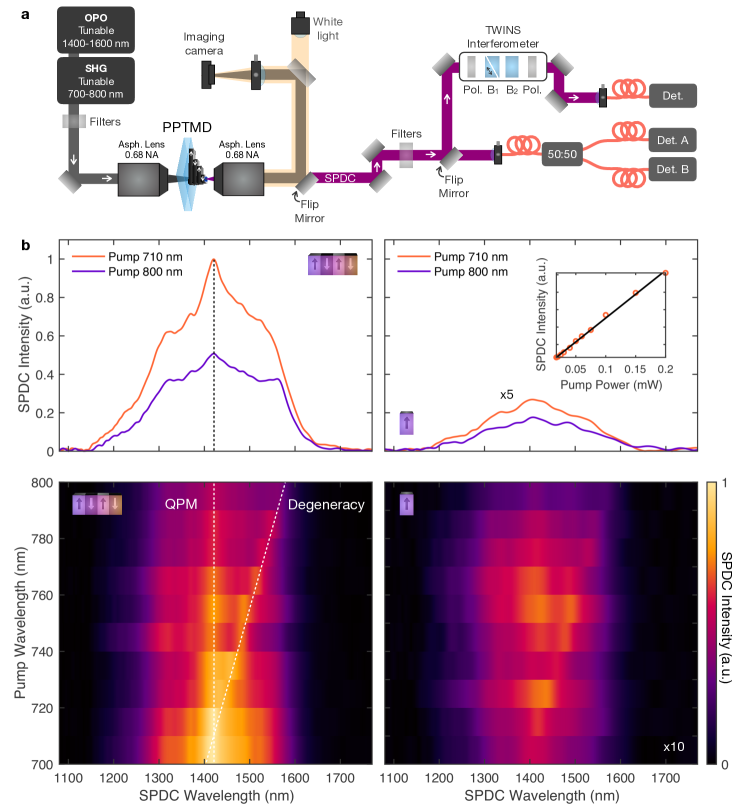
Finally, we use PPTMDs to demonstrate SPDC. For these measurements, we employ a PPTMD stack with peak enhancement at FW (Supplementary Note 11). We measure SPDC in this PPTMD using a transmission geometry, as depicted in Fig. 5a. The tunable pump beam is generated by frequency doubling the signal beam of an OPO (Stuttgart Instruments, Alpha). This system provides pulses at an repetition rate, with a signal wavelength ranging from to , resulting in doubled wavelengths from 700 to 800 nm. Aspheric lenses before and after the sample (with matched NA=0.68) are used to focus the laser beam onto the sample and collect the resulting SPDC signal. After the PPTMD, the pump beam is filtered out with two hard-coated long-pass filters at a cutoff wavelength of . The SPDC signal can then either be coupled directly into single-mode fiber (SMF28, Corning), or directed towards our setup for spectral characterization. The inset of Fig. 5b shows the expected linear power dependence of the SPDC signal measured with superconducting nanowire single-photon detectors (PhotonSpot). We measure the SPDC spectrum with a bireferingent interferometer, the TWINStwins , which is inserted in the optical path of the SPDC signal after which the photons (both the signal and idler) are coupled into multi-mode fiber and detected by an InGaAs single-photon detector (IDQuantique). The setup is described in more detail in Supplementary Note 3.
We collect SPDC spectra for different excitation wavelengths, ranging from 700 nm to 800 nm in steps of 10 nm, from a 4-slabs and from a 1-slab sample. Fig. 5b plots the resulting broadband SPDC spectrum from slab 4 (left) and slab 1 (right). As the signal is significantly stronger from the 4-slabs sample, we use an average pump power of to acquire the 4-slabs data and for the 1-slab data to avoid detector saturation. To account for this, we divide the 4-slabs spectra by four in order to fairly compare the spectra (this is based on the linear power dependence confirmed in the inset). In Fig. 5, we further multiply the 1-slab data by a factor of five and ten in the individual spectra (upper right panel) and in the integrated SPDC map (lower right panel), respectively, to allow for a more direct comparison of the spectral features.
In additional to enhanced efficiency, we note several other features in these spectra.
First, we observe a broadband background, which appears to be limited by our detector response.
This is to be expected as the SPDC process works around the degeneracy condition, for which the group velocities of the signal and idler waves are matched, resulting in a broad phase-matching bandwidthjopt2016 . The peak corresponding to the degeneracy condition, which shifts with pump wavelength, is shown as a dashed line in the lower panel of the 4-slabs data.
Additionally, we plot a vertical dashed line at which corresponds to the QPM peak. Its intensity, relative to the broadband background, grows as the pump is brought into resonance.
This is more apparent when comparing the spectra in the upper panel, taken at the resonant wavelength of (purple), and the off-resonant spectrum taken at (orange).
In addition to the QPM peak, we see another peak occurring at the degenerate wavelength (twice the pump wavelength).
Because of the less stringent phase-matching conditions, the features are not as visible in the single slab data on the right as they are in the 4-slabs data. We additionally perform correlation measurements on the SPDC signal, measuring a maximum coincidence-to-accidental ratio of when pumping at a non-resonant wavelength (Supplementary Note 11).
In conclusion, we introduce periodically poled van der Waals layered materials as a novel nonlinear platform for classical and quantum light generation. By periodically stacking 3R-MoS2 slabs with identical thickness and an interlayer twist angle of , we flip the sign of and achieve quasi-phase matching, restoring the proper phase relationship between fundamental and second harmonic, and between fundamental and spontaneously down-converted fields. Due to the large nonlinearity of 3R-TMDs (100-1000 pm/V) we demonstrate a record single-pass second harmonic conversion efficiency of at telecom wavelengths, over a thickness of only (two poling periods). Moreover, in the phase-matched interaction, we observe nonlinear enhancement which surpasses by more than 50% the usual quadratic enhancement typically observed in standard quasi-phase-matched crystals. This is attributed to cavity effects, which enhance the field overlap inside the periodically poled structure. Theoretical simulations accurately reproduce the conditions for such an unconventional quasi-phase matching, and predict the optimal slab thickness as a function of the FW/SH wavelength (Supplementary Note 6). Although the sample has been prepared by manual exfoliation and stacking, the periodic poling process is potentially scalable, as it can be automatized using a robotic stacking machinemannixye2022 (Supplementary Note 5). PPTMDs now provide macroscopic nonlinear conversion efficiencies over microscopic thicknesses, establishing new routes for designing novel nonlinear optical devices and quantum nanophotonic circuit elementssilva2017 , such as entangled-photon generators directly embedded on chip.
DATA AVAILABILITY
All data generated or analysed during this study, which support the plots within this paper and other findings of this study, are included in this published article and its Supplementary Information. Source data are provided with this paper.
ACKNOWLEDGEMENTS
We thank Benedikt Ursprung for useful discussions.
This work was supported by Programmable Quantum Materials, an Energy Frontier Research Center funded by the US Department of Energy, Office of Science, Basic Energy Sciences, under Award DE-SC0019443. C.T. acknowledges the European Union’s Horizon Europe research and innovation programme under the Marie Skłodowska-Curie PIONEER HORIZON-MSCA-2021-PF-GF grant agreement No 101066108. C.T. also acknowledges the Optica Foundation and Coherent Inc. for supporting this research through the Bernard J. Couillaud prize 2022. G.C acknowledges support by the Progetti di ricerca di Rilevante Interesse Nazionale (PRIN) of the Italian Ministry of Research 2022HL9PRP Overcoming the Classical limits of ultRafast spEctroSCopy with ENtangleD phOtons (CRESCENDO). A.M. acknowledges funding from the European Union—NextGenerationEU under the Italian Ministry of University and Research (MUR) National Innovation Ecosystem Grant No. ECS00000041-VITALITY-CUP E13C22001060006, and Progetti di ricerca di Rilevante Interesse Nazionale (PRIN) of the Italian Ministry of Research PHOTO (Photonic Terahertz devices based on topological materials) No. 316 2020RPEPNH. A.Y. acknowledges support from the Department of Defense (DoD) through the National Defense Science and Engineering Graduate (NDSEG) Fellowship Program. J.P. acknowledges funding from the Air Force Office of Scientific Research (FA9550-21-1-0323) and the Office of Naval Research (N000142212841). P.W. acknowledges support from the Austrian Science Fund (FWF) through BeyondC (F7113) and from AFOSR via FA8655-20-1-7030 (PhoQuGraph) and FA8655-23-1-7063 (TIQI); and from the Austrian Federal Ministry for Digital and Economic Affairs, the National Foundation for Research, Technology and Development and the Christian Doppler Research Association.
Author contributions
C.T. conceived the experiment and performed the measurements. C.F. and A.M. developed the theory model. J.B., B.B., C.T. and P.K.J. performed the spontaneous parametric down-conversion measurements. B.Y., C.T., Z.P., X.X. and A.Y. prepared the samples. X.X., C.T. and Z.P. built the experimental setup and performed the morphological characterization of the samples. M.D., D.N.B, J.P., L.A.R., P.W., C.D., G.C. and P.J.S. supervised the study. C.T. wrote the manuscript with input from all authors.
Competing interests
The authors declare no competing interests.
Additional information
References
- (1)