The Neutral Hydrogen Mass in Galaxies Estimated via Optical Spectroscopy
Abstract
We propose to employ emission line luminosities obtained via optical spectroscopy to estimate the content of neutral hydrogen (HI) in galaxies. We use the optical spectroscopy data from the Mapping of Nearby Galaxies at APO (MaNGA) survey released in the frames of public DR17 of the Sloan Digital Sky Survey (SDSS). We compare the HI mass estimated by us for a large sample of SDSS/MaNGA galaxies with direct HI measurements from the ALFALFA survey and find a tight correlation between the masses with the correlation coefficient (CC) of 0.91 and the r.m.s scatter of 0.15 dex for the logarithmic mass. The obtained relationship is verified via another sample of MaNGA galaxies with HI masses measured with the Green Bank Telescope. Despite the coarser angular resolution of the radio data, the relation between the estimated and measured directly HI mass is tight as well - in this case CC=0.74 and the r.nm.s. is 0.29 dex. The established relations allow us to estimate the total mass of neutral hydrogen as well as the spatial distribution of HI surface density in galaxies from optical spectroscopic observations only in a simple and efficient way.
keywords:
(galaxies:) intergalactic medium, galaxies: fundamental parameters, ISM: atoms, ISM: structure1 Introduction
Gas mass is a fundamental property of galaxies, which is connected to the star formation activity and history, galaxy assembly history, dust amount, and many other important characteristics. Studying the main gas phases – molecular, neutral and ionized, requires multi-wavelength observations. Traditional methods of measuring atomic gas mass employ radio observations, which have their advantages and disadvantages. For example, single-dish radio observations of HI have poor spatial resolution. Alternative methods of estimating the neutral hydrogen (HI) mass have been considered using e.g. dust absorption (Brinchmann et al, 2013) and optical spectra line ratio correlations (Stark et al, 2021) have been proposed. Correlations between optical colours and gas-to-stellar mass ratio is also widely used to probe the HI content in galaxies without performing radio observations (Kannappan, 2004; Zhang et al, 2009; Li & White, 2010; Eckert et al, 2015).
As shown by Reynolds et al (1998), the ratio of neutral and ionized hydrogen in galaxies can be estimated using the [OI]/Ha line ratio. The line ratio traces the neutral hydrogen in a general case of photoionization irrelevant to specific photoionization source. In turn, one can estimate the ionized hydrogen mass or column density via the Balmer line emission (Osterbrock & Ferland, 2006). We propose to combine this information obtained from the optical emission line ratios to estimate the content of neutral hydrogen in galaxies.
While radio observations provide a trusty and well-studied way for measuring HI, studying the spatial distribution of HI in galaxies can be done with just a few instruments in the world. In contrast, spatially resolved, optical spectroscopy can be performed with moderate size telescopes. The progress in panoramic spectroscopy made last decades (Sanchez et al., 2016; Allen et al., 2015; Bundy et al, 2015) allows us to study the spatial distribution, or maps of strong emission lines in large samples of galaxies.
In this paper we use emission line maps obtained by the Mapping of Nearby Galaxies at APO survey (MaNGA, Bundy et al, 2015) released in the frames of DR17 of the Sloan Digital Sky Survey (SDSS, Abdurro’uf et al, 2022). The spectra maps allow us to estimate the gas-phase metallicity, to assess the extinction in the galactic interstellar medium, and to make reasonable assumptions about the electron temperature. We develop the new method that allows one to estimate the total mass of neutral hydrogen in galaxies as well as the radial distribution of HI surface density. We obtain the HI mass and compare it with that estimated by traditional methods from radio observations.
2 Data and Sample Selection
2.1 The MaNGA sample
The MaNGA survey (Bundy et al, 2015) employs the SDSS telescope (Gunn et al, 2006) and R2000 spectrographs (Smee et al, 2013) to study spectra in the whole optical range 3,650 – 10,500Å (Yan et al, 2016) in more than 10,000 nearby (median redshift is 0.03, Wake et al, 2017) galaxies. The Integral Field Unit (IFU) bundles provide spectra maps in up to 32 arcsec hexagonal areas (Drory et al, 2015). A significant fraction of these galaxies has been observed in the ALFALFA survey (Hoffman et al, 2019; Durbala et al, 2020), which measured HI mass in the galaxies with a 3.5 arcmin angular resolution.
2.2 Structural Parameters and Inclination of MaNGA Galaixes
In order to compare the relatively high resolution optical and low resolution radio observations, we clean the sample of objects with reported potential confusion (Stark et al, 2021) and of highly inclined galaxies. We estimate the galaxy inclination via a Sersic fit isophote ellipticity from the NASA-Sloan Atlas, Blanton et al (2011) (NSA111http://nsatlas.org) catalog. The r-band effective radius Re that we use for all galaxies is reported for MaNGA galaxies by the NSA catalog as well. We exclude highly-inclined galaxies (i 75∘) from the analysis of correlations with the ALFALFA sample (Figure 1) to avoid sampling highly reddened areas in galactic midplanes observed edge-on. Although the "confusion flag" reported for the radio observations (Stark et al, 2021) should help reject potential nearby objects that may contribute to HI flux, we apply additional restrictions and remove objects with noticeable neighbours within the ALFALFA 3.5 arcmin aperture via a visual inspection of SDSS images. The resulting MaNGA-ALFALFA sample comprises 627 objects.
3 Method and Results
As it was noticed by Haffner et al (2009), the first ionization potentials of O and H are similar to each other, which makes O+/O ratio to be very close to H+/H. This (Reynolds et al, 1998) allows one to figure out the H+/H0 density ratio as
Here is the gas-phase metallicity, I([OI])/I(H) is the [OI]6300Å emission line flux normalized by H, and
where = T/10,000K. Here the is a constant of the order of unity (Reynolds et al, 1998). We assume that =1 and = 0.7. Note that the estimated values depend on these constants nearly linearly, and we consider calibration of equation (1) via observational data below. From these equations above we estimate the neutral hydrogen mass in the MaNGA IFU bundles as
| (1) |
In turn, Osterbrock & Ferland (2006) estimate HII mass as
| (2) |
where is the mass of proton, erg cm-3 s-1 is the H emissivity, L(H) is the luminosity surface density in the H line, and is the area covered by the IFU. Additional refinements of this equation and the further discussion can be found in Revalski et al (2022).
Reynolds et al (1998) state that the method assumes that [OI] emission originates from collisional excitation by thermal electrons. The [OI]/H ratio traces the HI content in warm ionized gas in regions where the collisional excitation prevails. We expect that equation (1) will be correct in LI(N)ER and AGN regions in galaxies, whereas in completely neutral HI as well as in the gas ionized by shock waves it may fail.
3.1 The Aperture Correction
Since the apertures of spectroscopic MaNGA and radio ALFALFA observations are different, we have to apply an aperture correction. It is problematic in general, because the gas density distribution may not follow the stellar surface density or brightness. Fortunately, equations (1-2) allow us not only to obtain integral masses, but also to estimate the HI mass in each spaxel and hence to analyze surface densities. In addition, useful relationships between global parameters of galaxies help us figure out a reasonable aperture correction. Thus, Broelis & Rhee (1997); Wang et al (2016) established clear relationships between the total HI mass in galaxies with their "HI-size". The size is defined as the galactic diameter at the HI surface density level = 1 . As Wang et al (2016, 2020) infer, the HI mass – size relation is very tight – its r.m.s. scatter is 0.09 dex. Since our calibration sample of ALFALFA galaxies has HI mass measurements, we can estimate the anticipated HI size. Note that the HI gas is also detected at peripheries of galaxies beyond the "HI radius", but its surface density declines exponentially there (Wang et al, 2016) and does not contribute significantly to the total HI mass in galaxies.
Since our comparison sample has known HI masses, we start with the aperture correction based on the HI radius inferred from the total HI mass using corresponding, tight HI mass-size relationship from Wang et al (2016). The possibility to derive HI mass based on optical spectroscopic data only, when HI data are not available, motivates us to explore other methods of the aperture correction that do not use data of radio observations. Another approach to the HI-size estimation is an analysis of the surface density profiles obtained via analogs of equations (1-2), which allows us to use the radial density distributions for inferring the aperture corrections. We consider possible aperture correction methods in §3.4.
3.2 Estimating the Integral HI Mass
We combine equations (1) and (2) for the HI and HII mass with an aperture correction, and assume that (Osterbrock & Ferland, 2006) in the case of no extinction. Hereafter we use only emission for substituting to equation (2). Although the emission lines that we use have close wavelengths, we apply an extinction correction to all emission line fluxes based on observed ratio available from the MaNGA data and Cardelli et al extinction law (Cardelli et al, 1989). Our aperture correction procedure is based on the HI mass - HI size relation by Wang et al (2016). The aperture correction factor is the ratio of the total HI mass ( + ) within the limits to the HI mass within the radius limited by the IFU coverage . We multiply the estimated HI masses by to obtain the full masses. Note that the centres of most of MaNGA galaxies are allocated at the IFU centres.
To estimate the aperture correction, we use the average HI surface density profiles collected by Wang et al (2016). Note that in this case the absolute value of HI surface density is not important for our method since we only compare the density distributions in the inner and outer parts of galaxies. We assume that the HI density profile is approximated by a third-order polynomial between the centre and . We estimate and via analytic integration as , where the radial integration limit is chosen from the definition of given above. In objects where the IFU coverage exceeds (i.e. when we expect that all HI disk of a galaxy completely falls in its IFU), we assume that .
The gas-phase metallicity log(O/H) can be estimated from the emission line ratios in the galaxies as well. We consider three different methods of the abundance estimate in §3.3 below and find that the abundance calibration based on a combination of [OIII] and [NII] lines (O3N2 hereafter, see its description in §3.3) provides the best correspondence between the estimated and directly measured HI masses.
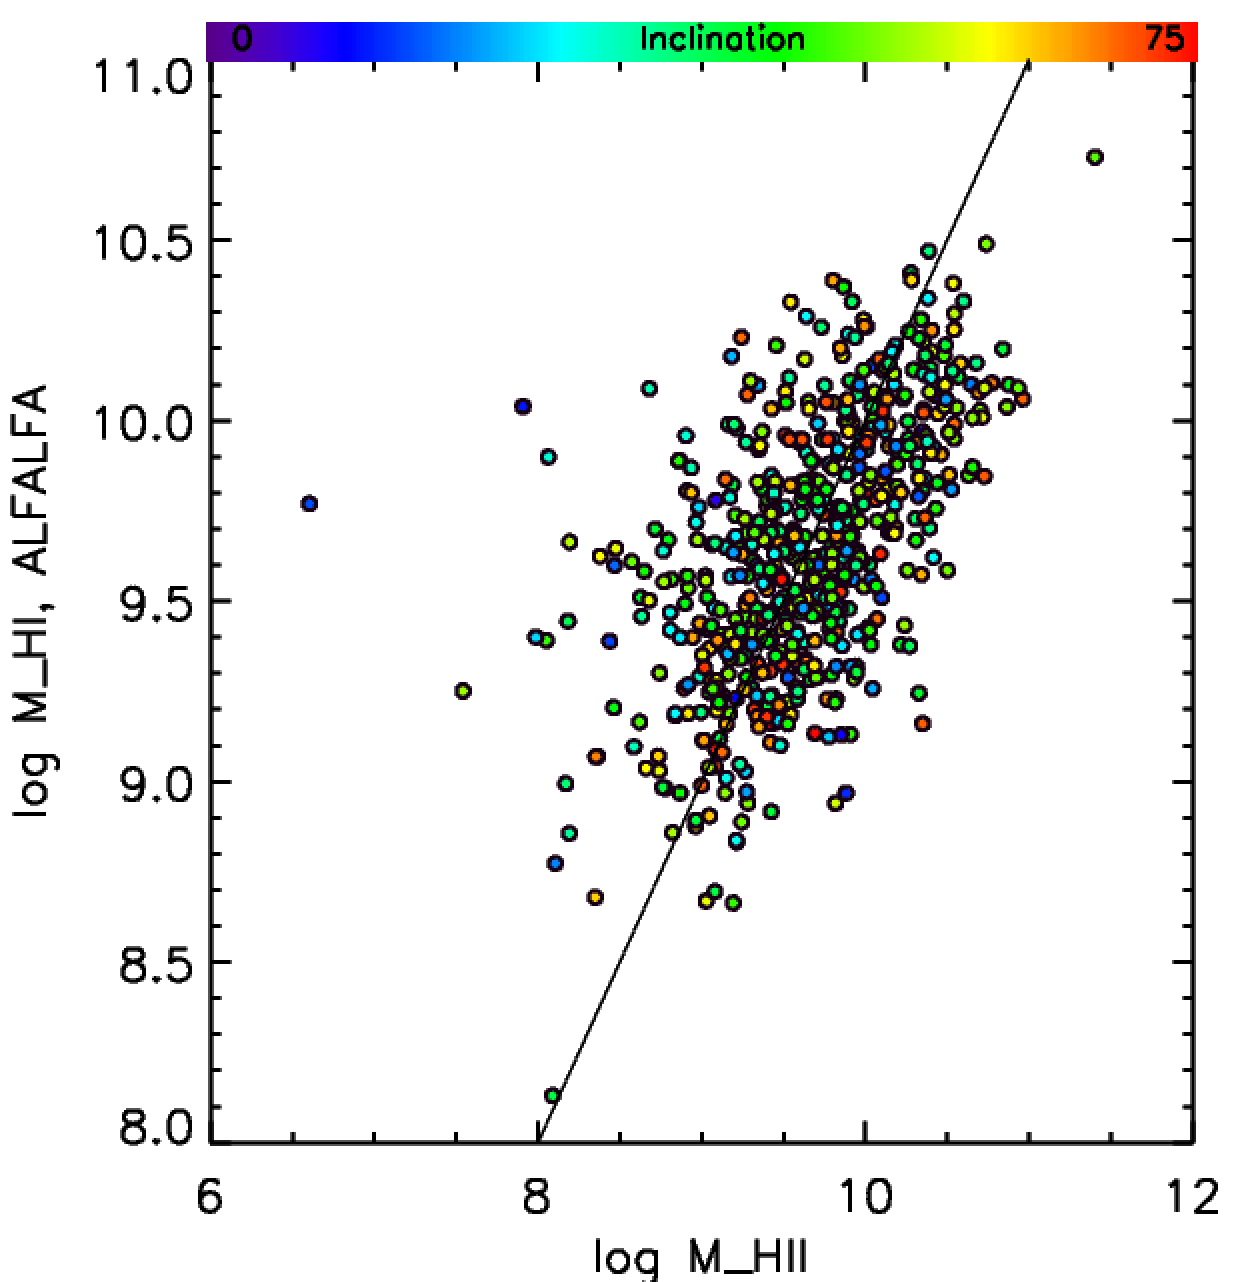
Note that the correlation between the neutral and ionized hydrogen mass in the galaxies is significant and the Pearson correlation coefficient (hereafter CC) equals to 0.62. The estimated HI mass based on equations (1-2) essentially improves the correlation with the measured HI mass with respect to the HII: the Pearson correlation coefficient increases up to 0.91, see Figure 1. The empirical relation between the measured by ALFALFA HI mass and that estimated via equations (1-2) with the O3N2 metallicity calibration is
| (3) |
The rms scatter of the relationship in Figure 1 is 0.149 dex.

We compare the HII and HI mass in Figure 2. The HI mass is taken from same ALFALFA data set used for Figure 1.
Equations (1-2) are motivated by physics, and we consider the tight correlation in Figure 1 as an evidence of the reliable assessment of total HI mass in galaxies, given the limitations of the approach discussed later.
3.3 Metallicity Calibrations
We consider three calibrators to estimate the gas-phase metallicity for equation (1). The calibration proposed by Dopita et al (2016) is based on red emission lines only: H, [SII], and [NII] (HaNS). Marino et al (2013) provide metallicity calibrations based on H, [OIII], and [NII] (O3N2), or on H and [NII] only (N2). The relations between the HI mass measured by ALFALFA and that estimated from the emission lines look similar, with the best one from the O3N2: y= 2.308 + 0.766 x (it has been considered above), where the y = log M(HI)alfalfa and x = log M(HI)est. Its correlation coefficient CC = 0.913 and the rms = 0.149 dex. The N2 calibration yields y = 2.359 + 0.762 x, CC=0.910, rms = 0.154 dex, and the HaNS gives y = 2.582 + 0.756 x with CC = 0.873 and rms = 0.185 dex. Here the rms refers to the one-sigma scatter of points after one iteration of sigma-clipping with a 2-sigma limit.
3.4 Alternative Aperture Correction Methods
Although the aperture correction based on the HI mass-size relation works well for the ALFALFA sample considered above, it requires preliminary knowledge or guess about the final HI mass, which makes sense only for calibrating the relationship between the true and estimated HI mass. We need an independent way to estimate the aperture correction if our method is applied to an arbitrary galaxy with optical spectroscopy but without radio observations. We check the relation between the galaxy optical scale, e.g. the effective radius and the HI radius and find that for the ALFALFA sample considered above. The relationship has CC = 0.75. Our relationship is in agreement with HI-to-optical diameter ratio estimated by Bosma (2017).
A more direct way to assess the HI size is to analyze the HI surface density profiles and to estimate the at the level of = 1 . We subdivide the galaxies by 7 elliptical annuli drawn according to photometric ellipticity (b/a) of optical isophotes provided by the NSA catalog. In this case the width of each annulus approximately matches the spatial resolution of MaNGA data (2.5 arcsec FWHM). The HI surface density is obtained via equations (1-2) as the mass in the elliptical annuli divided by their area. We derive the HI mass in each spaxel instead of co-adding and re-analyzing raw spectra in each annulus because the high-level MaNGA data are available in each spaxel, while re-running the MaNGA data reduction pipeline is more difficult for regular MaNGA product users as well as for other relevant surveys explorers.
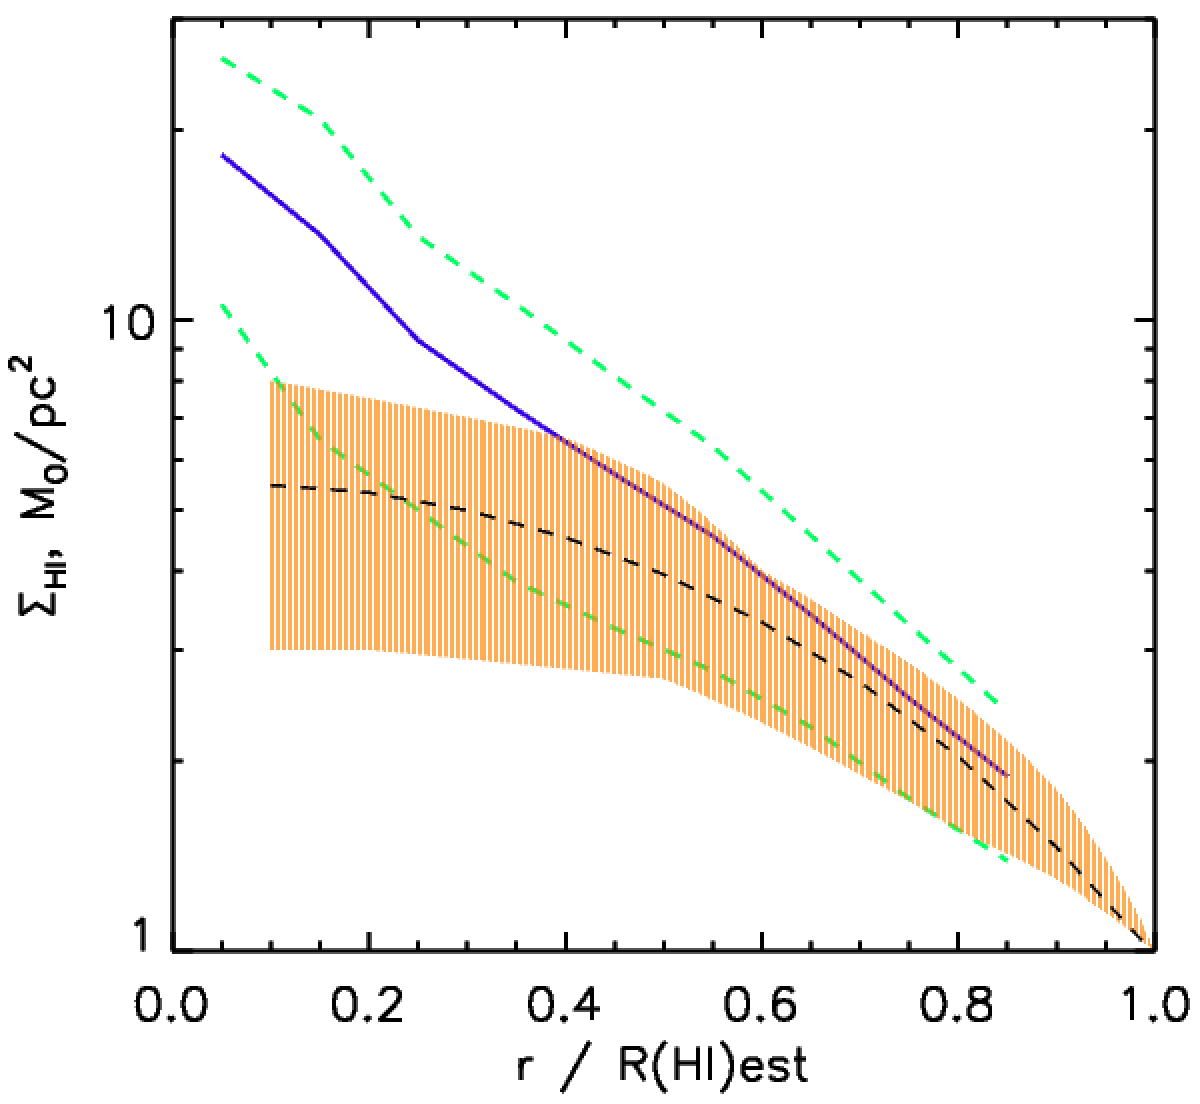
The blue solid curve in Figure 3 shows the median radial distribution of HI surface density for the ALFALFA sample. The green dashed curves designate one Median Absolute Deviation from the median curve. The shaded brown area shows the average HI surface density profiles from Wang et al (2016). Our polynomial fitting is designated by the dashed black curve. Our median profile overlaps the surface density profiles of the galaxies with resolved radio observations. They demonstrate significant difference in central regions, but have good agreement at the periphery.
Most of distributions estimated by us for ALFALFA sample do not extend to the level of 1 . At the same time, most of the surface density profiles look linear in the – radius plots, which allows us to find via the linear extrapolation using the last 3 data points along the radius. The obtained and the radial distributions are then used to calculate and (see above), and therefore to estimate the aperture correction . When this method is applied with equations (1-2) and O3N2 metallicity calibration, it results to the relation
| (4) |
with CC = 0.802 and rms = 0.229.
We consider one more approach of the aperture correction and employ the universal slope of the HI surface density profile at large radii reported by Wang et al (2016). We assume that all our surface density profiles get this exponential slope of 0.2 beyond the last estimated surface density data points on our radial profiles. In this case the correlation between and slightly improves to CC = 0.814.
3.5 Testing Secondary Calibration of the HII-HI Mass Difference
While the connection between HI and HII mass considered in §3 is physically motivated, it scales the HII mass with a multiplicative coefficient, which can be generalized as an empirical coefficient in a more wide approach. In this chapter we decided to make reasonable assumptions of additional factors that could serve as indicators of the gas state in the interstellar medium.
Here we check if we could utilize some indicators of the radiation field status as secondary calibrators of the difference between the estimated ionized gas mass and directly measured HI mass in order to improve the HII-HI mass correlation by parameterizing the mass difference with the mean, flux weighted ratio of those spectra line ratios in the galaxies. As possible indicators we consider the excitation parameter [OIII]/[OII] (Pilyugin & Grebel, 2016), ionization sensitive ratio [SIII]/[SII] (Kewley & Dopita, 2002), and the radiation softness (Vilchez & Pagel, 1988). We find that these indicators correlate with the HII-HI mass ratio with CC0.5 or less. Applying the secondary parameterization to the (HII - HI) mass ratio slightly improves the HII-HI mass relation, but the resulting estimated HI mass does not correlate with the measured HI mass as well as for the more direct method based on equations (1-3) considered above.
3.6 Testing Predictions with the HIMANGA Sample
In order to test the HI mass estimation via equations (1-2), we use an independent sample of MaNGA galaxies for which single-dish radio observations were performed in the frames of HIMANGA project (Masters et al, 2019; Stark et al, 2021). The HIMANGA sample was observed with the Green Bank radio telescope (GBT, Masters et al, 2019), and it provides the HI mass with a 9 arcmin angular resolution for a large fraction of MaNGA galaxies (Masters et al, 2019; Stark et al, 2021). HIMANGA program observed more than a half of all MaNGA galaxies, but not in all of the objects HI was detected.
We apply our equations (1-2, 4) to all HIMANGA galaxies with detected HI and with good data reduction flags (Masters et al, 2019). The sample comprises 1811 objects. The aperture correction is obtained from the estimated HI surface density radial distributions. This independent sample demonstrates a tight, one-to-one correlation between the estimated (via equations 1-2, 4) and measured by GBT mass of neutral hydrogen:
| (5) |
see Figure 4. The CC = 0.736 and rms = 0.291. We also tried to apply the calibration equation (3) instead of equation (4), and obtained similar relationship with slightly different coefficients, and similar rms (0.291) and CC (0.740). If we estimate the correction factor using the relation instead, the correlation and rms stay at the same level.
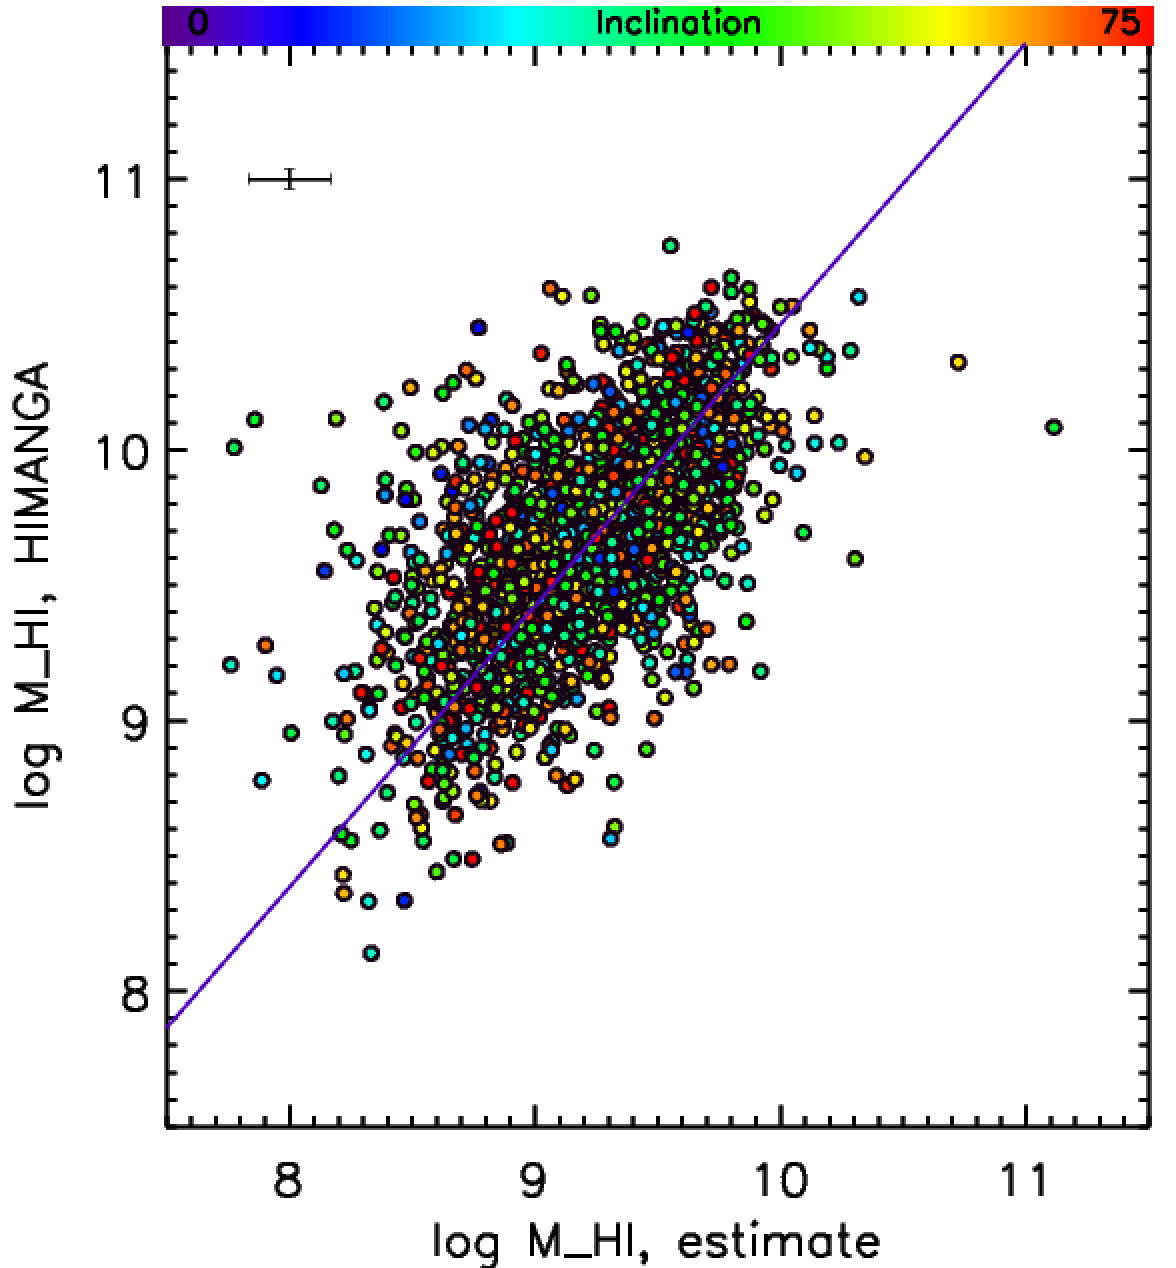
The correlation for the HIMANGA sample is worse with respect to ALFALFA. We attribute it to the worse angular resolution of HIMANGA observations. Since the area of the HIMANGA beam is by the order of magnitude larger, more companion galaxies can contribute to the HI flux and hence to overestimate the HI mass in the HIMANGA aperture in comparison with the optical spectroscopy. The aperture correction calculations are less reliable for the much larger HIMANGA beam area.
The method of HI mass measurement that we propose here is based solely on optical spectra observations. If the N2 abundance calibration (Marino et al, 2013) is used, it would require observations in 3 emission lines only ([OI], [NII], and H) from the red part of optical spectra. These data can be obtained via e.g. narrow-band imaging for multiple galaxies at the same time.
This method can be applied to study the distribution of surface density in diffuse gas in galaxies (Reynolds et al, 1998), not only to assess the total hydrogen mass. In this case the spatial resolution of observations will be much better than that for single dish radio observations.
3.7 Applying the Mass – Metallicity Relations
While MaNGA provides a way to estimate the gas-phase metallicity in each spaxel or resolution element in the galaxies, we envision a survey that would benefit from using as few emission lines as possible. In this case we attempt to substitute the metallicity measurements across the galaxies made with different metallicity calibrators by an integral galactic metallicity estimated from correlations between global galactic parameters. We substitute the stellar mass – gas phase metallicity relation figured out by Tremonti et al (2004) to equation (1), estimate the HI mass with equations (1-2, 4) and compare it with the true HI masses for the HIMANGA sample, similar to what has been done for equation (4). In this case the relationship looks like
with CC = 0.718 and rms = 0.306.
4 Limitations of the Approach
The proposed method has its limitations. It should work in the cases when the intergalactic medium contains ionized and neutral hydrogen in a mix, where the collisional excitation prevails. In turn, it may fail for the purely ionized gas, like inside the Stromgren spheres (Osterbrock & Ferland, 2006) around hot stars. This effect may introduce systematics between high- and low-mass galaxies, and it can be explored in detail with fine resolution (dozens of parsecs) radio and IFU maps in future studies.
It is difficult to find a large sample of galaxies with superior, arcsecond spatial resolution radio observations and with full coverage by panoramic spectroscopy at the same time, so we have to correct for the aperture difference. In §3.4 we apply empirical relations in order to estimate the HI size in galaxies via their optical parameters instead of applying the tight HI mass- HI size relation known from radio data. It increases the scatter of the estimated vs measured mass relation for the price of a possibility to figure out HI masses and surface densities from optical spectroscopy only. It indicates that the empirical HI size uncertainty together with the physical limitations mentioned above can contribute to the slope deviation from unity in Figure 1 and to overall scatter of the "estimated vs directly measured" relation.
5 Conclusions
In this study we propose a method of estimating the neutral hydrogen HI mass from optical spectroscopic observations. The method is motivated by the physical relations between the strength of ionized gas line-emission and the gas ionization fraction. We calibrate the method using HI masses measured by the ALFALFA survey. The scatter of the (estimated - observed) mass difference is of the order of 0.15 dex, which is significantly less than 0.3-0.4 dex that can be obtained with other, purely empirical calibrations (Kannappan, 2004; Zhang et al, 2009; Li & White, 2010; Eckert et al, 2015) of the total HI mass in galaxies. The proposed method is verified via an independent sample of HI measurements provided by the HIMANGA project.
The successful prediction of total galactic HI mass and HI surface density radial distributions via this method opens possibilities for massive studies of HI content in galaxies with detected strong emission lines, presumably in a wide range of redshifts.
Acknowledgements
We’d like to thank David Stark for productive discussions about the subject of the paper. We thank the anonymous referee whose comments and suggestions significantly improved the paper. The study is partly supported by RSCF grant 22-12-00080.
The study makes use of the SDSS-IV MaNGA data available from http://www.sdss.org/dr17/. Funding for the Sloan Digital Sky Survey IV has been provided by the Alfred P. Sloan Foundation, the U.S. Department of Energy Office of Science, and the Participating Institutions.
SDSS-IV acknowledges support and resources from the Center for High Performance Computing at the University of Utah. The SDSS-IV website is www.sdss4.org.
SDSS-IV is managed by the Astrophysical Research Consortium for the Participating Institutions of the SDSS Collaboration including the Brazilian Participation Group, the Carnegie Institution for Science, Carnegie Mellon University, Center for Astrophysics | Harvard & Smithsonian, the Chilean Participation Group, the French Participation Group, Instituto de Astrofísica de Canarias, The Johns Hopkins University, Kavli Institute for the Physics and Mathematics of the Universe (IPMU) / University of Tokyo, the Korean Participation Group, Lawrence Berkeley National Laboratory, Leibniz Institut für Astrophysik Potsdam (AIP), Max-Planck-Institut für Astronomie (MPIA Heidelberg), Max-Planck-Institut für Astrophysik (MPA Garching), Max-Planck-Institut für Extraterrestrische Physik (MPE), National Astronomical Observatories of China, New Mexico State University, New York University, University of Notre Dame, Observatário Nacional / MCTI, The Ohio State University, Pennsylvania State University, Shanghai Astronomical Observatory, United Kingdom Participation Group, Universidad Nacional Autónoma de México, University of Arizona, University of Colorado Boulder, University of Oxford, University of Portsmouth, University of Utah, University of Virginia, University of Washington, University of Wisconsin, Vanderbilt University, and Yale University.
Data Availability
This work makes use of SDSS/MaNGA project data publicly available at https://www.sdss4.org/dr17/data_access/.
References
- Abdurro’uf et al (2022) Abdurro’uf, Accetta K., Aerts C. et al., 2022, ApJS, 259, 35
- Allen et al. (2015) Allen, J. T., Croom, S. M., Konstantopoulos, I. S. et al. 2015, MNRAS, 446, 1567
- Blanton et al (2011) Blanton, M. R., Kazin, E., Muna, D. et al. 2011, AJ, 142, 31
- Bosma (2017) Bosma, A. 2017, book chapter in "Outskirts of Galaxies", Eds. J. H. Knapen, J. C. Lee and A. Gil de Paz, Astrophysics and Space Science Library, Springer.
- Brinchmann et al (2013) Brinchmann, J., Charlot, S., Kauffmann, G. et al., 2013, MNRAS, 432, 2112
- Broelis & Rhee (1997) Broelis, A.H. & Rhee, M.-H. 1997, A&A, 324, 877
- Bundy et al (2015) Bundy, K., Bershady, M. A., Law, D. R., et al. , 2015, ApJ, 798, 7
- Cardelli et al (1989) Cardelli, J. A., Clayton, G. C. & Mathis, J. S., 1989, ApJ, 345, 245
- Dopita et al (2016) Dopita, M. A., Kewley, L.J., Sutherland, R.S. & Nicholls, D.C., 2016, ApSS, 361, 61
- Drory et al (2015) Drory, N., MacDonald, N., Bershady, M. A. et al., 2015, AJ, 149, 77
- Durbala et al (2020) Durbala, A., Finn, R. A., Crone, O.M. et al., 2020, AJ, 160, 271
- Eckert et al (2015) Eckert, K. D., Kannappan, S. J., Stark, D. V. et al. 2015, ApJ, 810, 166
- Gunn et al (2006) Gunn, J.E., Siegmund, W. A., Mannery, E. J. et al., 2006, AJ, 131, 2332
- Haffner et al (2009) Haffner, L. M., Dettmar, R. -J., Beckman, J. E. , et al., 2009, 81, 969
- Hoffman et al (2019) Hoffman, G.L., Dowell, J.C., Haynes, M.P. & Giovanelli, R., 2019, AJ 157, 194
- Kannappan (2004) Kannappan S. J., 2004, ApJ, 611, L89
- Kewley & Dopita (2002) Kewley, L.J. & Dopita, M.A., 2002, ApJS, 142, 35
- Li & White (2010) Li, Cheng & White, S. D. M. 2010, MNRAS, 407, 515
- Marino et al (2013) Marino, R.A., Rosales-Ortega, F. F., Sánchez, S. F. et al., 2013, A&A, 559, 114
- Masters et al (2019) Masters, K.L., Stark, D.V., Pace, Z.J. et al., 2019, MNRAS, 488, 3396
- Osterbrock & Ferland (2006) Osterbrock, D. E. & Ferland, G. J. Astrophysics of Gaseous Nebulae and Active Galactic Nuclei Sausalito, CA: University Science Books, 2006
- Pilyugin & Grebel (2016) Pilyugin, L.S. & Grebel, E. K., 2016, MNRAS, 457, 3678
- Reynolds et al (1998) Reynolds, R.J., Hausen, N.R., Tufte, S.L. and Haffner, L.M., 1998, ApJ 494, L99
- Revalski et al (2022) Revalski, M., Crenshaw, D. M., Rafelski, M., Kraemer, S. et al. 2022, ApJ, 930, 14
- Sanchez et al. (2016) Sanchez, S. F., Garcia-Benito, R., Zibetti, S. et al. 2016,
- Smee et al (2013) Smee, S.A., Gunn, J. E., Uomoto, A. et al., 2013, AJ, 146, 32
- Stark et al (2021) Stark, D.V., Masters, K. L., Avila-Reese, V. et al., 2021, MNRAS, 503, 1345
- Tremonti et al (2004) Tremonti, C. A., Heckman, T. M., Kauffmann, G., Brinchmann, J. et al. 2004, ApJ, 613, 898
- Vilchez & Pagel (1988) Vilchez, J. M. & Pagel, B. E. J., 1988, MNRAS, 231, 257
- Wake et al (2017) Wake, D. A., Bundy, K., Diamond-Stanic, A. et al., 2017, 154, 86
- Wang et al (2016) Wang, J., Koribalski, B.S., Serra, P. et al. 2016, 450, 2143
- Wang et al (2020) Wang, J., Catinella, B., Saintonge, A. et al., 2020, ApJ, 890, 63
- Yan et al (2016) Yan, R., Bundy, K., Law, D. R., et al., 2016, AJ, 152, 197
- Zhang et al (2009) Zhang W., Li C., Kauffmann G., Zou H., et al. 2009, MNRAS, 397, 1243