On the existence, rareness and uniqueness of quenched Hi-rich galaxies in the local Universe
Abstract
Using data from ALFALFA, xGASS, HI-MaNGA and the Sloan Digital Sky Survey (SDSS), we identify a sample of 47 “red but Hi-rich”(RR) galaxies with and unusually high Hi-to-stellar mass ratios. We compare the optical properties and local environments between the RR galaxies and a control sample of “red and Hi-normal”(RN) galaxies that are matched in stellar mass and color. The two samples are similar in the optical properties typical of massive red (quenched) galaxies in the local Universe. The RR sample tends to be associated with slightly lower-density environments and has lower clustering amplitudes and smaller neighbor counts at scales from several hundred kiloparsecs to a few megaparsecs. The results are consistent with the RR galaxies being preferentially located at the center of low-mass halos, with a median halo mass compared to for the RN sample. This result is confirmed by the SDSS group catalog which reveals a central fraction of 89% for the RR sample, compared to 60% for the RN sample. If assumed to follow the Hi size-mass relation of normal galaxies, the RR galaxies have an average Hi-to-optical radius ratio of , four times the average ratio for the RN sample. We compare our RR sample with similar samples in previous studies, and quantify the population of RR galaxies using the SDSS complete sample. We conclude that the RR galaxies form a unique but rare population, accounting for only a small fraction of the massive quiescent galaxy population. We discuss the formation scenarios of the RR galaxies.
1 Introduction
In current theory of structure formation, galaxies form at the center of dark matter halos through gas cooling and condensation (White & Rees, 1978; Mo et al., 2010). As the dominant component of cold gas, the atomic hydrogen (Hi) reservoir is expected to play a vital role in regulating the rise and fall of star formation in galaxies. In fact, the Hi surface mass density in low-redshift galaxies has been found to tightly correlate with the surface density of their star formation rate (SFR), known as the Kennicutt-Schmidt law (Kennicutt, 1998). In addition, large surveys of multiband imaging and spectroscopy as well as Hi emission at 21cm have revealed strong correlations between the Hi-to-stellar mass ratio (/) and the optical and UV properties of galaxies, with lower Hi mass fractions in galaxies with redder colors, lower SFRs and higher stellar mass densities (e.g. Haynes & Giovanelli, 1984; Kannappan, 2004; Zhang et al., 2009; Catinella et al., 2010; Huang et al., 2012; Li et al., 2012; Brown et al., 2015; Catinella et al., 2018; Li et al., 2022; Liu et al., 2023). In particular, it has been widely accepted that the cessation of star formation in a galaxy must be associated with the reduction of its Hi reservoir. In a recent review, Saintonge & Catinella (2022) concluded that there is no evidence for a significant population of passive galaxies with Hi reservoirs comparable to those of star-forming galaxies, based on extensive analyses of the extended GALEX Arecibo SDSS survey (xGASS; Catinella et al., 2010, 2018).
On the other hand, given the large scatter of the Hi scaling relations found in previous studies, typically dex in /, one can expect that some galaxies will deviate significantly from the average relations. Studies of galaxies with Hi anomalies should in principle provide insights into the physical processes that drive gas-related star formation and quenching, and probably also cosmological models (e.g. Peebles, 2022). In this regard, there has been a rich history of studies on the Hi content of early-type galaxies (ETGs; e.g. Knapp et al., 1985; Wardle & Knapp, 1986; Bregman et al., 1992; Morganti et al., 2006; di Serego Alighieri et al., 2007; Grossi et al., 2009; Serra et al., 2012; Young et al., 2014). The ATLAS3D Hi survey (Serra et al., 2012) obtained resolved Hi observations for a volume-limited sample of 166 nearby ETGs selected from ATLAS3D (Cappellari et al., 2011), detecting significant Hi in of all the ETGs inside the Virgo cluster and of those outside. In addition, the Hi discs of these galaxies are found to have much larger sizes than their optical parts, as well as much lower Hi column densities than what was found typically in spiral galaxies (Serra et al., 2012, 2014). Although with large Hi detection rates, ETGs usually have low Hi mass fractions as expected from their relatively low SFRs.
Some other attempts have been made to search for Hi content in E+A, or post-starburst (PSB) galaxies (e.g. Chang et al., 2001; Buyle et al., 2006, 2008; Zwaan et al., 2013; Pracy et al., 2014), a rare population of galaxies that are believed to have their star formation recently shut down, with no/little H emission but strong high-order Balmer absorption indicative of young stars. Zwaan et al. (2013) detected Hi emission in a high fraction (6/11) of E+A galaxies selected from the 2dF Galaxy Redshift Survey (2dFGRS; Colless et al., 2001) and the Sloan Digital Sky Survey (SDSS; York et al., 2000). A followup by Pracy et al. (2014) obtained integral field spectroscopy (IFS) for two E+A galaxies with Hi emission, finding them to be consistent with a post-starburst population only in the central region, with the outer regions of both galaxies presenting strong optical emission lines. It is thus not surprising for a large fraction of the E+A galaxies in Zwaan et al. (2013) to have Hi gas extending to large radii.
There have also been many observational studies to search “Hi-excess” galaxies (e.g. Wang et al., 2013; Huang et al., 2014; Lee et al., 2014; Lemonias et al., 2014; Wang et al., 2015; Geréb et al., 2016; Lutz et al., 2017; Geréb et al., 2018; Lutz et al., 2018, 2020; Randriamampandry et al., 2021; Zasov & Zaitseva, 2022), which are usually strongly star-forming galaxies with late-type morphologies, identified as extreme outliers to the scaling relation between Hi and stellar content of galaxies. Compared to galaxies with normal Hi contents, these galaxies are found to have much larger Hi disks and lower Hi surface densities, but similar optical sizes and radial distributions of the gas-phase metallicity. Geréb et al. (2018) obtained Hi resolved maps and optical spectra for four Hi-excess galaxies, and found that the Hi disk and stellar bulge are counter-rotating in one of the galaxies, suggesting external origin of the excessive Hi. However, Lutz et al. (2020) found no indication for counter-rotation in any of their Hi-excess galaxies. By examining the star formation activity and Hi kinematics, Lutz et al. (2018) suggested that these galaxies stabilize their large Hi discs by their higher-than-average baryonic specific angular momentum, likely inherited from the high spin of their host dark halos.
Several recent studies have focused on Hi-rich galaxies with suppressed SFRs (Lemonias et al., 2014; Parkash et al., 2019; Guo et al., 2020; Wang et al., 2022a; Sharma et al., 2023). Lemonias et al. (2014) selected a parent sample of 258 Hi-rich galaxies from the Arecibo Legacy Fast Arecibo L-band Feed Array Survey (ALFALFA; Giovanelli et al., 2005; Haynes et al., 2018), defined as the top 5% fraction in the distribution of the Hi mass-to-stellar mass ratio. From this parent sample, 20 massive and low-sSFR galaxies with (/), and were selected for followup observations with the Very Large Array (VLA). Guo et al. (2020) analyzed a sample of 279 massive red spirals with and red colors defined by , and found 74/166 in the ALFALFA catalog to have Hi detections. Wang et al. (2022a) obtained followup Hi observations with the Five-hundred-meter Aperture Spherical radio Telescope (FAST; Nan, 2006; Jiang et al., 2020) for the remaining 113 massive red spirals from Guo et al. (2020), detecting Hi in 75 of them. Parkash et al. (2019) and Sharma et al. (2023) selected Hi-detected galaxies from Hi Parkes All-Sky Survey Catalog (HICAT; Meyer et al., 2004) and the HI-MaNGA program (Stark et al., 2021), respectively, both using a mid-infrared color selection of to select galaxies with sSFR . Sharma et al. (2023) further applied a selection of .
The high detection rates of Hi emission in galaxies with suppressed SFRs appear to challenge the well-established correlation of low star formation with low Hi gas mass (see the review by Saintonge & Catinella, 2022, and references therein). Based on an analysis of the data from SDSS, xGASS and ALFALFA, Zhang et al. (2019) claimed that nearly all massive quiescent disk galaxies in the local Universe have a large Hi reservoir, similar to star-forming galaxies of similar masses. This claim was attributed by Cortese et al. (2020) to the use of aperture-corrected SFR estimates from the MPA/JHU SDSS catalog (Brinchmann et al., 2004), which do not provide a fair representation of the global SFR of Hi-rich galaxies with extended star-forming discs. In a recent study, Li et al. (2023) made careful image analysis and obtained reliable SFR estimates for a sample of nearby galaxies, and they confirmed that the MPA/JHU SDSS catalog indeed significantly overestimates the SFRs for low-SFR galaxies. For massive red spirals, Zhou et al. (2021) and Wang et al. (2022a) pointed out that many of the galaxies selected by optical color in Guo et al. (2020) are actually green or even blue in , the NUV-to-optical color index.
In this work, we attempt to identify a sample of “red but Hi-rich” (RR) galaxies, in a way that differs from previous studies. First, we make use of three existing Hi surveys/catalogs to maximize our sample size. These include xGASS, ALFALFA and HI-MaNGA. Second, we use as a reliable indicator of the global star formation status of a galaxy, and we use the commonly adopted color criterion of to select truly red, thus fully-quenched galaxies. As we will show, this color index works better than both the optical color and the mid-infrared color . Third, we use a complete (volume-limited) sample of galaxies selected from the SDSS as a reference, and we identify our RR galaxies as outliers located outside the 95% contour of the SDSS galaxy distribution in the Hi mass fraction versus space. For each of the SDSS galaxies, we have estimated an Hi mass based on Bayesian inferences of a number of optical properties, a technique developed in our previous work (Li et al., 2022). With the help of the SDSS sample, we are able to quantify the existence and rareness of the RR galaxies as a population. Finally, we use SFRs from both the MPA/JHU SDSS catalog and the GSWLC (Salim et al., 2018). The latter applied SED fitting to photometry from UV to IR, expected to provide more reliable estimates particularly for low-SFR galaxies (e.g. Li et al., 2023). As we will show, the RR sample selected this way is unique compared to all the previous similar samples. We will compare the optical properties and local environment of the RR galaxies with control samples of Hi-normal galaxies of similar mass and color.
2 Data and sample selection
2.1 Hi galaxy surveys
We use Hi observations of nearby galaxies from three surveys: ALFALFA, xGASS, and the HI-MaNGA program.
ALFALFA is a blind survey of Hi 21 cm emission in galaxies over deg2 of the sky and up to redshift . Two sky areas are covered by ALFALFA: one in the northern Galactic hemisphere and one in the southern Galactic hemisphere. The final ALFALFA catalog, the catalog contains extragalactic Hi line sources out to (Haynes et al., 2018). For each source, a category code is assigned according to data quality, with “code 1” for sources of the highest data quality and “code 2” for sources with lower data quality but a high likelihood to be true. There are 25,434 sources of “code 1” and 6,068 sources of “code 2”. In this work we use both categories.
The xGASS was accomplished also with the Arecibo telescope for targeted galaxies that are randomly selected from a parent sample of galaxies located in the overlapping region among SDSS data release 6 (Adelman-McCarthy et al., 2008), GALEX Medium Imaging Survey (Martin et al., 2005), and the ALFALFA survey footprint. The whole program was separated into two successive phases resulting in two complementary surveys: GASS and xGASS. The GASS obtained Hi observations for a sample of galaxies with redshift and a flat stellar mass distribution in the range , down to a uniform limit of % in Hi-to-stellar mass ratio. The xGASS extends the stellar mass limit of the survey down to , by further observing a sample of galaxies with in the redshift range . In this work we use the xGASS representative sample constructed by Catinella et al. (2018), including 1,179 galaxies from GASS and xGASS.
The HI-MaNGA is an Hi followup program for the SDSS-IV MaNGA survey (Bundy et al., 2014). The MaNGA galaxies with and located outside the ALFALFA footprint are observed with the Green Bank telescope, down to a rms noise comparable to the ALFALFA survey (around 1.5mJy at a velocity resolution of 10 ). The final Hi-MaNGA catalog contains 6,358 MaNGA galaxies.
2.2 The SDSS galaxy sample
To compare our Hi-selected samples with the general galaxy population, we have selected a volume-limited sample of galaxies out of the New York University Value-Added Galaxy Catalog (NYU-VAGC), constructed by Blanton et al. (2005) from the SDSS spectroscopic galaxy sample. This sample includes 69,296 galaxies with stellar masses and spectroscopically-measured redshifts .
2.3 Galaxy properties
For each galaxy in the Hi surveys and the SDSS sample we have collected or measured the following properties:
- •
-
•
: color index defined by NUV and -band absolute magnitudes provided in NSA, both -corrected and measured with an ellipitcal Petrosian model, but based on the GALEX and SDSS images, respectively.
-
•
: error of , calculated through error propagation based on the inverse variance of the NUV and band absolute magnitudes in the NSA.
-
•
and : the radii containing, respectively, and of the elliptical Petrosian flux in band, in units of kpc, taken from NSA.
-
•
: the concentration index characterizing the degree of light concentration in the band.
-
•
: surface stellar mass density in units of .
-
•
: the spectral break at Å taken from the MPA/JHU SDSS catalog222https://wwwmpa.mpa-garching.mpg.de, measured from the SDSS single fiber spectroscopy following the definition introduced by Balogh et al. (1999).
-
•
: central stellar velocity dispersion taken from the MPA/JHU SDSS catalog, in units of km/s.
-
•
SFR: total star formation rate in units of . We use two SFR estimates: one from the GSWLC catalog derived by Salim et al. (2018) through SED fitting to the photometry ranging from UV to IR, and the other from the MPA/JHU catalog derived by Brinchmann et al. (2004) based on SDSS spectroscopy. The Chabrier IMF is assumed in both cases. Unless otherwise stated we will use the GSWLC-based SFR.
-
•
sSFR : specific star formation rate. The GSWLC-based SFR is used unless otherwise stated.
-
•
: bulge-to-total luminosity ratio, taken from Meert et al. (2015).
-
•
T-type: galaxy morphological type provided by Domínguez Sánchez et al. (2018). Generally, galaxies with T-type (T-type ) correspond to early-type (late-type) morphologies in the Hubble sequence.
- •
- •
-
•
and : color index measured at and , based on the and band images from the DESI Legacy Survey333https://www.legacysurvey.org.
-
•
: radial gradient in .
In addition to the optical properties listed above, we have estimated the Hi gas mass for each galaxy using the estimator developed in Li et al. (2022). In short, the estimator uses a linear combination of four photometric parameters to estimate the Hi-to-stellar mass ratio (/) of galaxies, with coefficients of the parameters constrained using Bayesian inferences of real Hi data from the xGASS. Extensive tests show that the estimator can provide unbiased Hi mass for optically-selected samples like SDSS. The reader is referred to Li et al. (2022) for more details about the tests and applications of the estimator. The Hi mass distribution of the SDSS volume-limited sample provides a predicted reference, to be compared below with samples selected from the Hi surveys.
| id | ra | dec | z | Hi src | |||||||
|---|---|---|---|---|---|---|---|---|---|---|---|
| [] | [mag] | [kpc] | [kpc] | [] | [] | [] | |||||
| 0 | 28.6710 | -0.1434 | 0.0185 | 10.68 | 5.33 | 0.54 | 1.06 | -1.37 | -1.54 | 10.17 | 2 |
| 1 | 19.4449 | 13.3234 | 0.0479 | 10.25 | 5.26 | 0.33 | 0.86 | -1.87 | -1.22 | 10.12 | 0 |
| 2 | 128.1644 | 53.2332 | 0.0430 | 10.30 | 5.11 | 0.39 | 0.88 | -1.99 | -0.98 | 10.00 | 2 |
| 3 | 52.3316 | -6.4779 | 0.0420 | 10.20 | 5.26 | 0.23 | 0.67 | -1.02 | -1.17 | 9.85 | 2 |
| 4 | 149.4660 | 1.7554 | 0.0320 | 10.54 | 5.70 | 0.39 | 0.83 | -2.05 | -1.23 | 9.66 | 2 |
| 5 | 179.6394 | 1.3700 | 0.0485 | 10.32 | 5.73 | 0.26 | 0.71 | -1.86 | -1.39 | 9.77 | 0 |
| 6 | 142.0508 | 3.4084 | 0.0116 | 10.31 | 5.53 | 0.11 | 0.62 | -2.25 | -1.66 | 9.48 | 0 |
| 7 | 153.3518 | 5.0255 | 0.0464 | 10.05 | 5.40 | 0.14 | 0.55 | -2.05 | -1.38 | 9.44 | 1 |
| 8 | 221.8548 | 3.4411 | 0.0274 | 10.42 | 5.39 | 0.29 | 0.82 | -1.37 | -1.29 | 10.06 | 0 |
| 9 | 333.9182 | 13.8821 | 0.0246 | 10.09 | 5.15 | 0.30 | 0.71 | -0.65 | -1.13 | 9.38 | 0 |
| 10 | 340.1470 | 13.9773 | 0.0367 | 10.24 | 5.35 | 0.29 | 0.78 | -0.78 | -1.31 | 9.82 | 0 |
| 11 | 198.3802 | 5.9155 | 0.0486 | 10.98 | 5.43 | 0.73 | 1.15 | -1.32 | -0.95 | 10.46 | 0 |
| 12 | 163.0032 | 50.8430 | 0.0260 | 10.20 | 5.94 | 0.30 | 0.73 | -2.58 | -1.43 | 9.32 | 2 |
| 13 | 159.7155 | 5.6701 | 0.0283 | 10.26 | 5.63 | 0.33 | 0.77 | -2.50 | -1.33 | 9.96 | 2 |
| 14 | 139.6306 | 6.8732 | 0.0393 | 10.38 | 5.78 | 0.26 | 0.75 | -0.68 | -1.29 | 9.44 | 1 |
| 15 | 242.0909 | 26.5281 | 0.0540 | 10.56 | 6.50 | 0.33 | 0.83 | -1.10 | -1.05 | 9.76 | 0 |
| 16 | 249.3657 | 26.2047 | 0.0522 | 10.81 | 6.50 | 0.81 | 1.25 | -1.21 | -1.24 | 10.10 | 0 |
| 17 | 215.6282 | 11.3049 | 0.0164 | 10.36 | 5.34 | 0.10 | 0.61 | -1.49 | -1.80 | 9.57 | 0 |
| 18 | 223.2200 | 12.3523 | 0.0299 | 10.50 | 5.73 | 0.32 | 0.82 | -1.94 | -1.46 | 9.67 | 0 |
| 19 | 155.5138 | 13.7695 | 0.0186 | 10.18 | 5.14 | 0.36 | 0.88 | -2.92 | -1.42 | 9.53 | 0 |
| 20 | 226.2269 | 7.2125 | 0.0560 | 10.09 | 5.25 | 0.25 | 0.67 | -1.52 | -1.45 | 10.12 | 0 |
| 21 | 216.0679 | 33.6126 | 0.0223 | 10.38 | 5.26 | 0.24 | 0.68 | -1.95 | -1.62 | 9.58 | 0 |
| 22 | 149.7208 | 31.6203 | 0.0214 | 10.47 | 5.49 | 0.37 | 0.88 | -2.19 | -1.36 | 9.61 | 0 |
| 23 | 178.1931 | 32.3099 | 0.0317 | 10.44 | 5.16 | 0.27 | 0.78 | -1.93 | -0.98 | 9.82 | 0 |
| 24 | 205.5474 | 29.8956 | 0.0272 | 10.22 | 5.16 | 0.02 | 0.47 | -1.56 | -1.59 | 9.77 | 0 |
| 25 | 208.8057 | 25.2164 | 0.0360 | 10.22 | 5.49 | 0.31 | 0.80 | -1.42 | -1.30 | 9.90 | 0 |
| 26 | 227.1210 | 21.9477 | 0.0206 | 10.56 | 5.34 | 0.45 | 0.94 | -2.04 | -1.60 | 9.89 | 0 |
| 27 | 246.7624 | 16.3822 | 0.0154 | 10.46 | 6.50 | 0.52 | 0.97 | -1.48 | -1.25 | 9.65 | 0 |
| 28 | 142.5893 | 25.2524 | 0.0587 | 10.95 | 5.41 | 0.71 | 1.24 | -0.77 | -1.23 | 10.15 | 0 |
| 29 | 162.3703 | 26.0396 | 0.0217 | 10.36 | 5.51 | 0.16 | 0.66 | -2.16 | -1.45 | 9.66 | 0 |
| 30 | 155.4069 | 21.6873 | 0.0392 | 10.53 | 5.16 | 0.36 | 0.83 | -0.51 | -1.26 | 9.78 | 0 |
| 31 | 120.0874 | 11.3194 | 0.0149 | 10.25 | 6.13 | 0.27 | 0.68 | -1.40 | -1.90 | 9.57 | 0 |
| 32 | 132.6887 | 11.8108 | 0.0297 | 10.41 | 5.50 | 0.20 | 0.66 | – | -1.36 | 9.58 | 1 |
| 33 | 241.2004 | 14.1289 | 0.0338 | 10.87 | 5.12 | 0.42 | 0.91 | -1.71 | -1.09 | 10.54 | 0 |
| 34 | 240.8469 | 14.5245 | 0.0357 | 10.52 | 5.19 | 0.29 | 0.77 | -1.40 | -1.28 | 9.80 | 0 |
| 35 | 150.2089 | 13.7370 | 0.0325 | 10.20 | 5.16 | 0.09 | 0.60 | -1.90 | -1.51 | 9.83 | 0 |
| 36 | 171.2433 | 7.6274 | 0.0415 | 10.75 | 5.05 | 0.48 | 1.01 | – | – | 10.12 | 0 |
| 37 | 16.5919 | 6.2825 | 0.0352 | 10.87 | 5.13 | 0.48 | 0.98 | – | – | 10.63 | 0 |
| 38 | 23.6161 | 19.8206 | 0.0357 | 10.87 | 5.14 | 0.49 | 0.96 | – | – | 10.22 | 0 |
| 39 | 45.1559 | 35.1691 | 0.0169 | 10.77 | 6.50 | 0.58 | 0.98 | – | – | 9.50 | 0 |
| 40 | 359.4070 | 18.1909 | 0.0260 | 10.53 | 5.54 | 0.24 | 0.71 | – | – | 9.72 | 0 |
| 41 | 1.4582 | 17.3534 | 0.0181 | 10.17 | 5.21 | 0.04 | 0.55 | – | – | 9.76 | 0 |
| 42 | 24.0705 | 23.2281 | 0.0343 | 10.93 | 5.67 | 0.59 | 1.11 | – | – | 10.13 | 0 |
| 43 | 329.8712 | 15.2784 | 0.0252 | 10.50 | 5.53 | 0.23 | 0.73 | – | – | 9.85 | 0 |
| 44 | 37.0733 | 26.3125 | 0.0174 | 10.63 | 5.75 | 0.26 | 0.80 | – | – | 10.22 | 0 |
| 45 | 344.9648 | 26.0331 | 0.0332 | 11.15 | 6.50 | 0.93 | 1.34 | – | – | 9.98 | 0 |
| 46 | 207.9975 | 13.9675 | 0.0366 | 10.89 | 6.50 | 0.83 | 1.28 | -0.21 | 0.04 | 9.96 | 1 |
2.4 Selection of red Hi-rich galaxies
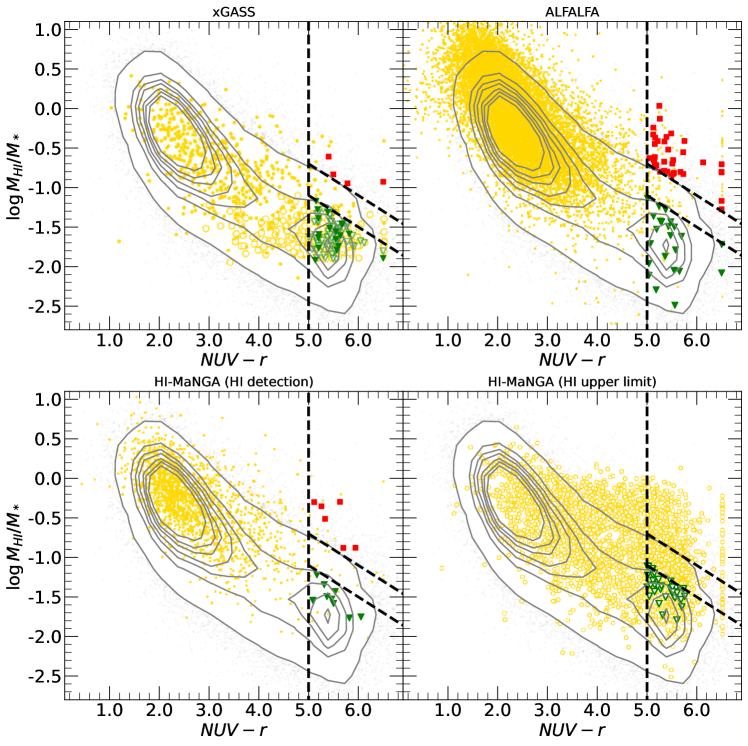
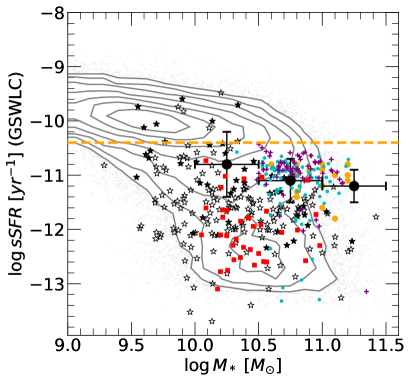
Figure 1 shows / versus , for the three Hi surveys and the SDSS volume-limited galaxy sample. The SDSS sample is plotted as grey contours and repeated in every panel. Galaxies in different Hi surveys are shown as colored symbols in different panels. In each panel, Hi detections are plotted as solid dots, while upper limits are plotted as open circles. For clarity the Hi-MaNGA sample is divided into two panels, one for Hi detections and one for upper limits. The anti-correlation between Hi mass fraction and color, and the color bimodality can be clearly seen in the SDSS sample. All the current Hi surveys are biased for relatively Hi-rich and blue galaxies due to limited survey depths. Although the smallest in sample size, the xGASS is the deepest and thus most complete among all the surveys considered here. However, even the xGASS lacks all the red galaxies with /%. Interestingly, the shallower ALFALFA survey has detected Hi for a (small) number of low- galaxies with red colors () and low gas fraction because of their relatively high Hi masses, covering nearly the same range of / as predicted for the red galaxy population in the SDSS.
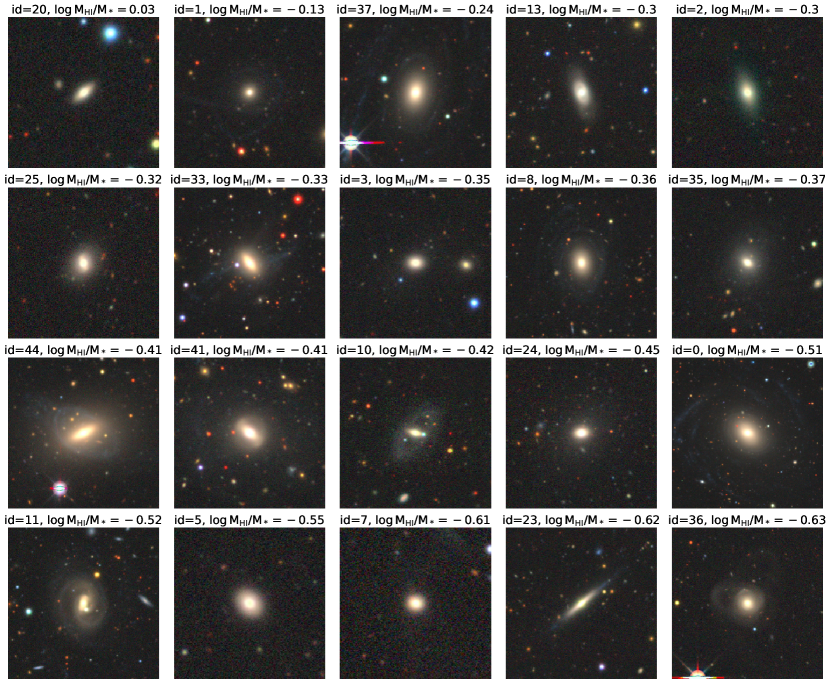
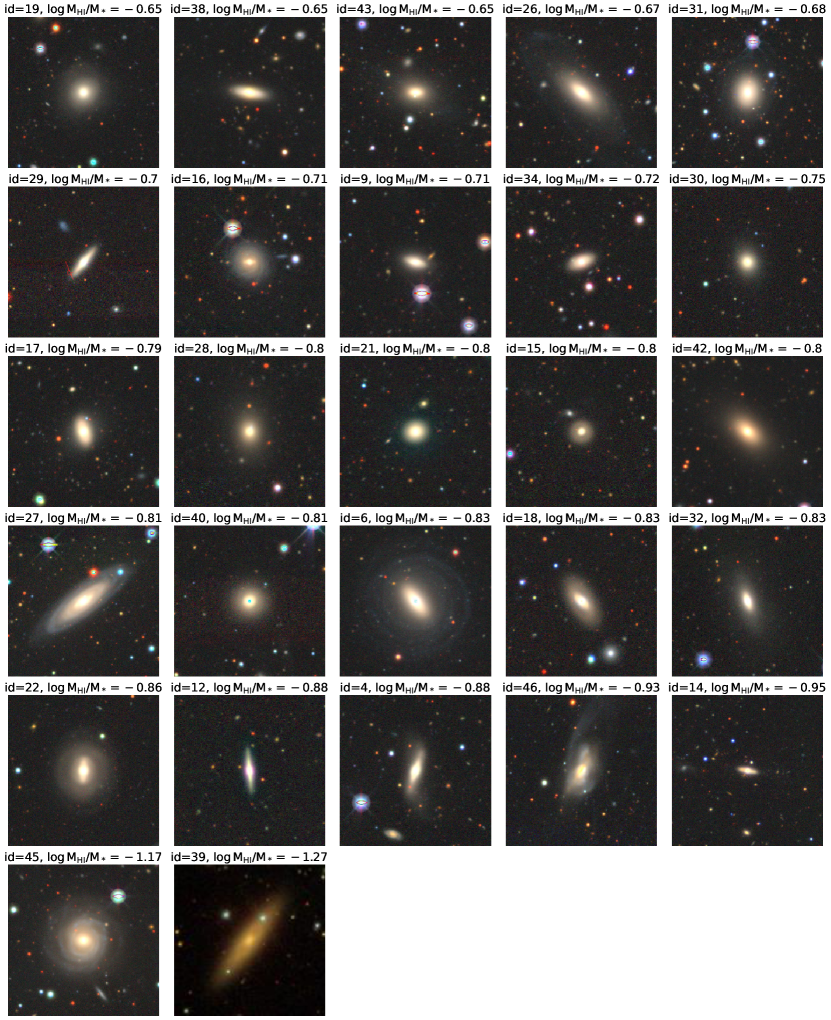
We select red but Hi-rich (RR) galaxies from the three Hi surveys by requiring them to have substantially red colors, and , as well as outstandingly high Hi masses, /. The two criteria are indicated by the vertical and upper-right dashed lines in Figure 1. The latter criterion is manually determined, and it roughly matches the 95% percentile contour of the SDSS galaxy distribution. We consider only Hi detections when identifying RR galaxies, to make sure their Hi mass fractions meet our requirement. For comparison, we have selected a sample of red and Hi-normal (RN) galaxies with the same criteria in color and color error as adopted for RR, but requiring the Hi-to-stellar mass ratio to fall below the 75% percentile contour, or specifically /, as indicated by the lower dashed line plotted to the right of each panel. We consider both Hi detections and upper limits when selecting RN galaxies. This is because a galaxy must fall below the lower dashed line if its Hi upper limit is already below this line. There are a small number of galaxies with unusually red colors (6.5) due to their extremely large values of NUV magnitude with large uncertainties. We have visually examined their NUV images and found them to be truly faint in NUV. In order to include them in our analysis, we assign them a fixed color index of , the reddest color that can be reached by a simple stellar population (SSP) in current stellar population models (e.g. Bruzual & Charlot, 2003). We apply the same criteria as above to select these galaxies into the RR or RN sample. In addition, we require all the selected RR and RN galaxies to not be confused with neighboring galaxies located in the same beam. We identify galaxies free of confusion by requiring HIconf_flag=0 for those from xGASS, and conf_prob<0.1 for those from Hi-MaNGA. For those from ALFALFA, we require them to have no neighboring galaxies within an angular radius of 3.5′ and a radial velocity separation of . Finally, we visually examine the DESI image of all the selected galaxies, and exclude the edge-on galaxies with obvious dust lanes which could be intrinsically blue but reddened by dust attenuation.
With these restrictions we end up with 47 RR galaxies (37 from ALFALFA, 4 from xGASS and 6 from Hi-MaNGA), as well as 573 RN galaxies (43 from ALFALFA, 237 from xGASS and 293 from Hi-MaNGA). The basic properties of the RR sample are listed in Table 1. In order to take care of the mass dependence when comparing the RR and RN samples, we further trim the RN sample so that its distribution is the same as the RR sample. This yields a final sample of 154 RN galaxies, with 23 from ALFALFA, 80 from xGASS and 51 from Hi-MaNGA. The RR and RN galaxies are highlighted in red and green color in Figure 1, respectively. Note that the RN sample is dominated by upper limits.
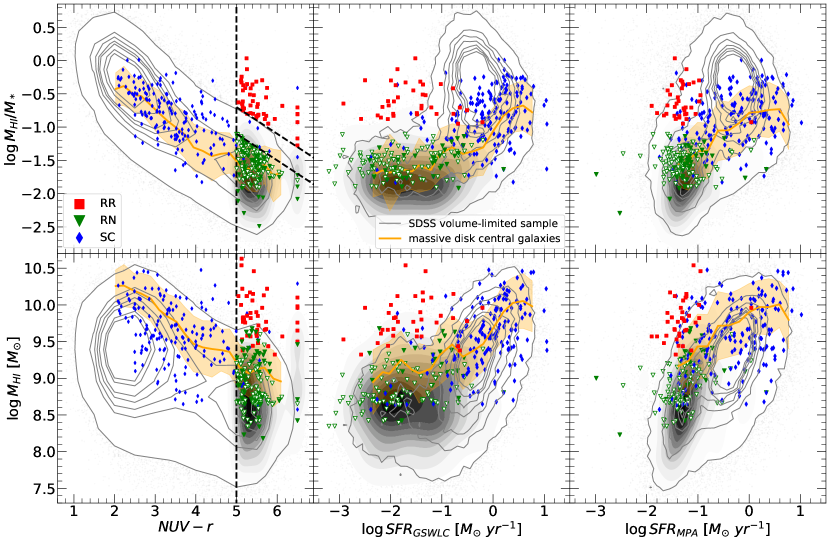
The upper-left panel of Figure 2 displays the / versus relation for the final samples of RR and RN galaxies. In addition to these two samples, we have selected a stellar mass-controlled (SC) sample of 177 galaxies from the xGASS, which has the same distribution as the RR and RN samples but with no restrictions on the color and the Hi mass fraction. The galaxies in the SC sample are plotted as blue diamonds. The lower-left panel plots the Hi mass instead of the Hi-to-stellar mass ratio as a function of for the same samples. In the middle and right panels we plot / and as functions of SFR, using the SFR estimates from GSWLC and the MPA/JHU catalog, respectively.
The RR and RN galaxies are roughly separated at , and both samples are dominated by galaxies with low SFRs (SFR) consistent with their red colors, for SFRs given by both GSWLC and MPA/JHU. When the GSWLC SFRs are used and at the low-SFR end (SFR), the RN and SC samples appear to follow roughly the overall trend of the SDSS sample, where both the Hi-to-stellar mass ratio and the total Hi mass depend only weakly on the SFR, roughly at (/) and (/), respectively. At higher SFRs, the SC sample follows the -SFR relation of the SDSS sample, but is biased towards relatively low (/). This should be produced by the relatively high stellar masses of the SC sample at which the average SFR is reduced by galaxies from the quiescent sequence (see Figure 3 below). When the MPA/JHU SFRs are used and at the low-SFR end, the SDSS sample presents a clump-like distribution in the / versus SFR relation and a positive correlation between and SFR, with a more limited SFR range and larger scatter in / and than when the GSWLC SFRs are adopted. The distributions of the RR, RN and SC samples relative to the SDSS sample remain similar, however, regardless of the adopted SFR estimate.
One may worry that the RN sample is not substantially representative of the general population of red galaxies, as it is selected from the Hi surveys but not directly from the parent SDSS sample. To address this possibility, we use the SDSS sample to construct another control sample (referred to as “CSC”), which consists of 423 galaxies and is matched with the RR sample in both and . The distributions of the CSC sample are shown as filled grey contours in Figure 2. As expected, the CSC sample well represents the underlying red population of the SDSS sample.
The majority of the RR galaxies are located beyond the 95% contour of the SDSS sample, suggesting that red galaxies with large amounts of Hi gas are rather rare. In other words, red/quenched galaxies are mostly Hi-poor, with only a small fraction having unusually large amounts of Hi gas. In the next section we will compare the RR and RN samples in detail, aiming to figure out the origin of the high Hi gas content of RR galaxies.
3 Results
3.1 Optical properties
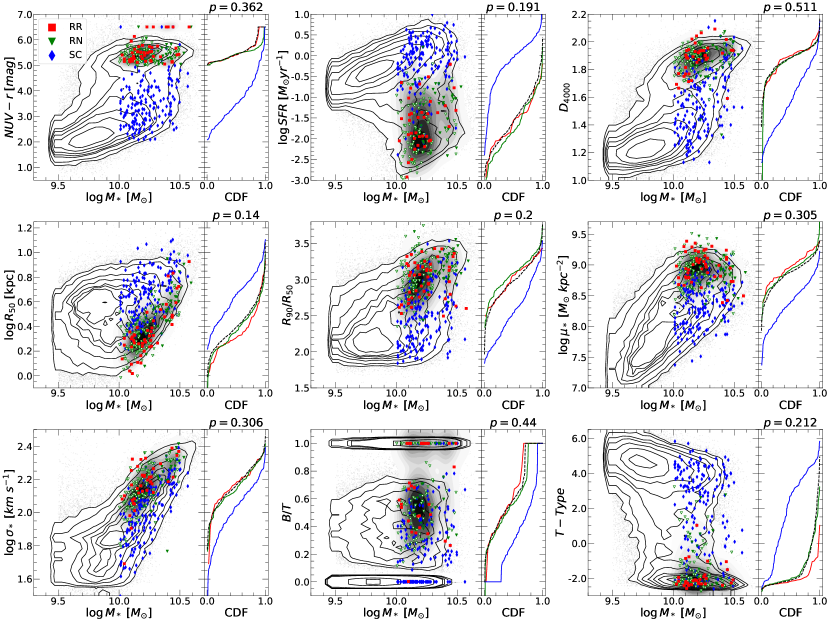
In Figure 3 we examine the optical properties for the RR and RN samples, and compare with the SC sample and the SDSS volume-limited sample. We consider a variety of galaxy properties, each plotted in one panel as a function of . In each panel, the RR, RN and SC galaxies are plotted as red squares, green triangles, and blue diamonds, respectively. The distribution of the SDSS sample is plotted as the background contours. The CSC sample is shown as the grey filled contours. A side panel is added to the right of each panel, showing the cumulative distribution of the corresponding property for the RR, RN, SC and CSC samples, respectively. Overall, the well-known galaxy bimodality can be clearly seen from the SDSS sample in many properties, e.g. , SFR, , , and the T-type. In all panels the RN sample shows similar distributions to the CSC sample, demonstrating that the RN sample is a representative subsample of the red galaxy population of their mass. The RR galaxies are limited to relatively high masses, with , a result that can be understood from their red colors. As can be seen from the color-mass diagram (the top-left panel), the general population of galaxies at from the SDSS sample is predominantly massive.
We find that the RR and RN galaxies have similar distributions in all the properties considered. Both types of galaxies fall in the sequences of red (by selection) and quiescent galaxies with relatively low SFRs and old stellar populations as indicated by their high . The two types of galaxies are also similar in optical size () and structural properties ( and ) at any given mass, with smaller sizes, more centrally concentrated light distributions and higher stellar mass densities in comparison to the general galaxy population. In addition, they exhibit similarly high , high and low T-type, all indicative of early-type morphologies.
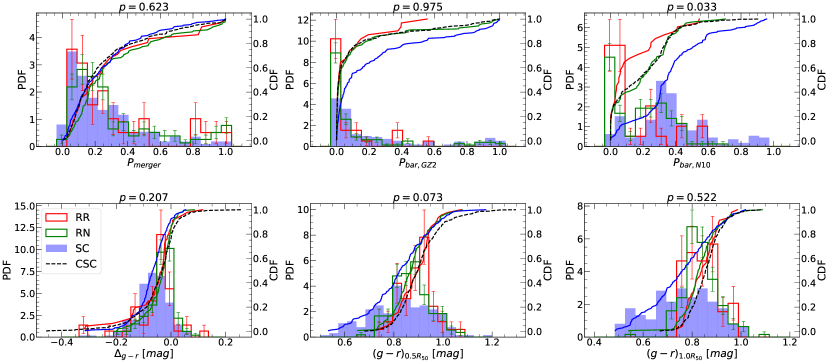
In Figure 4 we further examine the merger probability (), the probabilities of hosting a galactic bar ( and ), the color indices measured at and , and the radial gradient of the color indices. For each property, we show both the differential and the cumulative distributions for the three samples: RR, RN and SC. The RR and RN samples show very similar distributions for all properties considered except , which appears to be smaller in the RR sample on average. The different distributions of and may be produced by the different definitions of the two parameters, which can also be seen from their distributions in the SC sample. Given this difference, both the large -value of the KS test using and the small -value using should be taken with caution. We note that, however, nearly all the galaxies in both samples have indicative of no/weak bars, a result that is true for both and . The majority of the RR and RN galaxies have low merger and bar probabilities, as well as negative color gradients, with , , and for of the sample galaxies. Nearly all the RR and RN galaxies have at both and , consistent with their globally red colors. When compared to the SC sample, both the RR and RN samples are similar in and , smaller in and , and larger in at both and .
Results as seen from Figure 3 and Figure 4 strongly suggest that, when compared to the RN galaxies of similar stellar masses, the RR galaxies have nothing special in any of the properties we have examined, including both the properties related to stellar populations and those related to galaxy structure, morphology and mergers. In fact, for each property we have performed a Kolmogorov-Smirnov (K-S) test for the RR and RN samples. The resulting values are indicated above the panels in both figures, which confirm that the two samples are statistically drawn from the same parent sample.
3.2 Environments
The cold gas content of galaxies may be effectively reduced by environmental effects occurring in dense regions such as tidal stripping and ram-pressure stripping. These effects are expected to be more efficient for satellite galaxies than for central galaxies. To examine the central/satellite fractions of our galaxies and their environments at different scales, we use the SDSS galaxy group catalog of Yang et al. (2007) and the local environment density inferred from the density field reconstructed by Wang et al. (2016a), and we measure the projected two-point correlations and neighbor counts for our galaxy samples using the SDSS spectroscopic and photometric samples.
First of all, we cross match the RR, RN and SC samples with the group catalog constructed by Yang et al. (2007). A small number of our galaxies are not included in the group catalog, including 10, 16, and 3 galaxies from the RR, RN and SC samples, respectively. For these galaxies, we use the NSA to examine their neighboring galaxies, and we find that most of them (10/10, 14/16, 3/3 for the RR, RN and SC samples, respectively) are either the most massive or the only galaxy within a projected radius of 1 Mpc. We thus classify these “locally dominant galaxies” as centrals. The numbers and fractions of central/satellite galaxies in the three samples are listed in Table 2. We find that the majority of the RR galaxies are centrals in their host groups, with a very high central fraction of 89%, compared to 64% and 76% in the RN and SC samples, respectively. According to the group catalog, we find the median halo mass of the RR galaxies is , with of the sample (compared to and for the RN and SC samples) to be hosted by relatively low-mass halos with . For the RN galaxies, their host halos span a wide range of halo mass, with a median halo mass of and a significant fraction () above . This result clearly shows that, different from the RN galaxies, the RR galaxies are mainly central (or isolated) galaxies in relatively low mass halos, thus free of strong environmental effects and more capable of accreting and/or retaining their cold gas.
| sample | centrals or isolated | satellites | Total |
|---|---|---|---|
| RR | 42(89%) | 5(11%) | 47 |
| RN | 98(64%) | 56(36%) | 154 |
| SC | 134(76%) | 43(24%) | 177 |
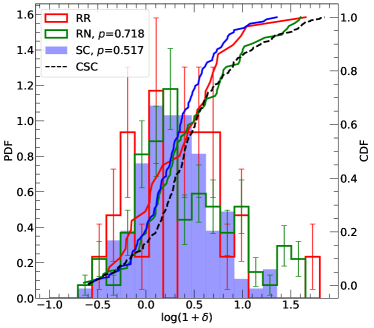
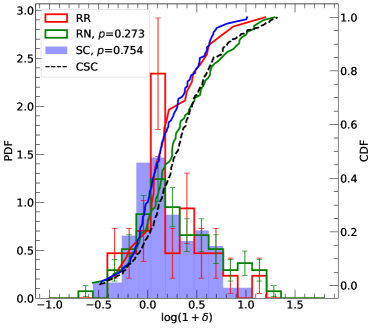
Next, we examine the three-dimensional overdensity of the local environment of our galaxies, , where and are the local and mean matter density, respectively. Taken from the “Exploring the Local Universe with the reConstructed Initial Density Field” project (ELUCID; Wang et al., 2016a), the matter density field can well reproduce the distribution of both galaxies and groups of galaxies in the local Universe as observed by SDSS. Overdensities can be estimated at different scales by smoothing the density field with Gaussian kernels of different sizes. In Figure 5 we compare the distribution of the local overdensity as estimated at scales of 2 Mpc (left panel) and 4 Mpc (right panel) for different samples. At both scales, we find a trend for the RR galaxies to be located in relatively underdense regions compared to the RN sample, although the -value of the two-sample Kolmogorov-Smirnov test shows that this difference is not very significant. The difference is more pronounced at 4 Mpc than at 2 Mpc, as indicated by the -values.
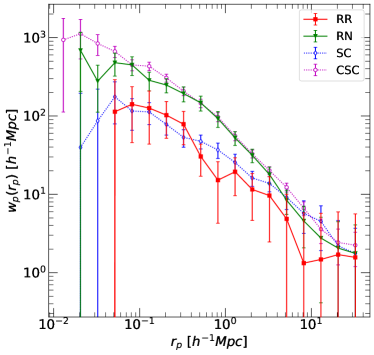
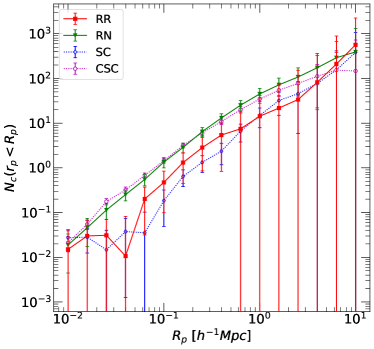
We estimate two more statistics to further probe the environment of our galaxies over a wider range of spatial scales. The first statistic is the projected cross-correlation function (PCCF), , measured for each of our samples with respect to a reference sample of galaxies from the SDSS spectroscopic survey. This statistic quantifies the clustering of galaxies over scales from a few kpc up to a few Mpc. The other statistic is the background-subtracted neighbor count, , that is, the average number of neighboring galaxies within a projected distance around the galaxies in our samples, as estimated in the SDSS photometric sample down to the -band limiting magnitude of mag. The contribution by uncorrelated background galaxies is statistically estimated and subtracted. Detailed descriptions of the two statistics and tests/applications can be found in Li et al. (2006b, 2008a, 2008b) and Wang & Li (2019). Figure 6 shows our measurements of and for the different samples. First of all, for the CSC sample both the and measurements are in good agreement with those of the RN sample, demonstrating again that the RN sample is a random subset of the red population of their mass.
On scales larger than a few Mpc, the RN and SC samples present similar amplitudes, implying similar dark matter masses of their host halos, while the RR sample shows weaker clustering (although with large errors). This result is consistent with both the smaller halo masses of the RR galaxies as found above from the SDSS group catalog and the lower local densities found at 4 Mpc from the reconstructed density field. On intermediate scales from a few Mpc down to kpc, the RR and SC samples show similar clustering amplitudes, which are significantly lower than that of the RN sample. The stronger clustering of the RN sample than the SC sample can be attributed to the different colors of the two samples. Previous studies of galaxy clustering have shown that, at scales below a few Mpc, red galaxies are more strongly clustered than blue galaxies of similar masses (e.g. Li et al., 2006a). Since the RR and RN samples are matched in both stellar mass and color, the weaker clustering of the RR sample at intermediate scales can be understood from the aforementioned higher fraction of central galaxies. As shown in Li et al. (2006b) and Wang & Li (2019), the dip in at intermediate scales can well be reproduced by models in which a higher-than-average fraction of the galaxies are located at the centers of their host dark matter halos.
The measurements present similar behaviors to . This is expected as the two statistics are closely related. Compared to , the are measured with smaller errors on the smallest scales (kpc) thanks to the much deeper photometric sample. We see a trend for a dip at kpc as well as an upturn at smaller scales in the average number of close companions around the RR galaxies. This result might indicate some role of tidal interactions or mergers for RR galaxies. Large samples and more studies are needed to test this hypothesis.
3.3 Hi-to-optical size ratio
Previous studies have revealed a tight relation between the Hi disk size and Hi mass for nearby galaxies (e.g. Wang et al., 2016b, and reference therein). The unusually high Hi mass fractions of the RR galaxies thus imply large Hi disk sizes relative to galaxies with normal Hi contents, if we assume that different types of galaxies follow the same Hi size-mass relation. We estimate the radius of the Hi disk () for each galaxy in our samples using the Hi disk size-mass relation from Wang et al. (2016b), where is defined as the radius at which the surface Hi mass density is equal to . The left-hand panel of Figure 7 shows the ratio of the estimated to the optical radius as a function of stellar mass for the different samples of galaxies, with the side panel showing the histogram of of all the galaxies in each sample. As expected, the RR galaxies have the largest Hi-to-optical size ratios with an average of 4, compared to 1 for the RN sample and 1.7 for the SC sample. We see weak dependence on the stellar mass for all the three samples, although there is considerable scatter at fixed mass. Note that the RN sample is dominated by Hi upper limits, and so the estimated Hi sizes are also upper limits. This means that the Hi disk of red galaxies with normal Hi content is comparable or even smaller than their optical disk.
One of our RR galaxies, UGC 1382 (id=0 in Table 1) with resolved Hi observations available for measuring Hi disk size (Hagen et al., 2016) is highlighted in Figure 7 as a red square with black borders. This galaxy is above the average Hi size-mass relation from Wang et al. (2016b), but with a deviation that is only slightly larger than the 3 scatter. Although with only one galaxy, this result supports the assumption that the galaxies from different samples follow the same Hi size-mass relation. This assumption is actually consistent with previous studies of resolved Hi observations of nearby galaxies. For instance, using Hi maps of nearby galaxies obtained from the Westerbork Synthesis Radio Telescope (WSRT), Wang et al. (2013) found that their “bluedisk” galaxies with unusually high Hi mass fractions lie on the same Hi mass versus Hi size relation as the control galaxies with normal Hi content, although the former have much larger Hi-to-optical size ratios, with extending to values as large as kpc for (see Figure 6 of their paper). Therefore, applying the same size-mass relation to estimate Hi radii for different samples appears to be a reasonable choice for our analysis here, before large samples of resolved Hi observation become available in the future.

4 Discussion
4.1 Uniqueness of the RR galaxies
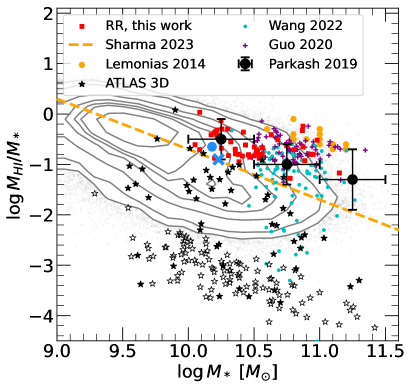
In this subsection we compare our RR sample with similar samples in previous studies. First, we consider the sample of early-type galaxies (ETGs) from the ATLAS3D Hi survey by Serra et al. (2012). Similar to the RR galaxies studied here, the ETGs in ATLAS3D also presented much larger Hi discs than their optical sizes and the Hi-richest ETGs were also found in low density environments (Serra et al., 2012). For quantitative comparison, we have attempted to match the ATLAS3D sample with our SDSS galaxy catalogs. Due to the relatively low redshifts of the ATLAS3D sample, none of the galaxies are included in GSWLC and only a fraction have counterparts in the NSA and the MPA/JHU catalog. Therefore, for the ATLAS3D galaxies, we opt for stellar masses derived by Cappellari et al. (2013) based on dynamical modeling, i.e. in that paper. By comparing with the NSA for those galaxies that have counterparts in NSA, we find is systematically larger by dex than with no obvious dependence on . To take into account this difference, we use as the stellar mass for the ATLAS3D. The SFRs are estimated by Kokusho et al. (2017) from PAH luminosities which were obtained from SED fitting to data from AKARI, WISE and 2MASS. We have compared the SFRs for those with counterparts in the MPA/JHU catalog and found no systematic differences. In Figure 8 we compare the ATLAS3D sample with the RR sample in terms of the distributions of , /, and sSFR. We find that, when compared to the RR sample, the ETGs from ATLAS3D mostly have similarly red colors and low sSFRs as expected, and significantly lower Hi mass fractions. Only one galaxy from the ATLAS3D meets our selection criteria of the RR sample, while most of them fall on or even below the contours of the general red population, indicating that the majority of red early-type galaxies are Hi normal or Hi poor, as generally expected. The difference between the RR sample and the general ETG population can also be seen from the bottom-right panel in Figure 3, where the RR, RN and CSC samples show very similar distributions in T-type, all dominated by early-types, but the RR sample is very different in Hi mass fraction to the other two samples. The E+A galaxies previously studied are also different from our RR galaxies. In fact, Figure 3 of Zwaan et al. (2013) has shown that their E+A galaxies as well as the several from earlier studies are mostly “green” with and Hi-normal for their color, with (/).
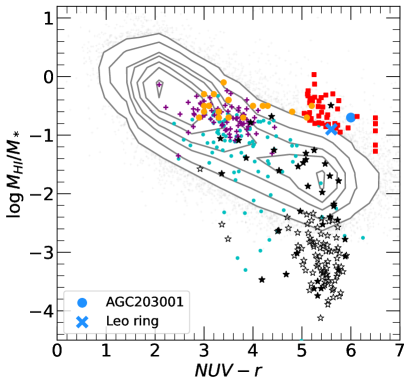
The samples of Hi-rich galaxies with suppressed or low star formation (Lemonias et al., 2014; Parkash et al., 2019; Sharma et al., 2023) and massive red spirals (Guo et al., 2020; Wang et al., 2022a) are more similar to our RR sample. The selection criteria of these previous samples are mentioned in section 1. The comparison of these samples with the RR sample is shown in Figure 8. As can be seen from the top-left panel, all the samples in comparison are limited to relatively high stellar mass and high Hi mass fraction with respect to the complete SDSS sample, although the FAST sample from Wang et al. (2022a) includes some galaxies with low Hi mass fractions. Our RR sample is distinct from other samples by having the reddest colors (top-right panel) and the lowest sSFRs (bottom-left panel), both indicating the fully quenched status of star formation in these galaxies. In contrast, both the Hi-rich galaxies with suppressed star formation from Lemonias et al. (2014) and the massive red spirals from Guo et al. (2020) and Wang et al. (2022a) are mostly “green” with intermediate colors, , and consistently they fall mainly in the transition region between the star-forming and quiescent sequences (bottom-left panel), indicating that these galaxies are not fully quenched. As pointed out in Zhou et al. (2021), red spirals selected by optical colors such as are mostly green/blue in , as the UV emission is more sensitive than optical colors to the ongoing weak star formation in galaxies. The fact that the sample of Parkash et al. (2019) is also limited to the transition region suggests that the criterion of mid-infrared color () is unable to select fully quenched galaxies as well. Sharma et al. (2023) did not tabulate their galaxies, but it is natural to expect their sample to occupy similar regions in the sSFR versus diagram considering the same color selection as adopted in Parkash et al. (2019). We note that massive red spirals show quite different distributions in the sSFR versus diagram depending on the adopted SFR estimates. When the MPA/JHU catalog is used instead of GSWLC, these galaxies move from the transition region to the quiescent sequence, showing similarly low sSFRs to our RR galaxies. We argue that this discrepancy largely attributes to the larger uncertainties and biases in the SFRs from the MPA/JHU catalog than from the GSWLC at intermediate-to-low SFRs (see Li et al. 2023 for a recent comprehensive investigation and discussion).
We conclude that the RR sample selected in the / versus diagram represents a unique population of galaxies, which are fully quenched but contain unusually large amounts of Hi gas. Previous samples selected by (Guo et al., 2020; Wang et al., 2022a), or (Parkash et al., 2019; Sharma et al., 2023), or by a fixed cut in sSFR (Lemonias et al., 2014) represent galaxies in the “green valley”, i.e. in the transition phase to being fully quenched. Their Hi contents can be partly (if not fully) explained by the blue/green colors and the intermediate sSFRs.
Considering that the cessation of star formation in massive galaxies happens from inside out (e.g. Li et al., 2015; Wang et al., 2018), it could be that the Hi-rich galaxies in previous samples and the RR galaxies in our sample have the same origin and follow a common evolutionary path, but they are at different stages. In this case, the RR sample and the previous samples should share some common properties. In fact, like our RR galaxies, the Hi-rich galaxies in Lutz et al. (2018, 2020) were also found to have similar optical properties (e.g. the size-mass relation and radial distributions of gas metallicity) to that of Hi-normal galaxies. In addition, the large Hi-to-optical size ratios found for our RR galaxies was also found in Lemonias et al. (2014) with the help of resolved Hi observations: most of the massive Hi-rich galaxies with suppressed star formation in their sample had Hi radii at least twice as large as their optical radii (see their Figure 7). The authors found all of their galaxies had substantially low Hi surface densities, likely to be the main cause of their low sSFRs. Given the even larger Hi-to-optical radius ratios of our RR galaxies, they are expected to have even lower Hi surface densities.
On the other hand, however, our RR galaxies also show quite different properties in many other aspects from galaxies used in previous investigations. For instance, Lemonias et al. (2014) found some evidence that AGN or bulges also contributed to the star formation suppression in their galaxies, giving support to AGN feedback and morphology quenching (Martig et al., 2009). Sharma et al. (2023) also found some evidence for AGN feedback and bar quenching for the Hi-rich but low-SFR galaxies based on the IFS data from MaNGA. In addition, Parkash et al. (2019) found a high fraction (75%) of their galaxies to be LINERs or LIERs, and they speculated that the presence of Hi is a precondition for LI(N)ER emission in galaxies. Sharma et al. (2023) found a similarly high fraction () of LIERs. However, they found their control sample of low-Hi and low-SFR galaxies also has a high fraction of LIERs (), and concluded that Hi content is not required for the high LIER fraction to correlate with the low SFR. We find no evidence for either morphology quenching, given the similar distributions in and for the RR, RN and CSC samples as seen in Figure 3, or bar quenching given the similar distributions in as seen in Figure 4. Selected from SDSS, most of our RR galaxies do not have integral field spectroscopy, but we have examined their single-fiber SDSS spectra. We find that the emission lines relevant for AGN identification are weak in most galaxies, indicative of no AGN or LIER in their central regions. This result is consistent with the global quiescence of the RR galaxies.
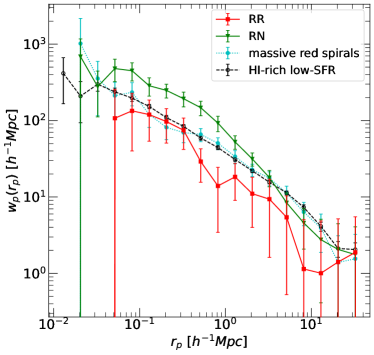
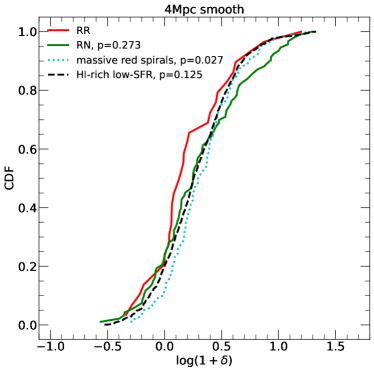
In Figure 9 we compare the projected 2PCF and local densities between our RR sample and the previous samples. The samples from Lemonias et al. (2014) and Parkash et al. (2019) are too small to obtain reliable measurements, while Sharma et al. (2023) does not tabulate their galaxies. In order to compare, we select a sample of “Hi-rich low-SFR” galaxies from the SDSS to mimic their samples, by applying the following two criteria: && . We further require this sample to have the same stellar mass distribution as our RR sample. The sample includes 2,200 galaxies. The measurements for this sample are plotted as black symbols in the figure, and those of a combined sample of massive red spirals with Hi detections from ALFALFA (Guo et al., 2020) and FAST (Wang et al., 2022a) are plotted as cyan symbols. As can be seen, the “Hi-rich low SFR” sample and the massive red spirals are very similar in both and , but when compared to them, the RR galaxies are less clustered at all scales except and have lower densities on average. We have also examined the central and satellite fractions of the two samples based on the SDSS group catalog, and found a central fraction of 73% for the massive red spiral galaxies and 70% for the “Hi-rich low SFR” sample. These results imply that low-density environments and high central fractions are necessary conditions to make the RR galaxies a unique population, which is unlikely to entirely follow the same evolutionary pathway as the Hi-rich low-SFR samples previously studied.
4.2 Existence and rareness of the RR galaxies
In a recent review, based on the xGASS sample Saintonge & Catinella (2022) concluded that there is no evidence for a significant population of passive galaxies with Hi reservoirs comparable to those of star-forming main-sequence galaxies. Our result is not in contradiction with theirs. As can been seen from Figure 1, xGASS indeed contributes only a few galaxies to our RR sample. In fact, our RR sample is contributed mainly by ALFALFA, which is much larger in sample size though less complete in Hi mass fraction when compared to xGASS. This strongly suggests that the quenched but Hi-rich galaxies are rather rare, and they can be identified as a significant population for statistical studies as done in this work only if the parent sample is large enough. The rareness of the RR galaxies can be more clearly seen when compared to the SDSS volume-limited sample. As we have seen from Figure 2, the majority of our RR galaxies are found beyond the 95% contour of the SDSS sample. In addition, as can be seen in Figure 8, all the previously studied samples including the Hi-rich but low SFR sample Lemonias et al. (2014), the massive red spirals (Guo et al., 2020; Wang et al., 2022a), and the ATLAS3D sample (Serra et al., 2012) contain a few galaxies satisfying our criteria of RR galaxies. This result is also consistent with both the existence and the rareness of the RR galaxies.

Using data from both xGASS and ALFALFA, however, Zhang et al. (2019) claimed that nearly all the massive quiescent central disc galaxies are Hi-rich, with similar to that of star-forming galaxies. This result was questioned by Cortese et al. (2020) who found no passive disc galaxies in xGASS with Hi reservoirs comparable to those typical of star-forming galaxies. The authors suggested that the previous claim by Zhang et al. (2019) was due to the use of aperture-corrected SFR estimates from the MPA/JHU catalog, in which the global star formation of Hi-rich galaxies with extended star-forming discs is significantly underestimated. Here we revisit this problem taking advantage of the SDSS volume-limited sample for which we have estimated an Hi mass for each galaxy. Adopting the same sample selection as in Zhang et al. (2019), we select a sample of 1609 massive () central disk galaxies using the SDSS group catalog (Yang et al., 2007) and the SDSS morphology catalog from Domínguez Sánchez et al. (2018). We define central galaxies as the most massive galaxy of their group and select disk galaxies by requiring T-type and , where is the probability for a galaxy to be a disk provided by the morphology catalog. The average and scatter of / and of this sample as functions of and SFR are plotted as the orange lines and shaded regions in Figure 2. We see the massive central disc galaxies to roughly follow the SC and RN samples at the high- and low-SFR ends in terms of /, thus with much lower Hi mass fractions than the RR galaxies of similar SFRs. Because of their higher stellar masses, these galaxies have higher than the RN and SC samples at a given or SFR, but still have lower than the RR galaxies. This result suggests both that the massive quiescent central disk galaxies investigated in Zhang et al. (2019) are Hi-poor as expected from their red colors and low SFRs, and that these galaxies are different from the RR galaxies in our sample which are truly quenched, have unusually high Hi mass fractions, but are rare.
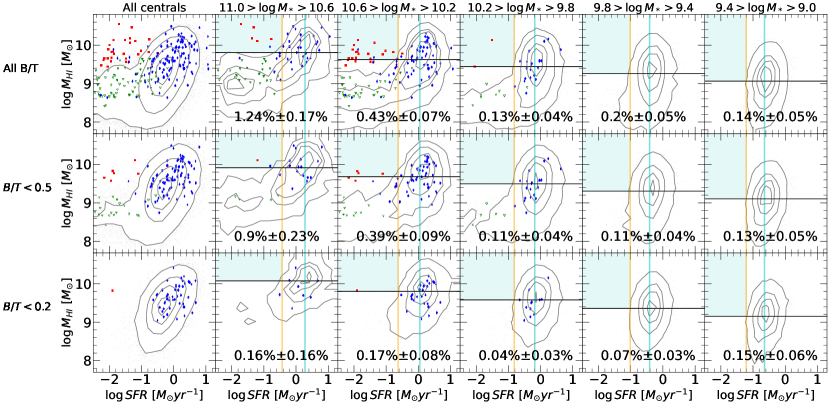
Our result is consistent with Cortese et al. (2020) where both Hi detections and non-detections from xGASS were used to quantify the Hi reservoirs of central galaxies as a function of stellar mass, SFR and . Following the format of their Figs. 1 and 2 but using our volume-limited SDSS sample instead of xGASS, we examine the –SFR relationship for central galaxies in different intervals of and below different upper limits, plotted as black contours in Figure 10 (with SFRs from GSWLC) and Figure 11 (with SFRs from the MPA/JHU catalog). In each panel, we indicate the best-fitting star-forming main sequence (SFMS) and the 2 lower limit of the SFMS, as well as the median Hi mass of the SFMS galaxies (those falling within around the SFMS). The low-SFR but Hi-rich galaxies are then defined to be those with SFR below the 2 lower limit of the SFMS and above the median , as indicated by the cyan area. We calculate the fraction of the SDSS galaxies falling in this area and indicate the result in each panel. As can be seen, the fractions are small in both figures and in all panels. In the case with the GSWLC SFRs, the fraction is at most as found for all the centrals in the most massive bin, and decreases as one goes to galaxies with lower and smaller . Although the fractions become larger when the MPA/JHU SFRs are used, this type of galaxy is still a minor population with a fraction of at most. For comparison, the RR, RN and SC galaxies are plotted in both figures. Most of the RR galaxies fall in the cyan areas as expected.
We conclude that, although the quenched but Hi-rich galaxies like those in our RR sample do exist in the nearby Universe, they contribute only a tiny fraction to the general population of their colors and SFRs. In other words, the majority of massive quiescent galaxies are Hi-poor, as found in many previous studies (see Saintonge & Catinella 2022, Cortese et al. 2020, and references therein).
4.3 Origin of the RR galaxies
The formation scenarios of the RR galaxies are not immediately clear based on our results. The high fraction of central galaxies in the RR sample as well as the relatively low density of the local environment are both helpful for the galaxies to sustain their cold gas against environmental effects such as ram-pressure and tidal stripping, which are stronger for satellite galaxies and in denser regions. However, the origin of the large amounts of Hi gas in these galaxies is still unclear. As mentioned, the large Hi-to-optical size ratios of the RR galaxies imply very extended Hi discs with low surface densities of Hi in the outskirt. It is thus natural to expect no or weak star formation even with a substantially large amount of total Hi mass. This is consistent with the finding of Lemonias et al. (2014) where the resolved Hi observations revealed low Hi densities in a sample of 20 Hi-rich galaxies with suppressed SFRs. Resolved Hi observations from The ATLAS3D Hi survey also show that about of the nearby ETGs outside the Virgo Cluster are surrounded by large Hi discs or rings of low column density (Serra et al., 2012, 2014), with signs of recent star formation similar to that in the outskirt of spiral galaxies (Yıldız et al., 2015, 2017). We have visually examined the optical image of our RR galaxies from the DESI Legacy Survey (see Figure 12 in the Appendix A), finding about half of our galaxies to present faint and extended ring or spiral structures in the outskirt. This fraction could be even larger if deeper images are available. In addition, some of these galaxies show misalignment between the main stellar body and the extended structure, which was also observed for half of the ATLAS3D ETGs that have large Hi discs/rings (Serra et al., 2012, 2014). This result is consistent with the finding of the ATLAS3D survey, both supporting the external origin of the massive Hi gas content, such as gas accretion and/or mergers.
The extended Hi disks may be supported by high angular momentum, which is inherited from the high spin of host dark matter halos as suggested by Lutz et al. (2018) for their Hi-extreme galaxies. Mancera Piña et al. (2021a) and Mancera Piña et al. (2021b) have recently measured the specific angular momentum for both stars and atomic gas in a sample of nearby disc galaxies, finding a strong correlation between the gas fraction and the specific angular momentum, with higher angular momenta and lower star formation efficiencies for galaxies of higher gas fractions. In particular, it was found that the Hi-extreme galaxies from Lutz et al. (2018) tightly followed the same scaling correlations of angular momentum as galaxies of normal Hi content. Although our RR galaxies differ from those previous samples in certain aspects as discussed above, they could also have high angular momentum, because of which the Hi gas cannot be efficiently converted into stars. In fact, the angular momentum of circum-galactic medium (CGM) has been found to either enhance or suppress star formation in simulated disc galaxies (Wang et al., 2022b; Lu et al., 2022). The ideal of “angular momentum quenching” has also been advocated in empirical models of galaxy evolution (e.g. Obreschkow et al., 2016; Peng & Renzini, 2020), although the model predictions are found to not fully match the current Hi surveys such as xGASS (Hardwick et al., 2022). The RR galaxies studied in our work represent a unique population useful to test such models, but for this purpose one would need larger samples with both resolved Hi observations and angular momentum measurements.
We should point out that, when estimating the Hi sizes for our galaxies we have assumed the Hi gas is distributed in a regular disk as in most Hi-bearing galaxies. In fact, the only galaxy in our sample with resolved Hi observations, UGC 1382 (id=0 in Table 1) indeed shows a regularly rotating Hi disk. However, irregular and even off-galaxy Hi distributions have been observed for a handful of Hi-bearing ETGs, e.g. the giant Hi ring around NGC 3384 and M 96 in the Leo group (Schneider et al., 1983; Schneider, 1985, 1989; Michel-Dansac et al., 2010) and the large Hi ring around the quiescent galaxy AGC 203001 (Bait et al., 2020). As can be seen from Figure 8, both the Leo ring and AGC 203001 meet the selection criteria of our RR sample. Therefore, it is possible that some fraction of our RR galaxies also show similarly irregular Hi distributions. Although its physical origin is still under debate, such Hi-dominated rings are likely expelled gas from Hi-rich ETGs caused by a collision with an intruder galaxy (Michel-Dansac et al., 2010; Bait et al., 2020, e.g.) or tidal tripping by the group potential (e.g. Bekki et al., 2005; Serra et al., 2013; Corbelli et al., 2021), or falling back of the tidal tail of gas-rich major mergers (e.g. Morganti et al., 2003; Sameer et al., 2022). Considering the extreme paucity of such observational cases in the literature as well as the fact that the majority of our RR galaxies have no close companions, we would expect such an irregular or off-galaxy Hi distribution to be not a common feature in the RR galaxies. Resolved Hi observations for the RR galaxies would be necessary in order to test out this conjecture.
5 Summary
In this work we have identified and investigated a rare population of red but Hi-rich (RR) galaxies in the local Universe. We make use of three Hi surveys including ALFALFA, xGASS and Hi-MaNGA, from which we select a sample of 47 RR galaxies on the diagram of / versus . Our RR galaxies are required to have , and be outliers in the distribution of /, located outside the 95% contour of a volume-limited sample of SDSS for which we have estimated an Hi mass for each galaxy based on Bayesian inferences of its optical properties. The RR galaxies are relatively massive, with stellar mass . For comparison we have selected a control sample of “red and Hi-normal” (RN) galaxies that are closely matched with the RR sample in and , as well as a “stellar mass control” (SC) sample that is matched only in . We have demonstrated that the RN sample is representative to the massive red galaxy population (Figure 3 and Figure 6).
We have examined a variety of optical properties, finding the RR and RN samples to be very similar in all the properties, which are typical of massive red (quenched) galaxies in the SDSS volume-limited sample. We have also examined the environment of our samples, as quantified by three different statistics: overdensity of the local environment as estimated at 2 Mpc and 4 Mpc, projected two-point cross-correlation function with respect to a reference sample of half a million galaxies from the SDSS spectroscopic survey, and background-subtracted neighbor counts estimated with the SDSS photometric sample down to -band magnitude of mag. We find the RR sample to be associated with lower density environments at a scale of 4 Mpc, and have lower clustering amplitudes and smaller neighbor counts at intermediate scales from a few kpc to a few Mpc, when compared to the RN sample. These results imply that the RR galaxies are preferentially located at the center of relatively low-mass dark matter halos. This is confirmed by the SDSS galaxy group catalog which reveals that about 89% of our RR galaxies are indeed the central galaxy of their groups, compared to a central fraction of 60% for the RN sample. The median halo mass of the RR sample is found to be , compared to for the RN sample. Furthermore, we have estimated the Hi disk size for each of our galaxies based on the tight Hi size-mass relation from the literature. We find an average Hi-to-optical size ratio of for the RR sample, which is four times the average ratio found for the RN sample.
We have compared our RR sample with similar samples investigated in previous studies. We find the previous samples are dominated by star-forming galaxies with extremely-high Hi content, or quenched Hi-poor galaxies, or transition galaxies with blue-to-green colors and intermediate SFRs, thus falling in between the star-forming main sequence and the quiescent sequence. Our RR galaxies are unique for their (NUV-to-optical) red colors indicative of fully-quenched star formation status and simultaneously high fractions of Hi mass. We use the SDSS volume-limited sample with estimated Hi masses to show that, although the RR galaxies form a unique population, they are rather rare, contributing only a tiny fraction of the quenched galaxy population. The majority of massive quenched galaxies in the low-redshift Universe are Hi-poor.
Acknowledgments
We are grateful to the anonymous referee for the helpful comments. This work is supported by the National Key R&D Program of China (grant NO. 2022YFA1602902), and the National Natural Science Foundation of China (grant Nos. 11821303, 11733002, 11973030, 11673015, 11733004, 11761131004, 11761141012). This work has made use of the following softwares: Numpy (Harris et al., 2020), Matplotlib (Hunter, 2007), Astropy (Astropy Collaboration et al., 2013, 2018, 2022), Scipy (Virtanen et al., 2020), corner (Foreman-Mackey, 2016), and Seaborn (Waskom, 2021).
Funding for the SDSS and SDSS-II has been provided by the Alfred P. Sloan Foundation, the Participating Institutions, the National Science Foundation, the U.S. Department of Energy, the National Aeronautics and Space Administration, the Japanese Monbukagakusho, the Max Planck Society, and the Higher Education Funding Council for England. The SDSS Web Site is http://www.sdss.org/.
The SDSS is managed by the Astrophysical Research Consortium for the Participating Institutions. The Participating Institutions are the American Museum of Natural History, Astrophysical Institute Potsdam, University of Basel, University of Cambridge, Case Western Reserve University, University of Chicago, Drexel University, Fermilab, the Institute for Advanced Study, the Japan Participation Group, Johns Hopkins University, the Joint Institute for Nuclear Astrophysics, the Kavli Institute for Particle Astrophysics and Cosmology, the Korean Scientist Group, the Chinese Academy of Sciences (LAMOST), Los Alamos National Laboratory, the Max-Planck-Institute for Astronomy (MPIA), the Max-Planck-Institute for Astrophysics (MPA), New Mexico State University, Ohio State University, University of Pittsburgh, University of Portsmouth, Princeton University, the United States Naval Observatory, and the University of Washington.
References
- Adelman-McCarthy et al. (2008) Adelman-McCarthy, J. K., Agüeros, M. A., Allam, S. S., et al. 2008, The Astrophysical Journal Supplement Series, 175, 297, doi: 10.1086/524984
- Astropy Collaboration et al. (2013) Astropy Collaboration, Robitaille, T. P., Tollerud, E. J., et al. 2013, A&A, 558, A33, doi: 10.1051/0004-6361/201322068
- Astropy Collaboration et al. (2018) Astropy Collaboration, Price-Whelan, A. M., Sipőcz, B. M., et al. 2018, AJ, 156, 123, doi: 10.3847/1538-3881/aabc4f
- Astropy Collaboration et al. (2022) Astropy Collaboration, Price-Whelan, A. M., Lim, P. L., et al. 2022, ApJ, 935, 167, doi: 10.3847/1538-4357/ac7c74
- Bait et al. (2020) Bait, O., Kurapati, S., Duc, P.-A., et al. 2020, MNRAS, 492, 1, doi: 10.1093/mnras/stz2972
- Balogh et al. (1999) Balogh, M. L., Morris, S. L., Yee, H. K. C., Carlberg, R. G., & Ellingson, E. 1999, ApJ, 527, 54, doi: 10.1086/308056
- Bekki et al. (2005) Bekki, K., Koribalski, B. S., Ryder, S. D., & Couch, W. J. 2005, MNRAS, 357, L21, doi: 10.1111/j.1745-3933.2005.08625.x
- Blanton et al. (2011) Blanton, M. R., Kazin, E., Muna, D., Weaver, B. A., & Price-Whelan, A. 2011, AJ, 142, 31, doi: 10.1088/0004-6256/142/1/31
- Blanton & Roweis (2007) Blanton, M. R., & Roweis, S. 2007, AJ, 133, 734, doi: 10.1086/510127
- Blanton et al. (2005) Blanton, M. R., Schlegel, D. J., Strauss, M. A., et al. 2005, The Astronomical Journal, 129, 2562, doi: 10.1086/429803
- Bregman et al. (1992) Bregman, J. N., Hogg, D. E., & Roberts, M. S. 1992, ApJ, 387, 484, doi: 10.1086/171101
- Brinchmann et al. (2004) Brinchmann, J., Charlot, S., White, S. D. M., et al. 2004, MNRAS, 351, 1151, doi: 10.1111/j.1365-2966.2004.07881.x
- Brown et al. (2015) Brown, T., Catinella, B., Cortese, L., et al. 2015, MNRAS, 452, 2479, doi: 10.1093/mnras/stv1311
- Bruzual & Charlot (2003) Bruzual, G., & Charlot, S. 2003, MNRAS, 344, 1000, doi: 10.1046/j.1365-8711.2003.06897.x
- Bundy et al. (2014) Bundy, K., Bershady, M. A., Law, D. R., et al. 2014, The Astrophysical Journal, 798, 7, doi: 10.1088/0004-637X/798/1/7
- Buyle et al. (2008) Buyle, P., De Rijcke, S., & Dejonghe, H. 2008, ApJ, 684, L17, doi: 10.1086/591316
- Buyle et al. (2006) Buyle, P., Michielsen, D., De Rijcke, S., et al. 2006, ApJ, 649, 163, doi: 10.1086/505633
- Cappellari et al. (2011) Cappellari, M., Emsellem, E., Krajnović, D., et al. 2011, MNRAS, 413, 813, doi: 10.1111/j.1365-2966.2010.18174.x
- Cappellari et al. (2013) Cappellari, M., Scott, N., Alatalo, K., et al. 2013, MNRAS, 432, 1709, doi: 10.1093/mnras/stt562
- Catinella et al. (2010) Catinella, B., Schiminovich, D., Kauffmann, G., et al. 2010, MNRAS, 403, 683, doi: 10.1111/j.1365-2966.2009.16180.x
- Catinella et al. (2018) Catinella, B., Saintonge, A., Janowiecki, S., et al. 2018, Monthly Notices of the Royal Astronomical Society, 476, 875, doi: 10.1093/mnras/sty089
- Chabrier (2003) Chabrier, G. 2003, PASP, 115, 763, doi: 10.1086/376392
- Chang et al. (2001) Chang, T.-C., van Gorkom, J. H., Zabludoff, A. I., Zaritsky, D., & Mihos, J. C. 2001, AJ, 121, 1965, doi: 10.1086/319959
- Colless et al. (2001) Colless, M., Dalton, G., Maddox, S., et al. 2001, MNRAS, 328, 1039, doi: 10.1046/j.1365-8711.2001.04902.x
- Corbelli et al. (2021) Corbelli, E., Cresci, G., Mannucci, F., Thilker, D., & Venturi, G. 2021, ApJ, 908, L39, doi: 10.3847/2041-8213/abdf64
- Cortese et al. (2020) Cortese, L., Catinella, B., Cook, R. H. W., & Janowiecki, S. 2020, MNRAS, 494, L42, doi: 10.1093/mnrasl/slaa032
- di Serego Alighieri et al. (2007) di Serego Alighieri, S., Gavazzi, G., Giovanardi, C., et al. 2007, A&A, 474, 851, doi: 10.1051/0004-6361:20078205
- Domínguez Sánchez et al. (2018) Domínguez Sánchez, H., Huertas-Company, M., Bernardi, M., Tuccillo, D., & Fischer, J. L. 2018, MNRAS, 476, 3661, doi: 10.1093/mnras/sty338
- Foreman-Mackey (2016) Foreman-Mackey, D. 2016, The Journal of Open Source Software, 1, 24, doi: 10.21105/joss.00024
- Geréb et al. (2016) Geréb, K., Catinella, B., Cortese, L., et al. 2016, MNRAS, 462, 382, doi: 10.1093/mnras/stw1675
- Geréb et al. (2018) Geréb, K., Janowiecki, S., Catinella, B., Cortese, L., & Kilborn, V. 2018, MNRAS, 476, 896, doi: 10.1093/mnras/sty214
- Giovanelli et al. (2005) Giovanelli, R., Haynes, M. P., Kent, B. R., et al. 2005, The Astronomical Journal, 130, 2598, doi: 10.1086/497431
- Grossi et al. (2009) Grossi, M., di Serego Alighieri, S., Giovanardi, C., et al. 2009, A&A, 498, 407, doi: 10.1051/0004-6361/200810823
- Guo et al. (2020) Guo, R., Hao, C.-N., Xia, X., et al. 2020, ApJ, 897, 162, doi: 10.3847/1538-4357/ab9b75
- Hagen et al. (2016) Hagen, L. M. Z., Seibert, M., Hagen, A., et al. 2016, ApJ, 826, 210, doi: 10.3847/0004-637X/826/2/210
- Hardwick et al. (2022) Hardwick, J. A., Cortese, L., Obreschkow, D., & Catinella, B. 2022, MNRAS, 516, 4043, doi: 10.1093/mnras/stac2476
- Harris et al. (2020) Harris, C. R., Millman, K. J., van der Walt, S. J., et al. 2020, Nature, 585, 357, doi: 10.1038/s41586-020-2649-2
- Haynes & Giovanelli (1984) Haynes, M. P., & Giovanelli, R. 1984, AJ, 89, 758, doi: 10.1086/113573
- Haynes et al. (2018) Haynes, M. P., Giovanelli, R., Kent, B. R., et al. 2018, ApJ, 861, 49, doi: 10.3847/1538-4357/aac956
- Huang et al. (2012) Huang, S., Haynes, M. P., Giovanelli, R., & Brinchmann, J. 2012, ApJ, 756, 113, doi: 10.1088/0004-637X/756/2/113
- Huang et al. (2014) Huang, S., Haynes, M. P., Giovanelli, R., et al. 2014, ApJ, 793, 40, doi: 10.1088/0004-637X/793/1/40
- Hunter (2007) Hunter, J. D. 2007, Computing in Science and Engineering, 9, 90, doi: 10.1109/MCSE.2007.55
- Jiang et al. (2020) Jiang, P., Tang, N.-Y., Hou, L.-G., et al. 2020, Research in Astronomy and Astrophysics, 20, 064, doi: 10.1088/1674-4527/20/5/64
- Kannappan (2004) Kannappan, S. J. 2004, ApJ, 611, L89, doi: 10.1086/423785
- Kennicutt (1998) Kennicutt, Robert C., J. 1998, ApJ, 498, 541, doi: 10.1086/305588
- Knapp et al. (1985) Knapp, G. R., Turner, E. L., & Cunniffe, P. E. 1985, AJ, 90, 454, doi: 10.1086/113751
- Kokusho et al. (2017) Kokusho, T., Kaneda, H., Bureau, M., et al. 2017, A&A, 605, A74, doi: 10.1051/0004-6361/201630158
- Lee et al. (2014) Lee, C., Chung, A., Yun, M. S., et al. 2014, MNRAS, 441, 1363, doi: 10.1093/mnras/stu670
- Lemonias et al. (2014) Lemonias, J. J., Schiminovich, D., Catinella, B., Heckman, T. M., & Moran, S. M. 2014, ApJ, 790, 27, doi: 10.1088/0004-637X/790/1/27
- Li et al. (2012) Li, C., Kauffmann, G., Fu, J., et al. 2012, MNRAS, 424, 1471, doi: 10.1111/j.1365-2966.2012.21337.x
- Li et al. (2008a) Li, C., Kauffmann, G., Heckman, T. M., Jing, Y. P., & White, S. D. M. 2008a, MNRAS, 385, 1903, doi: 10.1111/j.1365-2966.2008.13000.x
- Li et al. (2008b) Li, C., Kauffmann, G., Heckman, T. M., White, S. D. M., & Jing, Y. P. 2008b, MNRAS, 385, 1915, doi: 10.1111/j.1365-2966.2008.13023.x
- Li et al. (2006a) Li, C., Kauffmann, G., Jing, Y. P., et al. 2006a, MNRAS, 368, 21, doi: 10.1111/j.1365-2966.2006.10066.x
- Li et al. (2006b) Li, C., Kauffmann, G., Wang, L., et al. 2006b, MNRAS, 373, 457, doi: 10.1111/j.1365-2966.2006.11079.x
- Li et al. (2015) Li, C., Wang, E., Lin, L., et al. 2015, ApJ, 804, 125, doi: 10.1088/0004-637X/804/2/125
- Li et al. (2022) Li, X., Li, C., Mo, H. J., Xiao, T., & Wang, J. 2022, ApJ, 941, 48, doi: 10.3847/1538-4357/ac9ccb
- Li et al. (2023) Li, Y. A., Ho, L. C., Shangguan, J., Zhuang, M.-Y., & Li, R. 2023, ApJS, 267, 17, doi: 10.3847/1538-4365/acd4b5
- Liu et al. (2023) Liu, S., Luo, A. L., Zhang, W., et al. 2023, Research in Astronomy and Astrophysics, 23, 065006, doi: 10.1088/1674-4527/accb78
- Lu et al. (2022) Lu, S., Xu, D., Wang, S., et al. 2022, MNRAS, 509, 2707, doi: 10.1093/mnras/stab3169
- Lutz et al. (2020) Lutz, K. A., Kilborn, V., Catinella, B., et al. 2020, A&A, 635, A69, doi: 10.1051/0004-6361/201936556
- Lutz et al. (2017) Lutz, K. A., Kilborn, V. A., Catinella, B., et al. 2017, MNRAS, 467, 1083, doi: 10.1093/mnras/stx053
- Lutz et al. (2018) Lutz, K. A., Kilborn, V. A., Koribalski, B. S., et al. 2018, MNRAS, 476, 3744, doi: 10.1093/mnras/sty387
- Mancera Piña et al. (2021a) Mancera Piña, P. E., Posti, L., Fraternali, F., Adams, E. A. K., & Oosterloo, T. 2021a, A&A, 647, A76, doi: 10.1051/0004-6361/202039340
- Mancera Piña et al. (2021b) Mancera Piña, P. E., Posti, L., Pezzulli, G., et al. 2021b, A&A, 651, L15, doi: 10.1051/0004-6361/202141574
- Martig et al. (2009) Martig, M., Bournaud, F., Teyssier, R., & Dekel, A. 2009, ApJ, 707, 250, doi: 10.1088/0004-637X/707/1/250
- Martin et al. (2005) Martin, D. C., Fanson, J., Schiminovich, D., et al. 2005, The Astrophysical Journal, 619, L1, doi: 10.1086/426387
-
Meert et al. (2015)
Meert, A., Vikram, V., & Bernardi, M. 2015,
mnras, 446, 3943, doi: 10.1093/mnras/stu2333 - Meyer et al. (2004) Meyer, M. J., Zwaan, M. A., Webster, R. L., et al. 2004, MNRAS, 350, 1195, doi: 10.1111/j.1365-2966.2004.07710.x
- Michel-Dansac et al. (2010) Michel-Dansac, L., Duc, P.-A., Bournaud, F., et al. 2010, ApJ, 717, L143, doi: 10.1088/2041-8205/717/2/L143
- Mo et al. (2010) Mo, H., van den Bosch, F. C., & White, S. 2010, Galaxy Formation and Evolution
- Morganti et al. (2003) Morganti, R., Oosterloo, T. A., Capetti, A., et al. 2003, A&A, 399, 511, doi: 10.1051/0004-6361:20021806
- Morganti et al. (2006) Morganti, R., de Zeeuw, P. T., Oosterloo, T. A., et al. 2006, MNRAS, 371, 157, doi: 10.1111/j.1365-2966.2006.10681.x
-
Nair & Abraham (2010)
Nair, P. B., & Abraham, R. G. 2010,
apjs, 186, 427, doi: 10.1088/0067-0049/186/2/427 - Nan (2006) Nan, R. 2006, Science in China: Physics, Mechanics and Astronomy, 49, 129, doi: 10.1007/s11433-006-0129-9
- Obreschkow et al. (2016) Obreschkow, D., Glazebrook, K., Kilborn, V., & Lutz, K. 2016, ApJ, 824, L26, doi: 10.3847/2041-8205/824/2/L26
- Parkash et al. (2019) Parkash, V., Brown, M. J. I., Jarrett, T. H., Fraser-McKelvie, A., & Cluver, M. E. 2019, MNRAS, 485, 3169, doi: 10.1093/mnras/stz593
- Peebles (2022) Peebles, P. J. E. 2022, Annals of Physics, 447, 169159, doi: 10.1016/j.aop.2022.169159
- Peng & Renzini (2020) Peng, Y.-j., & Renzini, A. 2020, MNRAS, 491, L51, doi: 10.1093/mnrasl/slz163
- Pracy et al. (2014) Pracy, M. B., Owers, M. S., Zwaan, M., et al. 2014, MNRAS, 443, 388, doi: 10.1093/mnras/stu1103
- Randriamampandry et al. (2021) Randriamampandry, T. H., Wang, J., & Mogotsi, K. M. 2021, ApJ, 916, 26, doi: 10.3847/1538-4357/ac0442
- Saintonge & Catinella (2022) Saintonge, A., & Catinella, B. 2022, ARA&A, 60, 319, doi: 10.1146/annurev-astro-021022-043545
- Salim et al. (2018) Salim, S., Boquien, M., & Lee, J. C. 2018, ApJ, 859, 11, doi: 10.3847/1538-4357/aabf3c
- Sameer et al. (2022) Sameer, Charlton, J. C., Kacprzak, G. G., et al. 2022, MNRAS, 510, 5796, doi: 10.1093/mnras/stac052
- Schneider (1985) Schneider, S. 1985, ApJ, 288, L33, doi: 10.1086/184416
- Schneider (1989) Schneider, S. E. 1989, ApJ, 343, 94, doi: 10.1086/167687
- Schneider et al. (1983) Schneider, S. E., Helou, G., Salpeter, E. E., & Terzian, Y. 1983, ApJ, 273, L1, doi: 10.1086/184118
- Serra et al. (2012) Serra, P., Oosterloo, T., Morganti, R., et al. 2012, MNRAS, 422, 1835, doi: 10.1111/j.1365-2966.2012.20219.x
- Serra et al. (2013) Serra, P., Koribalski, B., Duc, P.-A., et al. 2013, MNRAS, 428, 370, doi: 10.1093/mnras/sts033
- Serra et al. (2014) Serra, P., Oser, L., Krajnović, D., et al. 2014, MNRAS, 444, 3388, doi: 10.1093/mnras/stt2496
- Sharma et al. (2023) Sharma, A., Masters, K. L., Stark, D. V., et al. 2023, MNRAS, doi: 10.1093/mnras/stad2695
- Stark et al. (2021) Stark, D. V., Masters, K. L., Avila-Reese, V., et al. 2021, MNRAS, 503, 1345, doi: 10.1093/mnras/stab566
- Virtanen et al. (2020) Virtanen, P., Gommers, R., Oliphant, T. E., et al. 2020, Nature Methods, 17, 261, doi: 10.1038/s41592-019-0686-2
- Wang et al. (2015) Wang, E., Wang, J., Kauffmann, G., Józsa, G. I. G., & Li, C. 2015, MNRAS, 449, 2010, doi: 10.1093/mnras/stv390
- Wang et al. (2018) Wang, E., Li, C., Xiao, T., et al. 2018, ApJ, 856, 137, doi: 10.3847/1538-4357/aab263
- Wang et al. (2016a) Wang, H., Mo, H. J., Yang, X., et al. 2016a, ApJ, 831, 164, doi: 10.3847/0004-637X/831/2/164
- Wang et al. (2016b) Wang, J., Koribalski, B. S., Serra, P., et al. 2016b, MNRAS, 460, 2143, doi: 10.1093/mnras/stw1099
- Wang et al. (2013) Wang, J., Kauffmann, G., Józsa, G. I. G., et al. 2013, MNRAS, 433, 270, doi: 10.1093/mnras/stt722
- Wang & Li (2019) Wang, L., & Li, C. 2019, MNRAS, 483, 1452, doi: 10.1093/mnras/sty3204
- Wang et al. (2022a) Wang, L., Zheng, Z., Hao, C.-N., et al. 2022a, MNRAS, 516, 2337, doi: 10.1093/mnras/stac2292
- Wang et al. (2022b) Wang, S., Xu, D., Lu, S., et al. 2022b, MNRAS, 509, 3148, doi: 10.1093/mnras/stab3167
- Wardle & Knapp (1986) Wardle, M., & Knapp, G. R. 1986, AJ, 91, 23, doi: 10.1086/113976
- Waskom (2021) Waskom, M. L. 2021, Journal of Open Source Software, 6, 3021, doi: 10.21105/joss.03021
- White & Rees (1978) White, S. D. M., & Rees, M. J. 1978, MNRAS, 183, 341, doi: 10.1093/mnras/183.3.341
-
Willett et al. (2013)
Willett, K. W., Lintott, C. J., Bamford, S. P., et al. 2013,
mnras, 435, 2835, doi: 10.1093/mnras/stt1458 - Yang et al. (2007) Yang, X., Mo, H. J., van den Bosch, F. C., et al. 2007, ApJ, 671, 153, doi: 10.1086/522027
- Yıldız et al. (2015) Yıldız, M. K., Serra, P., Oosterloo, T. A., et al. 2015, MNRAS, 451, 103, doi: 10.1093/mnras/stv992
- Yıldız et al. (2017) Yıldız, M. K., Serra, P., Peletier, R. F., Oosterloo, T. A., & Duc, P.-A. 2017, MNRAS, 464, 329, doi: 10.1093/mnras/stw2294
- York et al. (2000) York, D. G., Adelman, J., Anderson, John E., J., et al. 2000, AJ, 120, 1579, doi: 10.1086/301513
- Young et al. (2014) Young, L. M., Scott, N., Serra, P., et al. 2014, MNRAS, 444, 3408, doi: 10.1093/mnras/stt2474
- Zasov & Zaitseva (2022) Zasov, A. V., & Zaitseva, N. A. 2022, Astronomy Reports, 66, 755, doi: 10.1134/S1063772922090128
- Zhang et al. (2019) Zhang, C., Peng, Y., Ho, L. C., et al. 2019, ApJ, 884, L52, doi: 10.3847/2041-8213/ab4ae4
- Zhang et al. (2009) Zhang, W., Li, C., Kauffmann, G., et al. 2009, MNRAS, 397, 1243, doi: 10.1111/j.1365-2966.2009.15050.x
- Zhou et al. (2021) Zhou, S., Li, C., Hao, C.-N., et al. 2021, ApJ, 916, 38, doi: 10.3847/1538-4357/ac06cc
- Zwaan et al. (2013) Zwaan, M. A., Kuntschner, H., Pracy, M. B., & Couch, W. J. 2013, MNRAS, 432, 492, doi: 10.1093/mnras/stt496
Appendix A The optical images of the RR sample
Figure 12 displays the optical images of the RR sample. The image of galaxy 39 is taken from the SDSS DR16 Skyserver 444https://skyserver.sdss.org/dr16/en/home.aspx, and the images of the other galaxies are taken from the DESI Legacy Survey 555https://www.legacysurvey.org. The images are ordered by decreasing Hi-to-stellar mass ratio from top left to bottom right. The ID and Hi-to-stellar mass ratio of each galaxy are indicated on top of the corresponding image.