11email: arjan.bik@astro.su.se 22institutetext: Centro de Astrobiología (CAB), CSIC-INTA, Ctra. de Ajalvir km 4, Torrejón de Ardoz, E-28850, Madrid, Spain 33institutetext: I.Physikalisches Institut der Universität zu Köln, Zülpicher Str. 77, 50937 Köln, Germany 44institutetext: Max-Planck-Institut für Astronomie, Königstuhl 17, 69117 Heidelberg, Germany 55institutetext: DTU Space, Technical University of Denmark, Elektrovej 327, 2800 Kgs. Lyngby, Denmark 66institutetext: Cosmic Dawn Centre (DAWN), Copenhagen, Denmark 77institutetext: Department of Physics and Astronomy, University College London, Gower Place, London WC1E 6BT, UK 88institutetext: UK Astronomy Technology Centre, Royal Observatory Edinburgh, Blackford Hill, Edinburgh EH9 3HJ, UK 99institutetext: Centro de Astrobiología (CAB), CSIC-INTA, Camino Viejo del Castillo s/n, 28692 Villanueva de la Cañada, Madrid, Spain 1010institutetext: Kapteyn Astronomical Institute, University of Groningen, P.O. Box 800, 9700 AV Groningen, The Netherlands 1111institutetext: DARK, Niels Bohr Institute, University of Copenhagen, Jagtvej 128, 2200 Copenhagen, Denmark 1212institutetext: Telespazio UK for the European Space Agency, ESAC, Camino Bajo del Castillo s/n, 28692 Villanueva de la Cañada, Spain 1313institutetext: School of Physics & Astronomy, Space Research Centre, Space Park Leicester, University of Leicester, 92 Corporation Road, Leicester LE4 5SP, UK 1414institutetext: Leiden Observatory, Leiden University, PO Box 9513, 2300 RA Leiden, The Netherlands 1515institutetext: University of Vienna, Department of Astrophysics, Türkenschanzstrasse 17, 1180 Vienna, Austria 1616institutetext: Institute of Particle Physics and Astrophysics, ETH Zurich, Wolfgang-Pauli-Str 27, 8093 Zurich, Switzerland 1717institutetext: Université Paris-Saclay, Université Paris Cité, CEA, CNRS, AIM, F-91191 Gif-sur-Yvette, France 1818institutetext: Dublin Institute for Advanced Studies, Astronomy & Astrophysics Section, 31 Fitzwilliam Place, Dublin, D02 XF86 Ireland
Clumpy star formation and an obscured nuclear starburst in the luminous dusty z=4 galaxy GN20 seen by MIRI/JWST
Dusty star-forming galaxies emit most of their light at far-IR to mm wavelengths as their star formation is highly obscured. Far-IR and mm observations have revealed their dust, neutral and molecular gas properties. The sensitivity of JWST at rest-frame optical and near-infrared wavelengths now allows the study of the stellar and ionized gas content. We investigate the spatially resolved distribution and kinematics of the ionized gas in GN20, a dusty star forming galaxy at =4.0548. We present deep MIRI/MRS integral field spectroscopy of the near-infrared rest-frame emission of GN20. We detect spatially resolved Pa, out to a radius of 6 kpc, distributed in a clumpy morphology. The star formation rate derived from Pa (144 9 M⊙ yr-1) is only 7.7 % of the infrared star formation rate (1860 90 M⊙ yr-1). We attribute this to very high extinction (AV = 17.2 0.4 mag, or AV,mixed = 44 3 mag), especially in the nucleus of GN20, where only faint Pa is detected, suggesting a deeply buried starburst. We identify four, spatially unresolved, clumps in the Pa emission. Based on the double peaked Pa profile we find that each clump consist of at least two sub-clumps. We find mass upper limits consistent with them being formed in a gravitationally unstable gaseous disk. The UV bright region of GN20 does not have any detected Pa emission, suggesting an age of more than 10 Myrs for this region of the galaxy. From the rotation profile of Pa we conclude that the gas kinematics are rotationally dominated and the is similar to low-redshift LIRGs. We speculate that the clumps seen in GN20 could contribute to building up the inner disk and bulge of GN20.
Key Words.:
Galaxies: high-redshift, Galaxies: ISM, Galaxies: starburst, Galaxies: kinematics and dynamics, Galaxies: individual: GN201 Introduction
Dusty Star Forming Galaxies (DSFGs) are extreme infrared luminous galaxies with short intense starburst episodes, forming stars at rates from 500 to several 1000 M⊙ yr-1(see Casey et al., 2014, for a review). They are the most luminous starbursts in the Universe and are considered the progenitors of the massive quiescent galaxies between 2 3 (Valentino et al., 2020). These galaxies emit most of their light at (far) infrared to radio wavelengths and are optically obscured due to a significant dust content which attenuates the light. They are identified as sub-millimeter galaxies (SMGs) in deep sub-millimeter surveys (e.g. Hughes et al., 1998; Borys et al., 2003; Pope et al., 2006; Vieira et al., 2013) and represent an important phase of cosmic star formation missed by the deep rest-frame optical and ultraviolet surveys (Bouwens et al., 2021, 2022; Finkelstein et al., 2023; Pérez-González et al., 2023b). More recent surveys with ALMA have concluded that the infrared bright galaxies dominate the cosmic star formation rate below 4 (Pérez-González et al., 2005; Gruppioni et al., 2013; Zavala et al., 2021), while at higher redshift their contribution goes down to 10-30% at 6 7 (Gruppioni et al., 2020; Algera et al., 2022; Barrufet et al., 2023a).
There are several scenarios presented in the literature for the triggering mechanism of the extreme starburst in DSFGs. Many DSFGs are thought to be starburst dominated major mergers. ALMA observations reveal the disturbed morphology and kinematics in several of those galaxies (e.g. Gómez-Guijarro et al., 2018; Riechers et al., 2020; Ginolfi et al., 2020; Spilker et al., 2022; Álvarez Márquez et al., 2023b). Several of these galaxies are located in over densities or are members of proto clusters, making interactions a likely cause for their extreme starburst (e.g. Daddi et al., 2009; Drake et al., 2020). Their merger origin would make the DSFGs high redshift analogues of ultra luminous infrared galaxies (ULIRGs) in the local universe.
The other scenario is driven by the observations of star-forming galaxies at high redshift showing gas rich disks (e.g. Genzel et al., 2008; Elmegreen et al., 2009b). In this scenario the star formation is fuelled by cold mode accretion (e.g. Dekel et al., 2009a, b), where the high star formation in the gas rich disk is maintained by smooth infall and accretion of gas. Due to the high gas densities, the disk becomes unstable due to gravitational instabilities (Krumholz et al., 2018), resulting in the formation of giant star forming clumps in the disk (Dekel et al., 2009b; Ceverino et al., 2010; Mandelker et al., 2014) with kpc sizes and masses of 109 M⊙ (Genzel et al., 2008; Elmegreen et al., 2009b; Ceverino et al., 2010).
Due to the fact that the DSFGs have high extinction, almost all we know about these galaxies is derived from their molecular gas and dust content (e.g. Hodge et al., 2012, 2015) tracing mostly the neutral interstellar medium. [CII] observations of DSFGs trace both the PDR and ionized gas (e.g. Spilker et al., 2022). However, their stellar distribution and ionized gas (without contamination of the PDR emission) properties remained hidden. Many of these galaxies are dark at HST wavelengths, or only reveal very faint emission. Only now with the arrival of JWST we are able to reveal the restframe optical and near-infrared wavelengths via imaging (Colina et al., 2023; Gillman et al., 2023; Barrufet et al., 2023b; Gómez-Guijarro et al., 2023; Cochrane et al., 2023; Pérez-González et al., 2023a; Zavala et al., 2023; Akins et al., 2023) and spatially resolved spectroscopy, where we have for the first time access to emission lines originating in the ionized gas, tracing the most recent star formation (Álvarez Márquez et al., 2023b; Jones et al., 2023; Parlanti et al., 2023).
In this paper we analyze the ionized gas distribution and kinematics of the DSFG GN20. GN20 was identified as a bright 850 m source in GOODS-North based on deep SCUBA imaging (Pope et al., 2006). GN20 is a DSFG at redshift 4.0548 (Carilli et al., 2011), located in a proto-cluster or galaxy overdensity (Daddi et al., 2009) and has an infrared luminosity of 1.86 1013 L⊙. The star formation rate derived from fitting the observed spectral energy distribution (SED), assuming a Chabrier initial mass function (IMF), adds up to 1860 M⊙ yr-1 (Tan et al., 2014). With a total stellar mass of 1.1 1011 M⊙ (Tan et al., 2014), GN20 is located well above the =4 star formation main sequence (Speagle et al., 2014; Caputi et al., 2017). The specific star formation rate of GN20 computes to sSFR = yr-1, just below the starburst line for = 4 – 5 derived by Caputi et al. (2017).
Deep Expanded Very Large Array (EVLA) observations of GN20 in the CO (2-1) line (Carilli et al., 2011; Hodge et al., 2012) revealed a large, rotating molecular gas disk, visible under an inclination of 30° ( = 5.4 2.4 1011 M⊙), extending as far at 14 kpc in diameter with a very clumpy spatial distribution. Hodge et al. (2012) conclude that the presence of this disk would point to another process than a major merger as a driver for the starburst. This accretion could be enhanced by the interaction with the other galaxies in the overdensity.
Recently Colina et al. (2023) presented deep MIRI F560W imaging observations, probing the rest-frame near-infrared view of GN20. This study revealed for the first time the presence of a large stellar disk off-centred from the bright nucleus. This would, however, suggest that GN20 is involved in an interaction or a merger event, as supported by the presence of a secondary nucleus in the F560W image.
In this paper we present MIRI/MRS observations of GN20, aiming at detecting and characterizing the emission from the ionized gas, tracing the most recent star formation. The MRS observations are focused on the ionized hydrogen emission lines Pa ( = 1.8756 m) and Pa ( = 1.2822 m). Even though intrinsically fainter than H, these lines suffer significantly less from extinction and should therefore be easier to detect in galaxies with significant dust content such as DSFGs. In Sect. 2 we present the observations, data reduction and post processing as well as the ancillary data. In Sect. 3 we outline our analysis methods. In Sect. 4 we present the line emission map and analyse the spectral and spatial distribution. Our discussion in the context of the evolution of DSFGs and our conclusions are presented in Section 5 and 6 respectively.
In this paper we adopt the cosmological parameters from the Planck Collaboration et al. (2016) and a redshift of GN20 of =4.0548. With these parameters, 1″ is equal to 7.08 kpc. We use vacuum emission line wavelengths.
2 Observations and data reduction
2.1 MRS observations
GN20 was observed by JWST on November 24th, 2022 using the Mid-Infrared Instrument (MIRI, Rieke et al., 2015; Wright et al., 2015, 2023) as part of the European Consortium MIRI Guaranteed Time (proposal ID 1264, PI: L. Colina). This paper presents the data obtained with the Medium Resolution Spectrograph (MRS, Wells et al., 2015; Argyriou et al., 2023). Colina et al. (2023) present the F560W imaging of GN20 obtained while MRS was performing background observations.
The MRS observations were obtained in the MEDIUM configuration. The MEDIUM configuration provides observations in four different wavelength intervals; 5.66–6.63 m, 8.67–10.13 m, 13.34–15.57m, and 20.69–24.48 m (Labiano et al., 2021; Argyriou et al., 2023). This paper describes the analysis of MRS channels 1 and 2 in the MEDIUM configuration, our observations do not have enough sensitivity to detect any emission lines in channels 3 and 4, these bands are not discussed further. The observations mainly cover the Pa emission line ( = 1.87561 m), but channels 1 and 2 also cover additional ionized gas tracers as; Pa ( = 1.282 m), and [SiVI] ( = 1.963 m) as well as two H2 lines tracing molecular gas, namely H2 (1-0) S(7) ( = 1.747 m) and H2 (1-0) S(3) ( = 1.957 m).
The data were obtained in the SLOWR1 readout mode using a 4-point extended source dither pattern, repeated twice, resulting in eight different exposures. Each exposure contained one integration. Each integration contained 40 groups, resulting in 955.6 seconds per integration, summing up to a total of 7645 sec. Additionally, a background observation on an empty sky region, comprising of a 2-point dither with the same observing setup was taken to aid in the background subtraction.
2.2 Calibration
The MRS data were calibrated using the developers’ version of the JWST calibration pipeline, version 1.11.1.dev3+g04332ea2 (Bushouse et al., 2023) with context 1097 of the Calibration Reference Data System (CRDS). We follow the same data reduction strategy as described in Álvarez Márquez et al. (2023b); Bosman et al. (2023); Álvarez Márquez et al. (2023a).
Stage one of the MRS pipeline (Morrison et al., 2023) is executed with mostly standard settings, producing the rate files. As our deep observations contain many groups and are taken in the SLOWR1 readout mode, special care has to be taken to remove the cosmic ray (CR) showers present in the data. The developers version we used contained the latest algorithms to minimise the effect of the CR showers. We turned on the find_showers keyword and, following Bosman et al. (2023) set the time_masked_after_shower and max_extended_radius to 60 seconds and 400 pixels respectively. This procedure successfully removes a number of faint CR showers, however the brightest showers remain present.
From the rate files, we remove the warm pixels by calculating the median of all source and background frames. This median frame has all the cosmic ray events removed and only events persistent over many frames remain present. The source emission is very faint and not detected in each single frame. To remove the warm pixels we applied sigma clipping and updated the data quality (DQ) frame of each individual rate file. The GN20 observations have a lower dark current than the reference dark present in the CRDS used by the pipeline. This results in an offset of the values of the rate files. We measure the median of the pixels in the inter-channel area of the detector and correct for the found offset ( DN/s).
The second stage of the pipeline (Argyriou et al., 2023; Patapis et al., 2023; Gasman et al., 2023) is run with default parameters, apart from skipping the background subtraction step. After stage two we performed a pixel-by-pixel background subtraction. We calculate a master background frame by median averaging both object and background frames. Due to the different dither positions median average does not contain any source flux.
As a test we created a background frame from the two background observations and compared the rms in the datacube to that created from the background with all the frames. The lowest rms was reached by using the median of all the frames as the background. We also extracted a spectrum of the Pa emission in both cubes and found the same, showing that no source emission is subtracted. The background frame was subtracted from each object frame. Finally, stage three of the pipeline was run, skipping the master background subtraction step. In the outlier rejection step we use a kernel_size of ‘11, 1’ pixels, and a threshold_percent of 99.8 %. By combining all the exposures, 4 3D datacubes are produced (one for each band) using the drizzle algorithm (Law et al., 2023). This produces datacubes with a spatial resolution of 0.13″per pixel (channel 1) and 0.17″per pixel (channel 2). The FWHM of the MRS observations is calculated as 0.31 (m)/ 8m, resulting in 0.37″(2.6 kpc) at the wavelength of Pa (Argyriou et al., 2023). The spectral resolution of the observation is R= 3774 for Pa and R=3390 for Pa (Labiano et al., 2021; Jones et al., 2023).
As already stated, our data on GN20 are taken with the SLOWR1 readout and consist of long integrations, cosmic ray showers affect a significant part of the frames. Even though the updated pipeline significantly improves the removal of the CR showers, not all are removed and due to the faint emission of the target they considerably affect the extracted spectra to be analysed. The CR shower affect rather large parts of the detector and have elliptical shapes, Due to their spatial extent on the rate files, cosmic rays manifest themselves as stripes in the -direction in the reduced data cubes. As a final step of the data reduction process we employed the algorithm developed by Spilker et al. (2023) to remove the striping due to the CR showers which are not removed by the pipeline.
2.3 Archival datasets
In this paper we compare the MRS observations with a multi-wavelength dataset to obtain a comprehensive picture of GN20. We use the CO(2-1) Very Large Array (VLA) observations presented in Carilli et al. (2011) and Hodge et al. (2012), with a synthesized beam size of 0.21″, to compare the distribution and kinematics of the ionized gas to that of the molecular gas. We also use the 880 m continuum emission obtained with the Plateau de Bure Interferometer (PdBI, Hodge et al., 2015). These data have a synthesized beam size of 0.2″x 0.3″.
To relate the ionized gas properties to the stellar distribution in GN20 we use the JWST/MIRI F560W imaging (1.1 m rest-frame, Colina et al., 2023). Additionally we use HST imaging (PI: Faber, ID: 12442) with the ACS camera (F606W, F775W and F814W) and the WFC3 camera (F105W, F125W and F160W), tracing the UV-optical rest-frame emission. The reduced HST images were downloaded from the Mikulski Archive for Space Telescopes (MAST), astrometically aligned to GAIA DR3 (Gaia Collaboration et al., 2023).
2.4 Astrometry
To improve the absolute astrometry of the observations we followed the recommended procedure and obtained simultaneous imaging in the F770W filter. This image was reduced using the JWST pipeline v1.8.2 and context jwst1030.pmap following the procedure presented in Álvarez Márquez et al. (2023b). The reduced F770W image is astrometrically calibrated using GAIA DR3 (Gaia Collaboration et al., 2023), resulting in an astrometric accuracy of 70 mas. The offset from the initial astrometry provided by the telescope was calculated and applied to the header of the MRS data cube.
Both the F814W image from HST and the F560W MIRI image are astrometrically calibrated with GAIA DR3 with an uncertainty less than 70 mas. The 880mm and CO(2-1) observations were phase referenced to quasars and their absolute astrometry is estimated to be a tenth of their synthesized beam, i.e. 20 mas. This makes the total accuracy of all the data (70 mas) well within the size of a pixel in the MRS data cubes.
As a final check we stacked the cube of channel 2 in the wavelength direction to get a pseudo broadband image, detecting the bright nucleus seen in the F560W imaging Colina et al. (2023) in the continuum. We found that the continuum emission in the MRS cube overlaps with the bright nucleus in the F560W image.
3 Analysis
In this section we describe the procedure we have developed to extract emission line spectra of both extended and point source emission. Additionally we describe the procedure to create the emission line maps we use to study the spatial distribution of the ionized gas.
3.1 Extraction of the spectra
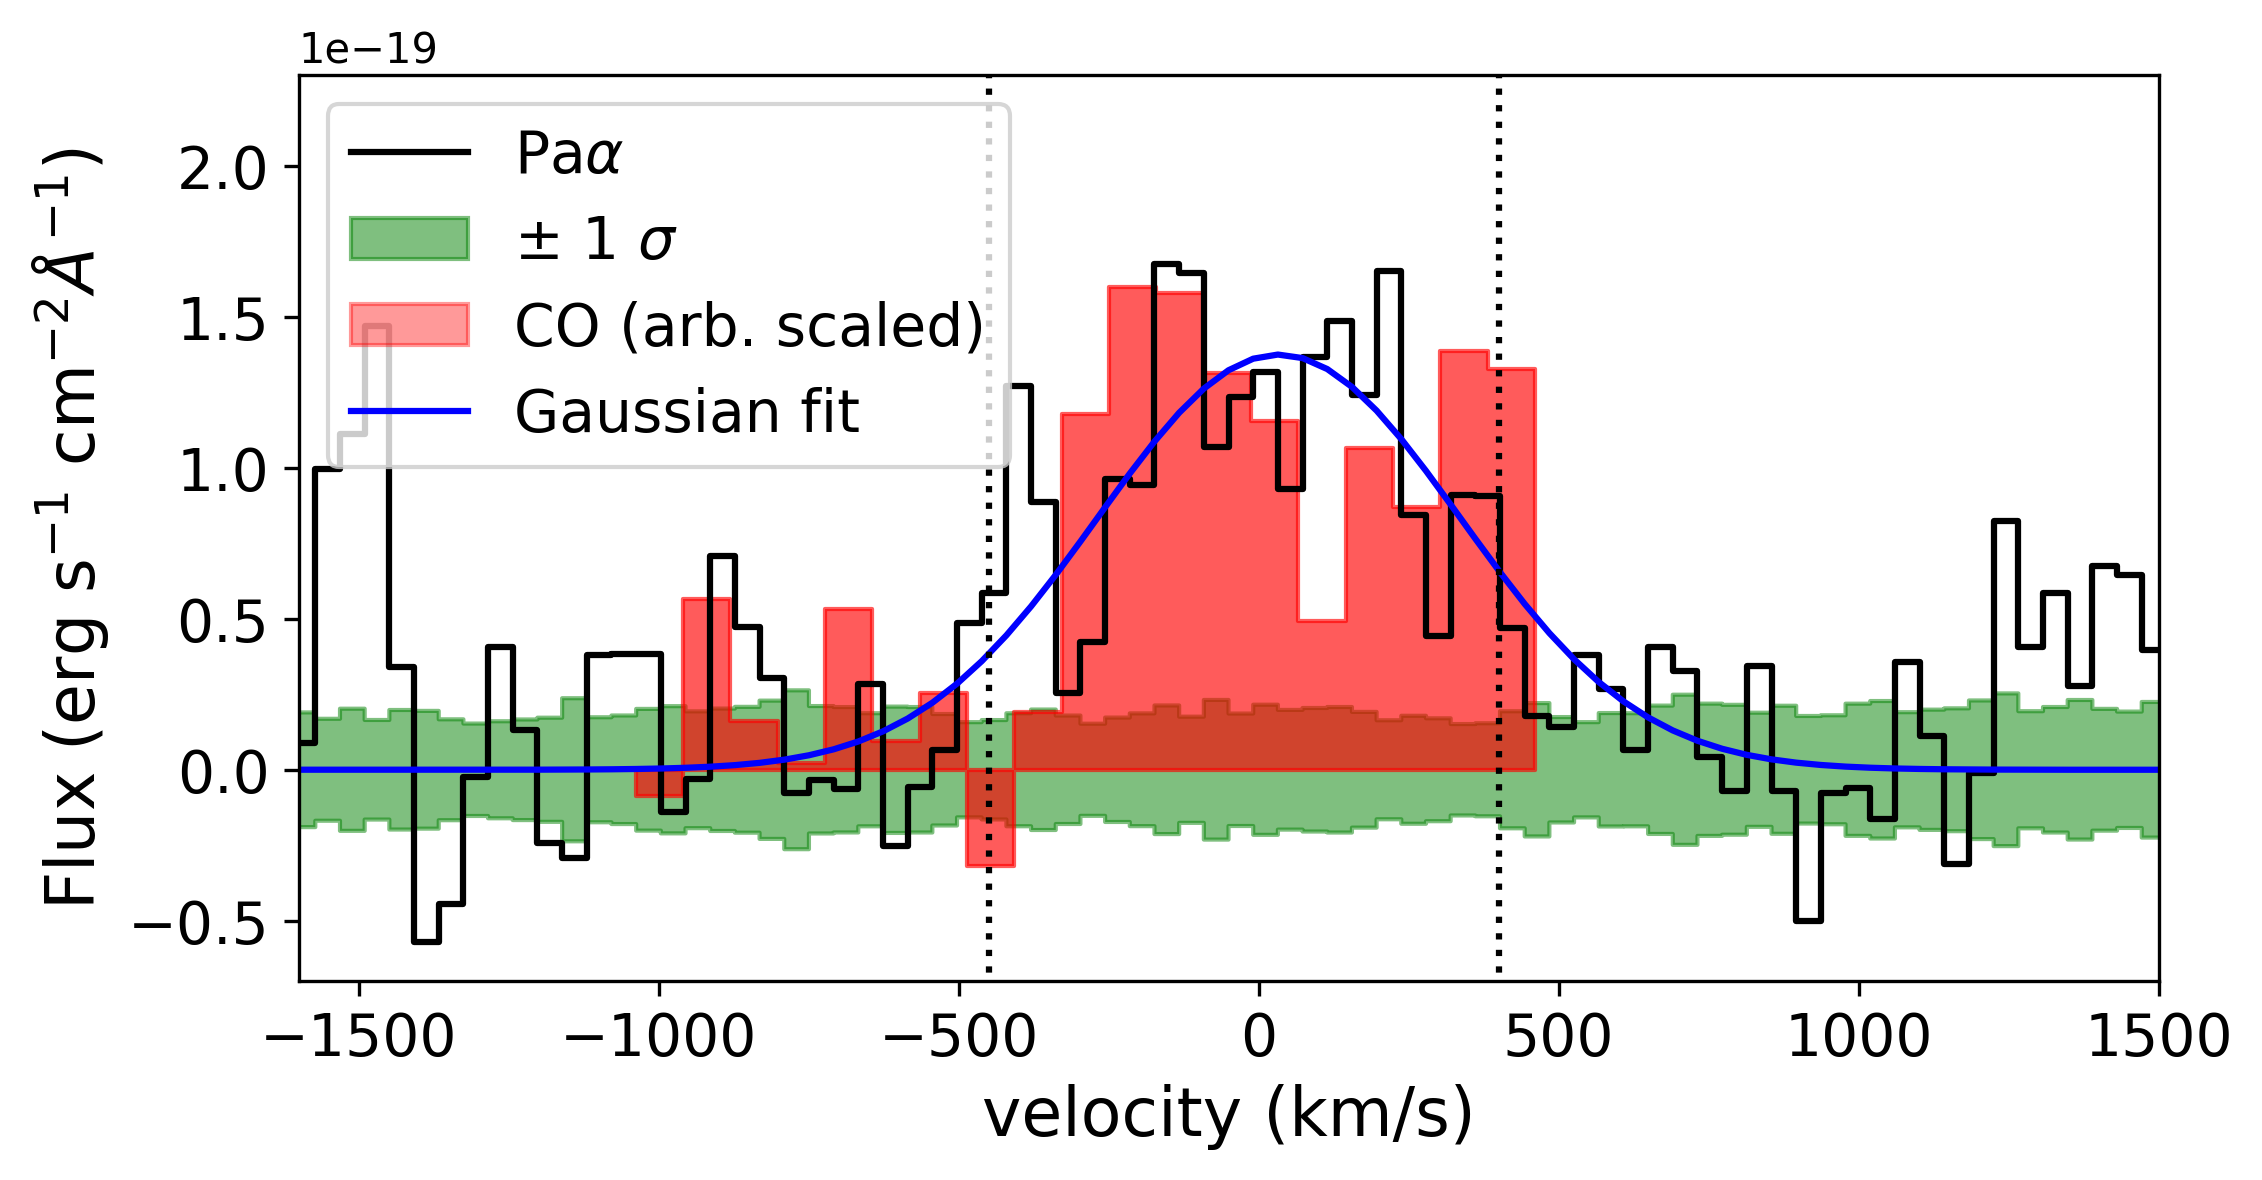
In order to get the integrated emission line profiles we extract the spectrum by integrating over a circular aperture using photutils (Bradley, 2023) in each wavelength bin. For extraction of the integrated Pa emission line we use an aperture with a radius of 6 pixels (1.02″, 7 kpc), covering the observed extent of GN20 in CO(2-1) (Hodge et al., 2012) and the F560W continuum (Colina et al., 2023). No aperture correction is applied as the aperture is relatively large compared to the size of the PSF (0.37″) and the emission is spatially extended. The resulting integrated Pa emission line profile is shown in Fig. 1. We calculate the error by measuring the standard deviation (plotted in green) in a sky aperture with the same size, multiplied by the square-root of the number of pixels. We show in red the CO(2-1) spectrum of GN20 from Hodge et al. (2012). The two spectra look fairly similar, with the exception that the Pa emission shows blue shifted emission to km s-1, while the CO emission is only detected to km s-1.
To measure the redshift of GN20 from the Pa emission, we fit a single Gaussian profile to the integrated spectrum (Fig. 1). We find = 4.0553 0.0006, within 1 from the value derived from the CO(2-1) observations by Carilli et al. (2011). For consistency with the literature we use =4.0548 throughout the paper.
For the extraction of unresolved sources (clumps) we extract Pa spectra with a radius equal to the instrumental PSF (0.37″). We measure the aperture correction for this aperture on the MRS over-sampled and drizzled PSF models from Patapis et al. (2023). We find a correction factor of 1.42. For error determination of the point source extractions we extracted sky spectra at 9 places in the data cube where no galaxy emission is present and use standard deviation of these spectra as an error estimate.
3.2 Construction of emission line maps
The integrated Pa spectrum (Fig. 1) shows emission at velocities between to +400 km s-1. The CO(2-1) emission of GN20 shows a similar range of velocities and shows a velocity gradient due to the global kinematics of the galaxy (Hodge et al., 2012).
In order to reduce the background noise in the emission line map, and keep the extraction window as narrow as possible, we first create a position velocity (PV) diagram using the Pa emission as guide. This line is the brightest and can be detected in the data cube. We sum up the emission over a pseudo-long slit placed over the major axis of the galaxy with a width of 8 pixels (1.4″). Hodge et al. (2012) find a position angle (PA) of +25°. We find that the same PA gives the brightest Pa emission in the PV diagram (Fig. 2) and find no evidence for a difference in PA between the CO and Pa emission.
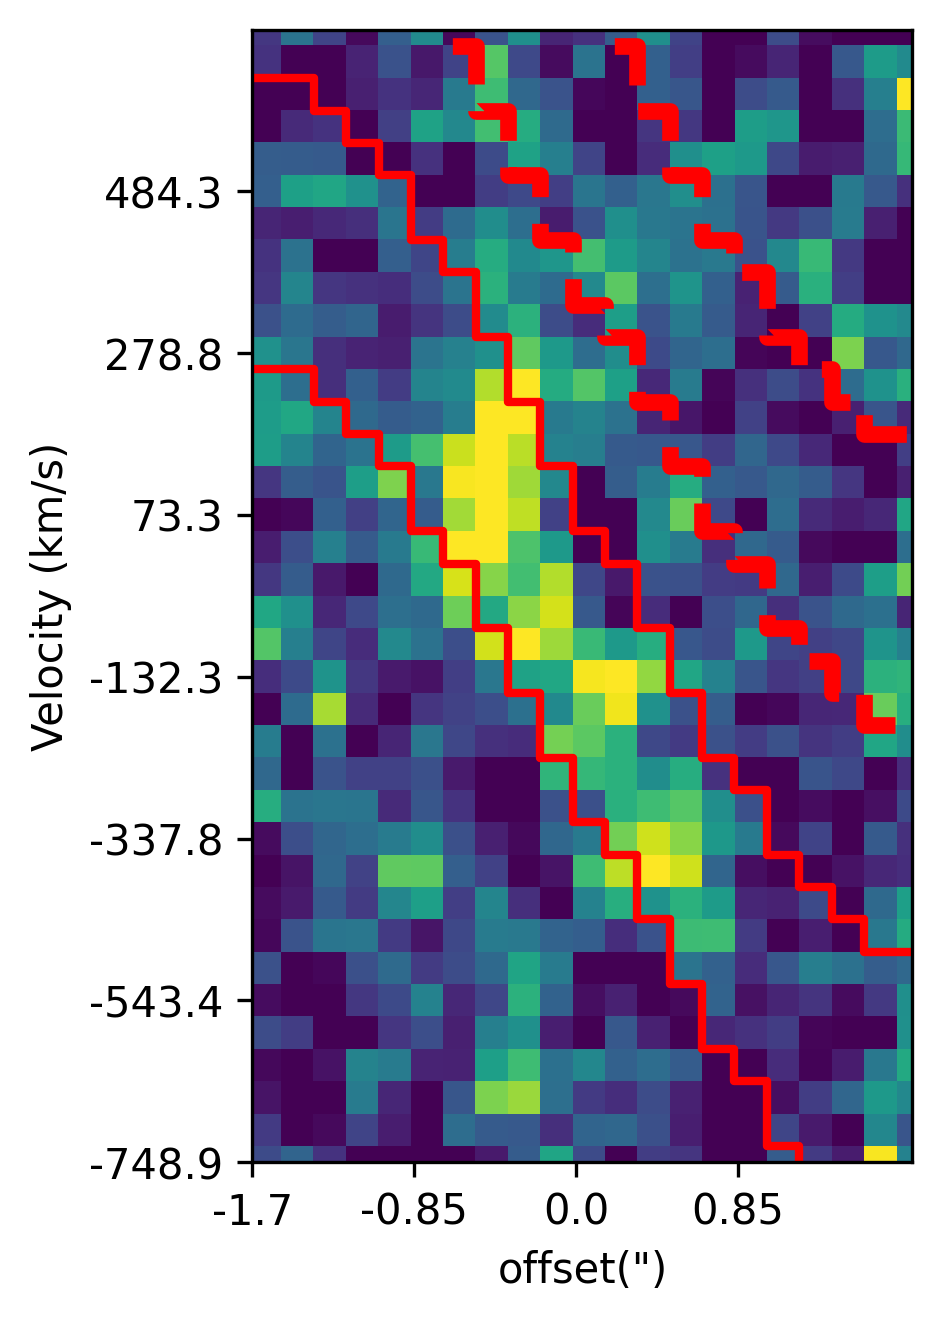
Based on the observed shape of the Pa emission in the PV diagram, we construct an aperture where the velocity scales as the arctan of the radius, commonly used to describe galaxy velocity profiles (Glazebrook, 2013). We adjust the parameters such that all the Pa emission in the PV diagram is included. This function provides us with a central velocity of the Pa emission as a function of position along the major axis. From this we construct a map of central wavelengths of the Pa emission for each spatial pixel in the datacube. We construct the line map summing the flux in an aperture of 9 pixels in the wavelength direction (370 km s-1) centered on the derived central wavelength. Parallel to the aperture centered on the Pa line we construct a ”background” aperture by shifting the same function with 10 pixels along the radius axis from which we derive the noise statistics.
As Pa is the brightest line, we use the Pa aperture shape to extract line maps for other expected emission lines. The H2 and [SVI] lines are also located in channel 2. In order to extract emission line maps, we shift the map with the central wavelength derived for Pa to the central wavelength of the line of interest. For the Pa aperture in channel 1, we scale the extraction aperture taking into account the different pixel size and spectral resolution between channel 1 and 2.
4 Results
4.1 Emission line maps
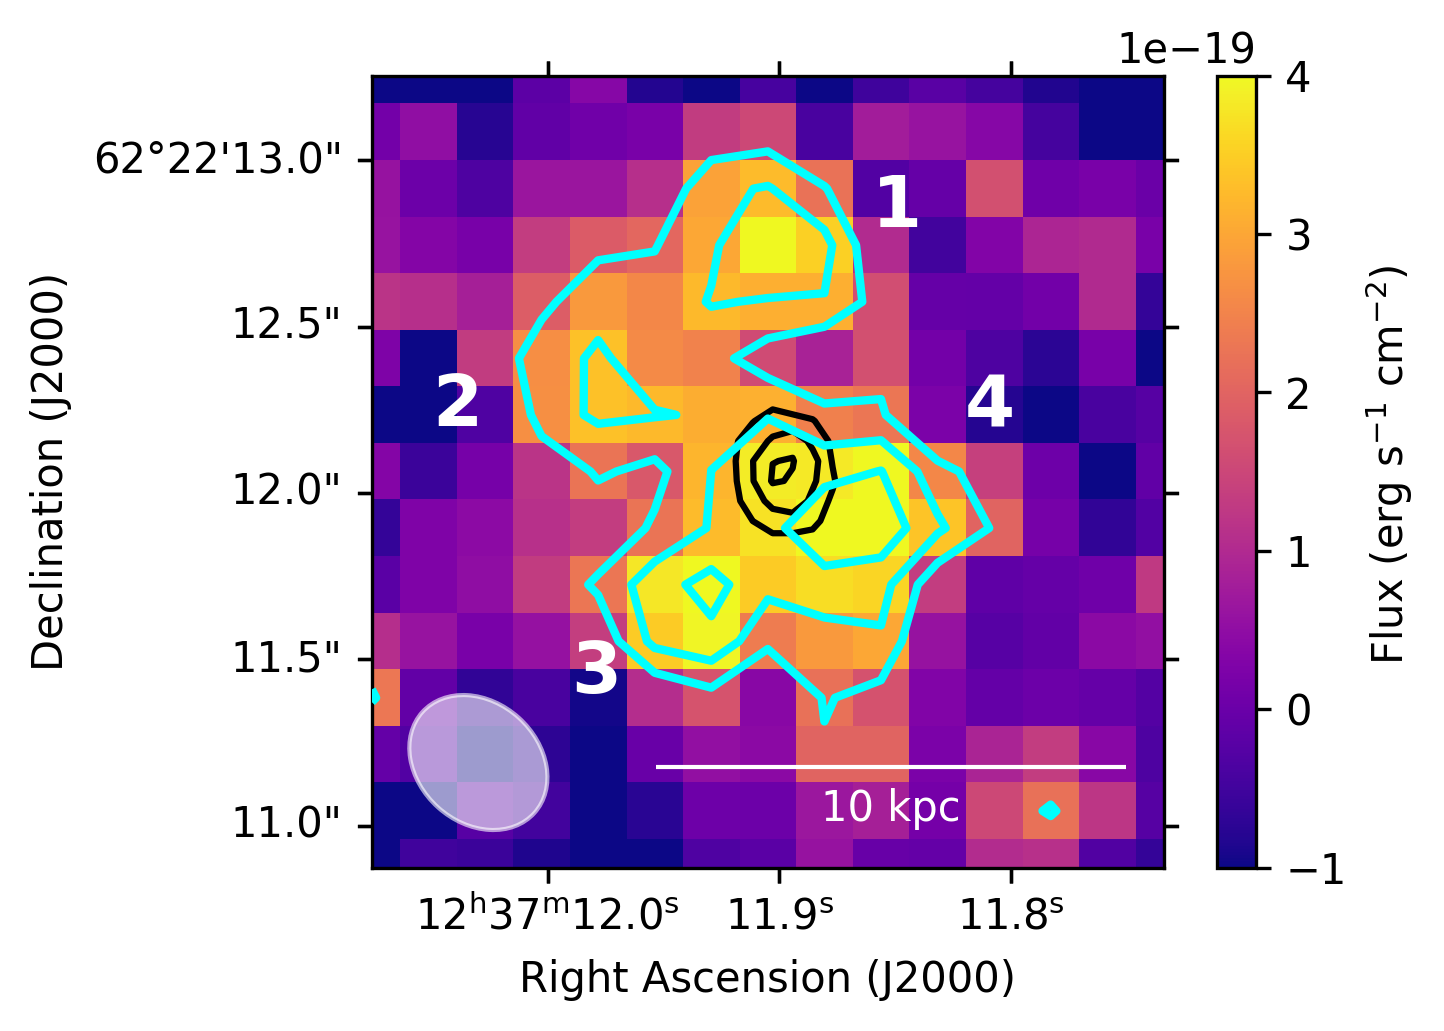
The extracted Pa emission line map is shown in figure 3. We detect Pa emission in GN20 over a large extent of the galaxy, up to a radius of 6 kpc. The Pa emission shows a very clumpy structure with 4 clumps detected in the outer regions of the disk and very little emission towards the central regions of GN20. We do not detect any significant Pa emission or any of the other emission lines covered in the two channels.
We derive the error on the detected Pa flux by measuring the standard deviation in a large aperture in the ”background” image as described in Sect. 3.2. For the Pa line map we find the standard deviation of the background image to be erg s-1 cm-2 per pixel, integrated over 9 wavelength elements. This would translate to a 3 detection limit in an extraction aperture equal to the FWHM of the PSF (0.37″) of erg s-1 cm-2. Fig. 3 shows the 2, 3 and 4- contours of Pa, derived using this standard deviation. For Pa, we derive a standard deviation of erg s-1 cm-2 per pixel, translating to a 3 detection limit in a aperture equal to the FWHM (0.3″) of the PSF of erg s-1 cm-2. For the other potential emission lines we derive the standard deviation in the same way and find 3 sigma detection limits of erg s-1 cm-2 for SiVI and erg s-1 cm-2 for both the H2 lines.
4.2 Integrated star formation rate
We calculate the integrated Pa flux of GN20 by integrating the emission line map over a circular aperture with a radius of 6 pixels (1.02″). This results in a total flux of 1.9 0.11 10-17 erg s-1 cm-2 (Table LABEL:tab:SFR_integrated). We use the star formation rate calibration from Kennicutt & Evans (2012). Kennicutt & Evans (2012) use a Kroupa (2001) IMF in their calibration, while in the remainder of the paper we use the IMF of Chabrier (2003), yielding identical results (Chomiuk & Povich, 2011). We assume an intrinsic Pa over H ratio of 0.116 (Osterbrock & Ferland, 2006) and we calculate a corresponding unobscured star formation rate (SFRPaα) of 144 9 M⊙ yr-1, assuming zero extinction.
| Line | Flux | SFRAv=0 |
|---|---|---|
| erg s-1 cm-2 | M⊙ yr-1 | |
| Pa | 144 9 | |
| Pa | ¡ | ¡ 43 |
To derive an upperlimit of the Pa flux we integrate the flux in the Pa map in a similar circular aperture (8 pixels, 1.04″). This results in a 1- upper limit for the integrated flux of Pa of 3 10-18 erg s-1 cm-2 (equivalent to an SFRPaβ ¡ 43 M⊙ yr-1 in the case of no extinction).
The 3 detection limit of Pa is 7.89 10-18 erg s-1 cm-2, comparing this to the observed Pa flux allows us to put a constraint on the foreground extinction. We assume an intrinsic Pa over Pa ratio of 2.075 (Osterbrock & Ferland, 2006), for T = 104 K and an electron density (Ne) of 102 cm-3 (for Ne = 104, this value would be 2.051). The observed (3 lower limit) Pa over Pa ratio is 2.37, a factor 1.08 higher than the theoretical ratio, this would result in a lower limit of = 4.3 mag, assuming a Cardelli et al. (1989) extinction law with an RV = 4.05. Taking the 1 error (Sect. 4.2), this lower limit in would increase to = 39.9 mag. In Sect. 5.1 we compare the derived SFR to values derived via other tracers.
4.3 Multi-wavelength comparison
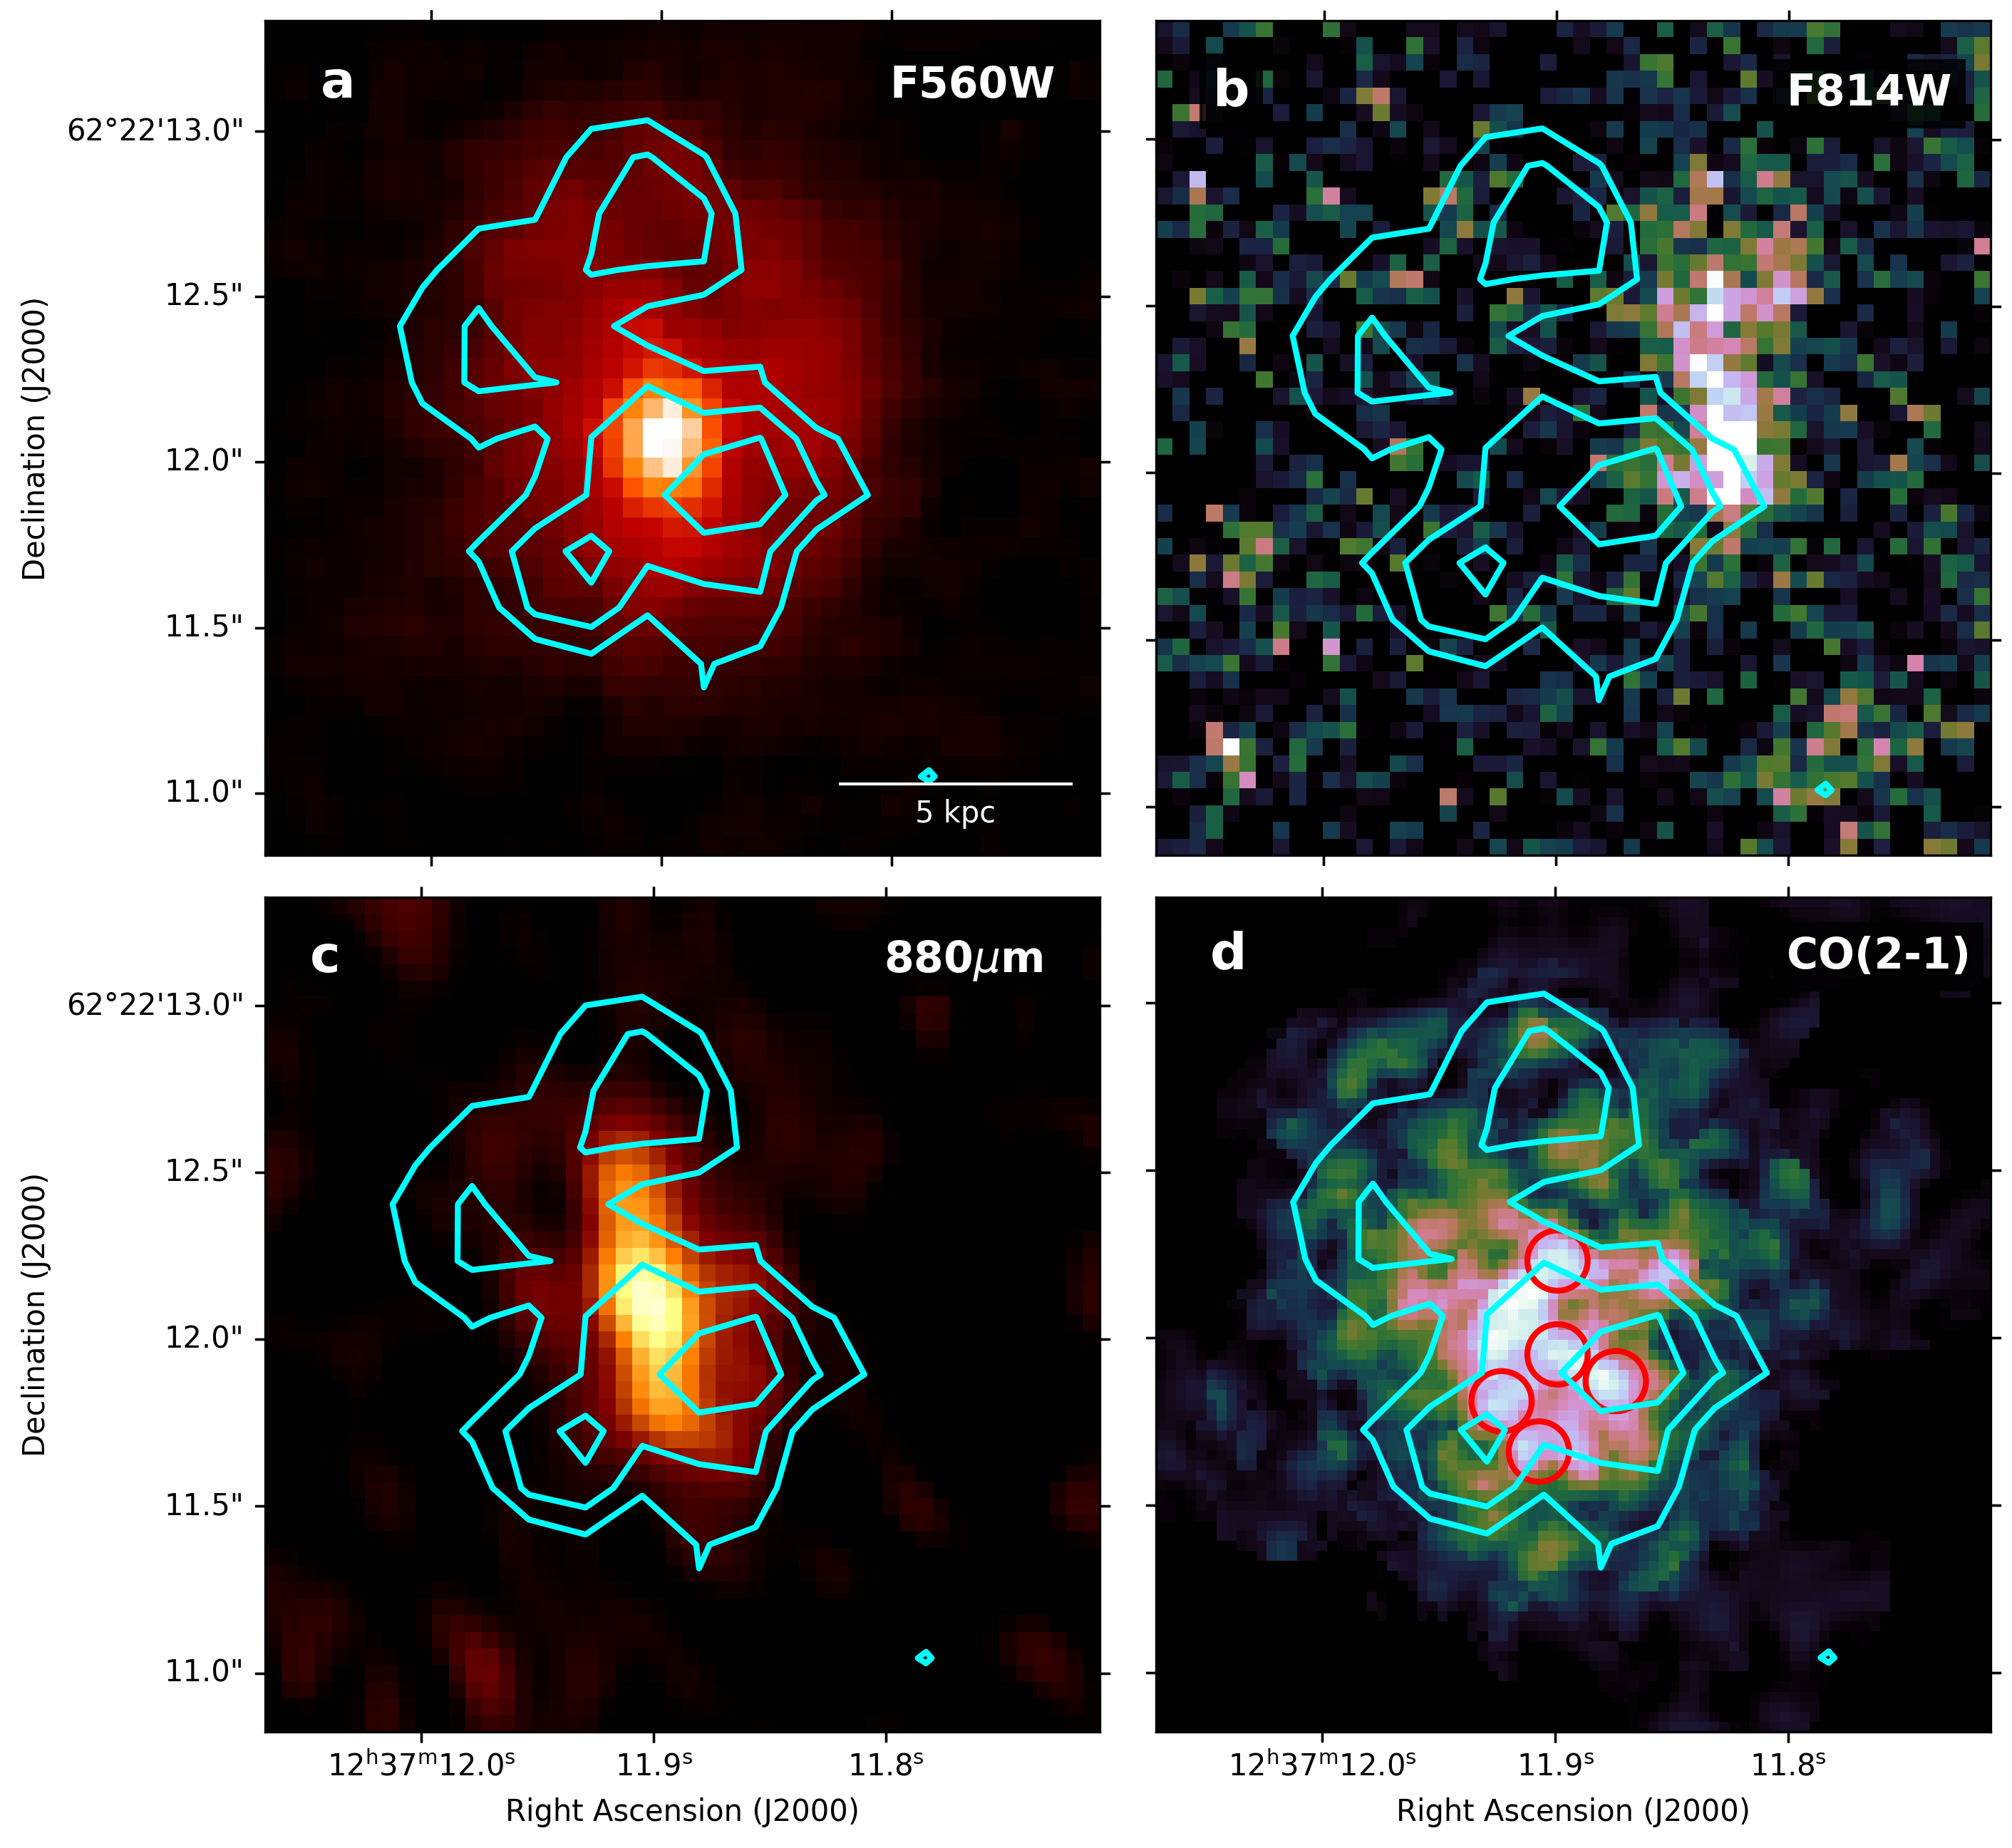
The Pa emission is observed over an area with a radius of 6 kpc (Fig. 3). The spatial distribution is very clumpy with most of the emission coming from the outer regions of the galaxy. In this section we compare the Pa spatial distribution with images tracing the stellar content, the cold dust, and the cold molecular gas in GN20. In Fig. 4 we compare the morphology of the Pa line emission, represented by the cyan contours to the tracers discussed above.
Comparison with the stellar distribution traced by the F560W image (panel a, Colina et al., 2023) shows that the Pa emission has a similar spatial extent as the F560W emission. The Pa clumps we detect are all originating in the outer areas of the stellar disk. Towards the bright central point sources we detect very little Pa emission. North-west of the brightest clump 4 the 3 contour shows an extension towards the nucleus (Fig. 3).
Panel b shows the comparison with the HST F814W image, tracing the rest-frame 0.15 m emission. We find that there is virtually no overlap between the Pa emission and the rest-frame UV emission. The F814W reveals the UV-bright part of the galaxy where extinction is expected to be very low. Surprisingly, the UV emission is not associated with Pa nebular emission (see Sect. 5.3 for further discussion about the nature of the UV emission).
Comparison with the 880 m emission shows very little spatial correlation, most of the 880 m emission comes from the central area of the galaxy, while Pa emission is found further out. Comparison with the CO (2-1) emission line map (panel d) shows again that the CO emission is mostly coming from the central area of the galaxy where Pa is not detected. The Pa emission overlaps with the fainter outer areas of the CO emission. Similar to the Pa spatial distribution, also the CO emission shows a clumpy structure, although the clumps are located further inwards (Hodge et al., 2015).
As discussed in Sect. 5.1, this multi-wavelength picture of GN20 suggests very high and strongly spatially varying extinction in GN20, where Pa and UV emission only emerge from the outskirts of the disk. Large extinction variations on (sub)kpc scales are commonly observed in local LIRGs and ULIRGs (e.g. Alonso-Herrero et al., 2006; Piqueras-López et al., 2013).
4.4 Pa clumps
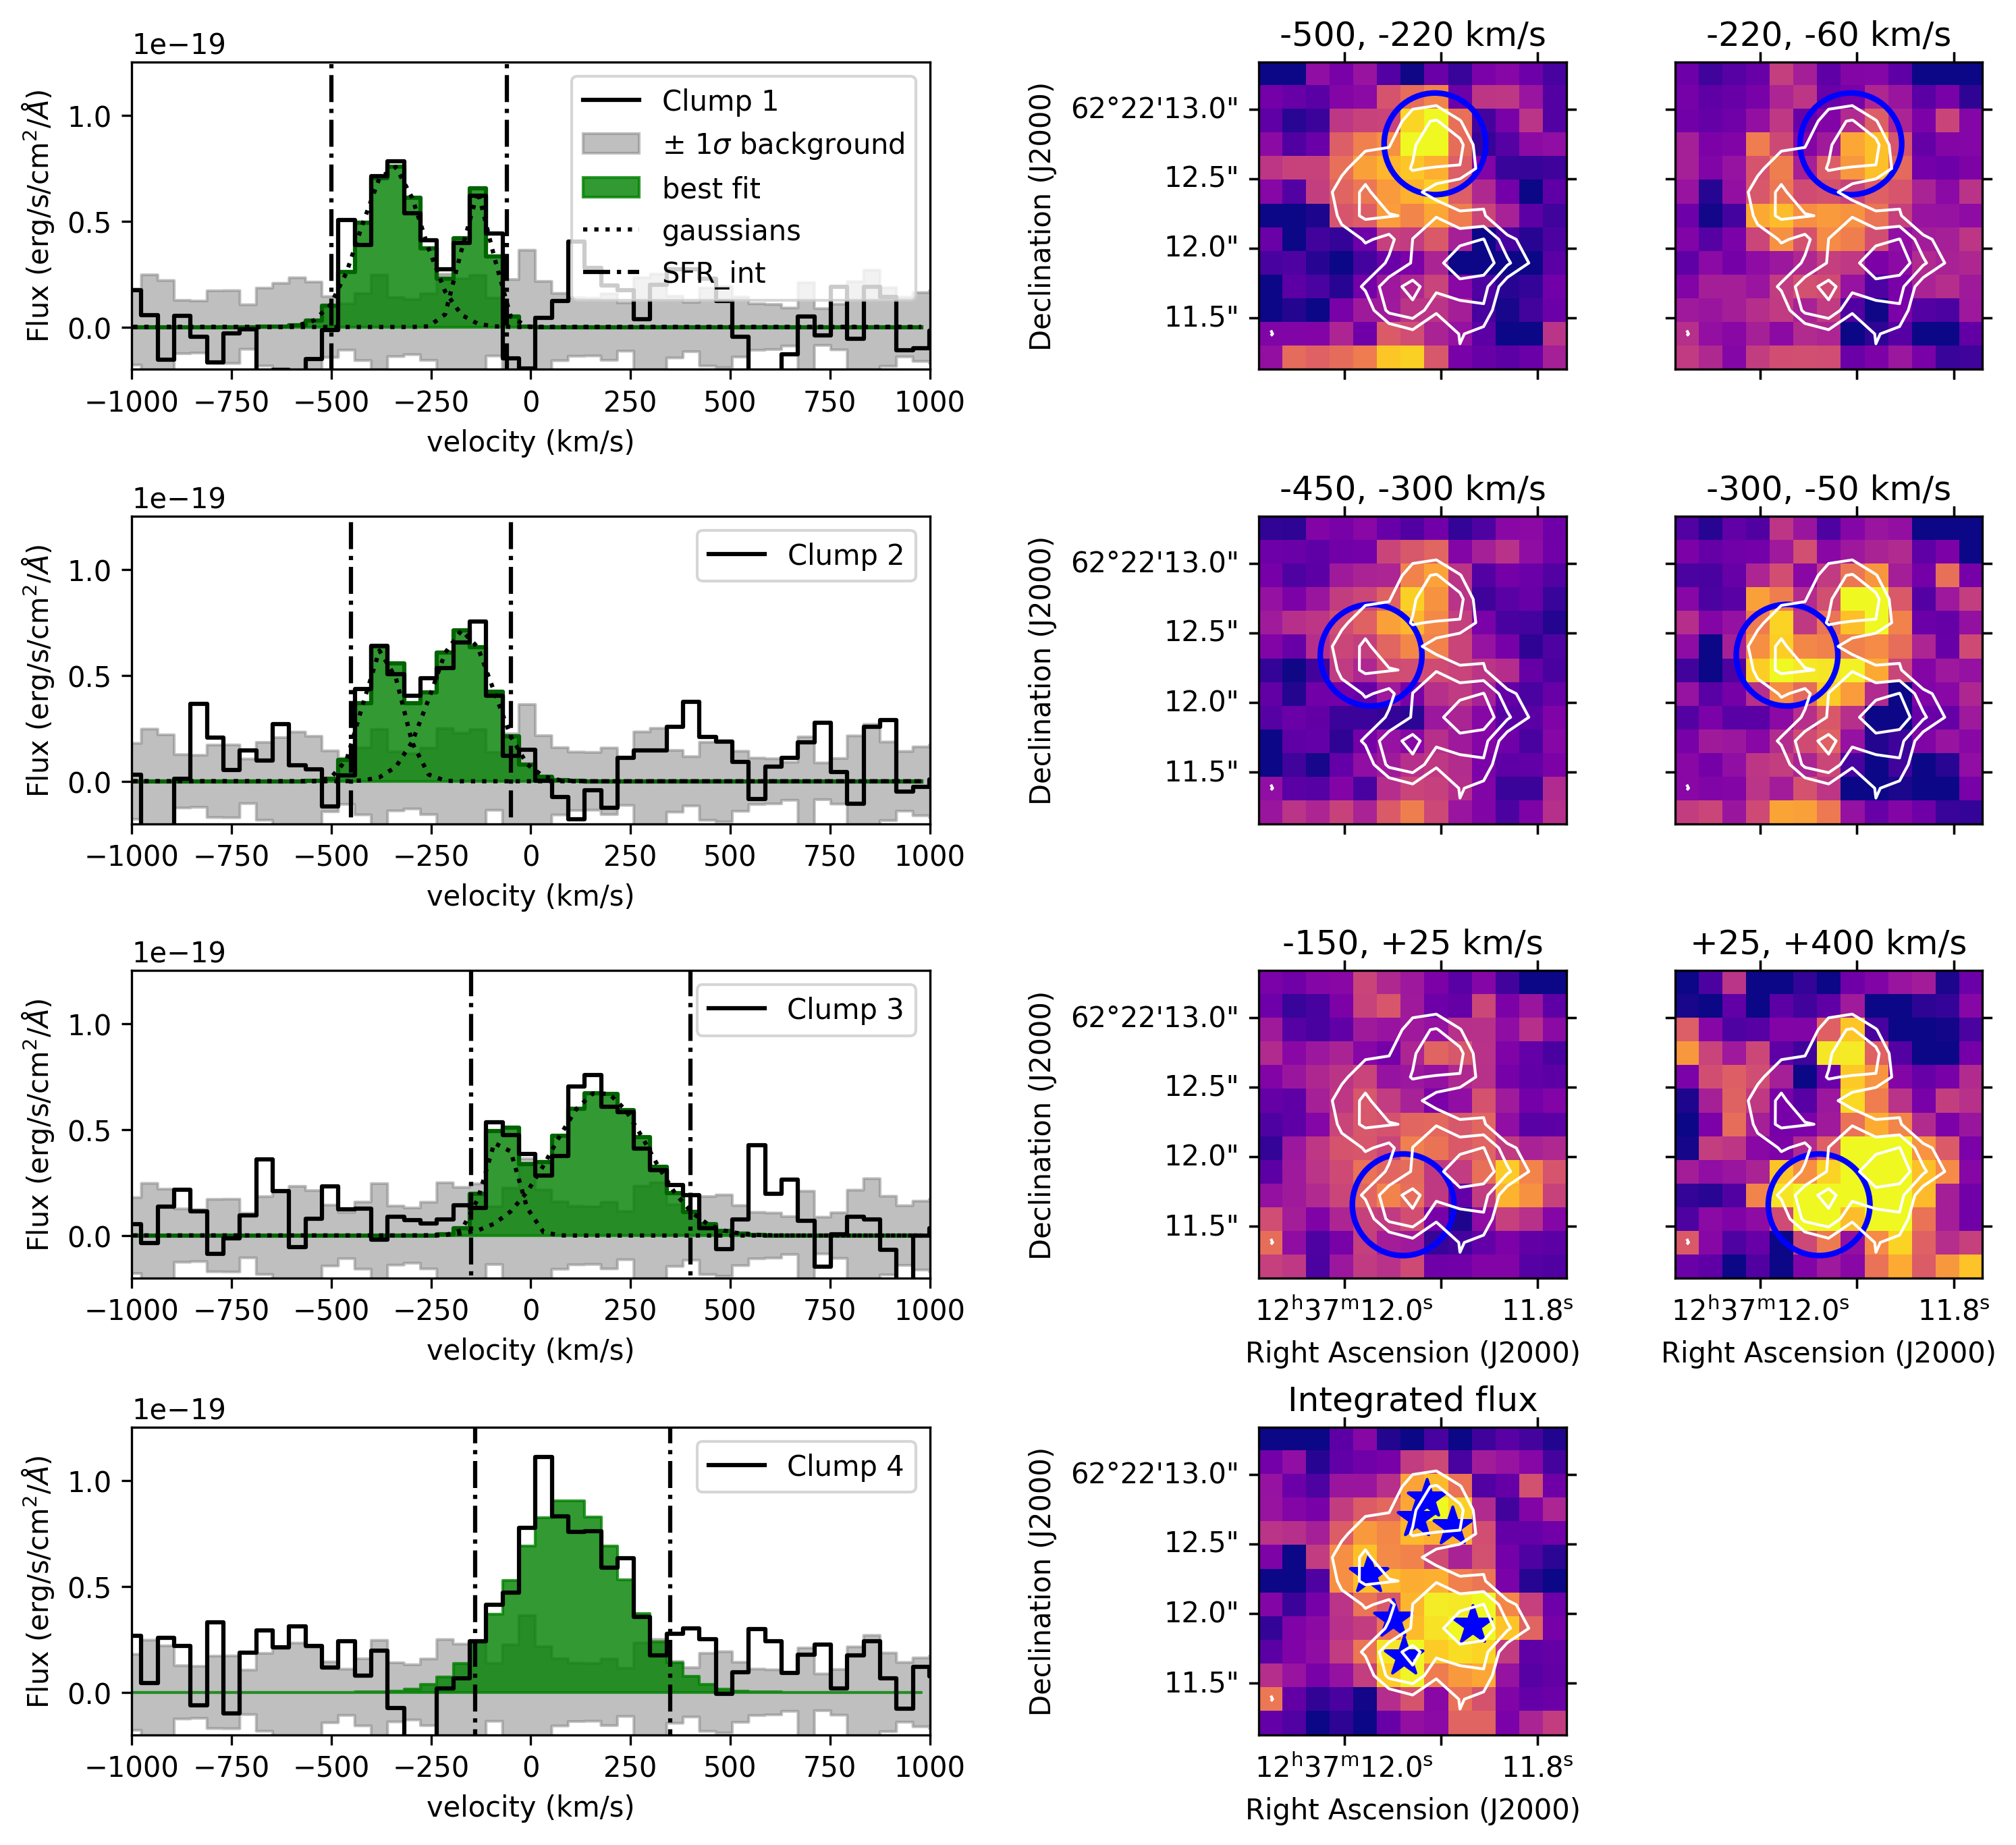
The Pa emission line map shows that the Pa emission is concentrated in four clumps, annotated in Fig. 3. We extract the spectra of the clumps with an circular aperture with a radius of 2.15 pixels (FWHM of the PSF at the observed wavelength of Pa). The spectra are displayed in the left column of Fig. 5. All clumps show a spectrally resolved Pa emission profile, with clumps 1, 2 and 3 showing a double peaked profile. Clump 4 shows one single broad profile.
We calculate the SFRPaα of each of the individual clumps by integrating the spectrum over the velocity range where the clumps are detected (vertical dashed-dotted lines in Fig. 5). We find values between 48 and 70 M⊙ yr-1 (Table LABEL:tab:clumps). The total SFRPaα by summing up the values of the clumps is 225 42 M⊙ yr-1, 55% higher than the integrated SFRPaα from the emission line map.
The discrepancy between these two values could be caused by the fact that we applied an aperture correction to the clump spectra, but not to the integrated galaxy spectrum as that is not a point source and is extracted over a much larger aperture. Additionally, the clumps are located close to each other with an average separation of 0.5 – 1.0″, making the wings of the PSF of the clumps overlap each other. What we can conclude is that the clumps dominate the total emission in the galaxy and no significant diffuse Pa emission is detected.
| Clump | R.A. | Dec | Flux | SFRAv=0 | velocity | Mvirial | |
|---|---|---|---|---|---|---|---|
| ( erg/s/cm2) | (M⊙ yr-1) | (km s-1) | (km s-1) | ( M⊙) | |||
| 1 | 12h37m11.91s | 62°22′12.8″ | 6.6 2.5 | 50 19 | — | — | — |
| 1a | 12h37m11.89s | 62°22′13.0″ | 4.6 3.1 | 35 24 | -348 16 | 77 16 | ¡ 6.8 2.8 |
| 1b | 12h37m11.87s | 62°22′12.8″ | 1.9 2.4 | 14 18 | -134 16 | 37 15 | ¡ 0.05 0.04 |
| 2 | 12h37m11.98s | 62°22′12.4″ | 6.3 2.4 | 48 18 | — | — | |
| 2a | 12h37m11.90s | 62°22′12.8″ | 2.3 2.5 | 18 19 | -371 20 | 47 15 | ¡ 1.2 0.8 |
| 2b | 12h37m11.87s | 62°22′12.9″ | 4.4 3.9 | 33 29 | -170 21 | 77 24 | ¡ 7.8 4.8 |
| 3 | 12h37m11.94s | 62°22′11.7″ | 7.5 3.3 | 57 25 | — | — | — |
| 3a | — | — | 1.5 2.0 | 12 15 | -74 18 | 41 15 | ¡ 0.4 0.3 |
| 3b | 12h37m11.91s | 62°22′11.9″ | 6.4 3.7 | 49 28 | 175 20 | 119 23 | ¡ 19 8 |
| 4 | 12h37m11.86s | 62°22′11.9″ | 9.3 3.1 | 70 23 | 94 18 | 138 18 | ¡ 26 7 |
To derive the kinematics of the clumps we fit Gaussian profiles to the extracted spectra using the astropy modeling package. Clumps 1, 2 and 3 are fit with two gaussians simultaneously. Clump 4 shows a hint of a second component on the red side of the Pa profile, but the components are too close to allow a double Gaussian fit. We calculate the velocity dispersion of the ionized gas by quadratically subtracting the width of the instrumental line spread function (Labiano et al., 2021; Jones et al., 2023). The FWHM of the instrumental broadening at 9.47 m is 88 km s-1 ( = 38 km s-1). From the derived velocity dispersion (Table. LABEL:tab:clumps), we can derive the virial mass using the isotropic virial estimator (e.g. Hodge et al., 2012):
| (1) |
The observed velocity dispersion is represented by in km s-1, the gravitational radius by in pc and the gravitational pc (km s-1)2 is the gravitational constant. The factor depends on the mass distribution and varies from for an exponential profile to for a Vaucouleurs profile (e.g. Bellocchi et al., 2013), introducing a factor two of uncertainty. In order to compare our results directly with the properties of the CO clumps, we follow Hodge et al. (2012) and choose (a uniform sphere). For the gravitational radius we use the FWHM of the MRS PSF at 9.48 micron (0.367″, 2.6 kpc). Given that the Pa clumps are not resolved, the effective radii derived in this way will only be upper limits, and the derived masses are thus also upper limits. The resulting values are presented in Table LABEL:tab:clumps.
The velocity profile of the clumps suggests that they are not single massive star forming clumps, but they consist of at least two sub-clumps shifted in velocity. Even clump 4 shows a hint of a second component. To study the nature of the clumps in more detail we construct channel maps of the Pa emission for each of the three double peaked clumps (middle and right columns, Fig. 5). We make channel maps for each of the clumps separating the emission of each of the components. In the top row of Fig. 5, we show first the extracted spectrum of clump 1 with the double peaked emission, the middle figure shows the channel map of the red peak between and km s-1, while the right figure shows the channel map of the blue peak ( – km s-1). In the figures we highlight the clump for which the channel maps are made by a blue circle. The same is shown for clump 2 and 3. In the case of clump 4 we cannot separate the two peaks and we do not show the channel map.
For all three clumps the emission in the red and blue channels are spatially slightly shifted from each other. We fit a two dimensional 2D gaussian profile in Qfitsview to determine the center of the clumps. In the case of clump 1 the blue-shifted emission (clump 1b, Table LABEL:tab:clumps) is shifted by 0.45″(3.2 kpc) to the north-east from the red-shifted emission (clump 1a). For clump 2, the redshifted emission (clump 2a) seems to be related to the redshifted emission in clump 1, while the blue shifted emission (clump 2b) peaks at the south-east of the extraction aperture. Clump 3a is very faint and we could not measure the position of this clump in the channel map. The bottom image in the middle column of Fig. 5 shows the Pa integrated line map (Fig. 3) with superimposed the location of the individual sub-clumps. This analysis shows that the Pa clumps are not single, very massive clumps, but more complex giant star forming regions blended by the spatial resolution of the MRS spectrograph, using both spatial and velocity information we can start separating the clumps into their different sub-clumps.
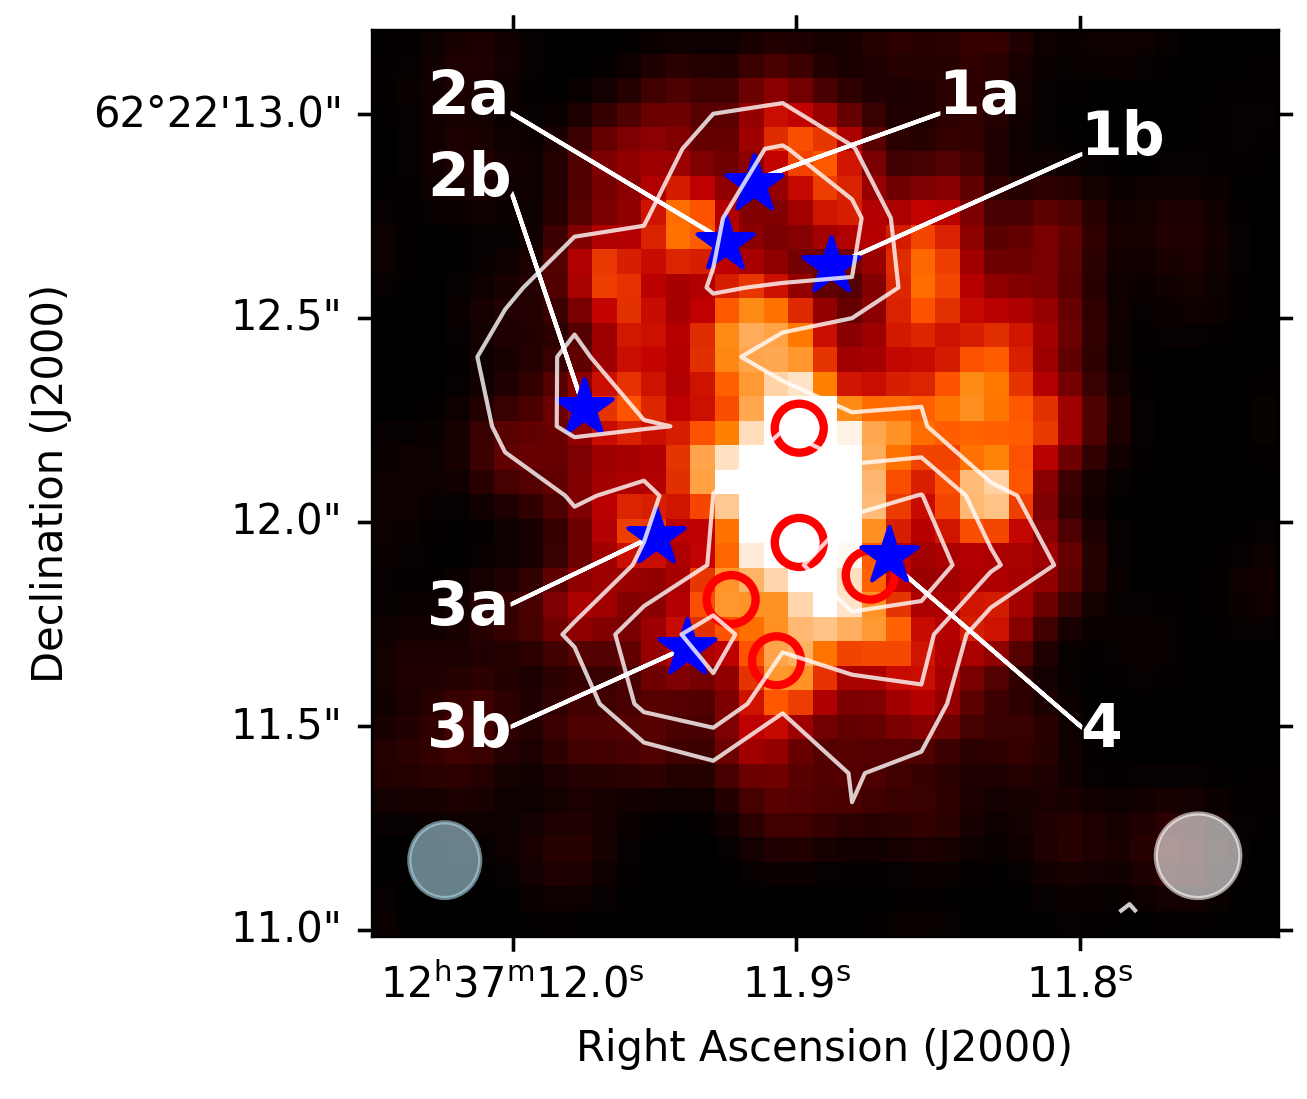
We compare the properties of these clumps to the clumps found in CO(2-1). Hodge et al. (2012) found five clumps in the CO emission, located in the central regions of GN20. The Pa clumps are located at further distances from the center (Fig. 4), apart from Pa clump 4, which spatially coincides with CO clump nr 3 (Hodge et al., 2012).
Due to the difference in spatial resolution between the CO and Pa maps it is hard to associate more clumps to each other. ALMA and HST observations of the nearby LIRG IC 4687 shows a similar pattern, where a large fraction of the clumps is detected in only one of the two tracers (Pa or CO(2-1), Pereira-Santaella et al., 2016). Studying a larger sample of LIRGS, Sánchez-García et al. (2022) reached similar conclusions.
The kinematic properties of the Pa clumps are similar to those of the CO clumps. The derived velocities reflect the large scale rotation curve of GN20 (Sect. 4.5). The measured velocity dispersion range between 40 and 138 km s-1. The largest value ( km s-1) is measured for clump 4. Inspecting the emission line profile suggests that clump 4 also has two components, but they are too close in velocity to each other to fit them with a double gaussian. This artificially broadens the single Gaussian fit. The velocity dispersion found for the CO clumps is 65 km s-1, in the same range as our Pa clumps. The CO map has a slightly higher spatial resolution than our Pa map, but also the CO clumps are spatially unresolved, resulting in upper limits for the dynamical mass. Within the limitations of both data sets the properties of both sets of clumps are similar.
4.5 Ionized gas kinematics
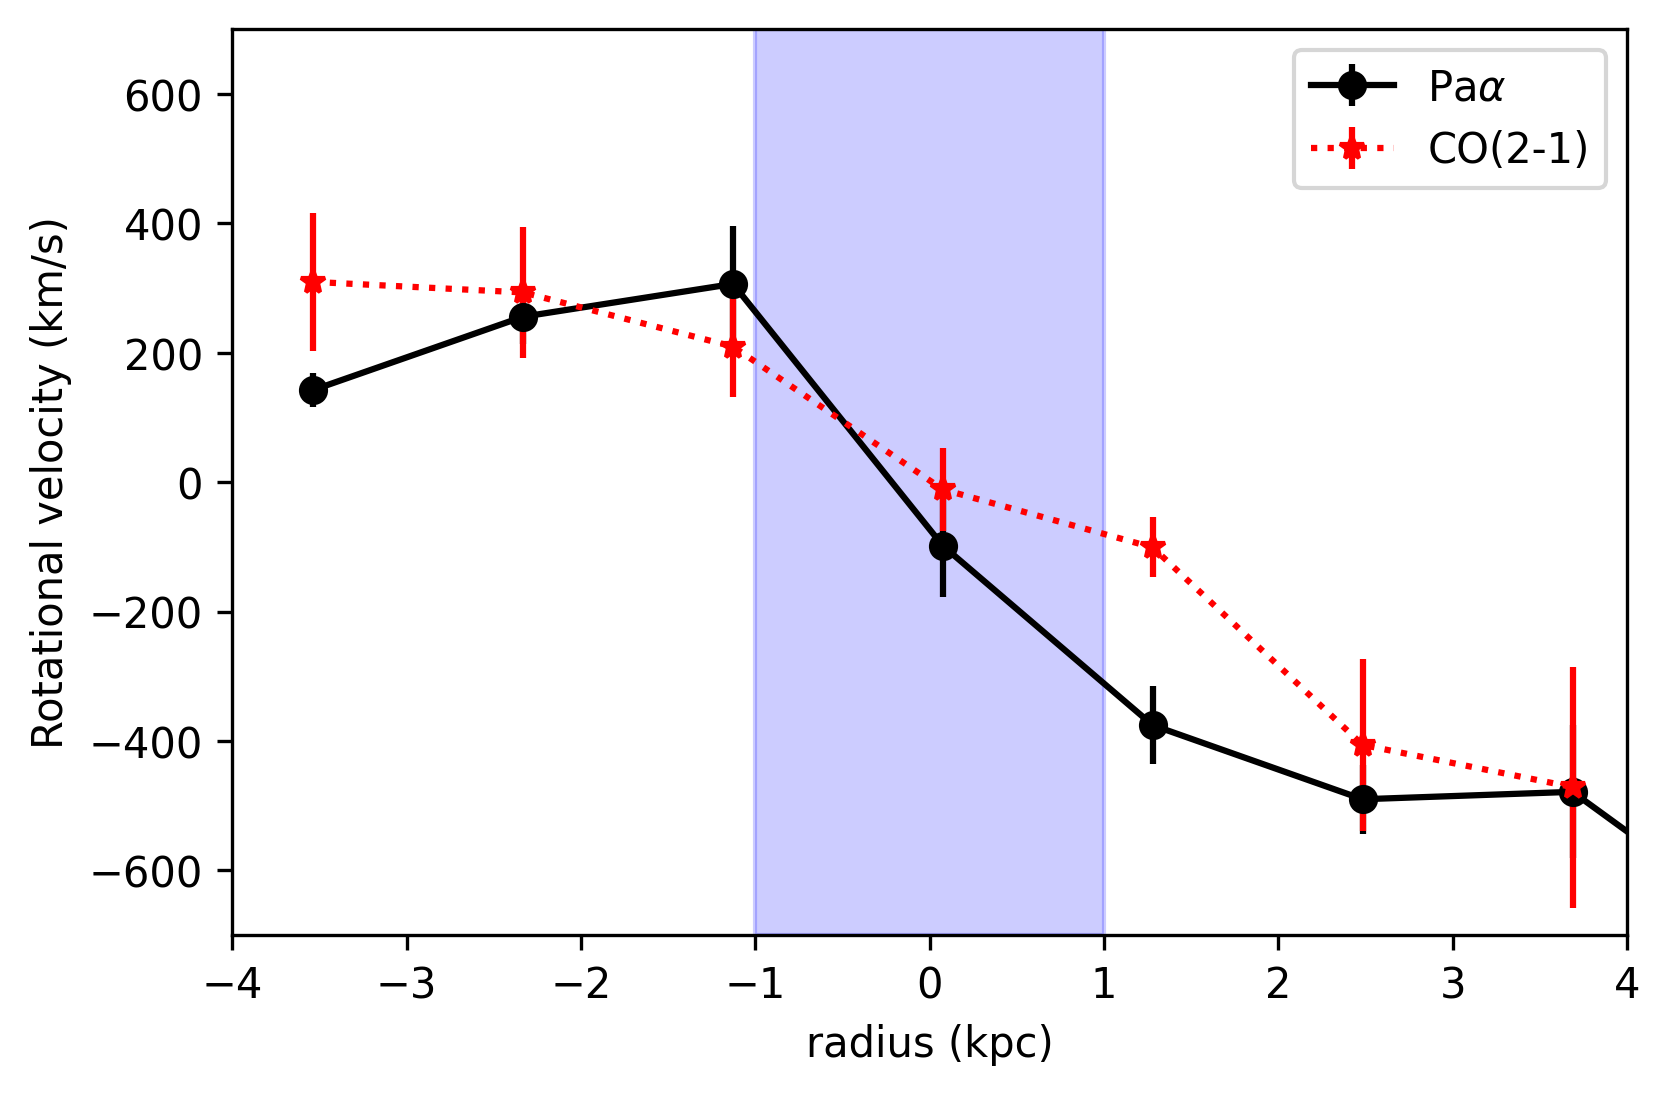
We use the spatially resolved Pa emission to derive the global kinematics of the ionized gas in GN20 and compare that to the kinematics of the neutral gas as traced by CO(2-1). The signal-to-noise ratio of the Pa emission is too low to perform a Gaussian fit to each pixel in the data cube. We therefore use the PV-diagram (Fig. 2), to derive the rotational velocity as a function of position along the semi-major axis of GN20.
We construct the rotation curve along the semi-major axis with a position angle of 25° by fitting a Gaussian profile to each spatial pixel of the position velocity diagram (Fig. 2). We correct the derived velocities for the inclination of GN20 of 3015°(using the thin-disk approximation), as derived by kinematic modelling of the CO(2-1) emission (Hodge et al., 2012), assuming the inclination of the CO is the same as Pa. The center of the rotation curve (radius = 0) is determined by collapsing the PV-diagram along the wavelength direction. This results in the integrated flux along the semi-major axis of GN20 and reveals the bright nucleus as seen in the F560W image. We fit a Gaussian profile to the emission peak to determine the center of the rotation curve.
The resulting rotation curve is shown in Fig. 6. We measure a velocity profile, increasing with radius to +300 km s-1 and -400 km s-1. The velocity dispersion varies between 85 and 190 km s-1, with a typical error of 40 km s-1. The spatial resolution of the Pa observation is 2.6 kpc. This means that beam smearing strongly affects the shape of the observed velocity profile as well as the velocity dispersion. The gradual change of the rotational velocity in the central two - three kpc remains unresolved and cannot be distinguished from e.g. a step function.The velocity dispersion is affected by overlapping clumps, as can be seen in the PV-diagram (Fig. 2), where at -0.7″ two clumps (clump 3 and 4) create an artificially broad Pa profile.
As comparison we constructed the rotation velocity profile from the CO (2-1) data. We use the derived velocity map (Fig. 3 in Hodge et al., 2012) to measure the rotational velocity. First we correct for the difference in spatial resolution between the CO(2-1) maps (0.19″) and the Pa map (0.365″). We convolve the CO(2-1) velocity map with a Gaussian kernel with = 0.32″(the quadratic difference between the two FWHM values). Using the astrometric information, we regrid the convolved velocity map to the same pixel scale as the Pa linemap to compare them on the same spatial resolution. We collapse the velocity map along the semi-major axis and use the maximum observed velocity at each distance as the radial velocity measurement, the standard deviation of the velocity values is used as estimate of the uncertainty. The resulting CO(2-1) velocity curve is plotted in red in Fig. 6.
Both the CO(2-1) and Pa rotation curves reach the same minimum and maximum velocity. However, they also show differences. The Pa rotation curve is much steeper than the CO(2-1) rotation curve, and both at -4 kpc as well as 1 kpc, the two rotation curves differ by 200 km s-1. This could be related to the different spatial distribution of the Pa emission with respect to the CO(2-1) emission (Fig. 4.) The Pa clumps are situated around the nucleus and the Pa rotation curve is dominated by a rotating ”ring” of clumps. The CO distribution is much smoother and stronger in the center and emitting more light at lower rotational velocities.
From the rotation curve of Pa we find a = 550 40 km s-1. This value agrees with the dynamical modeling of the CO(2-1) emission (575 100 km s-1 Hodge et al., 2012). From the measured velocity dispersion we calculate the flux weighted velocity dispersion, a measure of the random gas motions in the galaxy (e.g. Glazebrook, 2013): = 145 53 km s-1. This value should be interpreted as an upper limit to the real flux weighted velocity dispersion as we integrate the emission over the minor axis and overlapping clumps will create an artificial broadening of the emission line profile. From these quantities we calculate . This shows that the overall gas kinematics of GN20 are rotationally dominated in contrast to many (high-z) starburst galaxies (e.g. Förster-Schreiber et al., 2009; Law et al., 2009; Bik et al., 2022), which have values below the dividing line between dispersion and rotationally dominated of 1.83 (Förster-Schreiber & Wuyts, 2020). Rizzo et al. (2021) present a kinematic study of 5 strongly lensed DSFGs around =4.5 with ALMA and found high values for all galaxies, suggesting that they are rotationally dominated disk galaxies. Comparing GN20 values with those of (U)LIRGs shows that the of GN20 is consistent with that of low-z LIRGs. Bellocchi et al. (2013) derive an average = 3.4 for LIRGs and = 2.0 for ULIRGs. Bellocchi et al. (2013) divide their (U)LIRG sample in different morphological types corresponding to the different phases along the merging process. The measured makes GN20 consistent with interacting systems with a perturbed disk.
Considering that the Pa and CO(2-1) kinematics as well as the morphology suggest that GN20 is a large disk galaxy, we compare the derived value for with theoretical predictions for in the context of a galactic disk model. Krumholz et al. (2018) shows that in disk galaxies is determined by both star formation feedback processes and turbulence due to gravitational instabilities. Comparing the location of GN20 in the vs SFR diagram (Fig. 4 in Krumholz et al., 2018) show that the high values for GN20 derive from gravity driven turbulence and shares the location with ULIRGs in the more nearby universe (see also Arribas et al., 2014). Interestingly, these ULIRGs are not disk galaxies, but galaxies undergoing a major merger event. However, our derived should be seen as an upper limit due to the overlapping clumps. Additionally, GN20 is significantly more massive and likely has a much more gas rich disk than ULIRG galaxies, resulting in higher due to the higher mass of the clumps.
5 Discussion
Using deep MIRI/MRS spectroscopy, we have detected spatially resolved Pa emission in GN20. In this section we discuss the implications of our findings and compare them to auxiliary data.
5.1 Extinction in GN20
We find a large discrepancy between the SFR derived from the Pa emission and the SFR derived from the infrared luminosity. Based on the Pa emission, under the assumption of no extinction, we derive SFRPaα = 144 9 M⊙ yr-1 (Table LABEL:tab:SFR_integrated). As shown in Sect. 4.2, the observed 3 upperlimit of Pa, does not provide a strict constraint on the extiction. Tan et al. (2014) derived the infrared star formation rate (SFRIR) based on 1.2-3.3 mm continuum observations, assuming a Chabrier (2003) IMF, and find a value for GN20 of SFRIR= 1860 90 M⊙ yr-1. This means that the observed Pa emission only reveals 7.7 0.5 % of the total star formation rate as detected from the mm observations.
By comparing the SFRPaα to the SFRIR for a sample of local LIRG galaxies, Tateuchi et al. (2015) find that, after extinction correction, both SFR measurements agree within a scatter of 0.27 dex. Piqueras-López et al. (2016) study the same relation, but with a sample of ULIRGs included. They find that in the case of the ULIRGs the SFRPaα corrected for extinction is typically lower than the SFRIR. Giménez-Arteaga et al. (2022) find again a better correlation between the SFR derived from Pa with the SFRIR.
The disagreement between SFRPaα and SFRIR can be caused by (a combination of) reasons: (i) The mm emission is not (fully) caused by star formation, but has a contribution from an active galactic nucleus (AGN), (ii) Ionizing photons can be directly absorbed by dust, contributing to SFRIR but not to SFRPaα (Piqueras-López et al., 2016), (iii) SFRIR traces the star formation history over a longer time (up to 100 Myr) than Pa (10 Myr) (Kennicutt & Evans, 2012), and (iv) The extinctions are so large that even Pa does not trace the full amount of ionized gas (Álvarez Márquez et al., 2023b).
A significant fraction of SMGs are major mergers (e.g. Gillman et al., 2023), as their local ULIRG counterparts, which makes the presence of an AGN in the center a realistic possibility. GN20 is located in an overdensity and shows evidence for a double nucleus, suggesting that GN20 is interacting or in an advanced stage of a major merger (Colina et al., 2023). Therefore the presence of an AGN can be expected (Ricci et al., 2017; Blecha et al., 2018). Based on the detection of the PAH 6.2 m emission, Riechers et al. (2014) conclude that the infrared emission from the nucleus could contain a significant contribution of a buried AGN. The total observed infrared SED is, however, dominated by the obscured starburst. Also Colina et al. (2023) attribute the bright nuclear emission seen in the F560W imaging to a strong nuclear starburst.
The center of GN20 contains a large amount of dust and gas, therefore a fraction of the ionizing photons will be absorbed by dust directly, before ionizing the gas. Additionally, SFRPaα traces the most recent star formation over the last 10 Myr, while SFRIR is sensitive to star formation over a much longer time period as intermediate mass stars are also capable of heating the dust, but do not produce ionizing photons in sufficiently large quantities. Piqueras-López et al. (2016) attribute the observed difference between SFRPaα and SFRIR to both these effects. The difference between SFRPaα and SFRIR in GN20 is, however, much larger than observed by Piqueras-López et al. (2016). Hodge et al. (2015) shows that the obscured, strong, starburst in the center of GN20 has a gas depletion time of 100 Myr. If no Pa would be emitted from such a starburst, that would mean that the extreme starburst in the center suddenly stopped forming stars 10 Myr ago, while there is still a huge reservoir of molecular material present.
Therefore, we attribute the discrepancy to the fact that we do not trace all the star formation with Pa due to the high extinction. As we do not detect any other hydrogen recombination line, we cannot derive the extinction for Pa. We can, however, derive an estimate from the comparison between SFRPaα and SFRIR. Using the Cardelli et al. (1989) extinction law with a RV = 4.05, we find a total extinction of AV = 17.2 0.4 mag. As a more realistic approach we use an extinction model assuming the gas and stars are mixed. We use the relation derived by Calabrò et al. (2018) for a sample of dusty starburst galaxies at =0.5-0.9 in combination with the extinction coefficients from Cardelli et al. (1989) extinction law to get an estimate of the attenuation. Using equation 1 in Calabrò et al. (2018), our ratio of observed SFRs gives a total visual attenuation of AV,mixed = 44 3 magnitudes.
The multi-wavelength comparison shown in Fig. 4 shows that the mm continuum emission is concentrated in the center of GN20, while Pa is originating from the clumps at a few kpc distance from the center. Without extinction correction these clumps account for 7.7% of the total star formation. An extinction corrected SFRPaα of the clumps will increase this fraction, for example increasing this fraction to 20% would require an = 7 mag for the Pa clumps.
We attribute the remaining fraction of the star formation to be in the center, which would suggest an even higher extinction in the center of GN20. Piqueras-López et al. (2013) show that most (U)LIRGs display a similar behaviour where large extinction variations, with areas with AV as high as 20-30 magnitudes, are found (see also Bohn et al., 2023). These (U)LIRGs typically have an obscured center. However, in most local (U)LIRGs the extinction corrected SFR traced by the Paschen lines follows pretty well the SFRIR(Giménez-Arteaga et al., 2022), suggesting that extinctions in most (U)LIRGs are not as extreme as in GN20. Two ULIRGs show very high extinction in their nuclei. Based on near-infrared extinction measurements, Engel et al. (2011) derive very high extinction in the two nuclei of Arp 220. They show that some of the gas is so obscured that it is not detected in the near-infrared emission lines. Based on MIR diagnostics, Haas et al. (2001) derive values of AV,mixed = 110 mag for the central starburst in Arp 220 and AV,mixed = 50 mag in the center of UGC5105 (see also Sturm et al., 1996). This shows that such high extinction as seen in GN20 is also detected in the more extreme ULIRG galaxies, where a very dusty extreme starburst is driven by the merger process.
High spatial resolution observations of U(LIRGs) have revealed extremely compact (¡100 pc) obscured nuclei (CONs) in many ULIRGs and LIRGs (e.g. Aalto et al., 2015; Donnan et al., 2023). Deeply buried in these CONs is either a rapidly growing super massive black hole or a compact nuclear starburst, hidden behind very high column densities of dust and gas. In GN20 we do not have the spatial resolution to find such a compact region, however, the highly obscured and extreme nuclear starburst we find in GN20 might resemble what we observe as CONs in nearby (U)LIRGs.
5.2 Nature of the star forming clumps
We identify four individual clumps based on the Pa emission line map, using their kinematics we find that they are not single clumps, but consist of at least two sub-clumps in each of them. We search for continuum emission from these clumps in the F560W image (Colina et al., 2023). The F560W image has a spatial resolution of 0.24″(1.7 kpc), slightly higher than that of the Pa linemap.
Following Colina et al. (2023), we apply the Lucy-Richardson deconvolution algorithm (Lucy, 1974) to the image data. For the deconvolution of the input data, we use the empirical PSF derived by Colina et al. (2023) which is based on close-by stars in the MIRI imaging field of view. Due to the confusion-free detection of GN20 in the MIRI data, we do not apply any background subtraction. In total, we use 10000 iteration steps to minimize the chance of artifacts. In the final step, we convolve the resulting delta map with a 3-pixel Gaussian Kernel filter adapting the procedure described in Peißker et al. (2022). Figure 7 shows the resulting image with the Pa emission map contours in white. The blue asterisks show the different Pa clumps identified in Sect. 4.4 and the red circles show the position of the CO clumps identified in Hodge et al. (2012). The final convolved F560W image shows a very clumpy structure, similar to the residual image (Fig. 1 in Colina et al., 2023), after removing the best fitted two component model, representing the smooth light distribution in GN20. Considering the clumpy nature of both the CO and the Pa, both tracing current star formation, the diffuse component of the F560W image could be related to more mature stellar populations having a smoother spatial distribution.
We find that some of the Pa clumps can be attributed to clumpy emission in the F560W image, clumps 2b, 3a and 3b show a matching F560W clump. Based on their location and kinematics we suggest in Sect. 4.4 that clump 1a and 2a might be tracing the same clump. In the F560W image, there is a clumpy structure located north-east of clump 2a, making this a potential counterpart. For clumps 1a and 4 on the other hand, no clear counterpart in the F560W can be found. Future higher spatial resolution NIRCAM imaging of GN20 will reveal more details on the clumpy structure of the GN20 disk.
Clumps are commonly observed in star forming galaxies at z 1 (e.g. Elmegreen et al., 2009b; Schreiber et al., 2011; Livermore et al., 2012; Adamo et al., 2013; Dessauges-Zavadsky & Adamo, 2018). The clumpiness of high- galaxies is attributed to the higher gas fraction in galaxy disks (e.g Genzel et al., 2008; Girard et al., 2018). The disks are fed by infall and accretion of gas-rich material, where clumps form via violent disk instabilities (Dekel et al., 2009b; Ceverino et al., 2010; Mandelker et al., 2014; Inoue et al., 2015). In this scenario, the giant clumps that form have masses of a few percent of the mass of the disk (Ceverino et al., 2010). Hodge et al. (2012) derive a dynamical mass for GN20 of 5.4 2.4 1011 M⊙. The upper limits we derive on the clump masses ( 109 M⊙, Table LABEL:tab:clumps) are consistent with the predictions of the violent disk instabilities scenario. The masses derived for the CO clumps by Hodge et al. (2012) are consistent with this as well. Similarly, Spilker et al. (2022) measure high velocity dispersion in the clumps detected in [CII] in the merging DSFG SPT0311-58. This also suggests very massive clumps under the assumption that the measured velocity dispersion is driven by gravitational motions. Higher spatial resolution observations might well break the observed clumps down in several sub-clumps (e.g. Messa et al., 2022; Meštrić et al., 2022), making the measured velocity dispersion only upper limits.
Additionally, merging galaxies trigger strong starburst resulting in the formation of clumps. (U)LIRGs in the local universe show clumpy star formation. Piqueras-López et al. (2016) finds clumps in Pa in local (U)LIRGs of sizes between 300 pc and 1500 pc in the ULIRGs and a bit smaller in the LIRGs, while Larson et al. (2020) find Pa clumps in local LIRGs and find sizes between 90 and 900 pc.
5.3 Nature of the UV-bright region
The HST images of GN20 (Fig. 4) reveal a UV-bright elongated structure west of the center of the galaxy. It is detected in HST images, from F606W (rest-frame 0.12m) to F160W (rest-frame 0.32m). Also in the MIRI F560W image the arm is visible (Colina et al., 2023). The convolved F560W image reveals 4-5 clumps associated with the UV-bright emission. This arm is not detected in CO, 880m and Pa. The fact that this region is detected in the UV would suggest low extinction. However, UV-bright would also imply a young stellar population, and therefore we would expect Pa from this low extinction, young region in GN20.
Based on fitting of the observed UV to the radio spectral energy distribution (SED) of GN20, Tan et al. (2014) find an SFRIR/SFRUV of 13, this would lead to an SFRUV of 140 M⊙ yr-1. However, the UV emission only traces a small piece of the galaxy, therefore we reanalyze the HST data, by measuring the integrated flux with an elliptical aperture of 1 arcsec2 in size, matching the size and morphology of the UV-bright emission (1.6″0.8″, PA: 0°).
Under the assumption of no extinction we calculate the SFRUV from the measured F814W flux using the relation detailed by Murphy et al. (2011) and find SFRUV= 15 2 M⊙ yr-1. As a next step we perform a fit using CIGALE (Burgarella et al., 2005; Noll et al., 2009; Boquien et al., 2019) to the integrated UV-optical SED as seen by HST. We use a Chabrier (2003) IMF with a Calzetti et al. (2000) extinction law and model the SED with two stellar populations; a young population ( 40 Myr) with constant star formation history and a older single stellar population between 100 - 500 Myr. For the young stellar population (relevant for the UV emission) we find a SFR = 135 70 M⊙ yr-1 and an extinction of AV = 0.8 magnitudes.
Next, we measure the flux of the UV-bright region in the MIRI F560W (Colina et al., 2023) and F770W (Crespo Gómez et al, in prep) with the same aperture as for the HST images. We measure the flux in the images with the 2 component Lenstronomy (Birrer & Amara, 2018) fit removed (see Colina et al., 2023, for details). Repeating the CIGALE fit with the two extra MIRI points gives a similar SFR = 160 100 M⊙ yr-1 for the young population, with a similar extinction as the previous fit.
Based on the standard deviation derived for the Pa image (Sect. 4.2) we derive a 3 detection limit of 2.5 M⊙ yr-1per pixel. Assuming a constant spatial distribution and an MRS pixel size of 0.029 arcsec2 gives a 3 upper limit of 15 M⊙ yr-1 for a 1 arcsec2 aperture. This Pa upper limit is consistent with the directly measured SFRUV, but only under the assumption of no extinction. The CIGALE fits show a significant extinction of AV = 0.8 magnitudes, increasing the SFRUV significantly. Under the assumption of the AV = 0.8, the UV derived star formation rate would increase to 43 M⊙ yr-1.
In summary, Pa traces the star formation over the last 10 Myr in GN20, while the star formation traced by the UV emission is sensitive to the last 100 Myr (Murphy et al., 2011; Kennicutt & Evans, 2012). The derived SFR values are consistent with a stellar population older than 10 Myr and younger than 100 Myr, such that it results in a bright UV region without strong ionized gas emission.
This is comparable with what is observed in the local LIRG galaxy NGC 1640 (Adamo et al., 2020), where very little H emission is detected towards a UV-bright arm. Adamo et al. (2020) find a cluster population in this arm of 20-30 Myr. This population still contributes strongly to the UV flux, but is too old for significant production of ionizing photons.
5.4 What triggered the starburst in GN20?
The properties of GN20 give a mixed message on what mechanism is at play for driving the current high star formation rates. The extremely obscured nucleus with extinctions similar to the most extreme ULIRG galaxies (Sect. 5.1), the very efficient star formation (Hodge et al., 2015) and the double nucleus found in GN20 (Colina et al., 2023) would make GN20 similar to nearby ULIRG galaxies and thus would suggest that the star formation is driven by interactions. In this scenario, the star forming clumps would then be a byproduct of the merger process as seen in local merging (U)LIRGs (e.g. Pereira-Santaella et al., 2016; Piqueras-López et al., 2016; Adamo et al., 2020).
On the other hand, our Pa observations as well as the CO emission (Hodge et al., 2012) show that the star formation happens over a much larger spatial extent than ULIRG galaxies (Hodge et al., 2016; Bellocchi et al., 2022), and covers the entire observed disk of GN20. Additionally the kinematics of both the CO and Pa are consistent with a rotationally supported, gas-rich disk. These observations would hint that GN20 is a disk galaxy whose star formation is fuelled by accretion of neutral gas from intergalactic matter, where the clumps would form in the gas rich disk by violent disk instabilities (Dekel et al., 2009b; Ceverino et al., 2010; Inoue et al., 2015).
These clumps could then migrate further into the center of the galaxy due to dynamical friction over timescales of several hundred Myr (e.g. Mandelker et al., 2014) and contribute to the formation of the thick disk and the bulge growth (Elmegreen et al., 2008, 2009a; Ceverino et al., 2010). Observations of individual galaxies support this scenario by finding trends between galactocentric distance and age of the clumps (Adamo et al., 2013; Cava et al., 2018). The Pa clumps in GN20 are located a few kpc from the center and this could indicate that GN20 is in the process of building up the inner disk and bulge. A multi-wavelength analysis of all the clumps in GN20 with future NIRCAM imaging will enable us to constrain the ages and search for trends with galactocentric distance.
6 Conclusions
We present deep MIRI/MRS spectroscopy of Pa and Pa of the dusty star forming galaxy GN20 at z=4.0548. We detect for the first time ionized gas Pa emission out to a radius of 6 kpc, distributed in a clumpy morphology. The Pa line is not detected. From the integrated Pa flux we derive a SFRPaα = 144 9 M⊙ yr-1, assuming no extinction. The SFRPaα is only a small fraction of the SFRIR (7.7 0.5 %, Tan et al., 2014). We attribute this difference as due to the high extinction in GN20, especially in the central starburst and find an average extinction of AV = 17.2 0.4 mag. Such high values are also measured in the nearby ULIRGs Arp220 and UGC 5105.
We detect four spatially unresolved clumps in the Pa emission line map. By studying their Pa emission profile we find that each clump consists of at least two sub-clumps. These sub-clumps are also identified in the convolved F560W image. Their velocity dispersions are in the same range as measured for the CO clumps (Hodge et al., 2012). The CO clumps are located more in the central region of GN20.
We construct a Pa rotational profile and find it broadly consistent with the CO kinematics (Hodge et al., 2012). Within the spatial resolution of the Pa observations (2.5 kpc) the kinematics is consistent with that of a rotationally dominated disk galaxy. This suggests that star formation is driven by gravitational instabilities in the gas rich galactic disk. The observed differences between the rotation curves could be related to the differences in spatial distribution between the CO and Pa emission.
We do not detect any Pa emission towards the UV-bright emission of GN20 as seen in HST imaging. Based on the SED fitting and the Pa upper limit, we conclude that this region is older than 10 Myr, where the stellar population is still bright in the UV but does not produce significant LyC radiation anymore.
Finally, we speculate on what drives the high SFR in GN20 and conclude that the formation of clumps and stars is most likely driven by gravitational instabilities in a gas rich disk and GN20 could be in the stage of building up the inner disk and forming the bulge.
Acknowledgements.
The authors thank Jacqueline Hodge for providing the CO(2-1) data cube and moment maps. A.B. thanks Angela Adamo and Sean Linden for discussions on clumps and ULIRGs. A.B., J.M. and G.Ö. acknowledge support from the Swedish National Space Administration (SNSA). L.C, J.A-M. and A.C.G. acknowledge support by grant PIB2021-127718NB-100 from the Spanish Ministry of Science and Innovation/State Agency of Research MCIN/AEI/10.13039/501100011033 and by “ERDF A way of making Europe”. F.P. and A.E. acknowledge support through the German Space Agency DLR 50OS1501 and DLR 50OS2001 from 2015 to 2023. K.I.C and E.I. acknowledge funding from the Netherlands Research School for Astronomy (NOVA). K.I.C. acknowledges funding from the Dutch Research Council (NWO) through the award of the Vici Grant VI.C.212.036. A.A.H. acknowledges support from grant PID2021-124665NB-I00 funded by MCIN/AEI/10.13039/501100011033 and by ERDF A way of making Europe. S.G. acknowledges financial support from the Villum Young Investigator grant 37440 and 13160 and the Cosmic Dawn Center (DAWN). The Cosmic Dawn Center (DAWN) is funded by the Danish National Research Foundation under grant No. 140. T.R.G. is grateful for support from the Carlsberg Foundation via grant No. CF20-0534 J.P.P. and T.T. acknowledge financial support from the UK Science and Technology Facilities Council, and the UK Space Agency. J.H and D.L. were supported by a VILLUM FONDEN Investigator grant (project number 16599) P.G.P.-G. acknowledges support from grant PID2022-139567NB-I00 funded by Spanish Ministerio de Ciencia e Innovación MCIN/AEI/10.13039/501100011033, FEDER, UE. P.-O.L. acknowledges financial support from CNES T.R. acknowledges support from ERC grant no. 743029 (EASY). The work presented is the effort of the entire MIRI team and the enthusiasm within the MIRI partnership is a significant factor in its success. MIRI draws on the scientific and technical expertise of the following organisations: Ames Research Center, USA; Airbus Defence and Space, UK; CEA-Irfu, Saclay, France; Centre Spatial de Liége, Belgium; Consejo Superior de Investigaciones Científicas, Spain; Carl Zeiss Optronics, Germany; Chalmers University of Technology, Sweden; Cosmic Dawn Center (DAWN), DTU Space, Technical University of Denmark, Denmark; Dublin Institute for Advanced Studies, Ireland; European Space Agency, Netherlands; ETCA, Belgium; ETH Zurich, Switzerland; Goddard Space Flight Center, USA; Institute d’Astrophysique Spatiale, France; Instituto Nacional de Técnica Aeroespacial, Spain; Institute for Astronomy, Edinburgh, UK; Jet Propulsion Laboratory, USA; Laboratoire d’Astrophysique de Marseille (LAM), France; Leiden University, Netherlands; Lockheed Advanced Technology Center (USA); NOVA Opt-IR group at Dwingeloo, Netherlands; Northrop Grumman, USA; Max-Planck Institut für Astronomie (MPIA), Heidelberg, Germany; Laboratoire d’Etudes Spatiales et d’Instrumentation en Astrophysique (LESIA), France; Paul Scherrer Institut, Switzerland; Raytheon Vision Systems, USA; RUAG Aerospace, Switzerland; Rutherford Appleton Laboratory (RAL Space), UK; Space Telescope Science Institute, USA; Toegepast- Natuurwetenschappelijk Onderzoek (TNO-TPD), Netherlands; UK Astronomy Technology Centre, UK; University College London, UK; University of Amsterdam, Netherlands; University of Arizona, USA; University of Cardiff, UK; University of Cologne, Germany; University of Ghent; University of Groningen, Netherlands; University of Leicester, UK; University of Leuven, Belgium; University of Stockholm, Sweden; Utah State University, USA. A portion of this work was carried out at the Jet Propulsion Laboratory, California Institute of Technology, under a contract with the National Aeronautics and Space Administration. We would like to thank the following National and International Funding Agencies for their support of the MIRI development: NASA; ESA; Belgian Science Policy Office; Centre Nationale D’Etudes Spatiales (CNES); Danish National Space Centre; Deutsches Zentrum fur Luft-und Raumfahrt (DLR); Enterprise Ireland; Ministerio De Economía y Competitividad; Netherlands Research School for Astronomy (NOVA); Netherlands Organisation for Scientific Research (NWO); Science and Technology Facilities Council; Swiss Space Office; Swedish National Space Board; UK Space Agency. This work is based on observations made with the NASA/ESA/CSA James Webb Space Telescope. Some data were obtained from the Mikulski Archive for Space Telescopes at the Space Telescope Science Institute, which is operated by the Association of Universities for Research in Astronomy, Inc., under NASA contract NAS 5-03127 for JWST; and from the European JWST archive (eJWST) operated by the ESDC.References
- Aalto et al. (2015) Aalto, S., Martín, S., Costagliola, F., et al. 2015, A&A, 584, A42
- Adamo et al. (2020) Adamo, A., Hollyhead, K., Messa, M., et al. 2020, MNRAS, 499, 3267
- Adamo et al. (2013) Adamo, A., Östlin, G., Bastian, N., et al. 2013, ApJ, 766, 105
- Akins et al. (2023) Akins, H. B., Casey, C. M., Allen, N., et al. 2023, ApJ, 956, 61
- Algera et al. (2022) Algera, H. S. B., Inami, H., Oesch, P. A., et al. 2022, MNRAS, 518, 6142
- Alonso-Herrero et al. (2006) Alonso-Herrero, A., Rieke, G. H., Rieke, M. J., et al. 2006, ApJ, 650, 835
- Argyriou et al. (2023) Argyriou, I., Glasse, A., Law, D. R., et al. 2023, arXiv [2303.13469]
- Arribas et al. (2014) Arribas, S., Colina, L., Bellocchi, E., Maiolino, R., & Villar-Martín, M. 2014, A&A, 568, A14
- Barrufet et al. (2023a) Barrufet, L., Oesch, P. A., Bouwens, R., et al. 2023a, MNRAS, 522, 3926
- Barrufet et al. (2023b) Barrufet, L., Oesch, P. A., Weibel, A., et al. 2023b, MNRAS, 522, 449
- Bellocchi et al. (2013) Bellocchi, E., Arribas, S., Colina, L., & Miralles-Caballero, D. 2013, A&A, 557, A59
- Bellocchi et al. (2022) Bellocchi, E., Pereira-Santaella, M., Colina, L., et al. 2022, A&A, 664, A60
- Bik et al. (2022) Bik, A., Östlin, G., Hayes, M., Melinder, J., & Menacho, V. 2022, A&A, 666, A161
- Birrer & Amara (2018) Birrer, S. & Amara, A. 2018, Physics of the Dark Universe, 22, 189
- Blecha et al. (2018) Blecha, L., Snyder, G. F., Satyapal, S., & Ellison, S. L. 2018, MNRAS, 478, 3056
- Bohn et al. (2023) Bohn, T., Inami, H., Diaz-Santos, T., et al. 2023, ApJ, 942, L36
- Boquien et al. (2019) Boquien, M., Burgarella, D., Roehlly, Y., et al. 2019, A&A, 622, A103
- Borys et al. (2003) Borys, C., Chapman, S., Halpern, M., & Scott, D. 2003, MNRAS, 344, 385
- Bosman et al. (2023) Bosman, S. E. I., Álvarez Márquez, J., Colina, L., et al. 2023, arXiv [2307.14414]
- Bouwens et al. (2022) Bouwens, R. J., Illingworth, G., Ellis, R. S., Oesch, P., & Stefanon, M. 2022, ApJ, 940, 55
- Bouwens et al. (2021) Bouwens, R. J., Oesch, P. A., Stefanon, M., et al. 2021, AJ, 162, 47
- Bradley (2023) Bradley, L. 2023, astropy/photutils: 1.8.0
- Burgarella et al. (2005) Burgarella, D., Buat, V., & Iglesias‐Páramo, J. 2005, MNRAS, 360, 1413
- Bushouse et al. (2023) Bushouse, H., Eisenhamer, J., Dencheva, N., et al. 2023, spacetelescope/jwst: JWST 1.9.4
- Calabrò et al. (2018) Calabrò, A., Daddi, E., Cassata, P., et al. 2018, ApJ, 862, L22
- Calzetti et al. (2000) Calzetti, D., Armus, L., Bohlin, R. C., et al. 2000, ApJ, 533, 682
- Caputi et al. (2017) Caputi, K. I., Deshmukh, S., Ashby, M. L. N., et al. 2017, ApJ, 849, 45
- Cardelli et al. (1989) Cardelli, J. A., Clayton, G. C., & Mathis, J. S. 1989, ApJ, 345, 245
- Carilli et al. (2011) Carilli, C. L., Hodge, J., Walter, F., et al. 2011, ApJ, 739, L33
- Casey et al. (2014) Casey, C. M., Narayanan, D., & Cooray, A. 2014, Physics Reports, 541, 45
- Cava et al. (2018) Cava, A., Schaerer, D., Richard, J., et al. 2018, Nature Astronomy, 2, 76
- Ceverino et al. (2010) Ceverino, D., Dekel, A., & Bournaud, F. 2010, MNRAS, 404, 2151
- Chabrier (2003) Chabrier, G. 2003, PASP, 115, 763
- Chomiuk & Povich (2011) Chomiuk, L. & Povich, M. S. 2011, AJ, 142, 197
- Cochrane et al. (2023) Cochrane, R. K., Anglés-Alcázar, D., Cullen, F., & Hayward, C. C. 2023, arXiv [2310.08829]
- Colina et al. (2023) Colina, L., Gómez, A. C., Álvarez Márquez, J., et al. 2023, A&A
- Daddi et al. (2009) Daddi, E., Dannerbauer, H., Stern, D., et al. 2009, ApJ, 694, 1517
- Dekel et al. (2009a) Dekel, A., Birnboim, Y., Engel, G., et al. 2009a, Nature, 457, 451
- Dekel et al. (2009b) Dekel, A., Sari, R., & Ceverino, D. 2009b, ApJ, 703, 785
- Dessauges-Zavadsky & Adamo (2018) Dessauges-Zavadsky, M. & Adamo, A. 2018, Monthly Notices of the Royal Astronomical Society: Letters, 479, L118
- Donnan et al. (2023) Donnan, F. R., Rigopoulou, D., García-Bernete, I., et al. 2023, ApJ, 669, A87
- Drake et al. (2020) Drake, A. B., Walter, F., Novak, M., et al. 2020, ApJ, 902, 37
- Elmegreen et al. (2008) Elmegreen, B. G., Bournaud, F., & Elmegreen, D. M. 2008, ApJ, 688, 67
- Elmegreen et al. (2009a) Elmegreen, B. G., Elmegreen, D. M., Fernandez, M. X., & Lemonias, J. J. 2009a, ApJ, 692, 12
- Elmegreen et al. (2009b) Elmegreen, D. M., Elmegreen, B. G., Marcus, M. T., et al. 2009b, ApJ, 701, 306
- Engel et al. (2011) Engel, H., Davies, R. I., Genzel, R., et al. 2011, ApJ, 729, 58
- Finkelstein et al. (2023) Finkelstein, S. L., Leung, G. C. K., Bagley, M. B., et al. 2023, arXiv [2311.04279]
- Förster-Schreiber et al. (2009) Förster-Schreiber, N. M., Genzel, R., Bouché, N., et al. 2009, ApJ, 706, 1364
- Förster-Schreiber & Wuyts (2020) Förster-Schreiber, N. M. & Wuyts, S. 2020, ARA&A, 58, annurev
- Gaia Collaboration et al. (2023) Gaia Collaboration, Vallenari, A., Brown, A. G. A., et al. 2023, A&A, 674, A1
- Gasman et al. (2023) Gasman, D., Argyriou, I., Sloan, G. C., et al. 2023, A&A, 673, A102
- Genzel et al. (2008) Genzel, R., Burkert, A., Bouché, N., et al. 2008, ApJ, 687, 59
- Gillman et al. (2023) Gillman, S., Gullberg, B., Brammer, G., et al. 2023, A&A, 676, 26
- Giménez-Arteaga et al. (2022) Giménez-Arteaga, C., Brammer, G. B., Marchesini, D., et al. 2022, ApJS, 263, 17
- Ginolfi et al. (2020) Ginolfi, M., Jones, G. C., Béthermin, M., et al. 2020, A&A, 643, A7
- Girard et al. (2018) Girard, M., Dessauges-Zavadsky, M., Schaerer, D., et al. 2018, A&A, 613, A72
- Glazebrook (2013) Glazebrook, K. 2013, PASA, 30, 7
- Gruppioni et al. (2020) Gruppioni, C., Béthermin, M., Loiacono, F., et al. 2020, A&A, 643, A8
- Gruppioni et al. (2013) Gruppioni, C., Pozzi, F., Rodighiero, G., et al. 2013, MNRAS, 432, 23
- Gómez-Guijarro et al. (2023) Gómez-Guijarro, C., Magnelli, B., Elbaz, D., et al. 2023, A&A, 677, A34
- Gómez-Guijarro et al. (2018) Gómez-Guijarro, C., Toft, S., Karim, A., et al. 2018, ApJ, 856, 121
- Haas et al. (2001) Haas, M., Klaas, U., Müller, S. A. H., Chini, R., & Coulson, I. 2001, A&A, 367, L9
- Hodge et al. (2012) Hodge, J. A., Carilli, C. L., Walter, F., et al. 2012, ApJ, 760, 11
- Hodge et al. (2015) Hodge, J. A., Riechers, D., Decarli, R., et al. 2015, ApJ, 798, L18
- Hodge et al. (2016) Hodge, J. A., Swinbank, A. M., Simpson, J. M., et al. 2016, ApJ, 833, 103
- Hughes et al. (1998) Hughes, D. H., Serjeant, S., Dunlop, J., et al. 1998, Nature, 394, 241
- Inoue et al. (2015) Inoue, S., Dekel, A., Mandelker, N., et al. 2015, MNRAS, 456, 2052
- Jones et al. (2023) Jones, O. C., Álvarez Márquez, J., Sloan, G. C., et al. 2023, arXiv [2301.13233]
- Kennicutt & Evans (2012) Kennicutt, R. C. & Evans, N. J. 2012, ARA&A, 50, 531
- Kroupa (2001) Kroupa, P. 2001, MNRAS, 322, 231
- Krumholz et al. (2018) Krumholz, M. R., Burkhart, B., Forbes, J. C., & Crocker, R. M. 2018, MNRAS, 477, 2716
- Labiano et al. (2021) Labiano, A., Argyriou, I., Álvarez Márquez, J., et al. 2021, A&A, 656, A57
- Larson et al. (2020) Larson, K. L., Díaz-Santos, T., Armus, L., et al. 2020, ApJ, 888, 92
- Law et al. (2023) Law, D. R., Morrison, J. E., Argyriou, I., et al. 2023, AJ, 166, 45
- Law et al. (2009) Law, D. R., Steidel, C. C., Erb, D. K., et al. 2009, ApJ, 697, 2057
- Livermore et al. (2012) Livermore, R. C., Jones, T., Richard, J., et al. 2012, MNRAS, 427, 688
- Lucy (1974) Lucy, L. B. 1974, AJ, 79, 745
- Mandelker et al. (2014) Mandelker, N., Dekel, A., Ceverino, D., et al. 2014, MNRAS, 443, 3675
- Messa et al. (2022) Messa, M., Dessauges-Zavadsky, M., Richard, J., et al. 2022, MNRAS, 516, 2420
- Meštrić et al. (2022) Meštrić, U., Vanzella, E., Zanella, A., et al. 2022, MNRAS, 516, 3532
- Morrison et al. (2023) Morrison, J. E., Dicken, D., Argyriou, I., et al. 2023, PASP, 135, 075004
- Murphy et al. (2011) Murphy, E. J., Condon, J. J., Schinnerer, E., et al. 2011, ApJ, 737, 67
- Noll et al. (2009) Noll, S., Burgarella, D., Giovannoli, E., et al. 2009, A&A, 507, 1793
- Osterbrock & Ferland (2006) Osterbrock, D. E. & Ferland, G. J. 2006, Astrophysics of gaseous nebulae and active galactic nuclei (Astrophysics of gaseous nebulae and active galactic nuclei, 2nd. ed. by D.E. Osterbrock and G.J. Ferland. Sausalito, CA: University Science Books, 2006)
- Parlanti et al. (2023) Parlanti, E., Carniani, S., Übler, H., et al. 2023, arXiv e-prints, arXiv:2309.05713
- Patapis et al. (2023) Patapis, P., Argyriou, I., Law, D. R., et al. 2023, arXiv, arXiv:2307.01025
- Peißker et al. (2022) Peißker, F., Eckart, A., Zajaček, M., & Britzen, S. 2022, ApJ, 933, 49
- Pereira-Santaella et al. (2016) Pereira-Santaella, M., Colina, L., García-Burillo, S., et al. 2016, A&A, 587, A44
- Piqueras-López et al. (2013) Piqueras-López, J., Colina, L., Arribas, S., & Alonso-Herrero, A. 2013, A&A, 553, A85
- Piqueras-López et al. (2016) Piqueras-López, J., Colina, L., Arribas, S., Pereira-Santaella, M., & Alonso-Herrero, A. 2016, A&A, 590, A67
- Planck Collaboration et al. (2016) Planck Collaboration, Ade, P. A. R., Aghanim, N., et al. 2016, A&A, 594, A13
- Pope et al. (2006) Pope, A., Scott, D., Dickinson, M., et al. 2006, MNRAS, 370, 1185
- Pérez-González et al. (2023a) Pérez-González, P. G., Barro, G., Annunziatella, M., et al. 2023a, ApJ, 946, L16
- Pérez-González et al. (2023b) Pérez-González, P. G., Costantin, L., Langeroodi, D., et al. 2023b, ApJ, 951, L1
- Pérez-González et al. (2005) Pérez-González, P. G., Rieke, G. H., Egami, E., et al. 2005, ApJ, 630, 82
- Ricci et al. (2017) Ricci, C., Bauer, F. E., Treister, E., et al. 2017, MNRAS, stx173
- Riechers et al. (2020) Riechers, D. A., Hodge, J. A., Pavesi, R., et al. 2020, ApJ, 895, 81
- Riechers et al. (2014) Riechers, D. A., Pope, A., Daddi, E., et al. 2014, ApJ, 786, 31
- Rieke et al. (2015) Rieke, G. H., Wright, G. S., Böker, T., et al. 2015, PASP, 127, 584
- Rizzo et al. (2021) Rizzo, F., Vegetti, S., Fraternali, F., Stacey, H. R., & Powell, D. 2021, MNRAS, 507, 3952
- Schreiber et al. (2011) Schreiber, N. M. F., Shapley, A. E., Genzel, R., et al. 2011, ApJ, 739, 45
- Speagle et al. (2014) Speagle, J. S., Steinhardt, C. L., Capak, P. L., & Silverman, J. D. 2014, ApJS, 214, 15
- Spilker et al. (2022) Spilker, J. S., Hayward, C. C., Marrone, D. P., et al. 2022, ApJ, 929, L3
- Spilker et al. (2023) Spilker, J. S., Phadke, K. A., Aravena, M., et al. 2023, Nature, 618, 708
- Sturm et al. (1996) Sturm, E., Lutz, D., Genzel, R., et al. 1996, A&A, 315, L133
- Sánchez-García et al. (2022) Sánchez-García, M., Pereira-Santaella, M., García-Burillo, S., et al. 2022, A&A, 659, A102
- Tan et al. (2014) Tan, Q., Daddi, E., Magdis, G., et al. 2014, A&A, 569, A98
- Tateuchi et al. (2015) Tateuchi, K., Konishi, M., Motohara, K., et al. 2015, ApJS, 217, 1
- Valentino et al. (2020) Valentino, F., Tanaka, M., Davidzon, I., et al. 2020, ApJ, 889, 93
- Vieira et al. (2013) Vieira, J. D., Marrone, D. P., Chapman, S. C., et al. 2013, Nature, 495, 344
- Wells et al. (2015) Wells, M., Pel, J.-W., Glasse, A., et al. 2015, PASP, 127, 646
- Wright et al. (2023) Wright, G. S., Rieke, G. H., Glasse, A., et al. 2023, PASP, 135, 048003
- Wright et al. (2015) Wright, G. S., Wright, D., Goodson, G. B., et al. 2015, PASP, 127, 595
- Zavala et al. (2023) Zavala, J. A., Buat, V., Casey, C. M., et al. 2023, ApJ, 943, L9
- Zavala et al. (2021) Zavala, J. A., Casey, C. M., Manning, S. M., et al. 2021, ApJ, 909, 165
- Álvarez Márquez et al. (2023a) Álvarez Márquez, J., Colina, L., Gómez, A. C., et al. 2023a, arXiv, arXiv:2309.06319
- Álvarez Márquez et al. (2023b) Álvarez Márquez, J., Gómez, A. C., Colina, L., et al. 2023b, A&A, 671, A105