Resolved properties of classical bulge and pseudo-bulge galaxies
Abstract
We compare properties of classical and pseudo-bulges and properties of their hosting galaxies selected from the MaNGA survey. Bulge types are identified based on the Srsic index n of bulge component and the position of bulges on the Kormandy diagram. For the 393 classical bulges and 422 pseudo-bulges selected and their hosting galaxies, we study their kinematic properties including a proxy for specific angular momentum and central velocity dispersion, their stellar population properties including stellar age, metallicity, and specific star formation rate, as well as HI fractions of the galaxies. Our results show that at given stellar mass, disc components of pseudo-bulge galaxies are younger, have more active star formation, rotate more, and may contain more HI content compared with those of classical bulge galaxies, and the differences are larger than those between bulges themselves. The correlations between bulge types and disc properties indicate that different types of bulges are shaped by different processes that may regulate both growth of central components and evolution of outer discs in galaxies. In addition, we propose a stellar mass dependent divider of central velocity dispersion to separate galaxies with classical bulges from those with pseudo-bulges in galaxy mass range of : . Galaxies with larger/smaller can be classified as hosts of classical/pseudo-bulges.
keywords:
galaxies: bulges – galaxies: evolution – galaxies: formation1 Introduction
A galactic bulge is a central component that exists commonly in a spiral galaxy, and has more concentrated light and stars than the disc component that extends to a larger radius (Sandage, 1961). Observations indicate that there are two main categories of bulges: classical bulges and pseudo-bulges. Typical classical bulges are considered to be analogous to elliptical galaxies, being random motion dominated and following the fundamental plane (Fisher & Drory, 2016). On the other hand, pseudo-bulges resemble spiral galaxies that are rotation dominated, and typically have substructures such as nuclear bars, spiral arms, and inner rings (Carollo et al., 1997; Erwin & Sparke, 2002; Knapen, 2005; Fisher & Drory, 2011). Compared with classical bulges, pseudo-bulges are in general bluer in color, and have more active star formation activities (Drory & Fisher, 2007; Fabricius et al., 2012; Sachdeva et al., 2020).
Theoretically, classical bulges are thought to form through violent processes such as clumpy collapse (Noguchi, 1999; Elmegreen et al., 2008; Inoue & Saitoh, 2012) and galaxy merger (Aguerri et al., 2001; Hammer et al., 2005), while pseudo-bulges are considered to be shaped slowly by secular evolution (Courteau et al., 1996; Kormendy & Kennicutt, 2004; Athanassoula, 2005), such as mild gas inflow and stellar inward migration induced by bar or spiral arm (Scannapieco et al., 2010; Bird et al., 2012; Guedes et al., 2013; Grand et al., 2014; Halle et al., 2015; Combes, 2020; Gargiulo et al., 2022). Nevertheless, detailed studies of bulge formation indicate a more complicated picture, both from simulation / semi-empirical models (Hopkins et al., 2010; Guedes et al., 2013; Querejeta et al., 2015; Sauvaget et al., 2018; Fragkoudi et al., 2016), and from observation (Genzel et al., 2008; Eliche-Moral et al., 2013; Laurikainen & Salo, 2016).
If different properties of bulges are indeed determined by various formation processes, for example violent mergers or long-term effects, galaxies hosting them should have different properties. Efforts have been made in this direction for galaxies in the local Universe. For example, Wang et al. (2019) found that pseudo-bulge galaxies and low mass classical bulge galaxies have more close neighbour galaxies when compared to control galaxies, implying strong connections between galactic bulges and galaxy–galaxy interactions. Yu et al. (2022) found that galaxies with stronger spiral arms tend to have an increasing fraction of pseudo-bulges, which suggests that spiral arms play a role in the secular buildup of pseudo-bulges.
With the help of integral-field spectroscopic surveys such as CALIFA (Sánchez et al., 2012) and MaNGA (Bundy et al., 2015), spatially resolved properties for galaxies with bulges have been studied. For example, Fraser-McKelvie et al. (2018) and Johnston et al. (2022b) investigate age and metallicity of stellar populations in bulge and disc components of S0 galaxies in MaNGA. Johnston et al. (2022a) studied the age of two-component galaxies in the MaNGA survey. In these studies, bulges are found to have similar or larger age and metallicity than discs. Breda & Papaderos (2023) studied spatially resolved star formation history and properties of stellar population including colour, age and metallicity, of 135 late-type galaxies in CALIFA. They claimed that pseudo and classical bulges form a continuous sequence and are not entirely different populations.
In this work, in order to investigate further the formation mechanism of bulges, we study the difference between properties of classical and pseudo-bulges, as well as the difference between properties of their host galaxies. Based on the large sample of MaNGA survey (10,000 galaxies), we are able to select galaxies with different types of galactic bulges, which include enough numbers to be compared statistically. Apart from the general properties of bulges and galaxies, spatially resolved kinematic and stellar population properties are studied, and radial profiles of these properties are presented, to reveal the differences in more detail.
This paper is organized as follows. Section 2 introduces the MaNGA data and how we select galaxies with different types of bulges from a decomposition catalog based on it. Section 3 studies and compares the kinematic properties of bulges and galaxies, focusing on the index of that indicates a proxy for the specific angular momentum of a system, as well as central velocity dispersion . Section 4 studies properties of stellar population including age, metallicity and specific star formation rate (sSFR), for both bulge component and the whole galaxy. Conclusions and discussions are presented in Section 5.
2 Sample selection
For MaNGA galaxies, based on the decomposition catalogue of Domínguez Sánchez et al. (2022), we select galaxies with classical bulge and pseudo-bulge by criteria of the bulge Srsic index combined with position of bulges on the Kormendy diagram (Gadotti, 2009).
2.1 MaNGA galaxies
The Mapping Nearby Galaxies at Apache Point Observatory (MaNGA, Bundy et al., 2015) is an integral field spectroscopic survey based on the 2.5-meter telescope at the Apache Point Observatory (Gunn et al., 2006), which is one of the three main projects in the fourth-generation Sloan Digital Sky Survey (SDSS, Blanton et al., 2017). Using fiber bundles, the MaNGA survey provided spatially resolved spectra for 10,000 galaxies with a wide distribution of stellar masses and colour, covering redshifts in the range of 0.01 < z < 0.15 (Yan et al., 2016; Wake et al., 2017).
In this work, we make use of the two-dimensional stellar kinematics (i.e. the maps of stellar velocity and stellar velocity dispersion) provided by the Data Analysis Pipeline (DAP, Westfall et al., 2019), which are derived using the ppxf (Cappellari & Emsellem, 2004; Cappellari, 2017, 2023) software combined with the mastar stellar library (Yan et al., 2019). To ensure that the measured stellar velocity dispersion are reliable, the IFU spectra had been Voronoi binned (Cappellari & Copin, 2003) to reach before spectra fitting (Wake et al., 2017). Specifically, the stellar velocity dispersion used in this work has been corrected for the instrumental velocity dispersion.
In the final release of MaNGA (SDSS DR17, Abdurro’uf et al., 2022), DAP includes 10782 sources, among which 637 sources are Coma, IC342, M31, globular clusters and other non-galactic sources, and 135 sources have been observed repeatedly. The remaining 10,010 galaxies are defined as unique (with the unique MaNGA-ID). We have checked that there are still 9 pairs of identical sources with different MaNGA-IDs and we keep only one of them. In the end, 10,001 galaxies are unique in MaNGA. Of the 10,001 galaxies selected above, 5 failed to be Voronoi binned, and our following analysis is based on the rest 9996 galaxies.
2.2 Decomposition catalogue and two-component galaxies
Srsic index criterion (Kormendy & Kennicutt, 2004; Fisher & Drory, 2008) is commonly used to select classical bulge and pseudo-bulge, and the result relies on the robustness of photometric decomposition of bulge and disc components. For MaNGA galaxies, several decomposition catalogues are available, as presented by Simard et al. (2011) and Meert et al. (2015) which give results for larger samples of SDSS galaxies, and by Domínguez Sánchez et al. (2022) for MaNGA galaxies in particular.
We have compared the decomposition results from these three catalogues in detail, and choose the one provided by Domínguez Sánchez et al. (2022), the MaNGA PyMorph photometric Value Added Catalogue (hereafter MPP-VAC-DR17), to identify two-component galaxies and further different bulge types. Simard et al. (2011) overestimates sky background of galaxies with large size (Meert et al., 2015), which affects their decomposition results and bulge type identification. Meert et al. (2015) and Domínguez Sánchez et al. (2022) both use analysis pipeline PYMORPH (Vikram et al., 2010) and obtain similar results for most galaxies. We choose the latter for several reasons. First, the catalogue of Meert et al. (2015) only includes 85% of MaNGA galaxies, while MPP-VAC-DR17 includes 99.8%. Second, MPP-VAC-DR17 performed extra refit of galaxies that were not fitted well. Besides, we have inspected the images of MaNGA galaxies and find that galaxies defined as two-component galaxies in MPP-VAC-DR17 indeed exhibit bright centrals. Therefore MPP-VAC-DR17 is believed to provide more robust results for selecting two-component galaxies. Out of the 9,996 galaxies selected in §2.1, 9975 galaxies are included in MPP-VAC-DR17.
Following the method of Fischer et al. (2019), the MPP-VAC-DR17 performed two-dimensional fits for each MaNGA galaxy image in the g-, r-, and i-bands respectively using two models: a single Srsic profile (Sérsic, 1963), and a two-component model consisting of a Srsic profile for the bulge and an exponential profile for the disc. In the catalogue, a visual-inspection-based flagging system gives a parameter FLAG_FIT to evaluate which model is to be preferred for scientific analyses. Galaxies that are identified as single-component galaxies have FLAG_FIT=1 and galaxies with disc+bulge components have FLAG_FIT=2.
There are 3170 galaxies with FLAG_FIT=2 for r-band image in the MPP-VAC-DR17. We have checked further the decomposition results for these galaxies in detail, and exclude some of the galaxies that may not be fitted reasonably, in order to get a more robust sample. Firstly, 51 galaxies have larger bulge components than disc components, with larger effective radius for bulge than for disc. Secondly, 682 galaxies have bulges with effective radius smaller than the half-width at half-maximum (HWHM) of point spread function (PSF) of SDSS images (0.75), which can not be identified clearly (Gadotti, 2009). Finally, 2437 bulge+disk galaxies are selected to be analysed in this work.
In addition, we also select elliptical galaxies in the MPP-VAC-DR17, to set Kormendy relation criterion for identifying bulge types in the coming subsection. 1698 galaxies that are signal-component galaxies with FLAG_FIT=1 in r-band have large Srsic index (). Domínguez Sánchez et al. (2022) also provides galaxy morphology results of machine learning (the MaNGA Deep Learning Morphological Value Added Catalogue). According to this catalogue, we select elliptical galaxies to be early-type with and have a low probability of being S0 galaxy(), to get a further constrain. All combined, 1293 typical elliptical galaxies are selected.
2.3 Selection of classical and pseudo-bulge galaxies
Based on the two-component galaxy sample selected as described above, we further select galaxies with classical bulges and pseudo-bulges. Srsic index of bulge component is the most commonly used criterion to select bulge types, since studies of nearby galaxies with robust bulge classification show that most classical bulges have and most pseudo-bulges have (e.g. Kormendy & Kennicutt, 2004; Fisher & Drory, 2016). Following Wang et al. (2019), to minimize the effect of uncertainty in fitting bulge Srsic index, we select 1360 galaxies with to be pseudo-bulge host candidates and 524 galaxies having to be classical bulge host candidates.
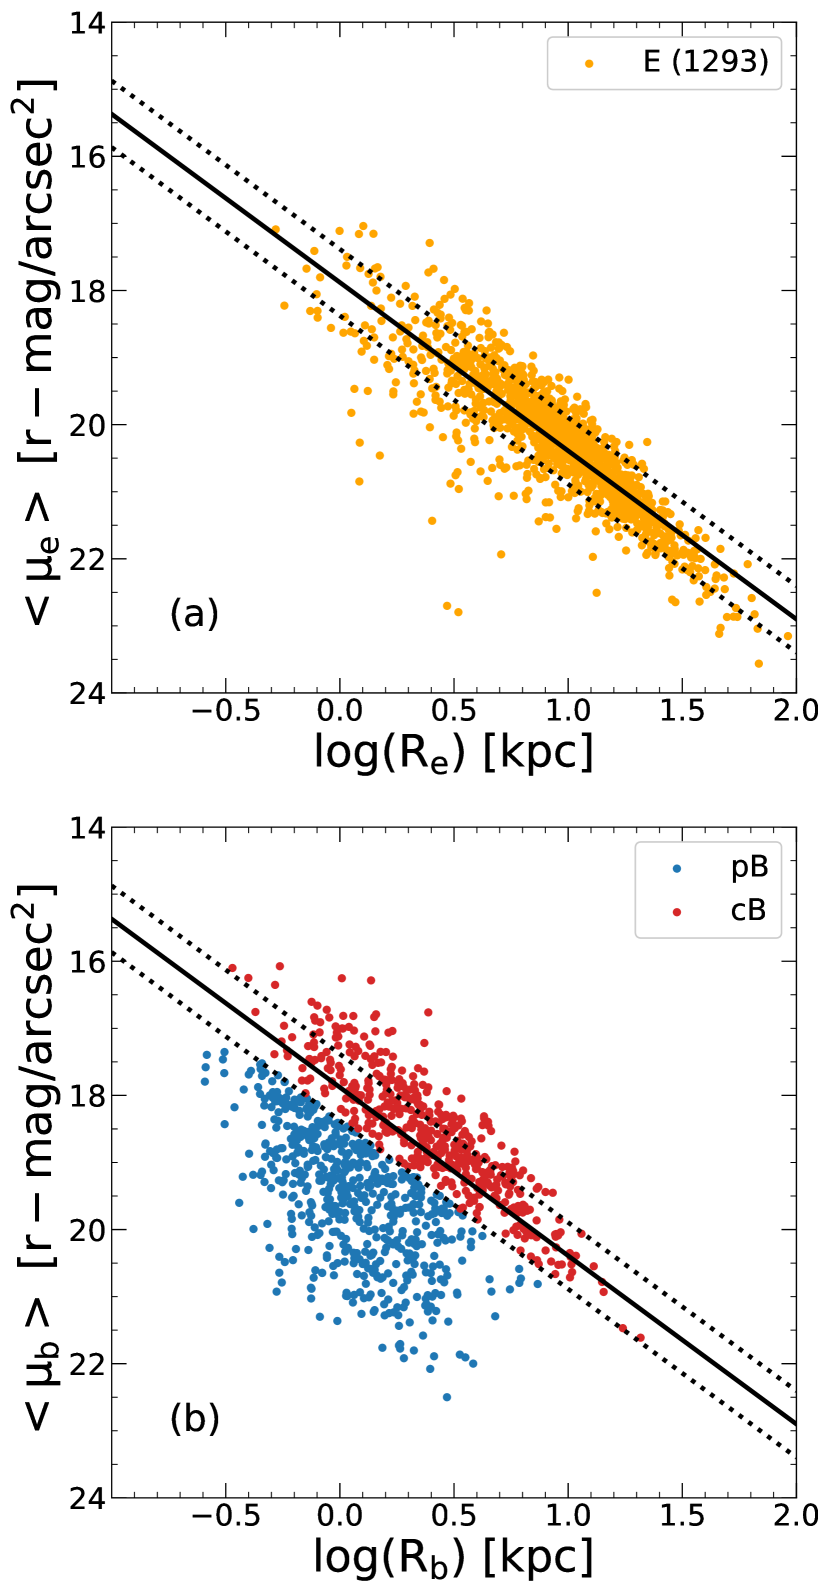
In addition, positions of bulges on the Kormendy diagram (Kormendy, 1977) are also often used to select bulges of different types. Kormendy relation is a tight correlation between effective radius and average surface brightness within the effective radius for elliptical galaxies, as a projection of fundamental plane. Classical bulges are found to follow the Koremendy relation, while pseudo-bulges normally deviate from this relation (Gadotti, 2009). Panel (a) of Fig. 1 shows the Kormendy relation of elliptical galaxies as described in §2.2. The black solid line is the best linear fitting result:
| (1) |
The two black dotted lines show the scatter (=0.50).
For galaxies with bulges, to get a typical sample of pseudo-bulges, we require the selected galaxies to lie below the lower dotted line in panel (a) of Fig. 1, which reduces the number of pseudo-bulge galaxies selected by Srsic index by a large fraction, leaving a sample of 567 galaxies. The pseudo-bulges constrained by both Srsic index and Kormendy criterion are plotted in panel (b) of Fig. 1 by blue dots. For classical bulges, we require them to lie above the lower dotted line in the relation set by ellipticals. This results in a sample of 459 classical bulges, as indicated by red dots in panel (b) of Fig. 1.
We obtain the spatially resolved properties of stellar components for our selected galaxies, using the PPXF code for full spectrum fitting, Vazdekis/MILES model (Vazdekis et al., 2010) to generate simple stellar population templates by assuming the BaSTI isochrone and Salpeter IMF (Ge et al., 2018, 2019, 2021). Stellar mass, star formation rate, as well as stellar age and metallicity are calculated for each pixel of a galaxy. For our classical (pseudo) bulge galaxy samples, we exclude 3 (3) galaxies that fail in the stellar population analysis, 2 (0) galaxies that are off-center, and 19 (14) galaxies that are affected by signals from foreground stars or neighbor galaxies within an ellipse of . In addition, as this study primarily focuses on the bulge components, we exclude 42 classical and 128 pseudo-bulges galaxies whose effective radii of bulges are smaller than the HWHM of PSF in MaNGA (with a mean value of 1.25). Finally, 393 classical bulge galaxies and 422 pseudo-bulge galaxies are used in the following for further analysis.
In Fig. 2, we compare the general properties of galaxies with different types of bulges, including g - r colour, bulge to total size ratio () and redshift, as a function of galaxy total stellar mass. The g-, r-band apparent magnitude, and redshift are provided by NASA-Sloan Atlas (NSA) catalogue 111https://www.sdss.org/dr13/manga/manga-target-selection/nsa/. The effective radii of bulges and whole galaxies are from the MPP-VAC-DR17. For galaxy stellar mass, following Ge et al. (2021), twice of is used to represent galaxy total stellar mass . is calculated as the sum of each pixel stellar mass within an ellipse with and axis ratio of the whole galaxy.
Fig. 2 displays that the selected classical bulge galaxies are in general more massive and redder than pseudo-bulge galaxies, consistent with previous studies(Wang et al., 2019; Sachdeva et al., 2020; Fisher & Drory, 2010; Hashemizadeh et al., 2022). Panel (b) indicates an increase in colour with increasing stellar mass for pseudo-bulge galaxies, while classical bulge galaxies are mostly red with g - r0.8. Panel (d) reveals that pseudo-bulge galaxies tend to have smaller relative sizes of bulges at larger stellar masses, while the relative bulge size of classical bulge galaxies does not vary much with mass, and is larger than that of pseudo-bulge galaxies of similar stellar mass. Panel (f) shows that galaxies with classical bulges are in general at higher redshift, consistent with the larger mass they have.

3 Kinematic properties
In this section, we compare the general and spatially resolved kinematic properties of galaxies with different types of bulges within various stellar mass bins. The properties investigated include that indicates proxy for specific angular momentum of systems, and central velocity dispersion . While classical bulge galaxies are redder than pseudo ones for given stellar mass, as shown in panel (b) of Fig. 2, the difference that appears, if any, may be partially due to the different colours for these two samples. We have checked that when fixing both the total stellar mass and g - r colour, all the results shown below remain similar.
3.1 relation
While pseudo-bulges are considered to be more rotationally supported than classical bulges (Fabricius et al., 2012), we first investigate in detail the kinematic rotational properties of classical and pseudo-bulges and their hosting galaxies.
For IFU data as provided in MaNGA, is widely used as a proxy for the specific stellar angular momentum of galaxy (Emsellem et al., 2007; Graham et al., 2018; Zhu et al., 2023, 2024), with larger reflecting faster rotation. For most disk galaxies, increases with radius all the way to before getting flat (Emsellem et al., 2011; Oh et al., 2020). Therefore can be used to represent global rotation of galaxies (Emsellem et al., 2007). In practice, to take into account the fact that line-of-sight velocity is not corrected for the inclination angle for each galaxy, the position of a galaxy on the diagram is normally adopted to reflect its global rotation (Emsellem et al., 2007), where ellipticity is calculated based on axial ratio ().
Following Emsellem et al. (2007), we calculate as:
| (2) |
which sums over pixels within an ellipse with radius and the axial ratio . , , , and represent the mean flux, radius, line-of-sight velocity, and velocity dispersion of stars on the pixel, respectively.
In the top two panels of Fig. 3, we show the relation for classical (top left) and pseudo-bulge (top right) galaxies in different galaxy stellar mass intervals. In general, for galaxies with a given type of bulges, more massive galaxies have larger , indicating a faster rotation than lower mass galaxies, consistent with the results for late-type galaxies in CALIFA (Falcón-Barroso et al., 2015), SAMI (van de Sande et al., 2021) and MaNGA (Wang et al., 2020; Zhu et al., 2024). When comparing classical bulge galaxies with pseudo-bulge galaxies, the latter rotates more for given stellar mass. Note that classical bulge galaxies in the most massive bin (red symbols in the top left panel) have less rotation than the galaxies within the second massive bin (orange symbols in the top left panel). We have checked in detail that this is partially attributed to a higher fraction (75.6%) of galaxies without spiral arms or rings in the most massive bin than in the other stellar mass bins ( 50%). These galaxies are normally slow-rotating systems compared to galaxies with spiral arms or rings. In addition, in the most massive bin, more galaxies without spiral arms or rings are rotating extremely slow with , with little velocity and large velocity dispersion both at small and large radii. For galaxies with spiral arms or rings, more massive galaxies always rotate more for a given bulge type, and classical bulge galaxies rotate less than pseudo bulge ones at given stellar mass.
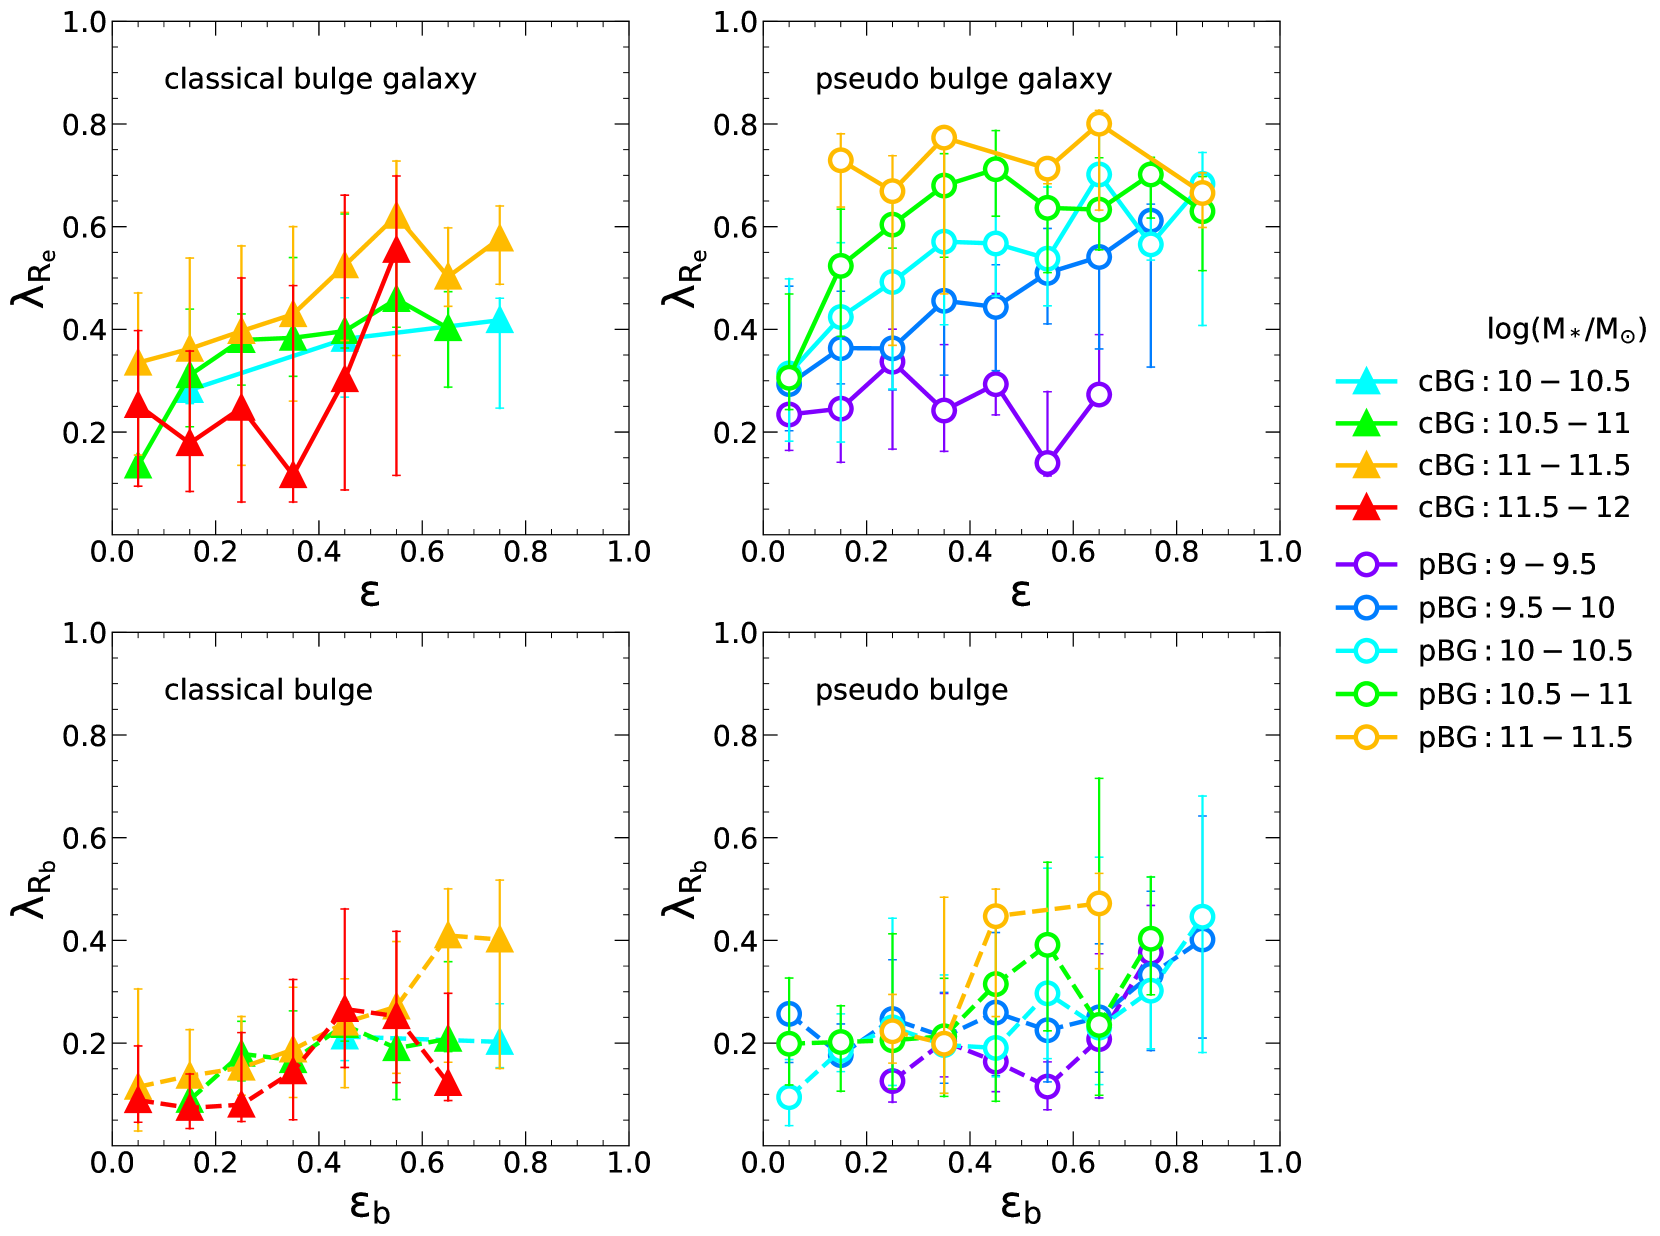
The bottom panels of Fig. 3 show the relation, for the bulge components of our selected samples. The ellipticity is calculated based on axial ratio of bulge component from MPP-VAC-DR17. As expected, bulges have slower rotation than the galaxies in general. Unlike as seen in the top panels, bulges of each type show similar rotation state, almost independent of galaxy stellar mass. Comparing the bulges of different types, the results are quite similar in all stellar mass bins, with in general only a bit larger rotation for pseudo-bulges. Fig. 3 shows clearly that different types of bulges have small differences in rotation, while their hosting galaxies as a whole have large differences. This could be partially due to the fact that classical bulges are relatively larger in size than pseudo-bulges as seen in panel (d) of Fig. 2, and contribute more to the total rotation of galaxies. Apart from this, disc component of galaxies with different bulges may also rotate differently.
We check the rotation of disc components ( relation) of galaxies hosting classical bulges and pseudo-bulges, in the left and middle panel of Fig. 4 respectively. To minimize the contribution of bulge components, we calculate within an elliptical ring with radius from to , to quantify the rotation of disc components. Ellipticity of the disc component is from MPP-VAC-DR17. At overlapped stellar mass intervals, pseudo-bulge galaxies have in general faster rotating discs than classical bulge galaxies, but the difference is smaller than that of galaxies as a whole, as presented in the upper panels of Fig. 3. Therefore the latter is largely affected by the larger relative size of classical bulges than pseudo-bugles, with also a contribution from slower disc rotation.
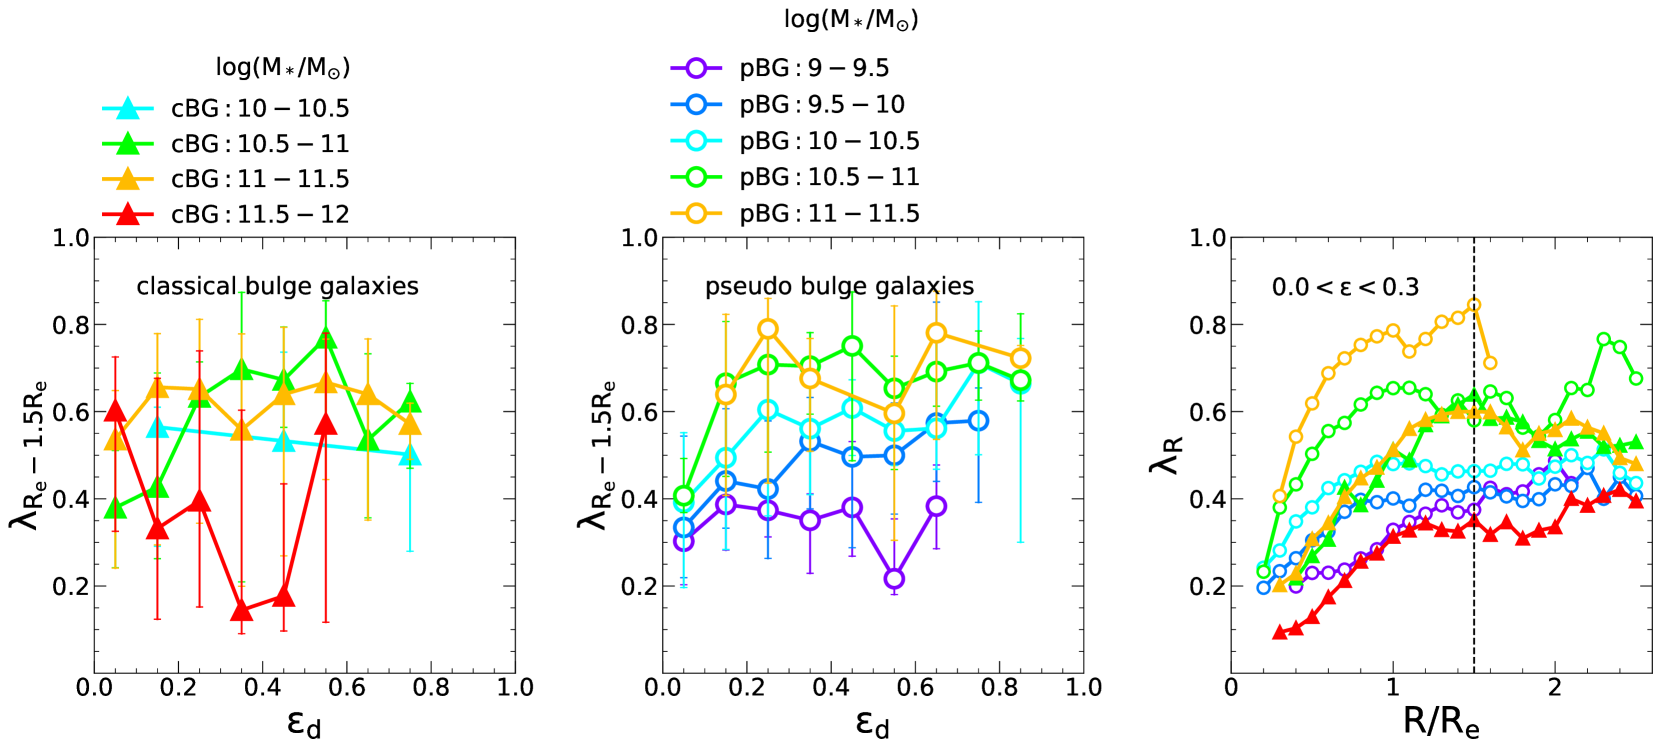
In the right panel of Fig. 4, we present the radial profiles of for classical and pseudo-bulge galaxies in different stellar mass bins, to have a more detailed look at the rotation state of galaxies at various radii. While depends on , we show results for galaxies within a narrow range of . We also check profile of galaxies within other ranges and find similar results. Affected by the PSF of spectrum in MaNGA, innermost points of galaxies are chosen to be greater than their HWHM. For MaNGA galaxies, about 65% are covered by the fibers to the radius of , with the rest going to . Therefore in this panel, more galaxies are included within , which is indicated by the vertical dotted line. We have checked that the results within are similar if only include galaxies that have data extending to .
For galaxies more massive than , those with pseudo-bulges rotate more than the ones with classical bulges at radius smaller than . The difference between two subsamples is largest at around . While the bulge size is mostly around - for classical bulges and - for pseudo-bulges as presented in Fig. 2, the right panel of Fig. 4 shows more clearly that at stellar mass greater than , galaxies that host pseudo-bulges have discs that are rotating more than the ones hosting classical bulges.
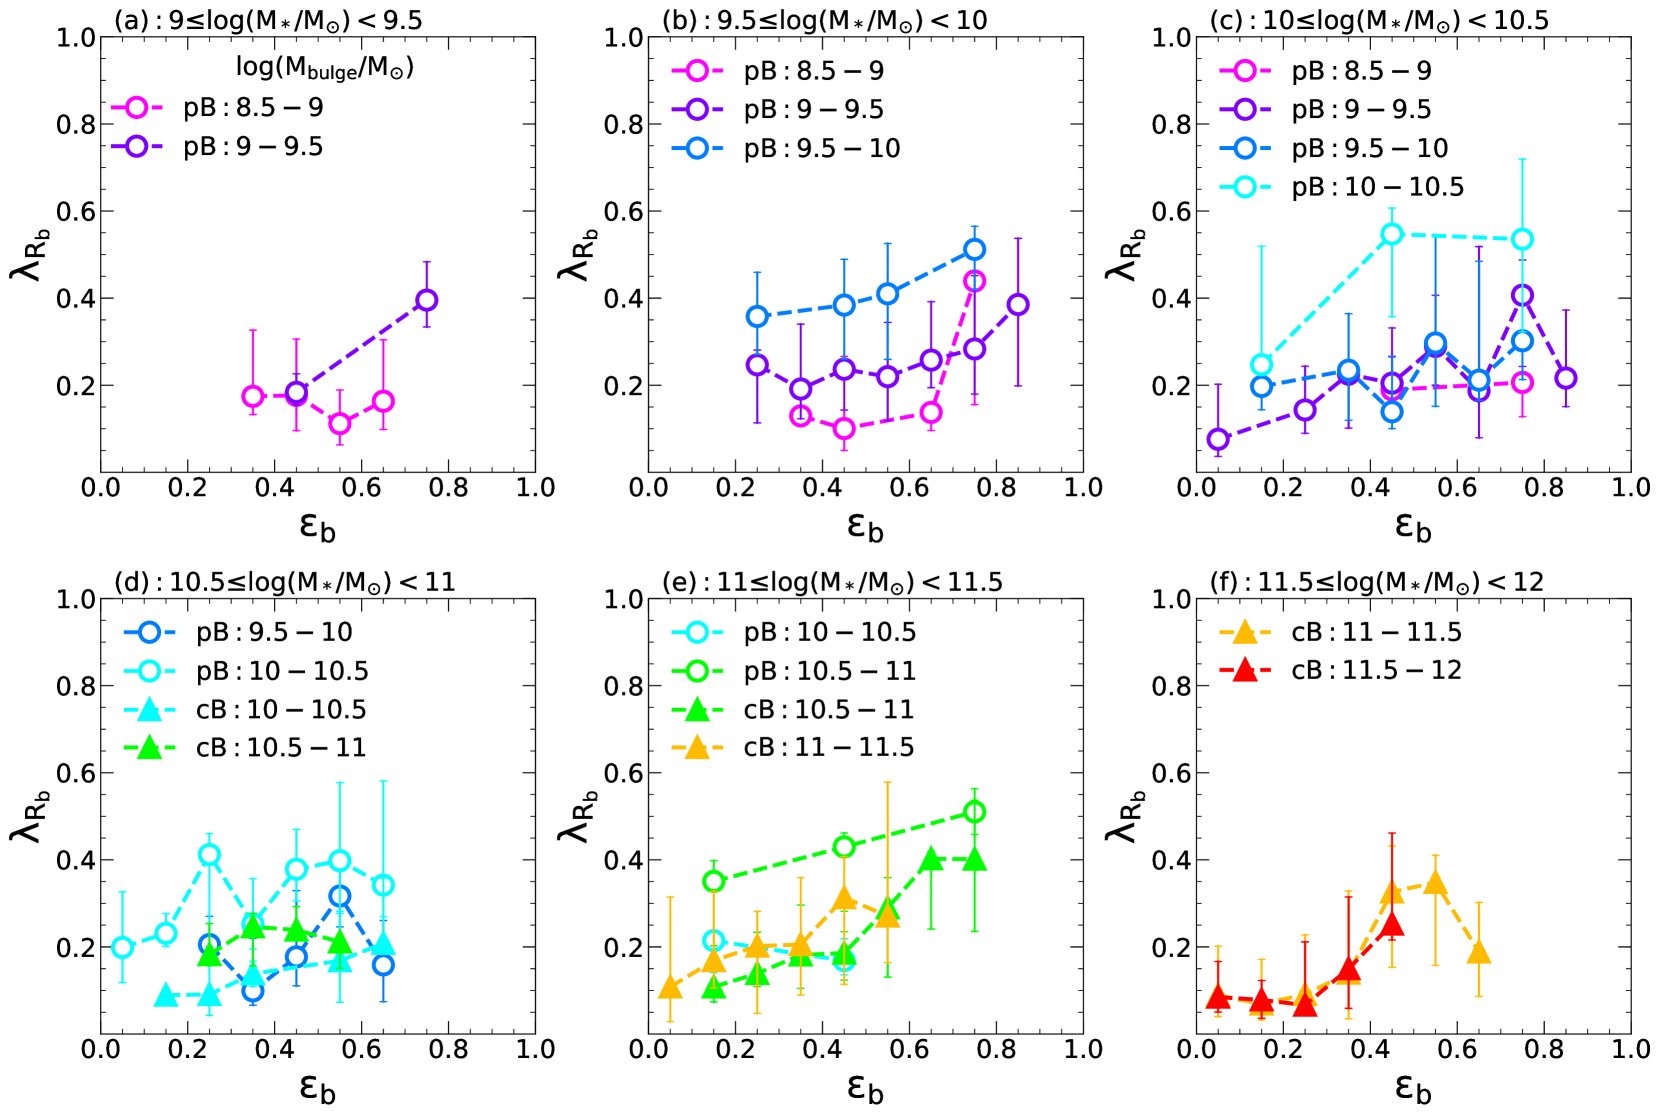
In Fig. 5, we further investigate the dependence of relation on bulge mass. Similar to the total stellar mass of galaxy as described in §2.3, bulge mass is calculated as twice the sum of each pixel stellar mass within the ellipse with effective radius . In Fig. 5, each panel shows results for a given galaxy total stellar mass interval, and different colored symbols and lines in each panel are the results for subsamples with different bulge masses as indicated. For pseudo-bulges, at given galaxy stellar mass interval shown in each panel, more massive pseudo-bulges in general rotate more. Comparing pseudo-bulges with similar bulge mass but different galaxy total mass in different panels, pseudo-bulges less massive than seem to have consistent results. For pseudo-bulges with stellar mass in the range , at given bulge mass, pseudo-bulges in more massive galaxies seem to rotate less. For classical bulges in each panel, the dependence on bulge mass is weaker than for pseudo-bulges, with still a trend that more massive bulges rotate more.
For the galaxy stellar mass in the range where both types of bulges can be hosted as shown in Fig. 5, at given bulge mass, pseudo-bulges are more rotational dominant than classical bulges. Also note that by number fraction in this mass range, most pseudo-bulges have mass range of , while most classical bulges have mass range of . This results in the similar rotation between classical and pseudo-bulges with the same total stellar mass as seen in Fig. 3.
3.2 Central velocity dispersion
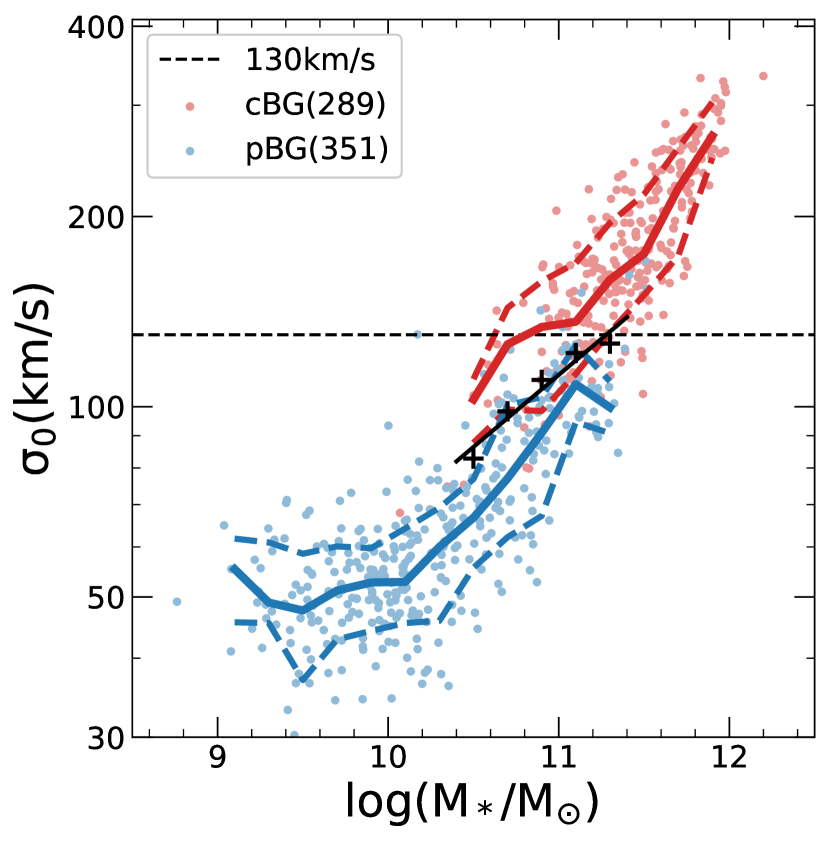
Observations of classical and pseudo-bulge galaxies with robust bulge type identification indicate that classical bulges have a large central velocity dispersion, while most pseudo-bulges have a lower central velocity dispersion (Fisher & Drory, 2016). The commonly used stellar central velocity dispersion is defined as the mean velocity dispersion of a small region in the central of galaxy. For about 100 nearby bulge galaxies, Fisher & Drory (2016) found that of 68% classical bulge galaxies and only 9.4% pseudo-bulge galaxies is larger than 130km/s. Therefore a value of km/s is often proposed as a criterion to select classical bulges. For example, Sachdeva et al. (2020) defined classical bulges with more than 130km/s and pseudo-bulges with less than 90km/s.
For IFU data as we use in this work, is calculated as the flux-weighted second moments of velocity:
| (3) |
where and are the line-of-sight velocity and velocity dispersion on the th pixel. is the total pixel number within a circle of the central part of a galaxy. Different radius of the circle is adopted in previous works, which is in Lu et al. (2020), 1kpc in Fisher & Drory (2016), in Kuntschner et al. (2010) and in Fabricius et al. (2012). We have checked that for our sample galaxies, calculated within these radii are pretty similar. In this work, we use to include more galaxies, and calculate for all galaxies with greater than their HWHM of PSF of MaNGA (with a mean value of 1.25 ).
Fig. 6 gives the results of central velocity dispersion, for galaxies with distinct types of bulges, as a function of galaxy stellar mass. For galaxies more massive than , there exists a strong dependence of on galaxy stellar mass. Comparing galaxies with different types of bulges, at given stellar mass, classical bulge galaxies have higher , and the two populations are well separated. The separation indicates that there exists a criterion of stellar mass dependent that can be roughly used to classify galaxies with classical bulges and with pseudo-bulges. In the stellar mass range of where galaxies can host either type of bulge, for each stellar mass interval of 0.2 in logarithmic, we calculate the average of the two median values for classical and pseudo-bulge galaxies. The results are plotted as black crosses in Fig. 6. These crosses can be fitted by a linear relation as indicated by the black solid line:
| (4) |
While the fixed value of km/s (the horizontal dashed line in Fig. 6 ) is commonly used to select classical bulges, the equation above provides a more detailed divider of central velocity dispersion to classify bulge types. This galaxy stellar mass dependent criterion of central velocity dispersion can be used to distinguish both galaxies with classical bulges and the ones with pseudo-bulges.
4 Stellar and cold gas properties
In this section, we study and compare spatially resolved stellar properties, including age, sSFR and metallicity, for galaxies with classical bulge and pseudo-bulge. HI contents of different sample galaxies are also investigated.
4.1 Properties of stellar population
For selected MaNGA galaxies, the spatially resolved stellar population properties including stellar age, metallicity, stellar mass, and flux of of each pixel come from the stellar population analysis as described in §2.3. SFR on each pixel is calculated according to flux by empirical law of Kennicutt (1998, Eq.(2)), which represents star formation activities in the last 20Myr (Kennicutt, 1998) in each pixel. sSFR is calculated as the ratio of total SFR and total stellar mass within an ellipse.
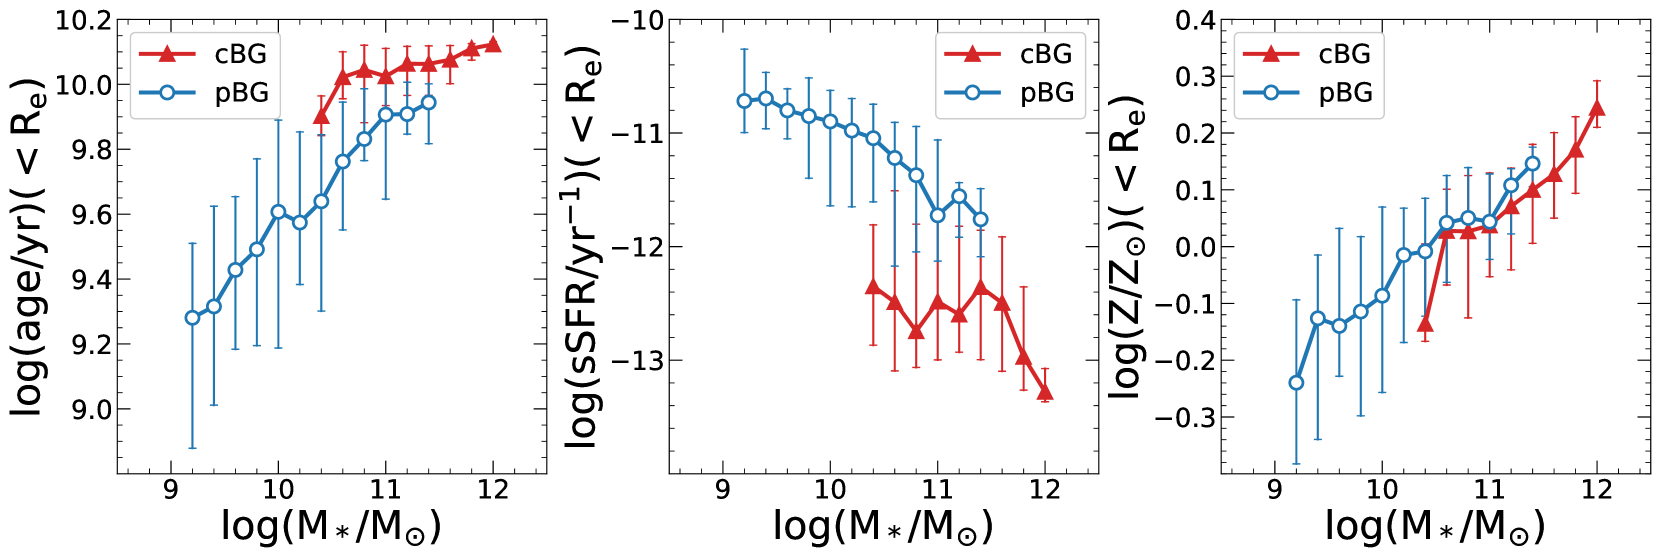
In Fig. 7, we compare mass-weighted stellar age, specific SFR (sSFR) and stellar metallicity as a function of galaxy stellar mass for the classical and pseudo-bulge galaxies. For our galaxy samples, we have checked and find that the average values of the stellar population properties studied within a given radius vary with increasing and gradually become stable at and larger radius. Therefore we use the average values within to represent the global properties of galaxies. The left and middle panel of Fig. 7 shows that at given stellar mass, classical bulge galaxies have older stellar populations and lower sSFR than pseudo-bulge ones. The right panel of Fig. 7 indicates that classical and pseudo-bulge galaxies show a similar dependence on total stellar mass, with similar metallicities in most cases.
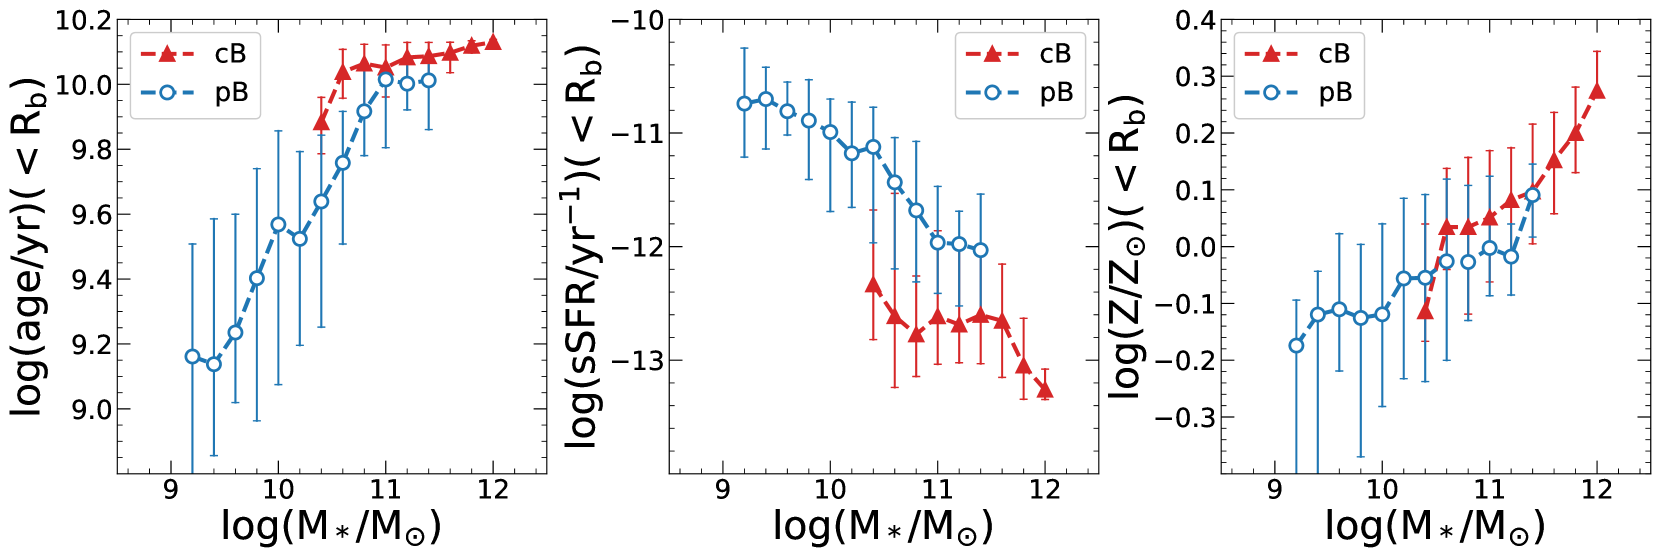
Fig. 8 compares the stellar population properties between classical and pseudo-bulge components. Classical bulges are in general older and have less efficient star formation than the pseudo-bulges in galaxies with the same stellar mass. At stellar mass greater than , the difference in stellar age becomes small. For stellar metallicity, classical bulges have on average a bit higher metallicity than pseudo-bulges, different from the case for the overall galaxies as indicated in Fig. 7.
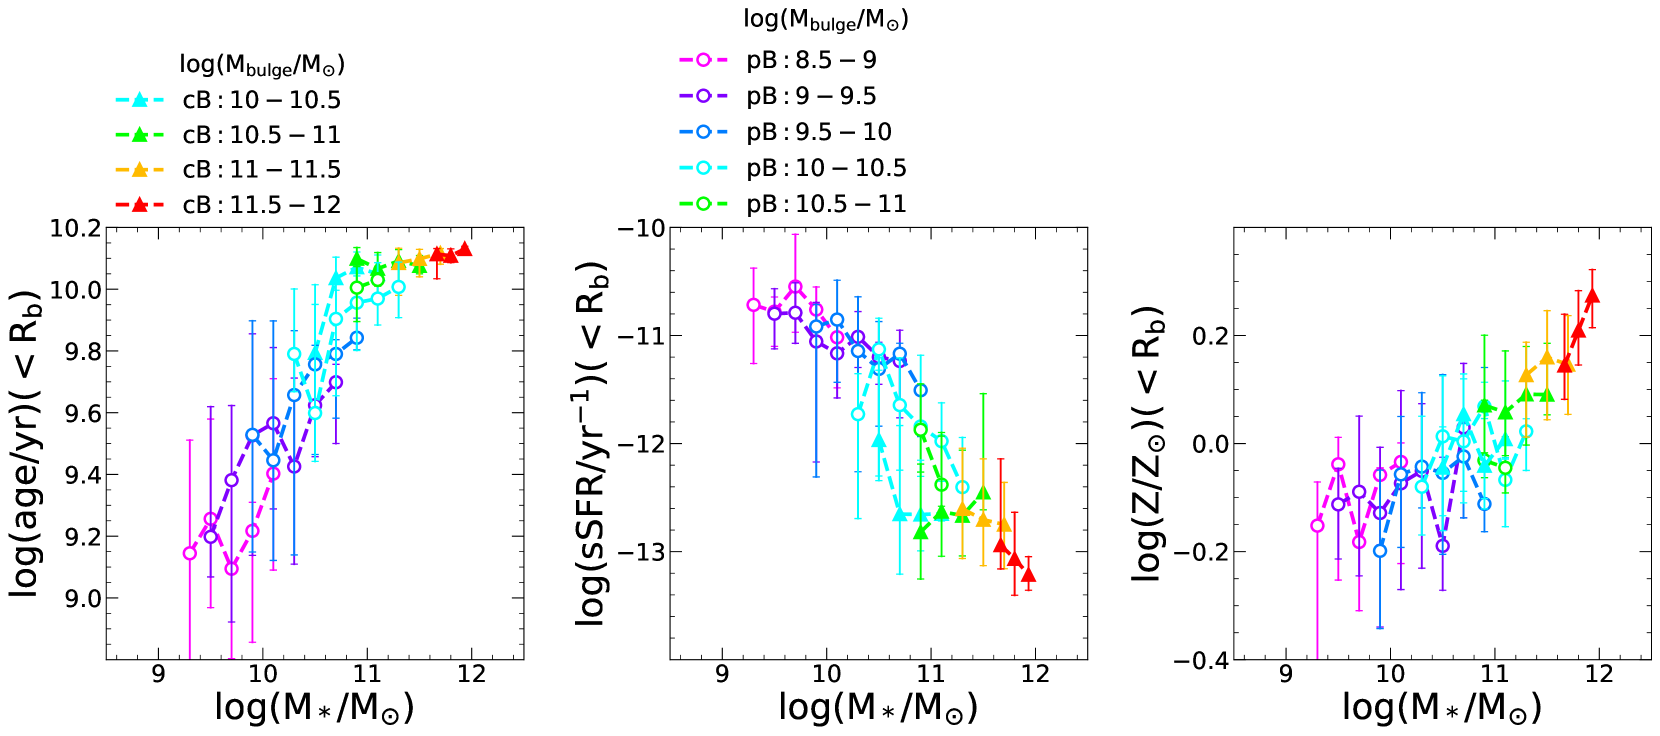
While strong dependence of stellar properties of bulge component on galaxy stellar mass is seen in Fig. 8, we check in Fig. 9 whether the dependence is partially due to different bulge mass. In Fig. 9, galaxies within a certain stellar mass bin are further divided into subsamples according to their bulge mass, and the results are presented by different colours. At given stellar mass, the left panel shows that more massive pseudo-bulges have a bit older stellar populations. Apart from that, there exists little dependence on bulge mass for the properties investigated. Therefore stellar population properties of bulges are most closely related to the stellar mass of their host galaxies rather than their own mass.
4.2 Radial profiles of stellar population properties
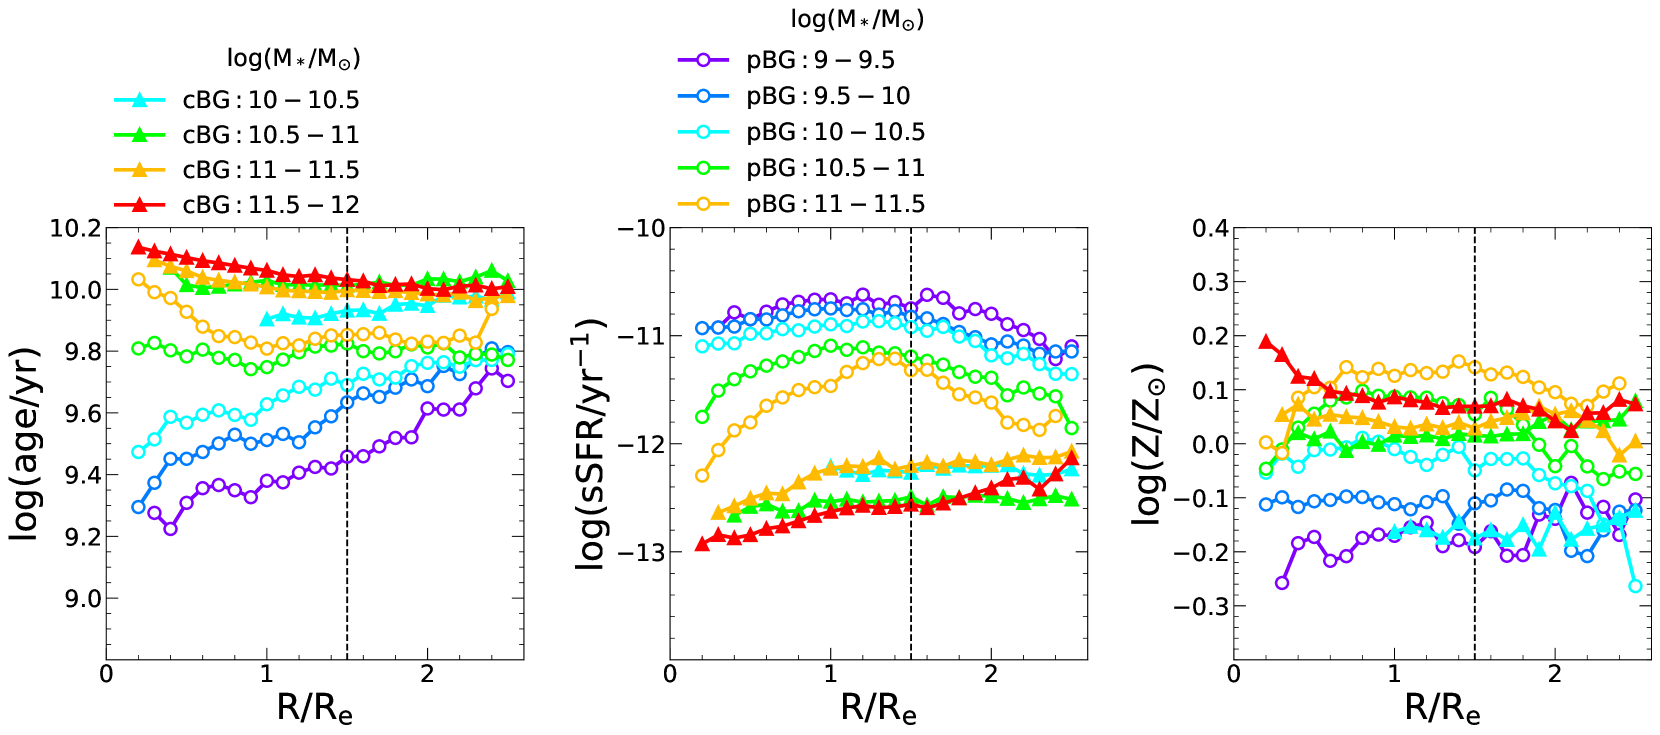
To investigate in more detail the stellar population in galaxies with classical and pseudo-bulge, especially for the disc components, we compare the profiles of mass-weighted stellar age, metallicity, and sSFR in Fig. 10. For each classical and pseudo-bulge galaxy subsample in a certain stellar mass interval, the median stellar population property is calculated and shown at given radius relative to .
In the left panel of Fig. 10, it is evident that classical bulge galaxies have older stellar populations than pseudo-bulge galaxies at all radii, for all stellar mass intervals. For classical bulge galaxies, the age profile shows a decreasing trend for massive ones and a flatter trend for lower mass ones. For pseudo-bulge galaxies more massive than (green and orange circles), the stellar age is older at the center and exhibits a decreasing trend till the radius of around . Beyond this radius there exists a slight increase at , and the profiles become flat towards outer radii. For pseudo-bulge galaxies with stellar mass lower than , the stellar age continuously increases from center to edge. The change of age profile slope with galaxy mass has been found in previous works (Fraser-McKelvie et al., 2018; Breda et al., 2020; Johnston et al., 2022b, a; Lu et al., 2023). For example, for face-on late-type galaxies in the stellar mass range in the CALIFA survey, Breda et al. (2020) showed that the inversion of stellar age profile from positive to negative trend occurs at .
In the middle panel of Fig. 10, the behavior of sSFR profiles is generally consistent with the stellar age profiles, with low sSFR corresponding to large stellar age and vise versa. For classical bulge galaxies, slopes of sSFR profiles are slightly increasing or stay flat. For pseudo-bulge galaxies more massive than , the sSFR profiles show steep going up and down with increasing radius. For pseudo-bulge galaxies in the two lowest stellar mass bins, the sSFR profiles are almost flat. Some other studies also focus on the sSFR profile of MaNGA galaxies (Steffen et al., 2021; Belfiore et al., 2018; Rathore et al., 2022). In particular, Belfiore et al. (2018) found that main sequence galaxies with mass in the range have an increasing and then decreasing sSFR profile, similar as seen for our (massive) pseudo-bulge galaxies. They also studied the sSFR profile of green valley galaxies with stellar mass in the range , which shows an increasing and then flat trend.
The right panel of Fig. 10 presents profiles of stellar metallicity. For most subsamples, the profile remains flat, especially at intermediate radius, consistent with previous works studying S0 and late-type galaxies (Zheng et al., 2017; Fraser-McKelvie et al., 2018; Johnston et al., 2022a, b; Lu et al., 2023). Exceptions exist for a few massive bins of both bulge type galaxies. Most massive galaxies with classical bulges have obviously higher metallicity in the inner region. Pseudo-bulge galaxies of mass greater than have lower metallicity in both the inner and outermost part, which is consistent with the more detailed study of the Milky Way by Lian et al. (2023), which found a -shape light-weighted metallicity profile. Comparing galaxies with two types of bulges, at given stellar mass, pseudo-bulge galaxies have obviously higher metallicity than classical bulge galaxies at intermediate radius, while opposite trend is seen at small radius in the stellar mass range . This explains why in this mass range in Fig. 7 galaxies with classical bulge have a bit lower metallicity while in Fig. 8 the opposite is seen.
4.3 HI gas fraction
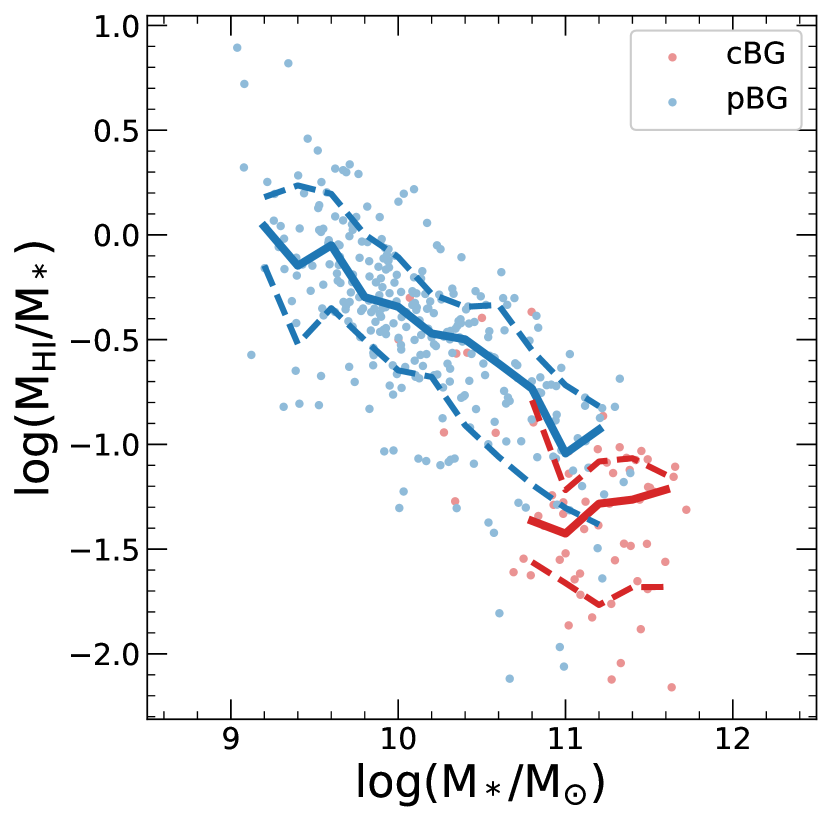
While classical bulge galaxies have older age and lower sSFR than pseudo-bulge ones with the same stellar mass as presented in Fig. 7, we compare their cold gas properties by looking at their HI fraction using HI-MaNGA data. HI-MaNGA is an HI (21cm) follow-up program of MaNGA survey galaxies (Masters et al., 2019; Stark et al., 2021). The latest third data release value-added catalogue contains 6632 sources, where 3274 galaxies of them with are provided by ALFALFA catalogue (Haynes et al., 2018), and the remaining 3358 galaxies with are observed by the Green Bank Telescope.
For our sample galaxies, 176 galaxies with classical bulge are observed by HI-MaNGA, of which 62 (35.23%) have HI detection. 374 of our pseudo-bulge galaxies are included in the HI-MaNGA catalogue, among which 293 (78.34%) are HI detected. The HI detection rate of pseudo-bulge galaxies is higher, as expected, since they have more active star formation than classical bulge galaxies. In Fig. 11, for classical and pseudo-bulge galaxies that have HI detection, we check and compare their HI fraction, the ratio of HI-mass to total stellar mass. The HI gas content of pseudo-bulge galaxies is higher than classical bulge galaxies, in stellar mass range .
Fig. 7 and Fig. 8 indicate that in this mass range, classical bulges have a bit older stellar populations and lower sSFR than pseudo-bulges, while the difference for the whole galaxies is obviously larger. Also in Fig. 10, larger differences are seen in the disc component than in the inner part of galaxies, for all the stellar properties investigated. All these results indicate that discs of pseudo-bulge galaxies are younger, have more active star formation, and are rotating more (Fig. 4), compared with the discs of classical bulge galaxies, and the difference between discs are larger than that between bulges. Therefore, disc components may contribute more than the bulge components to the higher HI fraction in pseudo-bulge galaxies. In addition, while bulge components tend to be passive and possibly contain little HI gas, the smaller bulge fraction of pseudo-bulge galaxies possibly plays a role in their higher HI context. Future spatially resolved HI observations can provide more information about the direct connection between HI content and different components of galaxies.
5 Conclusions and discussions
In this paper, we compare properties of classical and pseudo-bulges and properties of their hosting galaxies selected from the MaNGA survey. The galaxies with classical bulge and pseudo-bulge are selected based on the Srsic index n of bulge component from the two-component decomposition catalogue provided by Domínguez Sánchez et al. (2022), as well as the position of bulges on the Kormandy diagram.
Our main conclusions are summarized as follows:
- By looking at the relations of bulges and their hosting galaxies, we find that galaxies hosting pseudo-bulges rotate faster than those with classical bulges at given stellar mass, which is due to a faster-rotating disc, as well as a smaller relative size of bulges for pseudo-bulge galaxies. The relations for the two types of bulges are similar, and have little dependence on galaxy stellar mass.
- We propose a new criterion of central velocity dispersion to classify galaxies with classical bulges from those with pseudo-bulges in the mass range of , with a divider of: . Galaxies with larger/smaller central velocity dispersion than the divider can be selected as hosting classical/pseudo- bulges. This mass-dependent separation provides additional criterion apart from the fixed value of km/s (km/s) previously used to select classical (pseudo) bulge galaxies (e.g. Sachdeva et al., 2020).
- At given galaxy stellar mass, classical bulges and their galaxies have older stellar populations and lower sSFR than pseudo-bulges and their galaxies. Metallicity of classical bulges is higher than pseudo-bulges, but the galaxies hosting classical bulges as a whole have lower metallicity than those hosting pseudo-bulges. All the stellar properties of bulges investigated have strong dependence on galaxy mass, but are almost independent of bulge mass.
- For the radial profiles of stellar properties, we find that classical bulges have younger age and more active star formation at larger radius, and mostly flat metallicity profiles. Low-mass pseudo-bulge galaxies have increasing stellar age, and roughly flat sSFR and metallicity with increasing radius. Massive pseudo-bulge galaxies have non-monotonic profiles, with youngest stellar age, and largest sSFR and metallicity at radius of around to .
Our results indicate that compared with discs of classical bulge galaxies, discs of pseudo-bulge galaxies are younger, have more active star formation, are rotating more, and may contain more HI content (Fig. 11 and discussions in §4.3). The difference between discs of galaxies hosting different bulges is larger than that between bulges themselves, both for the stellar population and for the kinematic property (right panel of Fig. 4). This may give clues to the detailed formation processes of bulges that regulate the growth of central components and the evolution of outer discs. On the other hand, as simulations suggest that major mergers could lead to the formation of both elliptical and disc galaxies (e.g. Peschken et al., 2020; Zeng et al., 2021), it is possible that disc-like pseudo-bulges can also form through more violent processes apart from the secular evolution normally considered.
While we use a photometric two-component decomposition catalogue to identify bulge type in this work, methods like multi-component decomposition of galaxy structure (Gadotti, 2009; Sheth et al., 2010; Kumar & Kataria, 2022), full-band spectral decomposition technology (Johnston et al., 2022a) and dynamical multi-component decomposition (Jin et al., 2023) could provide more robust identification of bulge component, but currently only applied to samples with limited numbers of galaxies. When in the future larger samples are available, it may be possible to get more information regarding the correlations that exist between bulge types and their host galaxies/environment (Wang et al., 2019), to help us understand more the formation of different types of bulges, and their co-evolution with host galaxies.
Acknowledgements
We acknowledge Hu Zou and Zheng Zheng for helpful discussion. This work is supported by the National SKA Program of China (Nos. 2022SKA0110200, 2022SKA0110201), the National Natural Science Foundation of China (NSFC) (grant Nos. 11988101, 11903046), the National Key Program for Science and Technology Research Development of China 2018YFE0202902, and K.C.Wong Education Foundation. JG acknowledges support from the Youth Innovation Promotion Association of the Chinese Academy of Sciences (No. 2022056). KZ acknowledges the support from the Shuimu Tsinghua Scholar Program of Tsinghua University.
Funding for the Sloan Digital Sky Survey IV has been provided by the Alfred P. Sloan Foundation, the U.S. Department of Energy Office of Science, and the Participating Institutions. SDSS-IV acknowledges support and resources from the Center for High Performance Computing at the University of Utah. The SDSS website is www.sdss.org.
SDSS-IV is managed by the Astrophysical Research Consortium for the Participating Institutions of the SDSS Collaboration including the Brazilian Participation Group, the Carnegie Institution for Science, Carnegie Mellon University, Center for Astrophysics | Harvard & Smithsonian, the Chilean Participation Group, the French Participation Group, Instituto de Astrofísica de Canarias, The Johns Hopkins University, Kavli Institute for the Physics and Mathematics of the Universe (IPMU) / University of Tokyo, the Korean Participation Group, Lawrence Berkeley National Laboratory, Leibniz Institut für Astrophysik Potsdam (AIP), Max-Planck-Institut für Astronomie (MPIA Heidelberg), Max-Planck-Institut für Astrophysik (MPA Garching), Max-Planck-Institut für Extraterrestrische Physik (MPE), National Astronomical Observatories of China, New Mexico State University, New York University, University of Notre Dame, Observatário Nacional / MCTI, The Ohio State University, Pennsylvania State University, Shanghai Astronomical Observatory, United Kingdom Participation Group, Universidad Nacional Autónoma de México, University of Arizona, University of Colorado Boulder, University of Oxford, University of Portsmouth, University of Utah, University of Virginia, University of Washington, University of Wisconsin, Vanderbilt University, and Yale University.
Data Availability
The Nasa Sloan Atlas catalogue used in this study is available at https://www.sdss.org/dr13/manga/manga-target-selection/nsa/. The MaNGA kinematics data is publicly available in https://www.sdss4.org/dr17/manga/manga-data/data-access/. The HI-MaNGA data comes from https://www.sdss.org/dr16/manga/hi-manga/.
References
- Abdurro’uf et al. (2022) Abdurro’uf et al., 2022, ApJS, 259, 35
- Aguerri et al. (2001) Aguerri J. A. L., Balcells M., Peletier R. F., 2001, A&A, 367, 428
- Athanassoula (2005) Athanassoula E., 2005, MNRAS, 358, 1477
- Belfiore et al. (2018) Belfiore F., et al., 2018, MNRAS, 477, 3014
- Bird et al. (2012) Bird J. C., Kazantzidis S., Weinberg D. H., 2012, MNRAS, 420, 913
- Blanton et al. (2017) Blanton M. R., et al., 2017, AJ, 154, 28
- Breda & Papaderos (2023) Breda I., Papaderos P., 2023, A&A, 669, A70
- Breda et al. (2020) Breda I., et al., 2020, A&A, 635, A177
- Bundy et al. (2015) Bundy K., et al., 2015, ApJ, 798, 7
- Cappellari (2017) Cappellari M., 2017, MNRAS, 466, 798
- Cappellari (2023) Cappellari M., 2023, MNRAS, 526, 3273
- Cappellari & Copin (2003) Cappellari M., Copin Y., 2003, MNRAS, 342, 345
- Cappellari & Emsellem (2004) Cappellari M., Emsellem E., 2004, PASP, 116, 138
- Carollo et al. (1997) Carollo C. M., Stiavelli M., de Zeeuw P. T., Mack J., 1997, AJ, 114, 2366
- Combes (2020) Combes F., 2020, in Valluri M., Sellwood J. A., eds, Vol. 353, Galactic Dynamics in the Era of Large Surveys. pp 155–161 (arXiv:1908.03149), doi:10.1017/S1743921319007397
- Courteau et al. (1996) Courteau S., de Jong R. S., Broeils A. H., 1996, ApJ, 457, L73
- Domínguez Sánchez et al. (2022) Domínguez Sánchez H., Margalef B., Bernardi M., Huertas-Company M., 2022, MNRAS, 509, 4024
- Drory & Fisher (2007) Drory N., Fisher D. B., 2007, ApJ, 664, 640
- Eliche-Moral et al. (2013) Eliche-Moral M. C., González-García A. C., Aguerri J. A. L., Gallego J., Zamorano J., Balcells M., Prieto M., 2013, A&A, 552, A67
- Elmegreen et al. (2008) Elmegreen B. G., Bournaud F., Elmegreen D. M., 2008, ApJ, 688, 67
- Emsellem et al. (2007) Emsellem E., et al., 2007, MNRAS, 379, 401
- Emsellem et al. (2011) Emsellem E., et al., 2011, MNRAS, 414, 888
- Erwin & Sparke (2002) Erwin P., Sparke L. S., 2002, AJ, 124, 65
- Fabricius et al. (2012) Fabricius M. H., Saglia R. P., Fisher D. B., Drory N., Bender R., Hopp U., 2012, ApJ, 754, 67
- Falcón-Barroso et al. (2015) Falcón-Barroso J., Lyubenova M., van de Ven G., 2015, in Cappellari M., Courteau S., eds, Vol. 311, Galaxy Masses as Constraints of Formation Models. pp 78–81 (arXiv:1409.7786), doi:10.1017/S1743921315003439
- Fischer et al. (2019) Fischer J. L., Domínguez Sánchez H., Bernardi M., 2019, MNRAS, 483, 2057
- Fisher & Drory (2008) Fisher D. B., Drory N., 2008, AJ, 136, 773
- Fisher & Drory (2010) Fisher D. B., Drory N., 2010, ApJ, 716, 942
- Fisher & Drory (2011) Fisher D. B., Drory N., 2011, ApJ, 733, L47
- Fisher & Drory (2016) Fisher D. B., Drory N., 2016, in Laurikainen E., Peletier R., Gadotti D., eds, Astrophysics and Space Science Library Vol. 418, Galactic Bulges. p. 41 (arXiv:1512.02230), doi:10.1007/978-3-319-19378-6_3
- Fragkoudi et al. (2016) Fragkoudi F., Athanassoula E., Bosma A., 2016, MNRAS, 462, L41
- Fraser-McKelvie et al. (2018) Fraser-McKelvie A., Aragón-Salamanca A., Merrifield M., Tabor M., Bernardi M., Drory N., Parikh T., Argudo-Fernández M., 2018, MNRAS, 481, 5580
- Gadotti (2009) Gadotti D. A., 2009, MNRAS, 393, 1531
- Gargiulo et al. (2022) Gargiulo I. D., et al., 2022, MNRAS, 512, 2537
- Ge et al. (2018) Ge J., Yan R., Cappellari M., Mao S., Li H., Lu Y., 2018, MNRAS, 478, 2633
- Ge et al. (2019) Ge J., Mao S., Lu Y., Cappellari M., Yan R., 2019, MNRAS, 485, 1675
- Ge et al. (2021) Ge J., Mao S., Lu Y., Cappellari M., Long R. J., Yan R., 2021, MNRAS, 507, 2488
- Genzel et al. (2008) Genzel R., et al., 2008, ApJ, 687, 59
- Graham et al. (2018) Graham M. T., et al., 2018, MNRAS, 477, 4711
- Grand et al. (2014) Grand R. J. J., Kawata D., Cropper M., 2014, MNRAS, 439, 623
- Guedes et al. (2013) Guedes J., Mayer L., Carollo M., Madau P., 2013, ApJ, 772, 36
- Gunn et al. (2006) Gunn J. E., et al., 2006, AJ, 131, 2332
- Halle et al. (2015) Halle A., Di Matteo P., Haywood M., Combes F., 2015, A&A, 578, A58
- Hammer et al. (2005) Hammer F., Flores H., Elbaz D., Zheng X. Z., Liang Y. C., Cesarsky C., 2005, A&A, 430, 115
- Hashemizadeh et al. (2022) Hashemizadeh A., et al., 2022, MNRAS, 515, 1175
- Haynes et al. (2018) Haynes M. P., et al., 2018, ApJ, 861, 49
- Hopkins et al. (2010) Hopkins P. F., et al., 2010, ApJ, 715, 202
- Inoue & Saitoh (2012) Inoue S., Saitoh T. R., 2012, MNRAS, 422, 1902
- Jin et al. (2023) Jin Y., Zhu L., Zibetti S., Costantin L., van de Ven G., Mao S., 2023, arXiv e-prints, p. arXiv:2310.07201
- Johnston et al. (2022a) Johnston E. J., Häußler B., Jegatheesan K., 2022a, MNRAS, 514, 6120
- Johnston et al. (2022b) Johnston E. J., et al., 2022b, MNRAS, 514, 6141
- Kennicutt (1998) Kennicutt Robert C. J., 1998, ARA&A, 36, 189
- Knapen (2005) Knapen J. H., 2005, A&A, 429, 141
- Kormendy (1977) Kormendy J., 1977, ApJ, 218, 333
- Kormendy & Kennicutt (2004) Kormendy J., Kennicutt Robert C. J., 2004, ARA&A, 42, 603
- Kumar & Kataria (2022) Kumar A., Kataria S. K., 2022, MNRAS, 514, 2497
- Kuntschner et al. (2010) Kuntschner H., et al., 2010, MNRAS, 408, 97
- Laurikainen & Salo (2016) Laurikainen E., Salo H., 2016, in Laurikainen E., Peletier R., Gadotti D., eds, Astrophysics and Space Science Library Vol. 418, Galactic Bulges. p. 77 (arXiv:1505.00590), doi:10.1007/978-3-319-19378-6_4
- Lian et al. (2023) Lian J., Bergemann M., Pillepich A., Zasowski G., Lane R. R., 2023, Nature Astronomy, 7, 951
- Lu et al. (2020) Lu S., Cappellari M., Mao S., Ge J., Li R., 2020, MNRAS, 495, 4820
- Lu et al. (2023) Lu S., Zhu K., Cappellari M., Li R., Mao S., Xu D., 2023, MNRAS, 526, 1022
- Masters et al. (2019) Masters K. L., et al., 2019, MNRAS, 488, 3396
- Meert et al. (2015) Meert A., Vikram V., Bernardi M., 2015, MNRAS, 446, 3943
- Noguchi (1999) Noguchi M., 1999, ApJ, 514, 77
- Oh et al. (2020) Oh S., et al., 2020, MNRAS, 495, 4638
- Peschken et al. (2020) Peschken N., Łokas E. L., Athanassoula E., 2020, MNRAS, 493, 1375
- Querejeta et al. (2015) Querejeta M., et al., 2015, A&A, 579, L2
- Rathore et al. (2022) Rathore H., Kumar K., Mishra P. K., Wadadekar Y., Bait O., 2022, MNRAS, 513, 389
- Sachdeva et al. (2020) Sachdeva S., Ho L. C., Li Y. A., Shankar F., 2020, ApJ, 899, 89
- Sánchez et al. (2012) Sánchez S. F., et al., 2012, A&A, 538, A8
- Sandage (1961) Sandage A., 1961, The Hubble Atlas of Galaxies. Carnegie Institution of Washington Washington, DC
- Sauvaget et al. (2018) Sauvaget T., Hammer F., Puech M., Yang Y. B., Flores H., Rodrigues M., 2018, MNRAS, 473, 2521
- Scannapieco et al. (2010) Scannapieco C., Gadotti D. A., Jonsson P., White S. D. M., 2010, MNRAS, 407, L41
- Sérsic (1963) Sérsic J. L., 1963, Boletin de la Asociacion Argentina de Astronomia La Plata Argentina, 6, 41
- Sheth et al. (2010) Sheth K., et al., 2010, PASP, 122, 1397
- Simard et al. (2011) Simard L., Mendel J. T., Patton D. R., Ellison S. L., McConnachie A. W., 2011, ApJS, 196, 11
- Stark et al. (2021) Stark D. V., et al., 2021, MNRAS, 503, 1345
- Steffen et al. (2021) Steffen J. L., Fu H., Comerford J. M., Dai Y. S., Feng S., Gross A. C., Xue R., 2021, ApJ, 909, 120
- Vazdekis et al. (2010) Vazdekis A., Sánchez-Blázquez P., Falcón-Barroso J., Cenarro A. J., Beasley M. A., Cardiel N., Gorgas J., Peletier R. F., 2010, MNRAS, 404, 1639
- Vikram et al. (2010) Vikram V., Wadadekar Y., Kembhavi A. K., Vijayagovindan G. V., 2010, MNRAS, 409, 1379
- Wake et al. (2017) Wake D. A., et al., 2017, AJ, 154, 86
- Wang et al. (2019) Wang L., Wang L., Li C., Hu J., Mo H., Wang H., 2019, MNRAS, 484, 3865
- Wang et al. (2020) Wang B., Cappellari M., Peng Y., Graham M., 2020, MNRAS, 495, 1958
- Westfall et al. (2019) Westfall K. B., et al., 2019, AJ, 158, 231
- Yan et al. (2016) Yan R., et al., 2016, AJ, 152, 197
- Yan et al. (2019) Yan R., et al., 2019, ApJ, 883, 175
- Yu et al. (2022) Yu S.-Y., Xu D., Ho L. C., Wang J., Kao W.-B., 2022, A&A, 661, A98
- Zeng et al. (2021) Zeng G., Wang L., Gao L., 2021, MNRAS, 507, 3301
- Zheng et al. (2017) Zheng Z., et al., 2017, MNRAS, 465, 4572
- Zhu et al. (2023) Zhu K., Lu S., Cappellari M., Li R., Mao S., Gao L., 2023, MNRAS, 522, 6326
- Zhu et al. (2024) Zhu K., Lu S., Cappellari M., Li R., Mao S., Gao L., Ge J., 2024, MNRAS, 527, 706
- van de Sande et al. (2021) van de Sande J., et al., 2021, MNRAS, 508, 2307