sxc]Physics Department, St. Xavier’s College, Kolkata 700016, India \alsoaffiliation[cmprc]Condensed Matter Physics Research Centre, Jadavpur University, India montana]Mathematical Sciences, Montana Tech, Butte, MT 59701, United States sxc]Physics Department, St. Xavier’s College, Kolkata 700016, India \alsoaffiliation[cmprc]Condensed Matter Physics Research Centre, Jadavpur University, India
Three-dimensional modelling of polygonal ridges in salt playas
Abstract
Salt playas with their tessellated surface of polygonal salt ridges are beautiful and intriguing, but the scientific community lacks a realistic and physically meaningful model that thoroughly explains their formation. In this work, we investigated the formation phenomena via suitable three-dimensional modelling and simulation of the dynamical processes that are responsible. We employed fracture mechanics, principles of energy minimization, fluid and mass transport in fracture channels and processes of crystallization and self organisation to finally replicate the almost Voronoidal pattern of salt ridges that tessellate salt playas. The model is applicable to playas having different salt compositions, as the effect of the salt diffusion coefficient and critical salinity at supersaturation for a particular ambient condition are factored in. The model closely reproduces the height distribution and geometry of the salt ridges reported in the literature. Further, we prove that the final stable polygonal geometry of the salt playas is an effort towards the total minimization of system energy.
keywords:
salt-playa, 3-dimensional desiccation cracks, advection-diffusion, crystallization, self-organisation1 Introduction
Salt playas or salt deserts often display beautiful patterns of salt ridges that tessellate the entire saline pan into polygons most of which are pentagons and hexagons. Saline pans are flat shallow depressions covered with layers of salt that are normally dry, except when flooding or heavy rain turns the pan into a temporary lake. Over a long period of time, the pans go through repeated wetting and drying cycles1. The salt ridges develop annually up to a few centimetres on the top surface, can cover an area ranging from 1 to a few thousand , and overlie salt-water saturated thin-bedded clays and gypsum deposits2, 3, 4. Over the last few decades, researchers have tried to explain the phenomena of large polygonal salt ridges that form a mosaic on salt playas by using fracture5 or buckling models2 of the surface layer, or by modelling complex fluid dynamics in the sub-surface of these regions6, 7, 8, 9, 10, 11. However, these models do not offer any explanation that justifies the images of the rough pentagonal or hexagonal Voronoi-like tessellation of several square kilometres of the salt basins by salt ridges.
In this paper, we provide an explanation of the polygonal salt patterns by incorporating principles of fracture mechanics, fluid dynamics, mass transport and finally the principles of crystallization. During dry seasons, desiccation of the surface clay layers fracture to release accumulated stress. A growing crack stops once it meets another crack line, in the process tessellating the top surface into polygonal crack mosaics that resemble Gilbert tessellation12. With time, the stress propagates to the lower layers and the crack network extends vertically downwards. The crack channels that extend from the surface to the subsurface water table act as primary water-conducting channels. A schematic diagram is shown in Figure 1a.
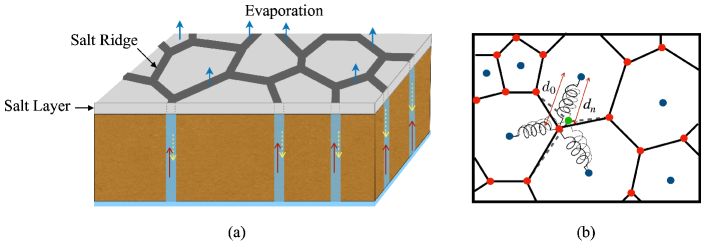
During desiccation water evaporates from the surface layer and saline water from the subsurface water table (or trapped in the interstitial pores of the clay region) is pulled up due to advection caused by evaporation flux. As water evaporates it precipitates the dissolved salt thereby increasing the salt concentration of the top layer of the channels. A concentration gradient of salt can develop in the conduits where the salt concentration of the subsurface water table is assumed to have a constant lower value. This initiates a diffusion process from the top layer to the bottom of the channel as indicated in Figure 1a. The mass transport of salt is determined by the combined processes of advection and diffusion and defined in terms of the Peclet number , where is the advection velocity, is a characteristic length scale and is the diffusion coefficient of the solution. If the competition between advection and diffusion causes the top layers of the crack channels to become supersaturated, crystallization of salt is facilitated along the crack edges.
Let the equilibrium salinity of the water table be , and the critical salt concentration at supersaturation be ; then the difference in salt concentration determines the rate of salt crystallization along the surface crack edges for a given ambient condition. Salt crystals keep accumulating along the crack edges to form ridges which self-organise to stable structures governed by the angle of repose of salt mounds. The pattern of the ridges follows the pattern of the crack network on the clay surface. Over a long period of time, as the clay surface goes through multiple wetting-drying cycles, the pattern of the crack network changes to attain the minimum energy configuration. The angles created at the junctions where two or more crack lines meet, evolve from to 13 and the crack pattern and therefore the salt ridge pattern becomes Voronoi-like14.
The Voronoi diagram is a collection of regions that tessellates a plane around a given set of points (seeds) such that every point in a region is closest to the corresponding seed. Given a finite number of points on a subset of the plane, the Voronoi regions are defined as . If the centroids of the polygons coincide with the seeds, then the Voronoi diagram is known as the centroidal Voronoi diagram. Many Voronoi-like patterns exist in nature and are often found to be associated with the optimization of material or energy15, 16, 17, 14. Images of salt ridges tessellating salt playas as reported by naturalists appear to resemble Voronoi mosaics. The Voronoi-ness of a real mosaic can be measured by comparing it with the Voronoi diagram generated using the centroids of the polygons as seeds. The Hausdorff metric111For compact subsets , the Hausdorff Metric is defined as , where . is used to measure the deviation of the salt ridge patterns from the corresponding Voronoi diagram.
In the following sections, we shall describe the model in detail starting from crack development under wetting drying cycles, to the governing equations of fluid flow in the conduits, to the process of crystallization and finally the stable formation of salt ridges. This will be followed by discussion of results of the simulation and the final conclusions.
2 The simulation model
Initial cracks
As water evaporates from clay or soil surfaces during desiccation, the matrix (clay/soil) develops stress due to capillary pressure in the pores 18. Desiccation causes the surface clay layers to fracture, releasing accumulated stress. Thus all crack faces are regions of zero stress. In our simulation, the cracks begin from random points and grow along a straight line till they collide with an existing crack. The initial crack network of the clay surface is mimicked by a Gilbert tessellation 12, 19 generated from a homogeneous Poisson point distribution of seeds. With desiccation, the lower layers of clay develop stress due to evaporation of water from the interstitial pores and the cracks extend vertically downwards with every drying step 14. These vertically extended cracks act as conduits that eventually connect with the subsurface water table.
Wetting-drying
The effect of wetting-drying is modelled via a connected spring network which is often used to mimic fracture mechanics20, 21, 22, 23, 24. After generating the Gilbert tessellation, all the polygons and nodes are detected. The nodes are connected to the centroids of those polygons that share the node via springs with spring constant . The natural length of a spring is set to - the distance between the node and the centroid of the polygon that the spring is connected to. During desiccation, the length of each spring contracts and during wetting the length expands according to the following rule –
| (1) |
Where , are constants and the negative sign is for drying and the positive sign is for wetting. It is assumed that while the drying process causes the shrinking of clay layers, during wetting the layers relax a little as water fills the interstitial pores space causing the clay to swell to some extent. The spring length is after successive drying and wetting steps; one time step is made up of a single drying followed by a wetting process, a schematic representation of the spring-model is shown in Figure 1b. The wetting-drying rule given by eq 1 is guided by experiments on clay evaporation rate under ambient conditions where complete drying is equivalent to of weight loss 25. The parameters and represent ambient conditions and clay characteristics respectively. The position of a node that is connected to the centroids of its neighbouring polygons with springs, is changed according to –
| (2) |
where the summation is over the springs that are connected to the node and is the change in length of the spring. Here with being the unit vector directed from the node toward the centroid of its neighbouring polygon. The crack segments follow the movements of the nodes and the shape of the crack network evolves with wetting-drying cycles.
Fluid dynamics and crystallization
During desiccation water evaporates from the top surface of the salt layer causing a suction pressure that draws water from the subsurface water table to replace the evaporated water. The desiccation pull is represented by a pressure which in effect controls the water flow through the channels. Subsurface water, specially in salt playa regions, is high in salinity. Thus as water evaporates from the water-carrying channels, the dissolved salt gets deposited on the channel’s top layers, increasing the salinity here. A salt concentration gradient develops that is directed from the upper to the lower layers of the channel, thereby initiating a diffusion flow in this direction, Figure 1b. The competition between advection and diffusion flows, characterised by the Peclet number , controls the salinity profile of the channels.
The governing equations that are solved following a finite difference method are the continuity equation for an incompressible fluid, the Navier-Stokes equation to solve the pressure and velocity field in the channel and the advection-diffusion equation:
| (3) | |||||
| (4) | |||||
| (5) |
where is solution velocity in a given grid cell, is the density, is viscosity, is salinity of water at any instant of time and is diffusion constant. The details of the discretisation are found in other works of the authors 26, 27.
The evaporation flux is proportional to the average vertical component of the velocity of water on the top exposed surface of any channel due to the pressure . Therefore the number of water cells evaporating per unit area at each time step , i.e. the evaporation flux is given by
where is the volume of a single grid cube of length , and is the porosity of the top surface of the salt playa. The probability of water evaporating from the top surface of a channel is guided by the evaporation flux, and done stochastically using a random number generator. When a cell’s water evaporates, the salt contained in the water is equally distributed among the neighbouring cells. At the top layer of the channels, if the salinity of water near the channel wall regions reaches a salinity , say , the excess salt crystallizes and deposits on top of the channel wall. The irregularities of the channel walls act as seeds for the crystallization process. It is assumed that the latent heat of crystallization released during crystallization does not affect the water temperature since water has a high latent heat. Examination of Figure 3b shows that the salinity gradient diffuses quickly to equilibrium within a few top layers of the pore channel. Hence solution density is kept constant in the model.
With wetting-drying cycles of the playas over many years, the crack mosaics evolve to form a stable equilibrium geometry that is referred to as the ‘matured’ state. Salt deposits along the crack edges shift with shifting crack pattern until the crack mosaic reaches maturation. Upon maturation when the crack pattern becomes static, salt crystals accumulate along the cracked boundaries and develop into ridges. In our model, the ridges are allowed to form stable structures through self-organisation by distributing the deposited crystals to nearest neighbour sites that have a lower potential energy (lower height). The self-organisation of the crystals occurs while maintaining an angle of repose of . An experimental determination of table salt (NaCl) procured from Tata Chemicals Ltd. showed an angle of repose of , Figure 3c. The angle of repose is dependent not only on the chemical composition of a salt, but also on parameters like grain size, shape, purity and its hygroscopic properties. Our model being generic in nature, we have maintained the angle of repose to for each of simulation.
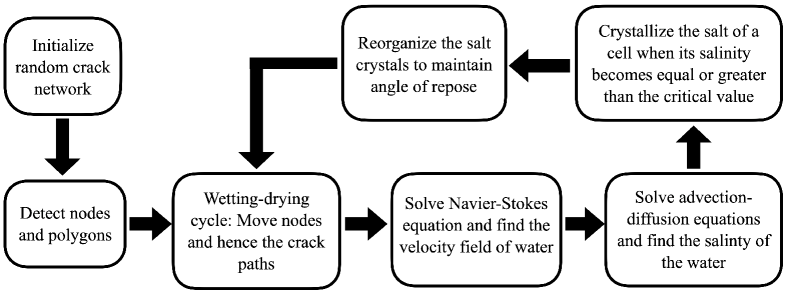
The flowchart of the simulation starting from surface crack formation and its evolution in time, control of evaporation flux that provides the draw pressure of saline water from the subsurface water table to the surface - the determination of pressure and velocity field in the crack channels - distribution of salt concentration in the channels due to the combined effect of advection and diffusion - crystallization of salt on the walls - and finally the self-organisation of the growing salt ridge to stable structures, is displayed in Figure 2.
3 Results and Discussion
The 3-D simulated polygonal salt ridges tessellating a playa as obtained from our model is displayed in Figure 3a. The lateral striations observed along the ridge walls are indicative of the self-organising of salt deposits to maintain the angle of repose to .
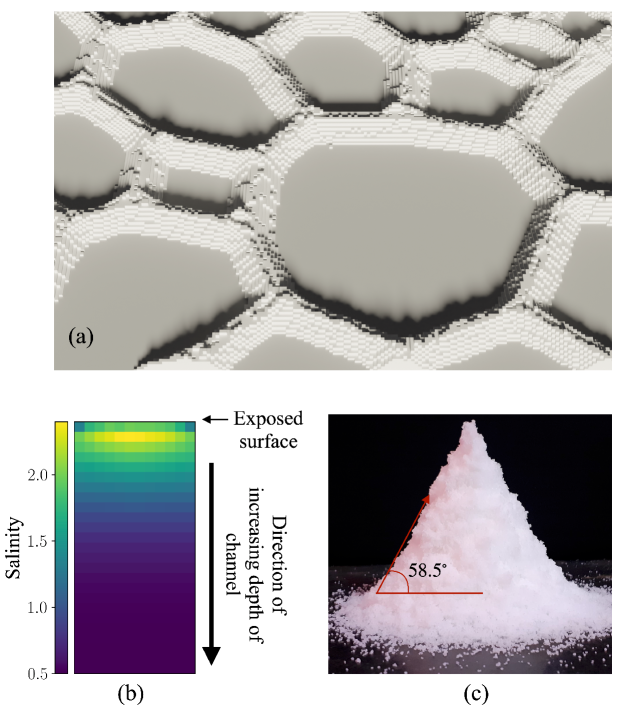
The rate of salt crystallization along the crack edges is a resultant of the combined effects of evaporation flux that determines the suction pressure , the diffusion coefficient of the saline solution, the equilibrium value of salt concentration of the subsurface water table and the critical salt concentration at which the solution becomes supersaturated and crystallization is initiated. The aforesaid parameters are in the CGS units in our simulation. For any salt solution, is a constant. An initial examination further revealed that the concentration difference rather than or is the important factor that determines the start of crystallization . Therefore we shall display and discuss our results with respect to variation of . Figure 3b is a screenshot of a typical distribution of salinity in a pore channel under the combined effects of and during the evaporation process. The colour legend moves from dark blue to yellow as the salinity increases from the initial concentration of to a high concentration of . The top layer of the channel indicates a lower salinity than the layer just below as it has contributed towards crystallization on the crack edge. The blue colour adjacent to the wall on the topmost layer has deposited the salt towards the formation of crystals and hence shows a lower salinity.
Though it is almost customary to describe advection-diffusion flow processes through variation of the Peclet number , we observe that the effect of advection and that of diffusion have very marked differences on the first crystallization time which gets masked if their combined effect through is used as a parameter. Hence we present and discuss the simulation results with respect to (responsible for the advection velocity ) and separately. We assume that the evaporation flux is vertical to the surface plane and not affected by other perturbations like wind velocity or changes in temperature or humidity.
First crystallization time dependence on evaporation flux
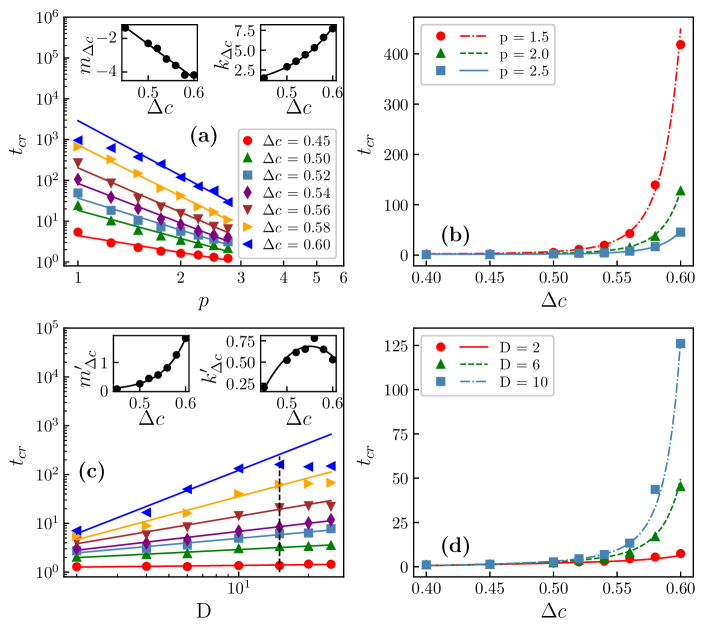
In the study of the dependence of crystallization on suction pressure for variation in , the diffusion coefficient is held constant at which though chosen heuristically, is guided by our results discussed in the forthcoming sections. We shall note that at higher values, increases exponentially while too small a value is almost masked by the effect of advection. A log-log plot of versus , Figure 4a, shows a power-law dependence with exponent and slope , both being functions of . The unit of time is taken to be equal to one time step of our simulation.
| (6) |
The first crystallization time increases in an almost linear manner for low evaporation rates and for ; however increases non-linearly thereafter. When is small, even a small evaporation flux induces sufficient advection to enable crystallization in the top layer of the channels, hence is attained quickly. The effect of diffusion is felt only when is sufficiently large as diffusion flow occurs in opposition to advection, see Figure 1. Hence a longer time is required before the top layer of the channels reaches the state of super-saturation. However, if advection is increased sufficiently by increasing evaporation flux, the effect of diffusion is almost negated by strong advection and the value of asymptotically tends to a constant value for any . The insets of Figure 4a show that decreases linearly for the entire range of and except for at . increases exponentially with , i.e.
| (7) | |||||
| (8) |
where, , , and are functions of and hence, constants for a given . Figure 4a shows a negative with positive but shows a positive exponential increase with . Combining eqs (6 – 8),
| (9) |
i.e.,
| (10) |
Equation 9 captures the relation between the time of first crystallization , and .
In eq 10, the first term of the exponential is negative as is negative, and the second term is positive as both and are positive. For the range of studied here, the positive term is always larger than the first term and this is reflected in the positive exponent of the exponential. For large , tends to as the exponent . Figure 4b displays simulation results for the variation of and for different and constant values; the lines in the graph are plotted from the analytical expression of eq 10. The good match between simulation data and calculated values establishes the self-consistency of the model.
First crystallization time dependence on Diffusion coefficient
Salt playas can have salts of different chemical compositions depending upon the geographical location. Principal salts in salt pans are halite (), but other salts like gypsum (),
mirabilite (), thenardite (),
epsomite () and trona
() are found too.
Potash-rich saline pans have been reported
from the Chaidam Basin of China 28, 29 that are rich in sylvite () and
carnallite (. The diffusion coefficient for each of these salt solutions will be different under identical ambient conditions. As our model is generic, an analysis was done to check the dependence of salt crystallization time on the diffusion coefficient of the saline solution. We observe that increases non-linearly with increasing , and displays a power-law dependence when plotted on a log-log scale with as depicted in Figure 4c. Thus
| (11) |
As increases, the time of first crystallization increases as expected since diffusion impedes the attainment of supersaturation of the salt at the top layer of the channel for all . Both and are functions of . increases exponentially with as displayed in the inset of Figure 4c, while shows a parabolic variation with .
| (12) | |||||
| (13) |
Here , , , and are constants for constant evaporation flux. Of the factors , and are positive while is negative ; however for the range of and values chosen, the exponent remains positive. Combining eqs ( 11 – 13), we get –
| (14) |
Equation 14 is validated from the simulation results displayed in Figure 4d where the exponential curve (denoted by lines) drawn using eq 14 almost exactly fits the simulation data obtained for versus for constant values of . Thus the simulation model produces self-consistent results.
When Figure 4c is examined carefully for higher values of , demarcated by a vertical dashed line, it is observed that the first crystallization time becomes a constant for all for any constant . This is more clearly evident for in the figure. It is to be noted that while advection flow transfers mass in only the direction of the pressure field, diffusion distributes mass equally to all the neighbouring cells, i.e. in effect only of the mass transferred by diffusion is directed opposite to advection mass transfer. This is true for any value of . When is high (in our simulation ), as the top layer of the channel starts crystallization, the combative contribution of the partial diffusive mass transfer in the direction opposite to advection is erased by the extremely small difference in salinity that exists between successive layers at the top of the channel, Figure 3b. Hence shows no further change with an increase in , i.e. it becomes diffusion-limited.
Crystal growth
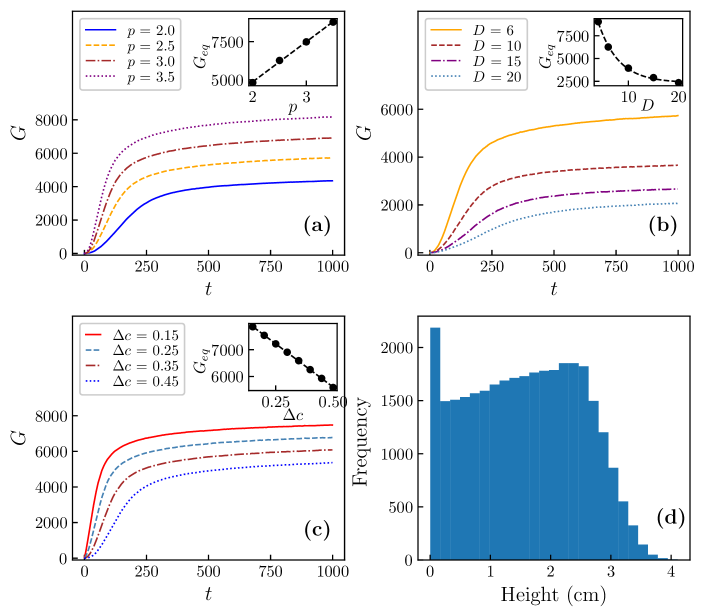
The effect of each of the variables , and on crystal growth rate was tracked with time on the matured crack mosaic; when one parameter was varied, the other parameters were held constant. In each case, the salt growth rate increased sharply at first and then levelled to a constant plateau when the flow reached a state of dynamic equilibrium, showing a sigmoidal variation, Figures (5a - 5c). The sigmoid function is a cumulative distribution function of the log-normal distribution. The log-normal distribution has been reported specially in the case of random nucleation and growth processes30 where the crystallization seed is formed randomly during the simultaneous growth of other crystals. However, these growth processes have also been reported to occur otherwise31.
The crystal growth rate increased sharply within approximately the first 100 time steps, though this variation in rate is different for the parameters , and ; the rise was sharpest with change in and slowest for change in . When is varied the flow control parameters and are kept constant; hence the sharp increase is attributed to the quick attainment of super-saturation in the top few layers of the pore channel that are quite close to . Figure 3b shows that below the top layers in a channel, the salinity diffuses out rather sharply. Hence the rate of crystallization flattens which is indicative of the interplay of and before dynamic equilibrium is reached. The value of decreases linearly with increasing as shown in the inset of Figure 5c.
The insets of Figures 5a and 5b show that while increases monotonically and linearly with an increase in advection pressure ; when is increased decreases exponentially. In any flow system, the diffusion velocity is the slowest and only of its value can oppose the advection flow direction in a 3-D system. Therefore as increases, the crystal growth rate change takes a longer time to decrease.
Figure 5d displays a typical histogram of ridge height across the salt playa after 1000 time-steps. This data was collected using arbitrarily chosen values of , and . The ridge height is across the salt playa which is of the same order of observed reports1. This indicates that the order of , , and the angle of repose are realistic.
System Energy and Voronoi-ness
The total energy of a mud plane with deep vertical cracks can be expressed as a sum of three terms – (i) which factors all energy contributions except elastic energy and fracture energy, (ii) elastic energy of the mud columns and (iii) fracture energy spent to create new crack area. In our model, we assume to be constant for playas under similar ambient conditions. The evolution of the playas under identical conditions is determined by the mechanical property of the system. Therefore during the process of crack evolution, the total mechanical energy change in a simulation time-step involves contributions from the last two terms only.
The elastic energy at any time step is proportional to the change in volume of the matrix columns in that time step. This is given by , where is the cross-sectional area of the column and is the change in the depth of the column in the time step. We assume that the playa matrix is homogeneous and isotropic in the plane transverse to the direction of evaporation. Hence all matrix columns crack by equal infinitesimal vertical depths of in a single time step. is a parameter that represents the characteristics of the playa system. During each wetting-drying cycle, a new surface of opens up, where is the total length of the crack channels in the transverse plane. The fracture energy to create this new surface is given by , where is the fracture energy per unit area. Therefore, the total energy of the system per unit height is
| (15) |
Plotting the total area of the polygons and the length at every time step reveals that the total area of the polygons is practically constant. However, it is the total crack length that changes with time. Thus, while the area of the playa remains constant in our simulation, the shape of the polygons changes with wetting-drying cycles. The shape of the polygons can be quantified using the iso-perimetric ratio defined as , where is the area of a polygon and is its perimeter. The value of is 1 for circles and for needle-like polygons, the value approaches 0. For a mosaic, the iso-perimetric ratio is the average over all the polygons in the mosaic, . Substituting in terms of and the total area of the playa as constant in eq 6, the total mechanical energy at every time step is expressed in terms of the iso-perimetric ratio (for details see Haque et. al17, 14)
| (16) |
where and are constants. Figure 6a shows that the energy decreases with wetting–drying cycles as the patterns become stable.
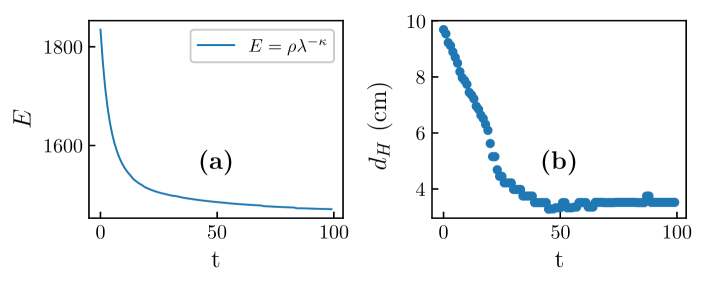
The Hausdorff metric for the salt ridge pattern and the corresponding Voronoi diagram is measured at each wetting–drying cycle as shown in Figure 6b. The Hausdorff metric decreases with the wetting–drying cycles as the ridge pattern becomes more Voronoi-like. Thus the evolution of salt playas is an effort towards the minimization of total system energy during which the playa graduates towards a centroidal Voronoi mosaic.
4 Conclusions
Salt playas with their tessellated surface of hexagonal polygons of salt ridges are beautiful and intriguing, and have been a challenge to the scientific community for a realistic and physically meaningful model that can provide a thorough explanation of their formation. In this work, we have investigated the formation phenomenon via suitable modelling and simulation of the dynamical processes that are responsible.
Principles of fracture mechanics have been used to simulate crack formation of the playa surface using a spring network model. Periodic wetting-drying cycles are mimicked by their effects on the spring model that allow the initial crack mosaic tessellating the playa surface to mature into almost hexagonal polygons that tile the playa to minimize the net energy of the system. Surface cracks proceed vertically downwards with time to form crack conduits connecting the subsurface water table to the playa surface.
We implement fluid transport in the crack conduits to establish the pressure and velocity field in the channels by solving the Navier-Stokes equation following the finite difference method. The evaporation flux determines the pressure on the playa surface that draws the salty water from the subsurface water table to the surface. Evaporation from the top of the channels is a stochastic process that results in an increase in salt concentration there. The salinity distribution in a typical crack channel is determined by solving the advection-diffusion equation of mass transport. Salt crystallization has been allowed on the crack edge of a channel provided a critical salt concentration is reached at the top layer. It is assumed that the crack edge roughness presents nucleation sites for crystallization to occur.
As the deposited salt at the crack edge grows in time, the ridge self-organises to distribute the heaped salt to neighbouring sites with equal probability to maintain an angle of repose as reported in the literature. However, we have not allowed salt melting in our model. The parameters of the model - evaporation flux pressure , salt diffusion coefficient , the difference between the initial and supersaturation salinity have been examined separately to investigate the time of first crystallization and growth rate dynamics. is a function of all three parameters in general, but is a function of and for any given salt playa. We have analysed the interdependence of the parameters on and found the results consistent with our simulation results.
The growth rate of the salt ridges reaches a state of dynamic equilibrium eventually. The rate of change of crystal growth rate follows a log-normal dependence with time as reported in random nucleation during crystallization growth processes. The diffusion coefficient of different salt playas appears to be the most important parameter that determines the attainment of dynamic equilibrium, establishing mass transport to be diffusion-limited.
Combining all the various dynamical processes judiciously, we have successfully modelled the Voronoi-like mosaic of the salt ridges that tessellate salt playas as evident from real images of the same. Further, It has been proved that all these non-linear processes occur in tandem to minimize the system energy.
We have employed fracture mechanics, principles of energy minimization of system, fluid and mass transport in fracture channels and processes of crystallization and self organisation to finally replicate the almost Voronoidal pattern of salt ridges that tessellate salt playas. To the best of our knowledge, this is the first complete exposition of the phenomena - Voronoidal pattern of ridges of salt observed in salt playas.
5 Acknowledgement
R A I Haque acknowledges support from UGC-funded research fellowships (UGC-ref No. 1435/ CSIR-UGC NET JUNE 2017). The authors are grateful to Prof. S. Tarafdar for useful discussions. The authors would like to thank Richard Gibson and Michael Stickney for their helpful comments on the geology of salt playas.
References
- Lowenstein and Hardie 1985 Lowenstein, T. K.; Hardie, L. A. Criteria for the recognition of salt-pan evaporites. Sedimentology 1985, 32, 627–644
- Christiansen 1963 Christiansen, F. W. Polygonal Fracture and Fold Systems in the Salt Crust, Great Salt Lake Desert, Utah. Science 1963, 139, 607–609
- Hardie et al. 1978 Hardie, L. A.; Smoot, J. P.; Eugster, H. P. Modern and Ancient Lake Sediments; John Wiley & Sons, Ltd, 1978; pp 7–41
- Rettig et al. 1980 Rettig, S.; Jones, B.; Risacher, F. Geochemical evolution of brines in the Salar of Uyuni, Bolivia. Chemical Geology 1980, 30, 57–79
- Krinsley 1970 Krinsley, D. A geomorphological and paleoclimatological study of the playas of Iran. US Geol. Surv. Rep. 1970,
- Wooding 1960 Wooding, R. A. Rayleigh instability of a thermal boundary layer in flow through a porous medium. Journal of Fluid Mechanics 1960, 9, 183–192
- Homsy and Sherwood 1976 Homsy, G. M.; Sherwood, A. E. Convective instabilities in porous media with through flow. AIChE Journal 1976, 22, 168–174
- Wooding et al. 1997 Wooding, R. A.; Tyler, S. W.; White, I.; Anderson, P. A. Convection in groundwater below an evaporating Salt Lake: 2. Evolution of fingers or plumes. Water Resources Research 1997, 33, 1219–1228
- Wooding 2007 Wooding, R. A. Variable-density saturated flow with modified Darcy’s law: The salt lake problem and circulation. Water Resources Research 2007, 43
- Van Dam et al. 2009 Van Dam, R. L.; Simmons, C. T.; Hyndman, D. W.; Wood, W. W. Natural free convection in porous media: First field documentation in groundwater. Geophysical Research Letters 2009, 36
- Lasser et al. 2023 Lasser, J.; Nield, J. M.; Ernst, M.; Karius, V.; Wiggs, G. F. S.; Threadgold, M. R.; Beaume, C.; Goehring, L. Salt Polygons and Porous Media Convection. Phys. Rev. X 2023, 13, 011025
- Gilbert and Noble 1967 Gilbert, E.; Noble, B. Surface films of needle-shaped crystals. Applications of undergraduate mathematics in engineering 1967, 329–346
- Goehring et al. 2010 Goehring, L.; Conroy, R.; Akhter, A.; Clegg, W. J.; Routh, A. F. Evolution of mud-crack patterns during repeated drying cycles. Soft Matter 2010, 6, 3562–3567
- Haque et al. 2023 Haque, R. A. I.; Mitra, A. J.; Tarafdar, S.; Dutta, T. Evolution of polygonal crack patterns in mud when subjected to repeated wetting–drying cycles. Chaos, Solitons & Fractals 2023, 174, 113894
- Budkewitsch and Robin 1994 Budkewitsch, P.; Robin, P.-Y. Modelling the evolution of columnar joints. Journal of Volcanology and Geothermal Research 1994, 59, 219–239
- Jagla and Rojo 2002 Jagla, E. A.; Rojo, A. G. Sequential fragmentation: The origin of columnar quasihexagonal patterns. Phys. Rev. E 2002, 65, 026203
- Haque et al. 2022 Haque, R. A. I.; Roy, A.; Mitra, A. J.; Tarafdar, S.; Dutta, T. Evolution of Tiling-like Crack Patterns in Maturing Columnar Joints. Langmuir 2022, 38, 7035–7045, PMID: 35612996
- Goehring et al. 2015 Goehring, L.; Nakahara, A.; Dutta, T.; Kitsunezaki, S.; Tarafdar, S. Desiccation Cracks and their Patterns: Formation and Modelling in Science and Nature; Statistical Physics of Fracture and Breakdown; Wiley-VCH, 2015
- Roy et al. 2022 Roy, A.; Haque, R. A. I.; Mitra, A. J.; Tarafdar, S.; Dutta, T. Combinatorial topology and geometry of fracture networks. Phys. Rev. E 2022, 105, 034801
- Bolander and Sukumar 2005 Bolander, J. E.; Sukumar, N. Irregular lattice model for quasistatic crack propagation. Phys. Rev. B 2005, 71, 094106
- Khatun et al. 2012 Khatun, T.; Choudhury, M. D.; Dutta, T.; Tarafdar, S. Electric-field-induced crack patterns: Experiments and simulation. Phys. Rev. E 2012, 86, 016114
- Kitsunezaki 2013 Kitsunezaki, S. Cracking condition of cohesionless porous materials in drying processes. Phys. Rev. E 2013, 87, 052805
- Tarafdar and Dutta 2019 Tarafdar, S.; Dutta, T. Formation of desiccation crack patterns in electric fields: a review. Philosophical Transactions of the Royal Society A: Mathematical, Physical and Engineering Sciences 2019, 377, 20170398
- Sadhukhan et al. 2019 Sadhukhan, S.; Kumar, A.; Kulkarni, G. U.; Tarafdar, S.; Dutta, T. A spring network simulation in three dimensions for designing optimal crack pattern template to fabricate transparent conducting electrodes. Bulletin of Materials Science 2019, 42, 197
- Sadhukhan et al. 2007 Sadhukhan, S.; Majumder, S. R.; Mal, D.; Dutta, T.; Tarafdar, S. Desiccation cracks on different substrates: simulation by a spring network model. Journal of Physics: Condensed Matter 2007, 19, 356206
- Sadhukhan and Dutta 2018 Sadhukhan, S.; Dutta, T. Existence of convective threshold and its role on temperature in reactive flow through fractured rocks: a simulation study in 2D. Journal of Physics Communications 2018, 2, 045033
- Dutta Choudhury et al. 2015 Dutta Choudhury, M.; Dutta, T.; Tarafdar, S. Growth kinetics of NaCl crystals in a drying drop of gelatin: transition from faceted to dendritic growth. Soft Matter 2015, 11, 6938–6947
- Qi et al. 1993 Qi, H.; Ku, T.-L.; Phillips, F. M. Evolutionary characteristics of lakes and palaeoclimatic undulation in the Qaidam Basin, China. Chinese Journal of Oceanology and Limnology 1993, 11, 34–45
- Wang et al. 2023 Wang, K.; Zhang, Y.; Han, J.; Ma, L.; Zheng, M.; Wu, Y.; Yang, B. Distribution and Genesis of Potassium-Bearing Minerals in Lop Nor Playa, Xinjiang, China. Minerals 2023, 13
- Garside and Ristić 1983 Garside, J.; Ristić, R. Growth rate dispersion among ADP crystals formed by primary nucleation. Journal of Crystal Growth 1983, 61, 215–220
- Bergmann et al. 1997 Bergmann, R. B.; Krinke, J.; Strunk, H. P.; Werner, J. H. Deposition and Characterization of Polycrystalline Silicon Films on Glass for thin Film Solar Cells. MRS Online Proceedings Library 1997, 467, 325–330