3cm3cm2cm2cm
![[Uncaptioned image]](/html/2312.01621/assets/ISMD-2023-logo.png)
Simple Lévy -stable model analysis of elastic and low- data from SPS to LHC energies
Abstract
A simple Lévy -stable (SL) model is used to describe the data on elastic and scattering at low- from SPS energies up to LHC energies. The SL model is demonstrated to describe the data with a strong non-exponential feature in a statistically acceptable manner. The energy dependence of the parameters of the model is determined and analyzed. The Lévy parameter of the model has an energy-independent value of 1.959 0.002 following from the strong non-exponential behavior of the data. We strengthen the conclusion that the discrepancy between TOTEM and ATLAS elastic differential cross section measurements shows up only in the normalization and not in the shape of the distribution of the data as a function of . We find that the slope parameter has different values for and elastic scattering at LHC energies. This may be the effect of the odderon exchange or the jump in the energy dependence of the slope parameter in the energy interval 3 GeV 4 GeV.
1 Introduction
In a recent work [1], we formulated the real extended Levy -stable generalized Bialas-Bzdak (LBB) model as the generalization of the Real extended Bialas-Bzdak (ReBB) model. In the latter model, the assumed quark and diquark constituents of the proton have Gaussian parton distributions and also the distance between these constituents has a Gaussian shape. The Gaussian distribution is the special case of the Levy -stable distribution. The ReBB model gives a statistically acceptable description to the proton-proton () and proton-antiproton () elastic scattering data in a limited kinematic range [2, 3] that does not include the low- domain characterized by a strong non-exponential shape. The LBB model with Levy -stable parton and distance distributions may reproduce the strong non-exponential behavior seen in the low- data. To apply the full LBB model to analyze the data, however, we need to solve the problem of integrating products of two-dimensional Levy -stable distributions, and access to relatively high computing resources is necessary. As a temporal solution, we introduced approximations that are valid at the low- domain of elastic scattering lading to a simple Levy -stable (SL) model [1]. We demonstrated that the SL model describes the non-exponential low- differential cross section of scattering at 8 TeV in a statistically acceptable manner. The ReBB model does not reproduce this strong non-exponential feature of the data.
The SL model gives the following shape to the elastic differential cross section:
| (1) |
where , , and are fit parameters to be determined at a given energy. The parameter is called the optical point as this is the value of the differential cross section at . The parameter is the Levy slope parameter and is the Levy parameter. The cease corresponds to a Gaussian impact parameter profile and an exponential differential cross section. In case , the impact parameter profile is Levy -stable distributed having a long tale and the differential cross section is non-exponential as a function of .
In the framework of the Regge approach, the non-exponential behavior of the elastic differential cross section at ISR [4, 5, 6] and later also at TEVATRON and LHC [7, 8, 9, 10, 11, 12] was related to the branch point of -channel scattering amplitude and hence is explained as the manifestation of -channel unitarity. According to the findings of Refs. [13, 14] the low- non-exponential behavior of elastic differential cross-section can be a consequence of an interplay between the real parts of the Coulomb and nuclear amplitudes.
In this work we use the SL model as defined by Eq. (1) to analyze the low- and elastic scattering data in the energy range that includes SPS and LHC energies. The details and results of the fits are presented in Sec. 2. The energy dependence of the parameters of the model is determined in Sec. 3. The results are discussed in Sec. 4 and summarized in Sec. 5.
2 Fits
The fitting procedure was performed by using a definition which relies on a method developed by the PHENIX Collaboration [15]. This definition is equivalent to the diagonalization of the covariance matrix of statistical and systematic uncertainties if the experimental errors are separated into three different types:
-
•
type a: point-to-point varying uncorrelated systematic and statistical errors;
-
•
type b: point-to-point varying and 100% correlated systematic errors;
-
•
type c: point-independent, overall correlated systematic uncertainties, that scale all the data points up and down by the same factor.
We categorized the available experimental uncertainties into these three types as follows: horizontal and vertical -dependent statistical errors (type a), horizontal and vertical -dependent systematic errors (type b), and overall normalization uncertainties (type c). The function used in the fitting procedure is:
| (2) |
where
| (3) |
| (4) |
is the number of fitted data points, is the th measured data point and is the corresponding value calculated from the model; is the type error of the data point , is the type c overall error given in percents, denotes the numerical derivative in point with errors of type , denoted as ; is the correlation coefficient for type error. These correlation coefficients are fitted to the data and must be considered as both free parameters and data points not altering the number of degrees of freedom. The definition, Eq. (2), was utilized and further detailed in Ref. [2].
The SL model was fitted using the above detailed definition, Eq. (2), to all the available and differential cross-section data in the kinematic range of 0.546 TeV TeV and 0.02 GeV2 GeV2. This means 11 different data sets. The values of the parameters of the model at different energies as well as the confidence levels of the fits and the data sources are shown in Table 1. One can see that the confidence level (CL) values range from 8.8% to 96% implying that the SL model represents the data in a statistically acceptable manner. We regard a fit by a model to be a statistically acceptable description in case 0.1 % CL 99.9 %.
| [GeV] | data from | [mb/GeV2] | [GeV-2] | CL (%) | |
|---|---|---|---|---|---|
| 546 | UA4 [16] | 1.93 0.09 | 209 15 | 15.8 0.9 | 18.1 |
| 1800 | E-710 [17] | 2.0 1.5 | 270 24 | 16.2 0.2 | 77.1 |
| 2760 | TOTEM [18] | 1.6 0.3 | 637 25 | 28 11 | 20.5 |
| 7000 | TOTEM [19] | 1.95 0.01 | 535 30 | 20.5 0.2 | 8.8 |
| 7000 | ATLAS [20] | 1.97 0.01 | 463 13 | 19.8 0.2 | 96.0 |
| 8000 | TOTEM [21] | 1.955 0.005 | 566 31 | 20.09 0.08 | 43.9 |
| 8000 | TOTEM [22] | 1.90 0.03 | 582 33 | 20.9 0.4 | 19.6 |
| 8000 | ATLAS [23] | 1.97 0.01 | 480 11 | 19.9 0.1 | 55.8 |
| 13000 | TOTEM [24] | 1.959 0.006 | 677 36 | 20.99 0.08 | 76.5 |
| 13000 | TOTEM [25] | 1.958 0.003 | 648 95 | 21.06 0.05 | 89.1 |
| 13000 | ATLAS [26] | 1.968 0.006 | 569 17 | 20.84 0.07 | 29.7 |
3 Energy dependence
Using the values of the parameters of the model at different energies given in Table 1, we determined the energy dependence of these parameters.
Table 1 indicates that the TOTEM datasets at 7, 8 and 13 TeV, as well as the ATLAS dataset at TeV feature a strongly non-exponential shape with significantly less than 2. The other datasets provide a less precise value for this Levy exponent.
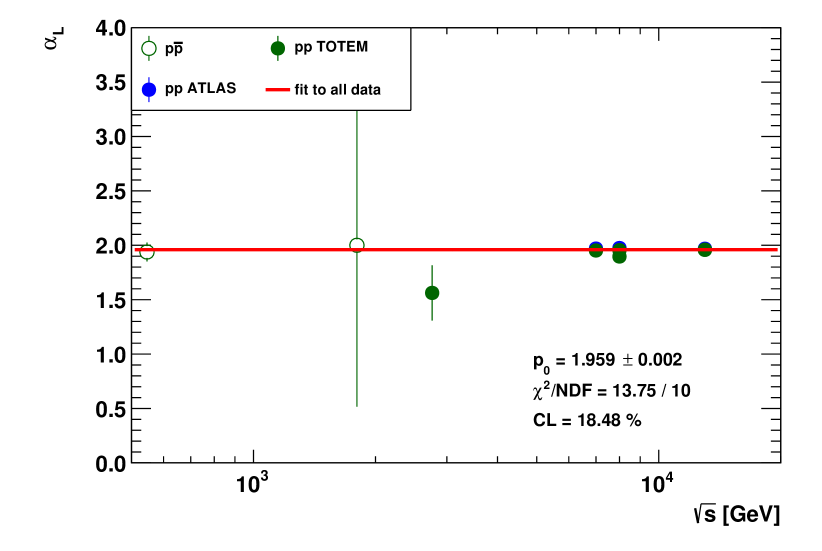
The parameters can be fitted with an energy independent constant value, as shown in Fig. 1. This average, constant value of the parameter is consistent with all the measurements, with . Although this average value is close to the Gaussian case, that corresponds to an exponentially shaped cone of the differential cross section of elastic scattering, its error is small and thus the constant value of is significantly less than 2. This indicates that a strongly non-exponential SL model is consistent with all the low- datasets cited in Table 1.
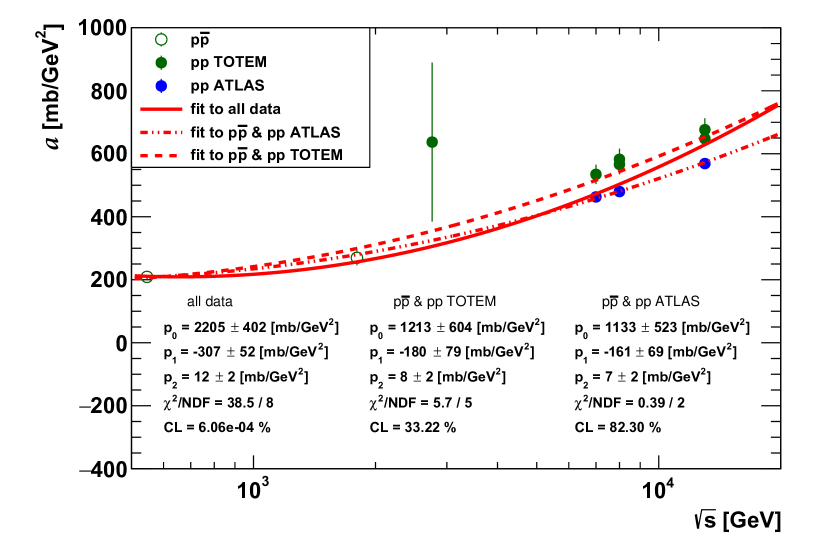
The energy dependence of the optical point is shown in Fig. 2. For and ATLAS or and TOTEM data in the energy range 0.546 TeV TeV the energy dependence of the optical point is compatible with a quadratically logarithmic shape,
| (5) |
For and ATLAS data the values of the parameters in Eq. (5) are mb/GeV2, mb/GeV2, and mb/GeV2 resulting a confidence level of . For and TOTEM data the parameter values are mb/GeV2, mb/GeV2, and mb/GeV2 resulting a confidence level of . A fit by the parametrization Eq. (5) that includes parameter values for all data – , ATLAS, and TOTEM – is statistically not acceptable since its confidence level is 6.06.
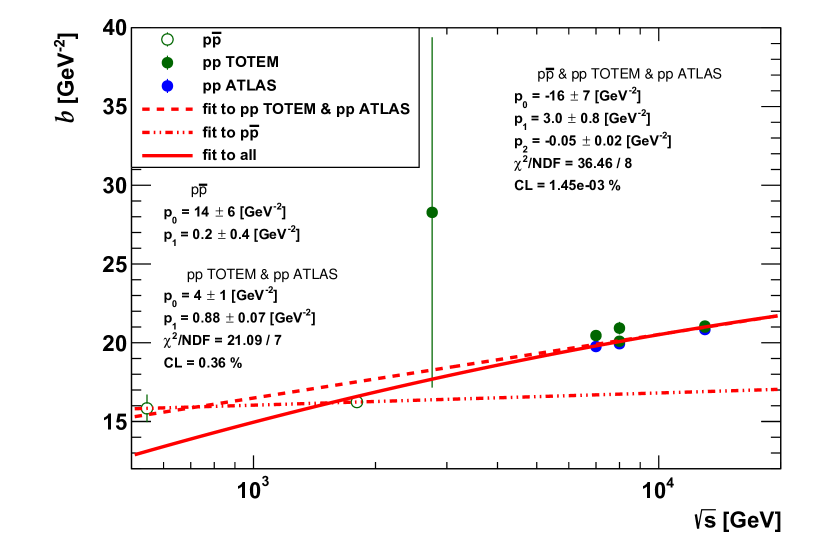
The energy dependence of the slope parameter is shown in Fig. 3. For ATLAS and TOTEM data the energy dependence of the parameter is compatible with a linearly logarithmic shape,
| (6) |
with GeV-2 and GeV-2 resulting a confidence level of . This result, illustrated in Fig. 3, when taken together with the results of Fig. 1 and Fig. 2, suggests that ATLAS and TOTEM data in the low region have a consistent non-exponential shape, but differ in their overall normalization.
The values of the parameter for data lie on the line given by Eq. (6) with parameters GeV-2 and GeV-2. These values are significantly different from the values of linearity for elastic collisions. The fit for the parameter values of all data – , ATLAS, and TOTEM – even by the quadratic parametrization Eq. (5) is statistically not acceptable as it has a too small confidence level of .
4 Discussion
In this work we fitted the low- elastic and differential cross section in the center of mass energy range 0.546 TeV TeV. To do this we used the SL model as defined by Eq. (1). Another popular empirical parametrisation for the low- non-exponential differential cross section is [21, 1]
| (7) |
where is the optical point parameter, is the slope parameter, and is the curvature parameter. The tilde is to distinguish between the parameters in the SL model, Eq. (1), and in the model given by Eq. (7). The effect of the quadratic term in the exponent of Eq. (7) is reproduced in our model by an parameter value less than 2.
An exponential differential cross section corresponds to a Gaussian impact parameter profile. The Gaussian distribution is the special case of the more general Lévy -stable distributions. The experimentally observed non-exponetial differential cross section indicates that the impact parameter profile rather has a Lévy -stable shape resulting the SL model given by Eq. (1). Accordingly, it may be more natural to use Eq. (1) instead of Eq. (7) to model the experimental data.
As an illustrative example, the SL model fit to the most precise TOTEM data measured at 13 TeV [25] is shown in Fig. 4 and the case with fixed is shown in Fig. 5. The SL model with describes the 13 TeV TOTEM data with CL = 89.12 % while the fixed case fit has a confidence level of 3.6 %. These values are not surprising if one compares the bottom panel of Fig. 4 to the bottom panel of Fig. 5. This result clearly shows the need for an parameter value slightly but in a statistical sense significantly less than 2.
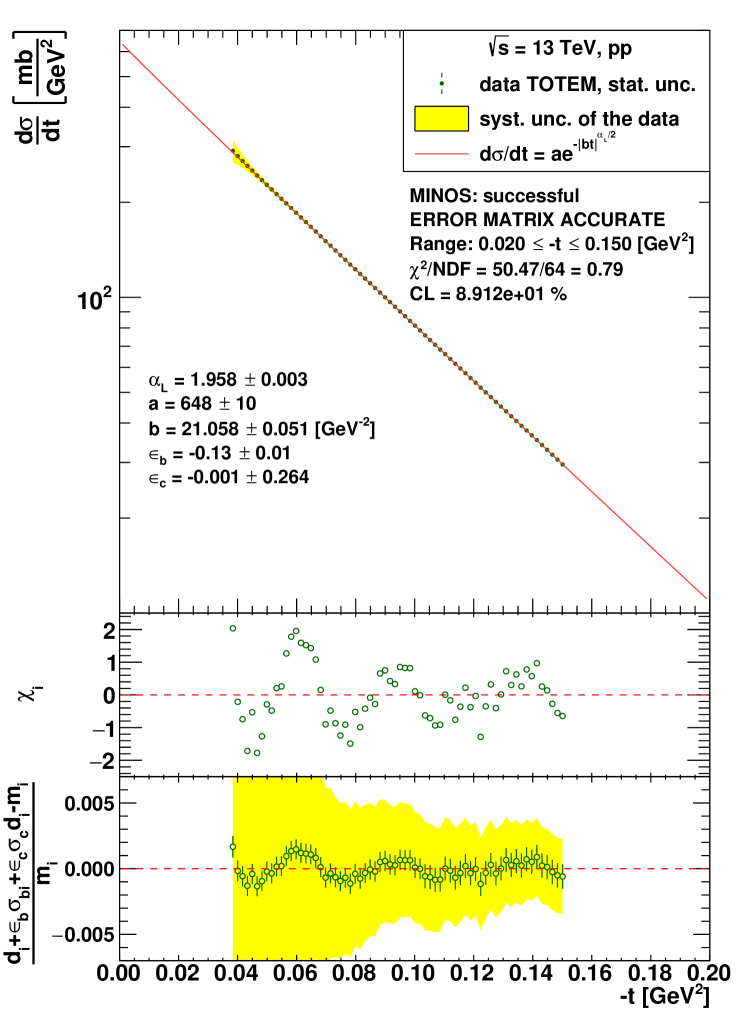
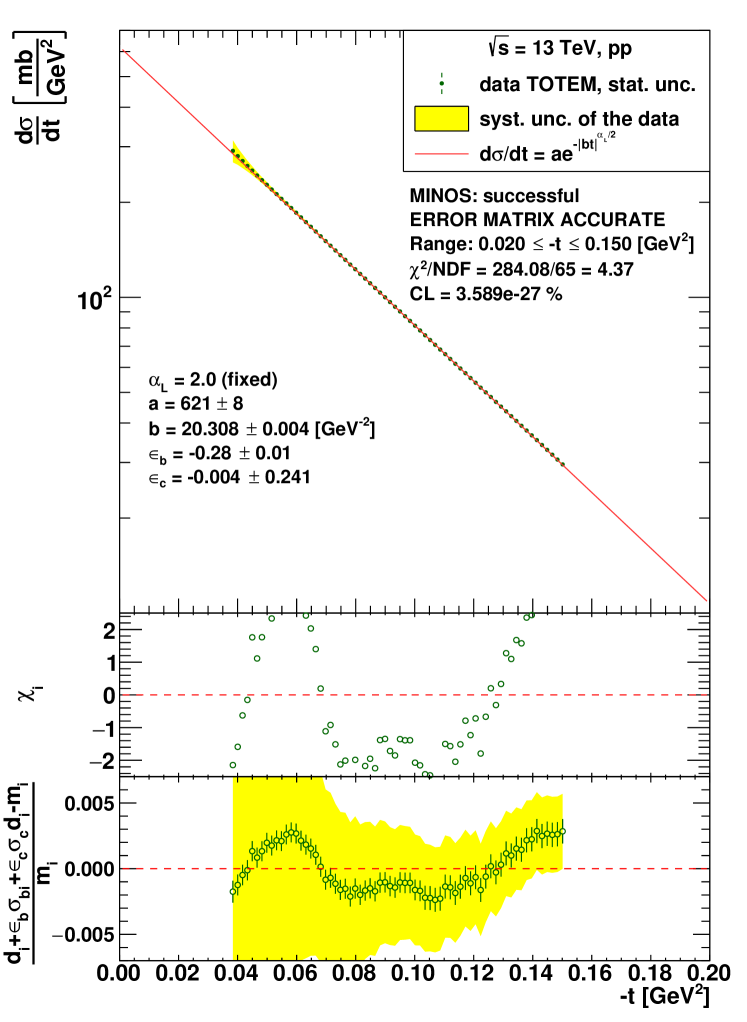
Looking at the bottom panel of Fig. 4 one can observe some oscillations in the data. This oscillation is a significant effect when only the statistical errors are considered. If systematic errors are taken into account too, this oscillation effect disappeares. This conclusion is clear from the confidence level of the description by the SL model that does not have an oscillatory shape.
Let us now discuss the energy dependence of the SL model parameters.
According to our analysis, surprisingly, the parameter of the SL model is energy-independent and its value is slightly but in a statistical sense significantly less than 2 implying a Lévy--stable-shaped, power-law tail feature for impact parameter profile of elastic and scattering.
We showed in Sec. 3 that the energy dependence of the optical point parameter of the SL model is compatible with a quadratically logarithmic shape, however, the parameter values determined from ATLAS and TOTEM data on elastic scattering disagree. This discrepancy is a well-known fact and the interpretation is that the ATLAS and TOTEM experiments use different methods to obtain the absolute normalization of the measurements [26].
We saw in Sec. 3 that and parameter values lie in different curves. There are are two alternative interpretations. The TOTEM Collaboration discussed in Ref. [27] that there is a jump in the energy dependence of the slope parameter in the energy interval of 3 GeV 4 GeV. One of the possibilities is that the same jump is seen in our analysis too, preventing the lower energy data to lie in the same curve with the higher energy LHC ATLAS and TOTEM data. The second possibility is that the difference between the and slope is the effect of the odderon [28]. New low- measurements at LHC at 1.8 and/or 1.96 TeV may clarify this issue.
5 Summary
We fitted the and elastic differential cross section with a simple Lévy -stable model in the center of mass energy range 0.546 TeV TeV and in the four-momentum transfer range 0.02 GeV2 GeV2. We determined the energy dependence of the three parameters of the model. The Lévy index of stability, results are consistent with an energy independent, constant value, that is slightly but significantly smaller than 2. The energy dependence of the optical point parameter is the same for and processes and has a quadratically logarithmic shape, however, because of normalization differences, TOTEM and ATLAS optical point data are not the same within experimental errors. Thus they can be fitted separately from one another, furthermore, both can be fitted together with data, however, the ATLAS and TOTEM optical points cannot be fitted together, neither without, nor with the data.
In our Lévy analysis we observe that the Lévy slope parameter has different energy dependence for and scattering. This may be an odderon signal [28] or the “jumping” behavior in the energy interval of 3 GeV 4 GeV as discussed by TOTEM in Ref. [27]. New low- measurements at LHC at 1.8 and/or 1.96 TeV may decide which interpretation is true. We also find that TOTEM and ATLAS slope parameter data can be fitted together with a linearly logarithmic shape indicating that TOTEM and ATLAS data different only in their normalization, but their shape is consistent. Similar conclusions were drawn in Ref. [29] concerning the TOTEM-ATLAS discrepancy at 13 TeV.
Acknowledgements
We gratefully acknowledge the inspiring discussions with A. Ster and V. Petrov and the support from NKFIH Grants no. K133046, K147557 and 2020-2.2.1-ED-2021-00181; MATE KKP 2023; ÚNKP-23-3 New National Excellence Program of the Ministry for Culture and Innovation from the source of the National Research, Development and Innovation Fund.
References
- [1] T. Csörgő, S. Hegyi and I. Szanyi, Universe 9, 361 (2023), arXiv:2308.05000 [hep-ph], doi:10.3390/universe9080361.
- [2] T. Csörgő and I. Szanyi, Eur. Phys. J. C 81, 611 (2021), arXiv:2005.14319 [hep-ph], doi:10.1140/epjc/s10052-021-09381-5.
- [3] I. Szanyi and T. Csörgő, Eur. Phys. J. C 82, 827 (2022), arXiv:2204.10094 [hep-ph], doi:10.1140/epjc/s10052-022-10770-7.
- [4] G. Cohen-Tannoudji, V. V. Ilyin and L. L. Jenkovszky, Lett. Nuovo Cim. 5S2, 957 (1972), doi:10.1007/BF02777999.
- [5] A. A. Anselm and V. N. Gribov, Phys. Lett. B 40, 487 (1972), doi:10.1016/0370-2693(72)90559-X.
- [6] C.-I. Tan and D. M. Tow, Phys. Lett. B 53, 452 (1975), doi:10.1016/0370-2693(75)90216-6.
- [7] V. A. Khoze, A. D. Martin and M. G. Ryskin, Eur. Phys. J. C 18, 167 (2000), arXiv:hep-ph/0007359, doi:10.1007/s100520000494.
- [8] L. Jenkovszky and A. Lengyel, Acta Phys. Polon. B 46, 863 (2015), arXiv:1410.4106 [hep-ph], doi:10.5506/APhysPolB.46.863.
- [9] D. A. Fagundes, L. Jenkovszky, E. Q. Miranda, G. Pancheri and P. V. R. G. Silva, Fine structure of the diffraction cone: from ISR to the LHC, in Gribov-85 Memorial Workshop on Theoretical Physics of XXI Century, (9 2015). arXiv:1509.02197 [hep-ph].
- [10] L. Jenkovszky and I. Szanyi, Phys. Part. Nucl. Lett. 14, 687 (2017), arXiv:1701.01269 [hep-ph], doi:10.1134/S1547477117050065.
- [11] L. Jenkovszky and I. Szanyi, Mod. Phys. Lett. A 32, 1750116 (2017), arXiv:1705.04880 [hep-ph], doi:10.1142/S0217732317501164.
- [12] L. Jenkovszky, I. Szanyi and C.-I. Tan, Eur. Phys. J. A 54, 116 (2018), arXiv:1710.10594 [hep-ph], doi:10.1140/epja/i2018-12567-5.
- [13] A. K. Kohara, J. Phys. G 46, 125001 (2019), arXiv:1906.01402 [hep-ph], doi:10.1088/1361-6471/ab47d3.
- [14] A. K. Kohara, E. Ferreira and M. Rangel, Phys. Lett. B 789, 1 (2019), arXiv:1811.03212 [hep-ph], doi:10.1016/j.physletb.2018.12.021.
- [15] PHENIX Collaboration (A. Adare et al.), Phys. Rev. C77, 064907 (2008), arXiv:0801.1665 [nucl-ex], doi:10.1103/PhysRevC.77.064907.
- [16] UA4 Collaboration (R. Battiston et al.), Phys. Lett. B 127, 472 (1983), doi:10.1016/0370-2693(83)90296-4.
- [17] E-710 Collaboration (N. A. Amos et al.), Phys. Lett. B 247, 127 (1990), doi:10.1016/0370-2693(90)91060-O.
- [18] TOTEM Collaboration (G. Antchev et al.), Eur. Phys. J. C80, 91 (2020), arXiv:1812.08610 [hep-ex], doi:10.1140/epjc/s10052-020-7654-y.
- [19] TOTEM Collaboration (G. Antchev et al.), EPL 101, 21002 (2013), doi:10.1209/0295-5075/101/21002.
- [20] ATLAS Collaboration (G. Aad et al.), Nucl. Phys. B 889, 486 (2014), arXiv:1408.5778 [hep-ex], doi:10.1016/j.nuclphysb.2014.10.019.
- [21] TOTEM Collaboration (G. Antchev et al.), Nucl. Phys. B899, 527 (2015), arXiv:1503.08111 [hep-ex], doi:10.1016/j.nuclphysb.2015.08.010.
- [22] TOTEM Collaboration (G. Antchev et al.), Eur. Phys. J. C76, 661 (2016), arXiv:1610.00603 [nucl-ex], doi:10.1140/epjc/s10052-016-4399-8.
- [23] ATLAS Collaboration (M. Aaboud et al.), Phys. Lett. B 761, 158 (2016), arXiv:1607.06605 [hep-ex], doi:10.1016/j.physletb.2016.08.020.
- [24] TOTEM Collaboration (G. Antchev et al.), Eur. Phys. J. C79, 785 (2019), arXiv:1812.04732 [hep-ex], doi:10.1140/epjc/s10052-019-7223-4.
- [25] TOTEM Collaboration (G. Antchev et al.), Eur. Phys. J. C 79, 861 (2019), arXiv:1812.08283 [hep-ex], doi:10.1140/epjc/s10052-019-7346-7.
- [26] ATLAS Collaboration (G. Aad et al.), Eur. Phys. J. C 83, 441 (2023), arXiv:2207.12246 [hep-ex], doi:10.1140/epjc/s10052-023-11436-8.
- [27] TOTEM Collaboration (G. Antchev et al.), Eur. Phys. J. C 79, 103 (2019), arXiv:1712.06153 [hep-ex], doi:10.1140/epjc/s10052-019-6567-0.
- [28] T. Csörgő and I. Szanyi, Cross-checking Odderon signals at small values of four-momentum transfer. Presentation at ISMD 2023, Gyöngyös, Hungary https://indico.cern.ch/event/1258038/contributions/5537131/attachments/2702376/4690629/2023-08-24-Csorgo-ISMD-final.pdf.
- [29] V. A. Petrov and N. P. Tkachenko (3 2023), arXiv:2303.01058 [hep-ph].