A Comprehensive Real-World Evaluation of 5G Improvements over 4G in Low- and Mid-Bands
Abstract
As discussions around 6G begin, it is important to carefully quantify the spectral efficiency gains actually realized by deployed 5G networks as compared to 4G through various enhancements such as higher modulation, beamforming, and MIMO. This will inform the design of future cellular systems, especially in the mid-bands, which provide a good balance between bandwidth and propagation. Similar to 4G, 5G also utilizes low-band (1 GHz) and mid-band spectrum (1 to 6 GHz), and hence comparing the performance of 4G and 5G in these bands will provide insights into how further performance improvements can be attained. In this work, we address a crucial question: is the performance boost in 5G compared to 4G primarily a result of increased bandwidth, or do the other enhancements play significant roles, and if so, under what circumstances? There is extremely limited academic research that addresses this important question. Hence, we conduct city-wide measurements of 4G and 5G cellular networks deployed in low- and mid-bands in Chicago and Minneapolis, and carefully analyze the performance to quantify the contributions of different aspects of 5G advancements to its improved throughput performance. Our analyses show that (i) compared to 4G, the throughput improvement in 5G today is mainly influenced by the wider channel bandwidth, both from single channels and channel aggregation, (ii) in addition to wider channels, improved 5G throughput requires better signal conditions, which can be delivered by denser deployment and/or use of beamforming in mid-bands, (iii) the channel rank in real-world environments rarely supports the full 4 layers of 4x4 MIMO and (iv) advanced features such as MU-MIMO and higher order modulation such as 1024-QAM have yet to be widely deployed. These observations and conclusions lead one to consider designing the next generation of cellular systems to have wider channels, perhaps with improved channel aggregation, a deployment architecture that is dense and uses more beams, thus ensuring uniformly better signal strength over the coverage area and no more than 4 MIMO layers per user.
Index Terms:
5G, 4G, mid-band, low-band, C-band, BRS, MIMO, throughput, measurements.I Introduction
5G New Radio (NR) networks are widely recognized as the cornerstone for emerging next-generation mobile applications such as AR/VR, remote driving, and cloud gaming. Our recent measurement studies [1] reveal that with good coverage, current commercial 5G networks can achieve an average downlink throughput of 700 Mbps (with peak rates reaching 1 Gbps) even while driving in urban environments, far surpassing the performance of 4G Long-Term Evolution (LTE) networks. This substantial improvement may be attributed to the adoption of advanced wireless communication technologies, including but not limited to massive MIMO [2], beamforming [3], higher modulation [4], and increased bandwidth. The mid-band spectrum (1–6 GHz) in particular is deemed crucial for the success of 5G, as it balances coverage with bandwidth [5]. However, some advanced 5G technologies may still be in the product development phase, or skipped altogether due to cost considerations. Additionally, due to the phased deployment of commercial 5G, earlier research does not have results on the latest deployment of 5G in the BRS-band (2.5–2.7 GHz) and C-band (3.7–4.2 GHz).
| Mobile Operators | AT&T, T-Mobile, Verizon |
|---|---|
| Radio Technologies | 4G, 5G |
| Measurement Venues | Minneapolis, Chicago |
| Cumulative Data Traces | 1200+km; Around 14 hours |
| XCAL Key Perf. Indicators | PCI-Beam idx; Freq.; SCS; RSRP; RSRQ; CQI; RI; BLER; MCS; #RBs; #MIMO layers; MIMO modes; PHY-layer throughput; |
Hence, in this paper we focus on the physical layer of 4G and 5G networks, exploring deployed radio channel characteristics and their impact on throughput performance, with emphasis on the low-band (1 GHz) and mid-band channels, particularly the recent deployments of NR in BRS [6] and C-band [7, 8]. Specifically, we wish to address the following questions: What are the similarities and differences in the channel resources and radio technologies currently used in 4G and 5G networks? More importantly, is the observed 5G performance boost primarily a result of increased bandwidth, or do other novel enhancements play significant roles? And can we quantify their relationship and contribution to throughput? We believe that addressing these queries can prompt a reevaluation of mobile network evolution, offering valuable insights for the design and deployment of future 6G networks.
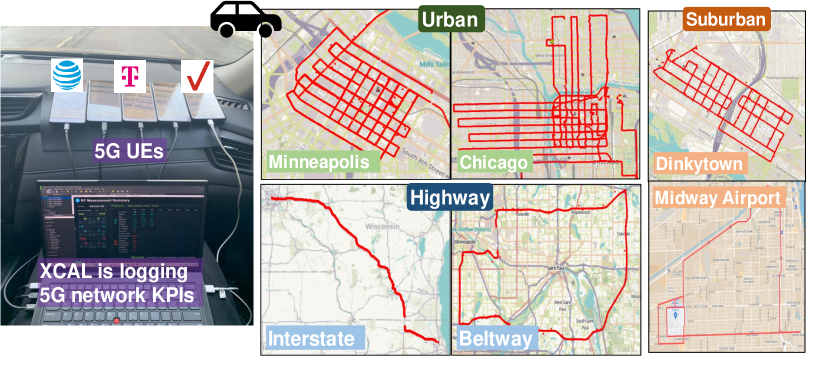
To this end, we carried out extensive in-field measurements in two major metropolitan areas in the US, Minneapolis and Chicago, along with the highways connecting them, as shown in Fig. 1. We employ commercial smartphones as user equipment (UE) and utilize a professional network analyzer tool to log all network events and key performance indicators (KPIs). Our data trajectory spans a driving distance exceeding 1200 km, encompassing both 4G and 5G networks of three major US operators—namely, AT&T (ATT), T-Mobile (TMO), and Verizon (VZW) as shown in Table I (see §III for details). To the best of our knowledge, our work is one of the first to conduct a comprehensive city-wide study spanning two cities, aimed at assessing the enhancements offered by 5G over 4G, with a particular focus on the low- and mid-bands.
With these datasets, we conduct an in-depth data analysis and summarize our conclusions as follows:
(1) Comparison of downlink throughput performance between NR and LTE (§IV-C): We perform a comparative analysis of downlink throughput over the representative low- and mid-band channels in NR and LTE. As expected, the NR mid-band channels perform exceedingly well as compared to other NR and LTE channels. However, we further normalize the throughput and demonstrate that the higher channel bandwidth of mid-band 5G is a major factor in the increased throughput, rather than new 5G features.
(2) Impact of deployment density and beamforming on throughput (§IV-B): We compare the density of base-stations (BSs) deployed by the three carriers and beamforming modes used and note that denser deployments along with the use of more beams in the mid-band lead to improved overall signal strength and hence to improved spectral efficiency.
(3) Analysis of the contribution of various 4G and 5G signal parameters to normalized throughput (§IV-D): The contribution of various signal parameters such as Reference Signal Received Power (RSRP), Modulation Coding Scheme (MCS), and Channel Quality Indicator (CQI) to the normalized throughput is further analyzed. We demonstrate that these parameters in NR perform similarly to their LTE counterparts. We also note the absence of 1024-QAM modulation, which was introduced at the latest Release 17.
(4) Comparison of Multiple-Input Multiple-Output (MIMO) performance in NR and LTE (§IV-E): A comparative analysis in terms of Rank Indicator (RI) value shows that there is a marginal increase in NR MIMO performance compared to LTE in terms of the actual channel rank and number of layers that can be supported by the physical channel. We also note that Multi-User MIMO (MU-MIMO) does not seem to be deployed yet in the cities we studied.
II Background and Related Work
The current 5G specification incorporates numerous advanced technologies to enhance efficiency, including high-order quadrature amplitude modulation (QAM), massive MIMO, and beamforming. High-order QAM enables transmission of more information bits within a symbol interval and the 3rd Generation Partnership Project (3GPP) introduced 1024-QAM in Release 17 of the 5G specification [4]. Beamforming optimizes signal direction, concentrating energy on specific users for improved coverage and capacity. NR beamforming is particularly important for mmWave channels [3, 9], and our prior work [10] studied the deployment of mmWave 5G beamforming in Chicago and the correlation of the number of beam indices to beam width and beam handover performance. Beamforming can also be implemented in low- and mid-band channels with the standard specifying up to 8 beams in mid-band TDD spectrum. These beams are identified with their unique Synchronization Signal Block (SSB) index. Massive MIMO, or MU-MIMO, utilizes beamforming to achieve a higher degree of spatial multiplexing between multiple, simultaneous, users, but it is known to suffer from a fundamental problem called “pilot contamination” [11, 12, 2]. In 5G, this problem is alleviated using channel estimation from channel state information-reference signal (CSI-RS) in downlink for frequency division duplexing (FDD) systems, and sounding reference signal (SRS) in the uplink for time division duplexing (TDD) systems [13, 4].
While prior 4G mobile networks mainly operated on the low (1 GHz) and mid (1–6 GHz) frequency bands (collectively referred to as frequency range 1, or FR1 [14]), initial 5G deployments in the US focused on the mmWave bands (24 GHz), also known as FR2. The mmWave bands can provide a throughput performance of over 1 Gbps, but performance is limited by propagation loss, body loss, foliage, and thermal, effects as shown in our prior analyses [10, 15]. The low-band, conversely, offers better coverage but with relatively lower bandwidth and hence throughput. Therefore, the mid-band which strikes a balance between coverage and performance has become a focal point for current 5G deployments. For instance, TMO is actively advancing its deployment in the BRS band [6], while ATT and VZW are strategically deploying in the C-band [7, 8]. Simultaneously, VZW also uses the CBRS band (3.55–3.7 GHz) in its 4G network, using both Tier 2 Priority Access License (PAL) and Tier 3 General Authorized Access (GAA) modes [16]. Furthermore, ATT and VZW have further extended their 4G networks to the unlicensed 5 GHz spectrum through LAA [17].
The novel features specified in 5G can theoretically improve throughput performance since network throughput is a function of channel bandwidth, modulation, code rate, and number of MIMO layers [18]. However, the reality is much more complex and presents numerous challenges. For example, receiver and transmitter hardware may limit the adoption of those new technologies; the regulator will constrain the transmission power in some locations; radio channels located at higher frequencies will further suffer from radio interference and fading; and poor channel quality will significantly reduce the efficiency of higher-order QAM due to increased transmission error. Prior real-world deployment studies of commercial 5G did not delve into the fundamental reasons for performance enhancement or contrast the improvements to its 4G counterpart [1, 19, 20, 21, 15]. Authors of [22] have highlighted missed throughput potential in deployed 5G and offered possible solutions, but the work did not compare 5G performance with 4G and the analysis was performed at the link layer. We believe that the work presented in this paper is the first to comprehensively analyze the contribution of different physical layer techniques on throughput performance of 5G as compared to 4G.
III Measurement Settings and Methodology
We collected the data analyzed in this paper over two measurement campaigns: December 2022 in Chicago and April-May 2023 in Minneapolis. Both campaigns focused on the three major US operators: ATT, TMO, and VZW. To cover a large area, we conducted data collection while driving. Fig. 1 shows the setup of 5G probes and the driving routes: in Chicago we measured in the downtown Loop area, Midway airport, and the interstate highway; while in Minneapolis we surveyed the Downtown, Dinkytown, and the beltway. The statistics of the data collected are summarized in Table I.
All of the data were captured using state-of-the-art smartphones: Samsung Galaxy S22+ (Android 12), which is capable of receiving 5G signals in the low-band, mid-band, and mmWave channels. At the time, S22+ was the only phone capable of capturing inter-band 5G Carrier Aggregation (CA) on the TMO network. Three S22+ phones were used as user equipment (UE), each equipped with ATT, TMO, and VZW SIMs. All SIMs have unlimited data plans with no throttling of data rates. The S22+ phones were connected to a Lenovo ThinkPad X1 Carbon laptop running Accuver XCAL [23]. The XCAL application is used to collect various 4G and 5G signal parameters by establishing a low-level interface to the modem chipset. Table I also summarizes the key performance indicators collected by XCAL for our analysis. XCAL is also capable of actively creating traffic using iperf [24] tools: we generate full-buffer downlink (iperf server to UE) transmission to cloud servers in Chicago and Minneapolis, whichever is closest to the measurement location.
| Operator-Band | Duplex Mode | DL Band Freq. (MHz) | SCS (kHz) | BW (MHz) |
| Representative Bands | ||||
| ATT-n5 | FDD | 850 | 15 | 10 |
| ATT-n77 | TDD | 3700 | 30 | 40 |
| TMO-n41 | TDD | 2500 | 30 | 40,100 |
| TMO-n71 | FDD | 600 | 15 | 20 |
| VZW-n5 | FDD | 850 | 15 | 10 |
| VZW-n77 | TDD | 3700 | 30 | 60 |
| ATT-b2 | FDD | 1900 | 15 | 20 |
| ATT-b12 | FDD | 700 | 15 | 10 |
| TMO-b12 | FDD | 700 | 15 | 5 |
| TMO-b66 | FDD | 2100 | 15 | 20 |
| VZW-b13 | FDD | 700 | 15 | 10 |
| VZW-b66 | FDD | 2100 | 15 | 20 |
| Other Bands | ||||
| ATT-n66 | FDD | 2100 | 15 | 5 |
| TMO-n25 | FDD | 1900 | 15 | 20 |
| ATT-b14 | FDD | 700 | 15 | 10 |
| ATT-b29 | SDL | 700 | 15 | 5 |
| ATT-b30 | FDD | 2300 | 15 | 5,10 |
| ATT-b46 | TDD | 5200 | 15 | 20 |
| ATT-b66 | FDD | 2100 | 15 | 5,10,15 |
| TMO-b2 | FDD | 1900 | 15 | 10 |
| TMO-b4 | FDD | 2100 | 15 | 20 |
| TMO-b25 | FDD | 1900 | 15 | 10 |
| TMO-b41 | FDD | 2500 | 15 | 20 |
| TMO-b46 | TDD | 5200 | 15 | 20 |
| TMO-b71 | FDD | 600 | 15 | 5 |
| VZW-b2 | FDD | 1900 | 15 | 10 |
| VZW-b4 | FDD | 2100 | 15 | 20 |
| VZW-b5 | FDD | 850 | 15 | 10 |
| VZW-b46 | TDD | 5200 | 15 | 20 |
| VZW-b48 | TDD | 3500 | 15 | 10,20 |
Overview of Deployments: In both campaigns, only TMO had deployed 5G in both Standalone (SA) and Non-Standalone (NSA) modes, while the other two operators only deployed 5G in the NSA mode. Table II shows the summary of captured NR and LTE bands/channels in the campaign. NR channels have the prefix ”n” and LTE channels have a prefix ”b” in the table. All three operators have deployed NR in low- and mid-bands. Notably, ATT-n66 and TMO-n25 are the newest bands and only detected in our April-May 2023 campaign. AT&T and Verizon have also deployed NR mmWave bands (n260 and n261) but they are out of scope for this analysis. Among the NR low- and mid-band channels, all FDD channels are deployed with 15 kHz sub-carrier spacing (SCS) and lower bandwidth (i.e., ATT-n5, ATT-n66, TMO-n25, TMO-n71, VZW-n5), while all TDD bands are deployed with 30 kHz SCS and higher bandwidth (i.e., ATT-n77, TMO-n41, VZW-n77). These deployments suggest that the NR FDD bands are positioned as the “support” bands since the lower BW and frequency result in lower throughput but greater coverage. It should be noted that TMO’s mid-band deployment in 2.5 GHz has a 3.4 dB advantage over ATT and VZW in 3.7 GHz: this will be seen in performance results presented later. Most of the deployed LTE channels are FDD, except for the newer b46 (LAA) and b48 (CBRS) which are TDD, and b29 which is a supplementary downlink (SDL) band. The LTE bands are similarly used as the “support” bands to the NR TDD bands when aggregated in the NSA deployments.
IV Measurement Results and Analyses
| Parameters | Observed 4G | Observed 5G | Rel-16 5G | Rel-17 5G |
|---|---|---|---|---|
| Max. Modulation | 256-QAM | 256-QAM | 256-QAM | 1024-QAM |
| Max. MIMO Layer | 4 | 4 | 8 | 8 |
| Max. Ch. BW (excl. mmWave) | 20 MHz | 100 MHz | 100* MHz | 100* MHz |
| Max. #CA | 6 | 4 | 16 | 16 |
*mmWave channels can be up to 400 MHz wide
(Bands in bold are mid-bands.)
Operator-Band
data
% data
#SSB Inds.
#unique PCI
ATT-n77
8350
34
1,6*
151
ATT-n5
14324
58
1
217
TMO-n41
56317
91
6
462
TMO-n71
1873
3
1
60
VZW-n77
8445
94
1
138
VZW-n5
541
6
1
28
ATT-b2
30725
28
N/A
377
ATT-b12
11987
11
N/A
88
TMO-b66
18355
38
N/A
327
TMO-b12
2571
5
N/A
83
VZW-b66
31742
36
N/A
358
VZW-b13
16906
19
N/A
239
*ATT-n77 has 6 SSB indices in Minneapolis, but only 1 in Chicago.
IV-A Overview of the Observed 4G and 5G Features
Table III compares the 4G and 5G features that we observed to the 3GPP specifications in Release 16 and 17. We believe that most deployments today are at most Release 16. Up to 256-QAM is observed in both LTE and NR networks, but not 1024-QAM. We also did not observe improvements in the number of MIMO layers for low- and mid-band 5G over the 4G counterparts, even though 3GPP Rel-16 supports up to 8 layers. On the other hand, there are improvements in maximum channel bandwidth, as new spectrum (i.e., n41, n77) has been released. This is reflected in the reduced number of channels used in carrier aggregation (CA): as bandwidth increases, there is less need to increase CA in 5G. ATT and VZW deploy only NSA where NR and LTE channels are aggregated, but we did not observe two NR low- or mid-band channels aggregated in their network. On the other hand, TMO in SA mode aggregates up to 3 NR channels for a total bandwidth of 160 MHz.
IV-B Comparison of Low- and Mid-band Deployment
In a preliminary analysis, we observed negligible differences between the data collected in Chicago and Minneapolis. Therefore, we combine both datasets for the analyses presented in this paper. For brevity, a representative low-band and mid-band channel with the highest number of data points is selected for each operator, whether they are assigned as a primary or a secondary cell/channel. All mid-band channels are deployed with higher bandwidth compared to low-band channels. Table IV shows the number of data points and deployment parameters of the selected representative bands. Note that the number of unique Physical Cell Identifiers (PCIs) is calculated separately between Chicago and Minneapolis due to PCI reuse. For ATT NR, n77 (mid-band) and n5 (low-band) are selected. There area larger number of data points and unique PCIs on n5, indicating a denser deployment in the low-band: this is in contrast to TMO and VZW which have a higher number of data points and unique PCIs in mid-bands (n41 and n77, respectively) compared to low-bands (n71 and n5, respectively). Moreover, TMO-n41 is very densely deployed with 462 unique PCIs compared to the NR channels from ATT and VZW. As we shall see later, the density of the TMO NR deployment and the lower NR mid-band frequency (2.5 GHz) have a significant impact on overall superior signal strength, spectral efficiency and throughput as compared to ATT and VZW.
Similar to the NR bands, we observe a higher number of data points and unique PCIs on mid-band LTE channels compared to low-band. For ATT, b66 has the largest number of data points for mid-band, however, we chose the second largest b2 for its wider bandwidth. For TMO, b12 is the only low-band channel beside b71, indicating the very sparse deployment of low-band LTE in TMO: b12 and b71 channels account for 10% of the total LTE data. The proportion of mid-band data in LTE and NR indicates that TMO and VZW have been focusing on mid-band deployments. Lastly, due to a lack of data, the unlicensed and shared mid-band 4G channels are ineligible to be representatives (ATT-n46: , 6% of data; VZW-n46: , 1% of data; VZW-n48: , 9% of data). Since the transmit power on these bands is much lower, the deployments are localized to small cells.
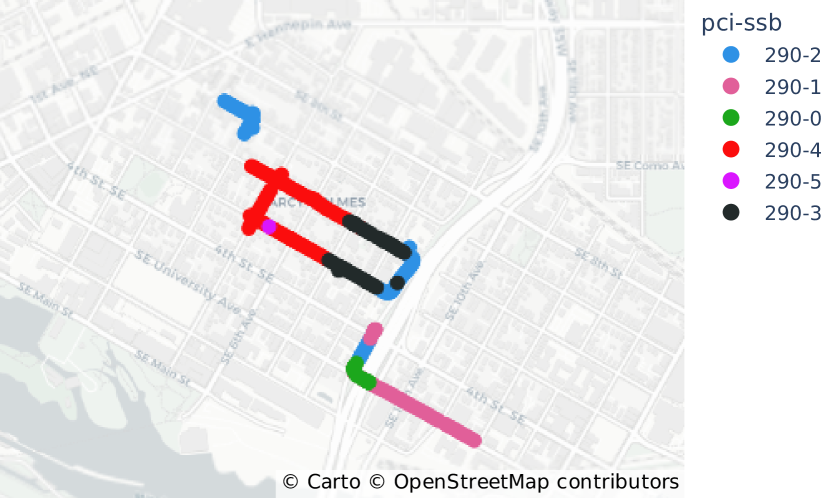
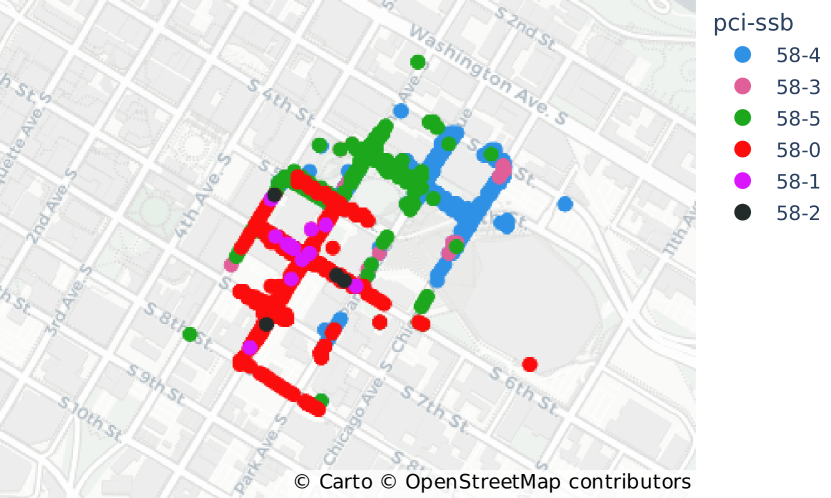
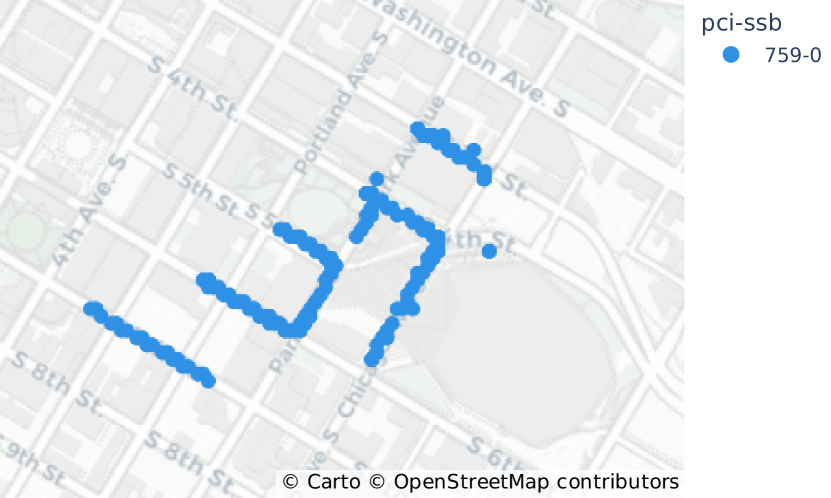
Comparison of low- and mid-band NR beam deployment: Table IV also shows the SSB Indices available for each NR channel. We observe only index 0 (i.e., single beam) per PCI for ATT channels in the Chicago campaign. However, in the later, Minneapolis campaign, we observe 6 SSB indices for ATT-n77. Fig. 2(a) shows the coverage of the various SSB Indices for ATT-n77, PCI 290, in Dinkytown. Similarly, Fig. 2(b) depicts SSB Indices from 0 to 5 for TMO-n41, PCI 59, in downtown Minneapolis. All low-band NR channels, i.e., n5 and n71, only use one SSB index and the number of SSB indices did not change between the two campaigns. Unlike TMO and ATT, VZW always uses a single SSB index per PCI for all of its NR channels in both cities. Fig. 2(c) illustrates the coverage of one of VZW’s n77 channels in downtown Minneapolis. Since more SSBs/PCI means more beams, and hence beamforming gain, VZW with only one beam/PCI suffers from lower signal strength overall and hence poorer spectral efficiency as will be shown later.
IV-C Comparison of Downlink Throughput Performance
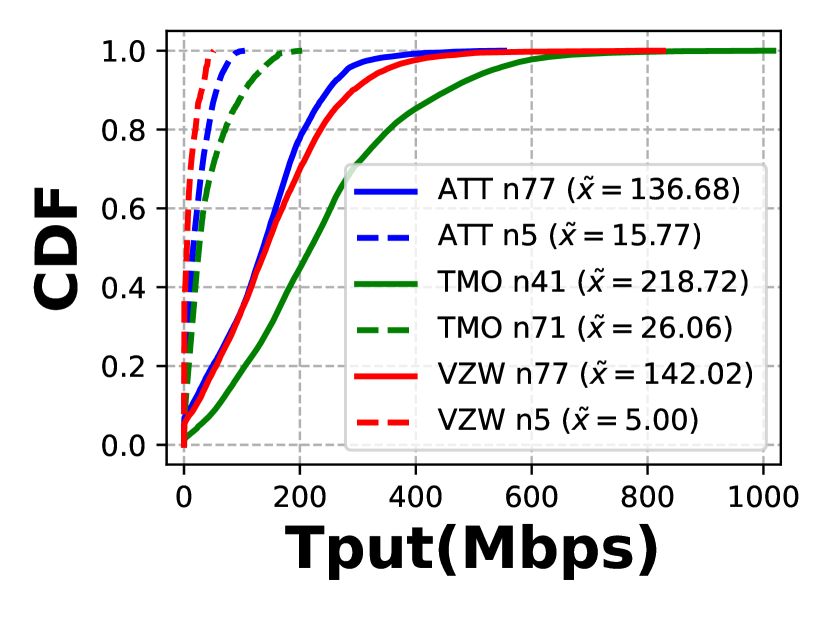
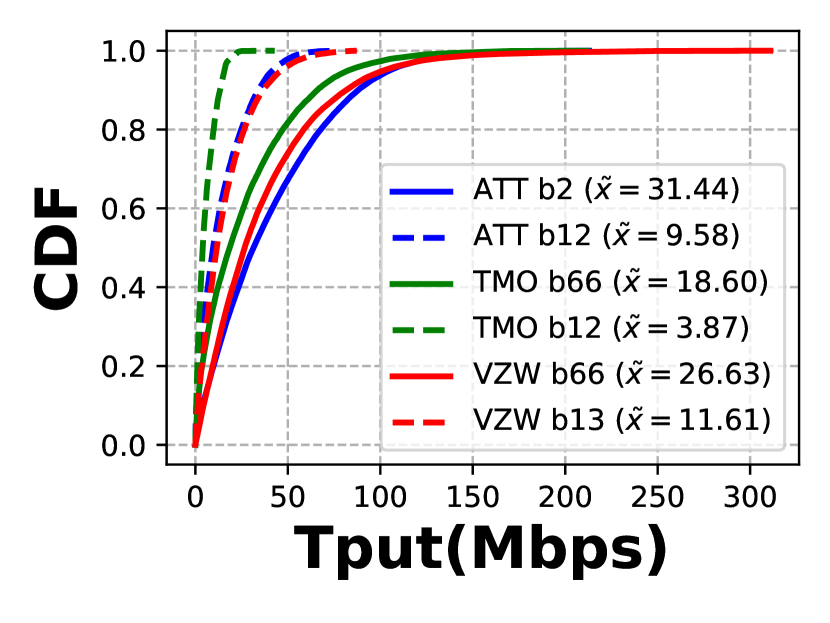
Fig. 3 shows the comparison of physical layer throughput and the corresponding normalized throughput (or spectral efficiency) between low- and mid-band LTE and NR, as reported by XCAL. Fig. 3(a) shows a considerably higher downlink throughput on the mid-band NR channels. As discussed in a prior section, this can be explained by the wider bandwidths. The highest median throughput of 218 Mbps is attained by TMO-n41 with a combination of two NR channels of 40 and 100 MHz bandwidth. Fig. 3(b) similarly shows higher throughput on LTE mid-band channels compared to the low-bands. The highest median throughput of 31 Mbps is achieved by ATT-b2 with 20 MHz bandwidth. Since the block error rate (BLER) of the channels is similar (omitted for brevity), we conclude that the increase of median throughput in NR is due to the wider bandwidth.
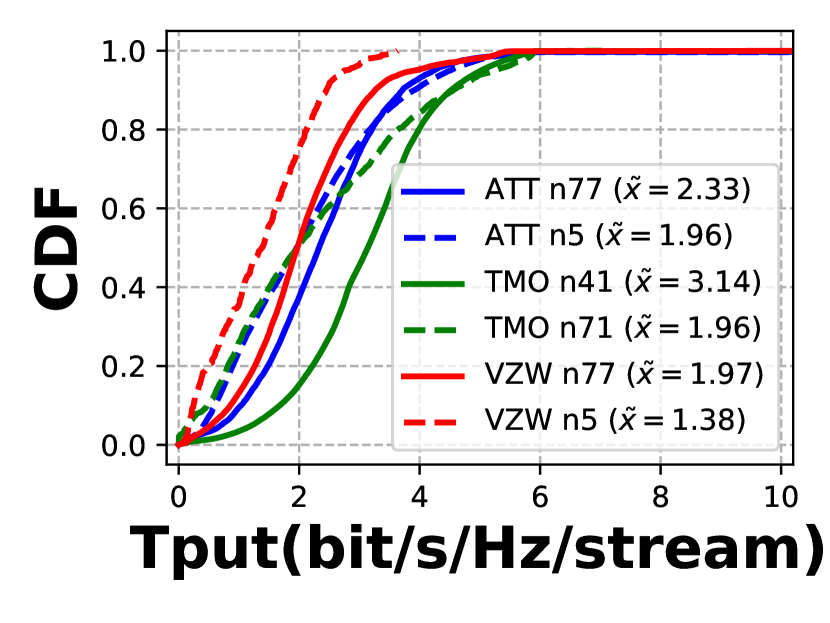
For a deeper analysis, we look into channel spectral efficiency: we normalize the throughput on each channel by the utilized bandwidth and number of MIMO layers, i.e., , where is the throughput in bits/second, is the average number of resource blocks (RBs) allocated to the UE over one second, is the subcarrier spacing in Hz, and is the number of MIMO layers used. To determine the instantaneous bandwidth usage, we multiply by and 12, given that there are 12 subcarriers in each RB. Since we use RB to normalize throughput, the difference between TDD configurations in the mid-band channels should not make a difference, however, we observe that all operators in the mid-band channels use the same TDD configuration of 7 slots for DL and 2 slots for UL, with a slot length of 0.5 ms. Note that when normalizing LTE throughput, Rank Indicator (RI) is used due to the lack of the MIMO layer number KPI in LTE. This is viable since we observe a Pearson correlation of 0.95 between the RI and MIMO layers in our NR data, which is expected since RI is a part of Channel State Information (CSI) feedback and is utilized for choosing the number of MIMO layers.
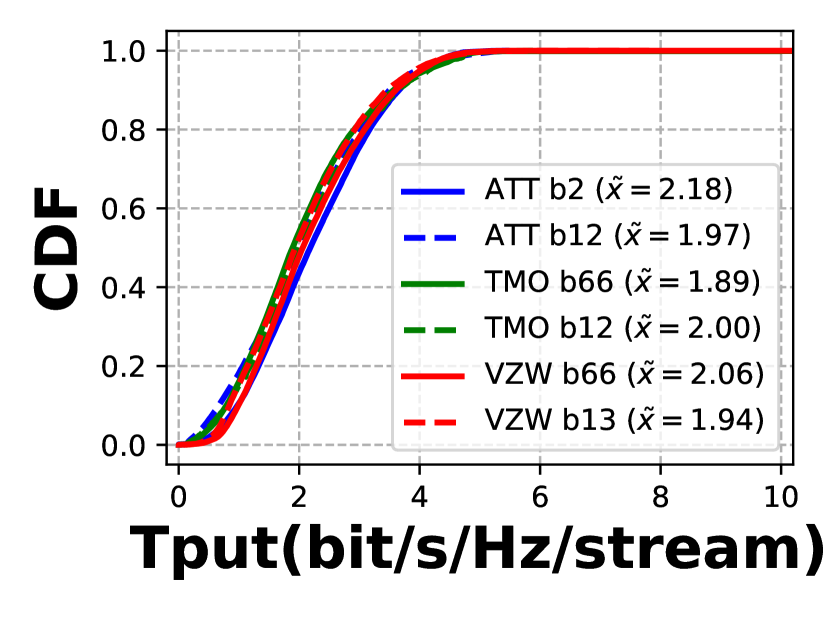
Fig. 3(c) compares the normalized throughput, or spectral efficiency, of NR channels as computed above, and shows that the lowest median throughput is on VZW-n5, while other channels attained median normalized throughputs between 1.9 to 2.3 bit/s/Hz/stream. Thus, we conclude that the median throughput of LTE and NR in low- and mid-bands are comparable when normalized, except for TMO-n41 with the highest median of 3.14 bit/s/Hz/stream. On the other hand, Fig. 3(d) shows a close comparison of normalized throughput median for all of the representative LTE channels. Comparing LTE and NR channels, we observe a similar median between the channels around 2 bit/s/Hz/stream, analogous to the theoretical capacity of uncoded QPSK of 2 bit/s/Hz. Since we previously observed a higher throughput from channels with higher bandwidth, this strongly indicates that the increase in throughput from LTE to NR can be attributed primarily to the wider bandwidth and number of MIMO layers, with the exception being TMO-n41, which has a much higher spectral efficiency due to its dense deployment (compared to both ATT and VZW) and larger number of beams (compared to VZW), both of which lead to improved overall signal strength and hence spectral efficiency. We will further analyze the contribution of RSRP, modulation, and number of MIMO layers to the normalized throughput in the next sections.
IV-D Normalized Throughput Impact Factor Analysis
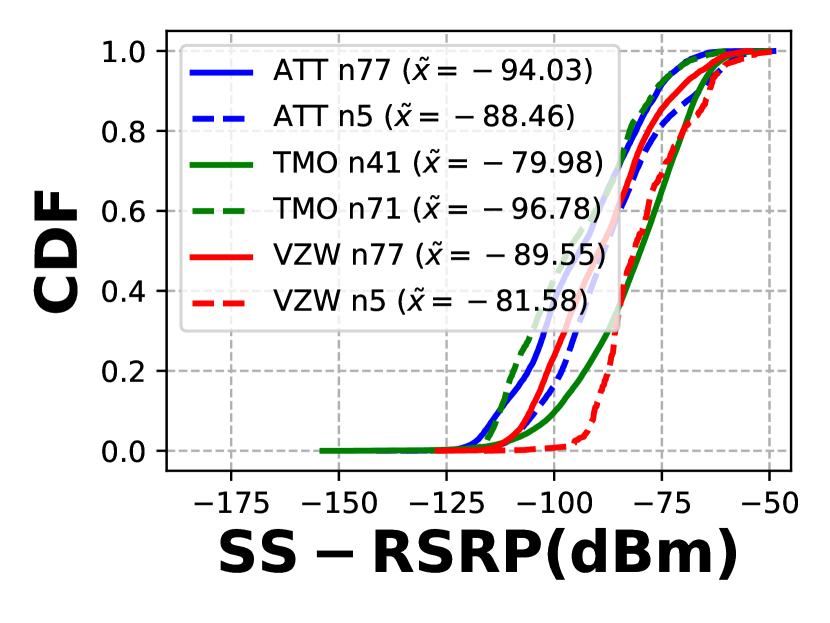
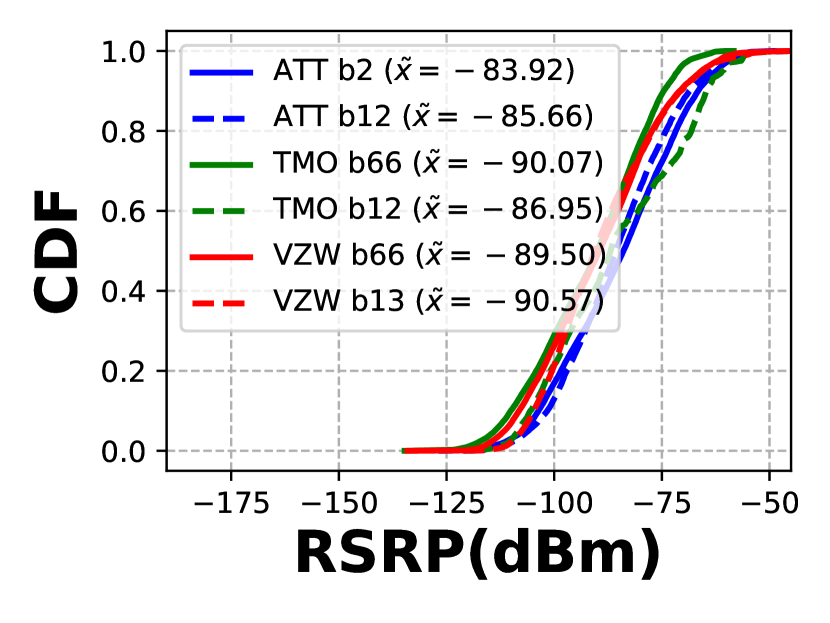
Contribution of RSRP, MCS, and CQI to normalized throughput: Fig. 4(a) shows a comparative analysis of the Synchronization Signal Reference Signal Received Power (SS-RSRP). Both ATT and VZW exhibit higher SS-RSRP values on their low-bands in comparison to their mid-band counterparts: this is due to better propagation characteristics of the low-bands. However, mid-band TMO-n41 displays higher SS-RSRP (a median of -79 dBm) compared to its low-band counterpart, n71, which indicates a denser NR deployment to overcome the propagation loss at the mid-bands. Furthermore, TMO consistently displays RSRP values 12 dB higher than other operators in all of our NR data: this is due to a combination of dense deployment, multiple beams/PCI and lower frequency. Fig. 4(b) shows the similarity of the RSRP distribution between the LTE channels. The highest median RSRP of -83 dBm is achieved by ATT-b2, which is reflected on the normalized throughput: a highest median of 2.18 bit/s/Hz/stream over all LTE channels. Between NR and LTE, we observe comparable RSRP median values, except for TMO-n41, which can be again attributed to its denser deployment and higher number of beams.
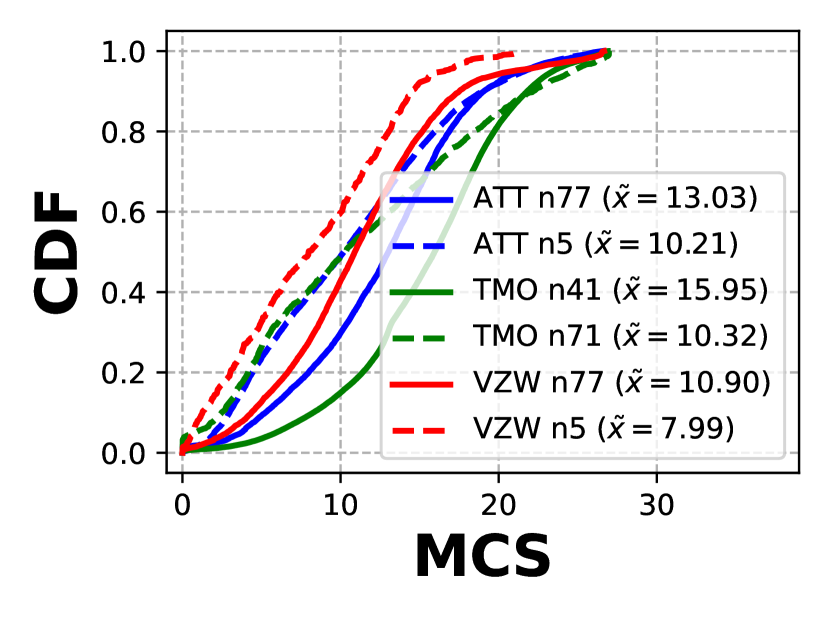
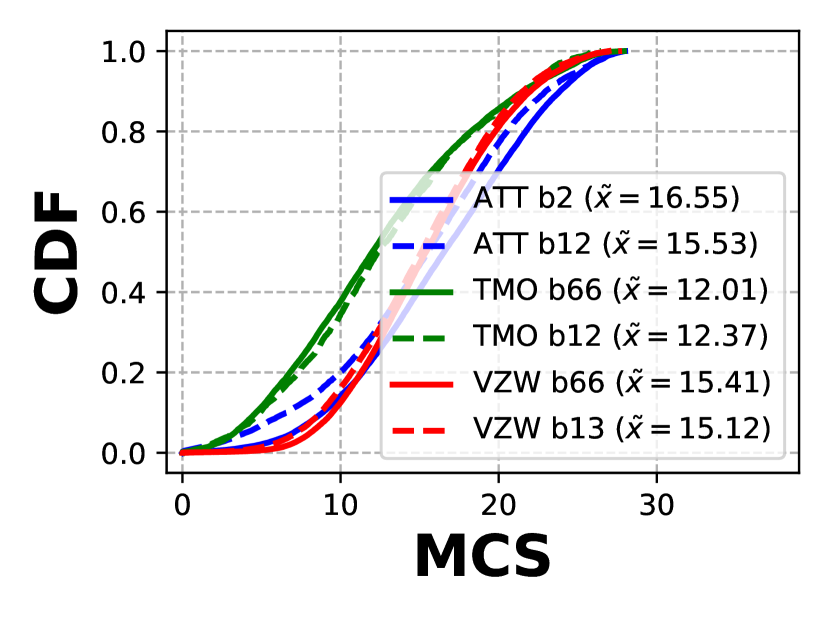
Fig. 4(c) shows the distribution of allocated MCS, which correlates well with the distribution of normalized throughput. For instance, the best and worst median MCS achieved by TMO-n41 and VZW-n5, respectively, correspond to the best and worst median normalized throughput. This is expected since higher MCS delivers higher spectral efficiency but can only be used in good signal conditions. Fig. 4(d) similarly shows a higher correlation of MCS distribution to the normalized throughput of LTE. Further, we found RRC messages (“pdsch-Config mcs-Table := qam256” in NR and “cqi-ReportConfig altCQI-Table-r12 := all subframes” in LTE) which indicate that both LTE and NR used the MCS Table 2 as described in Table 5.1.3.1-2 of [4], making comparison feasible. We observe a lower median of MCS in NR channels compared to LTE, except for TMO-n41, again due to the good channel condition guaranteed by its denser deployment.
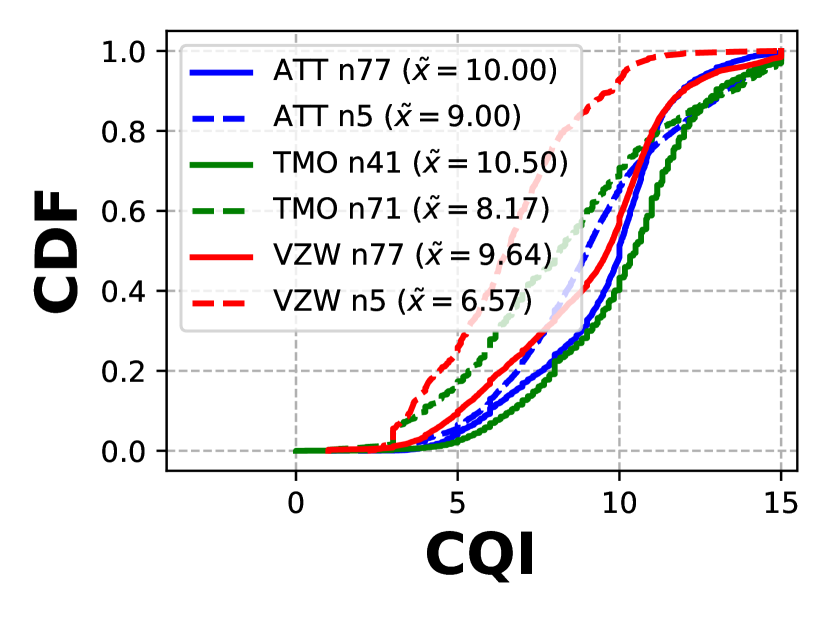
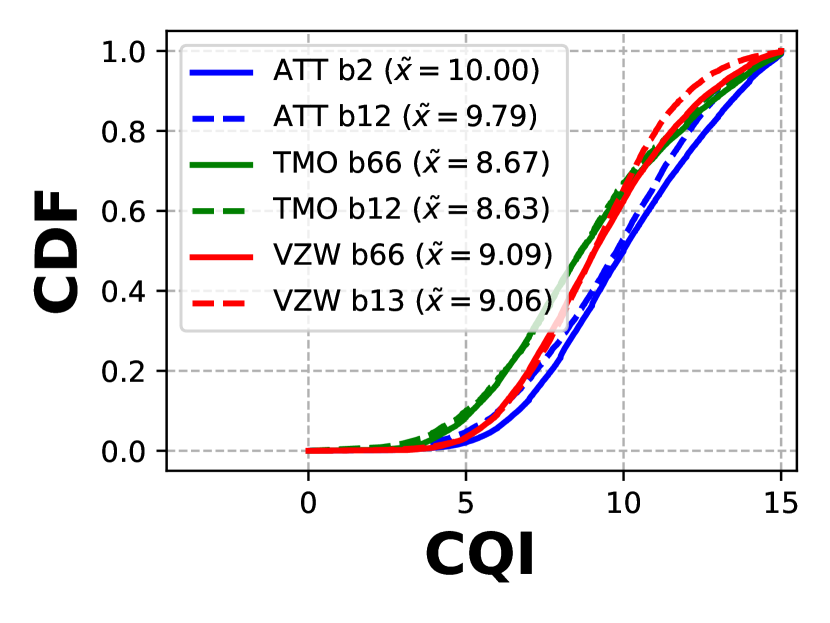
We further compare the Channel Quality Indicator (CQI) which indicates channel conditions from the UE’s perspective. Fig. 4(e) illustrates the comparison of CQI between the representative NR channels. Since CQI is used by the BS to decide the MCS selection, the distribution of CQI aligns with its respective MCS values: the highest median CQI is attained by TMO-n41, similar to its median MCS, vice versa with VZW-n5. On LTE, Fig. 4(f) also shows a similar distribution of LTE CQI with MCS. This further shows that normalized throughput is mostly influenced by the overall channel condition reported by UE, rather than just RSRP. However, since we cannot ascertain whether the CQI table used by NR and LTE networks are the same, we cannot make a direct comparison between them.
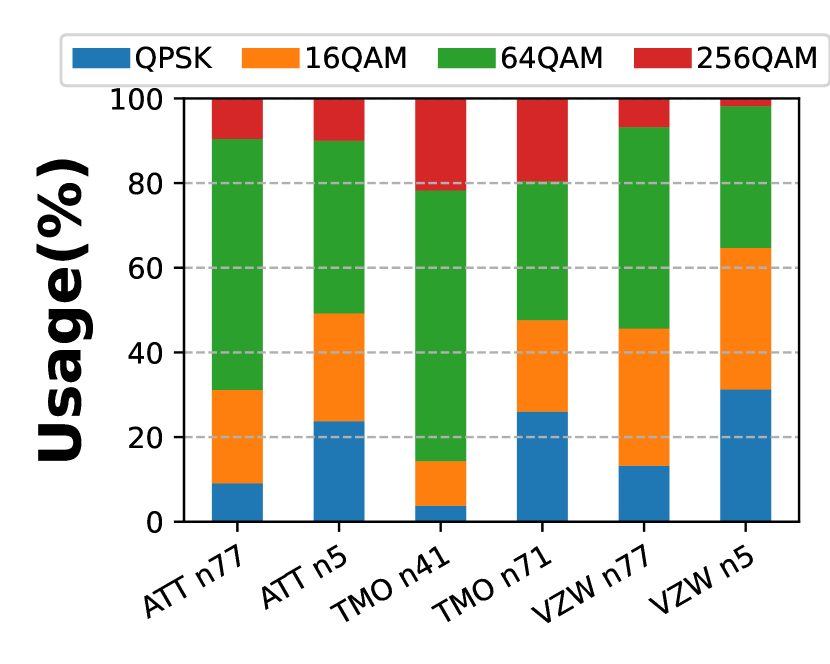
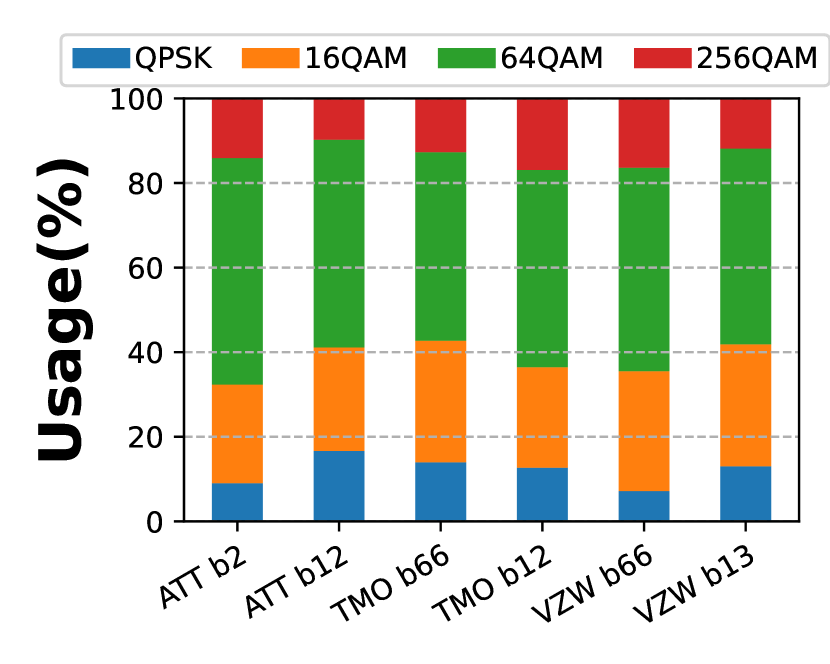
Comparison of modulation modes: Fig. 5 shows the modulation modes used for the 12 representative low- and mid-band channels as defined in a previous section. Only modulation modes from QPSK to 256-QAM are observed in our campaign. Fig. 4(c) shows a higher usage of 64-QAM and 256-QAM modulation with TMO-n41 which corresponds to the high normalized throughput of the channel. Conversely, the VZW-n5 channel uses a higher proportion of QPSK and 16-QAM modes which also explains the low normalized throughput of this channel. Fig. 5(b) similarly shows that ATT-b2 mostly uses a combination of 64-QAM and 256-QAM modes, and this results in the highest normalized throughput performance among the LTE channels. Moreover, the resemblance in modulation usage among the other LTE channels corresponds to the similarity in their normalized throughput.
Comparing the modulation modes between the NR and LTE channels, we do not observe a significant improvement, i.e., no indication that higher modulation is more available in NR compared to LTE, except for the TMO NR channels n41 and n71 which use 256 QAM more often than the other carriers. This is due to the fact that TMO exhibits better signal conditions in general, which confirms that spectral efficiency improvements are only possible if the overall signal strength improves, through a combination of dense deployments and usage of more beams.
IV-E Comparison of MIMO Performance in NR and LTE
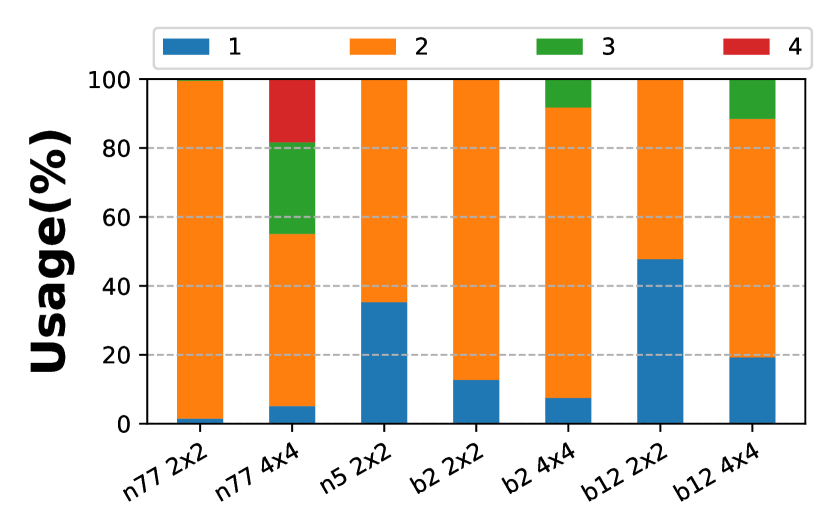
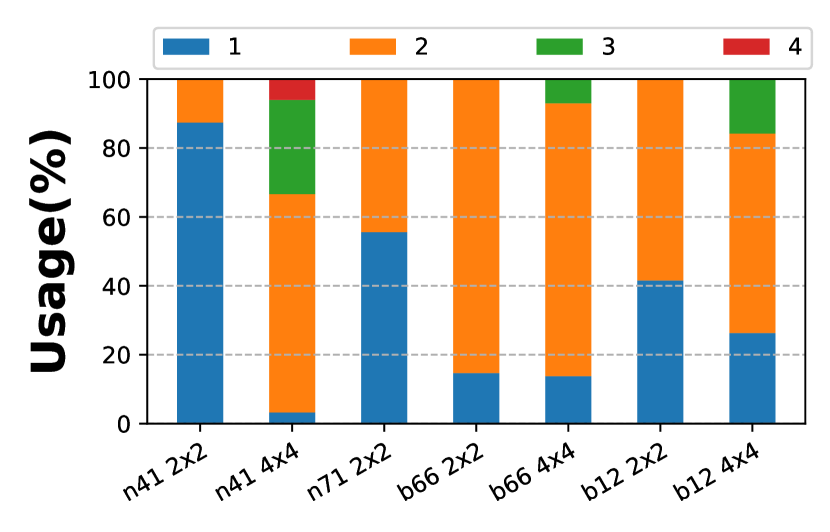
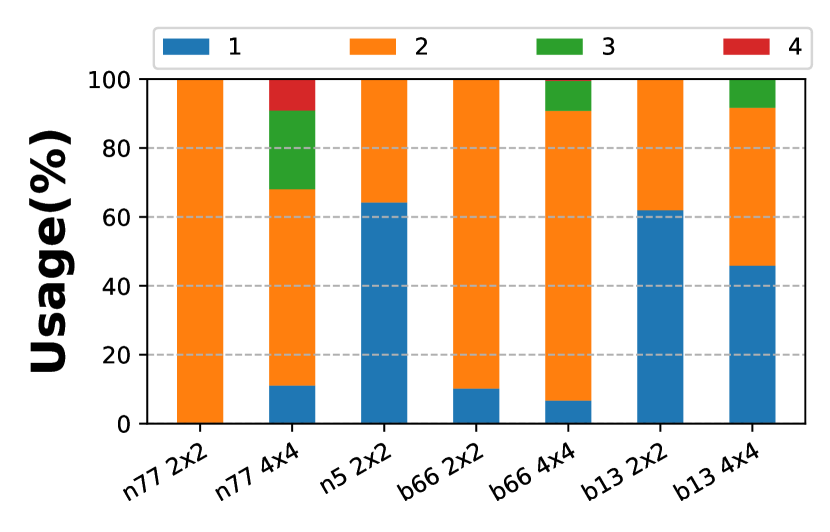
Analysis of MIMO performance in terms of Rank Indicator (RI) and MIMO modes: In both LTE and NR, RI is the MIMO channel rank as calculated by the UE and transmitted back to the BS for MIMO layer decision. Fig. 6 shows the comparison of RI for the three operators on the representative low- and mid-band channels selected in a previous section. The data for each channel is categorized by MIMO modes (i.e., 2x2, 4x4) as reported by XCAL. First, we observe that the NR low-band channels on all operators do not utilize 4x4 MIMO modes, while the LTE counterparts do. Fig. 6(a) compares the RI value between NR and LTE channels of ATT. We observe an RI value of 2 as being the most common in all channels, even when 4x4 MIMO mode is available. For instance, ATT-n77 with 4x4 mode reported RI of 4 less than 20% of the time, while RI 4 is not seen in the corresponding b2 and b12 channels. Fig. 6(b) similarly shows an RI value of 2 being most common for TMO, with the exception of n41 and n71 using 2x2 mode where the majority of the data had a RI of 1. Fig. 6(c) also demonstrates an RI value of 2 being most used for VZW, except for n5 with 2x2 and b13 with both 2x2 and 4x4 modes.
This result is very significant since it indicates that even though higher order MIMO modes may be implemented, the physical channel rank may not support all available MIMO layers. This suggests that increasing MIMO order in future generations may not be the best way to improve throughput in the real-world. In fact, TMO-n41 has the best throughput performance but it achieves this with fewer MIMO layers on average as compared to ATT-n77 and VZW-n77, which are all mid-band NR channels.
Analysis of MU-MIMO in NR: The Precoding Matrix Indicator (PMI) is a part of the CSI feedback to the BS and conveys information about the precoding matrix that should be used in the downlink transmission. Utilizing XCAL, we collected PMI values from all the UEs and observed PMI with indices: i(1;1), i(1;2), i(1;3), and i(2). This indicates the usage of Type 1-Single Panel codebook with 2–4 MIMO layers [4]. Further, we analyzed the RRC messages captured in all of our UEs and found “mimo-Parameters codebookParameters typeI singlePanel mode := mode1” message which further indicates the usage of the above codebook. Type 1 codebooks are used for Single User-MIMO (SU-MIMO) and only use a single beam to calculate CSI feedback [25]. Lastly, we did a stationary experiment in Minneapolis in November 2023 where we initiated downlink traffic with up to 4 UEs on the same operator, observing their exact RB allocation in the radio frame. Our hypothesis is when MU-MIMO is enabled, there is at least one RB allocated in the same slot to two different UEs. We did not observe this in our data.
V Conclusions and Future Work
We have presented a comprehensive, real-world evaluation of the performance of low- and mid-band 4G and 5G networks, examining the contribution of various system parameters—such as SSB index, RSRP, modulation, and MIMO—to downlink throughput, and presented conclusions on the reasons for the improvement in 5G throughput over 4G for all three US operators. It is clear from the data and analyses that the high downlink throughput achieved by mid-band NR channels can be attributed primarily to the higher channel bandwidth and improved signal strengths. When normalized over bandwidth and number of MIMO streams, there is only a marginal improvement in throughput over NR, except for TMO in n41 where we show that the dense deployment and larger number of beams used deliver higher signal strength on average leading to improved spectral efficiency through the use of higher modulation modes such as 256 QAM. VZW in n77 uses fewer beams and less dense deployments thus leading to lower normalized throughput compared to other operators. Regarding MIMO performance, we observed a marginal increase in the usage of the full capability 4x4 MIMO with 4 layers in NR: this indicates that increasing MIMO modes beyond 4x4 may not be the right approach to increasing throughput since the physical channel may not have sufficient diversity to support more than 4 layers. Lastly, the deployment of MU-MIMO was not observed in our campaign, which is confirmed through RRC messages and a focused experiment with multiple UEs.
The cellular industry will continue to innovate and deploy new cellular technologies, with governmental agencies opening new spectrum for wireless uses. Recently, the US National Telecommunications and Information Administration (NTIA) announced the intent to study the lower 3 GHz (3.1-3.45 GHz), the 7 GHz band, and other bands for future wireless broadband uses [26]. These new spectrum bands will further increase 5G/NextG capabilities by offering increased bandwidth, however, operators and device manufacturers should also aim to implement and optimize new 5G features such as MU-MIMO and higher modulation which require better signal conditions that can be delivered by dense deployments and increasing the number of beams used. We plan to continue investigating the roll-out of 5G improvements: by quantifying the improvement of various features, such analyses are crucial in informing the development of future standards and deployment architectures.
References
- [1] J. Carpenter, W. Ye, F. Qian, and Z.-L. Zhang, “Multi-modal vehicle data delivery via commercial 5G mobile networks: An initial study,” in 2023 IEEE 43rd International Conference on Distributed Computing Systems Workshops (ICDCSW). IEEE, 2023, pp. 157–162.
- [2] T. E. Bogale and L. B. Le, “Massive MIMO and mmWave for 5G wireless HetNet: Potential benefits and challenges,” IEEE Vehicular Technology Magazine, vol. 11, no. 1, pp. 64–75, 2016.
- [3] A. N. Uwaechia and N. M. Mahyuddin, “A comprehensive survey on millimeter wave communications for Fifth-Generation Wireless Networks: Feasibility and challenges,” IEEE Access, vol. 8, pp. 62 367–62 414, 2020.
- [4] 3rd Generation Partnership Project, “TS 38.214 5G; NR; Physical layer procedures for data version 17.1.0 Release 17,” 2022.
- [5] Nokia, “5G spectrum bands explained,” https://www.nokia.com/thought-leadership/articles/spectrum-bands-5g-world/, accessed: 2023-11-26.
- [6] M. Dano, “The quiet brilliance of T-Mobile’s 5G spectrum strategy,” 2022, accessed: 2023-11-26. [Online]. Available: https://www.lightreading.com/5g/the-quiet-brilliance-of-t-mobile-s-5g-spectrum-strategy
- [7] M. Alleven, “AT&T takes advantage of early C-band clearing,” 2023, accessed: 2023-11-26. [Online]. Available: https://www.fiercewireless.com/5g/att-takes-advantage-early-c-band-clearing
- [8] K. Schulz, “Verizon turbo charges its 5G network with the addition of more spectrum,” 2023, accessed: 2023-11-26. [Online]. Available: https://www.verizon.com/about/news/verizon-5g-network-addition-more-spectrum
- [9] Y.-N. R. Li, B. Gao, X. Zhang, and K. Huang, “Beam management in millimeter-wave communications for 5G and beyond,” IEEE Access, vol. 8, pp. 13 282–13 293, 2020.
- [10] A. Narayanan, M. I. Rochman, A. Hassan, B. S. Firmansyah, V. Sathya, M. Ghosh, F. Qian, and Z.-L. Zhang, “A comparative measurement study of commercial 5G mmWave deployments,” in IEEE INFOCOM 2022-IEEE Conference on Computer Communications, 2022, pp. 800–809.
- [11] O. Elijah, C. Y. Leow, T. A. Rahman, S. Nunoo, and S. Z. Iliya, “A comprehensive survey of pilot contamination in massive MIMO—5G system,” IEEE Communications Surveys & Tutorials, vol. 18, no. 2, pp. 905–923, 2015.
- [12] J. Jose, A. Ashikhmin, T. L. Marzetta, and S. Vishwanath, “Pilot contamination and precoding in multi-cell TDD systems,” IEEE Transactions on Wireless Communications, vol. 10, no. 8, pp. 2640–2651, 2011.
- [13] D. López-Pérez, A. De Domenico, N. Piovesan, G. Xinli, H. Bao, S. Qitao, and M. Debbah, “A survey on 5G radio access network energy efficiency: Massive MIMO, lean carrier design, sleep modes, and machine learning,” IEEE Communications Surveys & Tutorials, vol. 24, no. 1, pp. 653–697, 2022.
- [14] 3rd Generation Partnership Project, “TS 38.101-1 5G; NR; user equipment (UE) radio transmission and reception; Part 1: Range 1 standalone 17.5.0 Release 17,” 2022.
- [15] M. I. Rochman, V. Sathya, D. Fernandez, N. Nunez, A. S. Ibrahim, W. Payne, and M. Ghosh, “A comprehensive analysis of the coverage and performance of 4G and 5G deployments,” Computer Networks, vol. 237, p. 110060, 2023.
- [16] B. Fletcher, “CBRS boosts Verizon 4g speeds 79% but power levels show limits,” https://www.fiercewireless.com/tech/cbrs-boosts-verizon-4g-speeds-79-power-levels-show-limits, accessed: 2023-11-26.
- [17] V. Sathya, M. I. Rochman, and M. Ghosh, “Measurement-based coexistence studies of LAA & Wi-Fi deployments in chicago,” IEEE Wireless Communications, vol. 28, no. 1, pp. 136–143, 2020.
- [18] 3rd Generation Partnership Project, “TS 38.306 5G; NR; user equipment (UE) radio access capabilities 17.0.0 Release 17,” 2022.
- [19] R. A. Fezeu, J. Carpenter, C. Fiandrino, E. Ramadan, W. Ye, J. Widmer, F. Qian, and Z.-L. Zhang, “Mid-band 5G: A measurement study in Europe and US,” arXiv preprint arXiv:2310.11000, 2023.
- [20] A. Narayanan, X. Zhang, R. Zhu, A. Hassan, S. Jin, X. Zhu, X. Zhang, D. Rybkin, Z. Yang, Z. M. Mao et al., “A variegated look at 5G in the wild: performance, power, and qoe implications,” in Proceedings of the 2021 ACM SIGCOMM 2021 Conference, 2021, pp. 610–625.
- [21] M. Ghoshal, I. Khan, Z. J. Kong, P. Dinh, J. Meng, Y. C. Hu, and D. Koutsonikolas, “Performance of cellular networks on the wheels,” in Proceedings of the 2023 ACM on Internet Measurement Conference, 2023, pp. 678–695.
- [22] Y. Liu and C. Peng, “A close look at 5G in the wild: Unrealized potentials and implications,” in IEEE International Conference on Computer Communications (INFOCOM’23), 2023.
- [23] Accuver. XCAL - PC based advanced 5G network optimization solution. [Online]. Available: https://www.accuver.com/sub/products/view.php?idx=6
- [24] iperf3 - the TCP, UDP and SCTP network bandwidth measurement tool. [Online]. Available: https://iperf.fr/
- [25] Z. Qin and H. Yin, “A review of codebooks for CSI feedback in 5G New Radio and beyond,” arXiv preprint arXiv:2302.09222, 2023.
- [26] National Telecommunications and Information Administration. (2023) The national spectrum strategy. [Online]. Available: https://www.ntia.gov/sites/default/files/publications/national_spectrum_strategy_final.pdf