A survey of Ly emission around Damped Ly absorbers at
with the Keck Cosmic Web Imager
Abstract
We present Keck Cosmic Web Imager Ly integral field spectroscopy of the fields surrounding 14 Damped Ly absorbers (DLAs) at . Of these 14 DLAs, nine have high metallicities ([M/H] ), and four of those nine feature a CO-emitting galaxy at an impact parameter kpc. Our search reaches median Ly line flux sensitivities of erg s-1 cm-2 over apertures of 6 kpc and out to impact parameters of 50 kpc. We recover the Ly flux of three known Ly-emitting H I-selected galaxies in our sample. In addition, we find two Ly emitters at impact parameters of kpc from the high metallicity DLA at toward QSO B0551-366. This field also contains a massive CO-emitting galaxy at an impact parameter of kpc. Apart from the field with QSO B0551-366, we do not detect significant Ly emission in any of the remaining eight high-metallicity DLA fields. Considering the depth of our observations and our ability to recover previously known Ly emitters, we conclude that H I-selected galaxies associated with high-metallicity DLAs at are dusty and therefore might feature low Ly escape fractions. Our results indicate that complementary approaches — using Ly, CO, H, and [C ii] 158m emission — are necessary to identify the wide range of galaxy types associated with DLAs.
1 Introduction
The H I cycle within and around galaxies is a critical component in our models of galaxy formation and evolution. We know that galaxies must acquire H I from the intergalactic medium in order to sustain their star-formation (Prochaska et al. 2005; Kereš et al. 2005; Walter et al. 2020). The inflow of H I is counteracted by outflows of metal-enriched gas powered by active galactic nuclei and/or the late stages of stellar evolution, thereby regulating the rate at which galaxies form their stars (e.g. Kereš et al. 2005; Tumlinson et al. 2017). Furthermore, the removal of H I from galaxies through environment-driven processes (Gunn & Gott 1972; Kawata & Mulchaey 2008; Cortese et al. 2021) is often invoked to explain the quenched fractions and assembly histories of satellite galaxies (e.g. Pasquali et al., 2010; Wetzel et al., 2013; Gallazzi et al., 2021; Trussler et al., 2021; Werle et al., 2022; Oyarzún et al., 2023).
To characterize the H I content in and around galaxies at low redshift, we often turn to studies of 21 cm emission (e.g. Verheijen, 2001; Walter et al., 2008; Begum et al., 2008; Chung et al., 2009; Heald et al., 2011; Catinella et al., 2018). Single-dish 21 cm studies have yielded H I emission-line detections for thousands of galaxies at low redshifts (e.g. Zwaan et al. 2005; Haynes et al. 2018), while 21 cm mapping studies have been used to, for example, quantify the star-formation efficiency in nearby galaxies (Leroy et al. 2008), measure the sizes of H I disks (e.g. Wang et al., 2016), determine galaxy rotation curves (e.g. Walter et al., 2008; Begum et al., 2008), and search for extra-planar gas (e.g. Heald et al., 2011). However, the faintness of the 21 cm transition has so far prevented us from detecting H I in emission from individual galaxies beyond (Fernández et al., 2016) or in stacked imaging beyond (Chowdhury et al., 2020, 2021, 2022a).
Alternatively, absorption signatures in the spectra of background quasars (QSOs) produced by high H I column density gas (Damped Ly absorbers, or DLAs; Wolfe et al., 2005) remain the quintessential technique for studying H I at high redshift. Through DLA characterization, we have been able to constrain the column densities, metallicities, kinematics, dust depletion, molecular fractions, and gas temperatures of H I reservoirs up to (e.g. Balashev et al. 2017; Prochaska & Wolfe 1997; Kanekar et al. 2014; Noterdaeme et al. 2008; Neeleman et al. 2013, 2015; Klimenko et al. 2020). Moreover, DLAs have been instrumental in determining the evolution of the metal enrichment and cosmic H I mass density since (e.g. Noterdaeme et al., 2012; Rafelski et al., 2012, 2014; Jorgenson et al., 2013; Prochaska et al., 2013; Crighton et al., 2015; Rao et al., 2017), connecting with estimates at lower redshifts from 21 cm observations (e.g. Jones et al., 2018; Bera et al., 2019).
On the other hand, it has been challenging to associate the properties of H I measured in absorption with the properties of galaxies measured in emission. DLA galaxies are typically much fainter than the background QSOs, and are found over a wide range of impact parameter (), which makes the identification of the galaxy through standard optical imaging and spectroscopy very challenging. Despite many searches, only about a dozen galaxies associated with DLAs at were detected in over a quarter of a century (e.g. Møller & Warren, 1993; Fumagalli et al., 2015). Fortunately, the detection rate has since increased. After it was realized that the stellar mass and gas-phase metallicity relation (e.g. Tremonti et al. 2004) also holds for absorption-selected systems (e.g. Møller et al., 2004; Ledoux et al., 2006; Fynbo et al., 2008), studies in the rest-frame UV/optical have started to target high-metallicity DLAs ([M/H]) with great success (e.g. Krogager et al., 2017).
At the same time, the advent of the Atacama Large Millimeter/sub-millimeter Array (ALMA) has enabled a search for DLA galaxies at millimeter and sub-millimeter wavelengths, where the QSOs are much fainter and line emission from cool or cold gas can be luminous. ALMA and Northern Extended Millimetre Array (NOEMA) images have been used to identify a further dozen star-forming counterparts of high-metallicity ([M/H]) DLAs through their CO emission at or their [C ii] 158m emission at (Neeleman et al., 2017, 2018; Fynbo et al., 2018; Neeleman et al., 2019; Kanekar et al., 2020; Kaur et al., 2022b).
Although searches for DLA galaxies in the CO and [C ii] 158m transitions have shown to be quite efficient, the downside is that they are bound to miss galaxies with high CO-to-H2 conversion factors or with relatively low molecular gas masses ( M⊙; Neeleman et al., 2019; Kanekar et al., 2020; Kaur et al., 2022b). Such undetected galaxies could reside at lower impact parameters than mm-detected galaxies, perhaps explaining why the impact parameters between mm-detected galaxies and DLA sightlines — kpc at and kpc at (Neeleman et al., 2017, 2018, 2019; Kanekar et al., 2020) — can exceed the sizes of H I gas reservoirs at in simulations ( kpc; Rhodin et al. 2019; Stern et al. 2021).
To search for galaxies with high CO-to-H2 conversion factors and/or low molecular gas masses, we can turn to rest-frame UV/optical emission. Among the standout emission lines at these wavelengths is Ly, which is produced in H II regions by recombining H I gas. However, only of Lyman-break galaxies (LBGs; Steidel et al. 1996, 1999, 2003; Shapley et al. 2003; Stark et al. 2009) at show Ly emission (e.g. Cassata et al., 2015). This is presumably due to the ease with which Ly is scattered by H I and absorbed by dust grains (e.g. Dijkstra & Kramer, 2012; Duval et al., 2014; Rivera-Thorsen et al., 2015; Gronke & Dijkstra, 2016; Gronke et al., 2016). As a result, the equivalent width of the Ly line is particularly high in galaxies with low H I gas covering fractions and low dust extinctions, i.e., low stellar-mass (M M⊙) galaxies (e.g. Oyarzún et al., 2016, 2017).
For these reasons, Ly searches have been exploited to detect DLA galaxies down to much lower metallicities ([M/H] ) than mm-wave transitions (e.g. Møller et al., 2004; Mackenzie et al., 2019; Lofthouse et al., 2023). To search for Ly emission at the DLA redshift, early searches used narrow-band imaging, yielding a few tentative detections (e.g. Smith et al., 1989; Lowenthal et al., 1991; Giavalisco et al., 1994; Fynbo et al., 2003; Kulkarni et al., 2006; Grove et al., 2009; Fynbo et al., 2023). More recently, Ly searches have capitalized on the sensitivities of new state-of-the-art optical integral field units (IFUs; e.g. Christensen et al., 2007; Péroux et al., 2011, 2012; Fumagalli et al., 2017; Mackenzie et al., 2019; Lofthouse et al., 2023). For instance, Fumagalli et al. (2017) used the Multi Unit Spectroscopic Explorer (MUSE) on the Very Large Telescope (VLT) to identify three Ly emitting sources associated with a DLA at . Building on this result, subsequent surveys with VLT/MUSE have found more than 20 Ly emitters out to impact parameters of kpc in the fields of low-metallicity DLAs at (e.g. Mackenzie et al., 2019; Lofthouse et al., 2020, 2023).
Motivated by the success of recent searches in Ly with IFUs, in this work we searched for Ly emission in the fields of 14 DLAs — nine of which have been previously studied in mm-wave CO emission — with the Keck Cosmic Web Imager Integral Field Spectrograph (KCWI; Morrissey et al., 2018) on the Keck II telescope. KCWI is an outstanding instrument for this search because of its high sensitivity at the observed-frame wavelength of Ly emission ( Å). Moreover, the effective field-of-view of kpc enables us to cover the impact parameter range expected for the primary emission counterparts of high H I column density absorbers ( kpc; e.g. Rahmati & Schaye, 2014; Rhodin et al., 2019).
The paper is structured as follows. We define our target sample of DLAs and describe the observations in Sections 2 and 3. We detail our methodology to identify and characterize Ly emission in Section 4. We present our results in Section 5, discuss their interpretation in Section 6, and provide a summary of the paper in Section 7. Throughout the paper, we assume km s-1 Mpc-1. All magnitudes are reported in the AB system (Oke & Gunn 1983).
2 The Sample
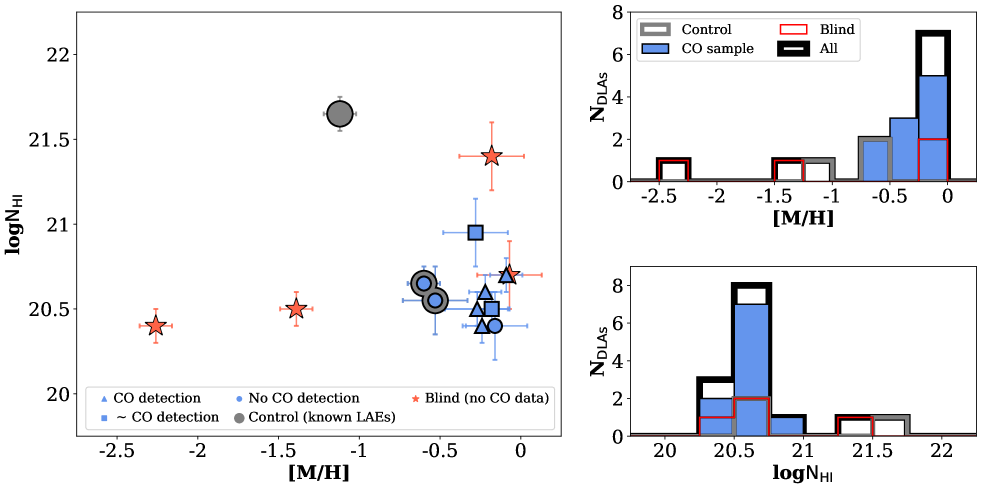
Rafelski et al. (2012, 2014) employed the Echellette Spectrograph and Imager (ESI; Sheinis et al. 2002) and the High Resolution Echelle Spectrometer (HIRES; Vogt et al. 1994) on the Keck Telescopes to obtain high-resolution spectroscopy for 50 QSOs. Novel in their analysis was that the DLA selection was based solely on H I column density (N), thus avoiding any metallicity biases. As part of their work, they also reanalyzed a collection of QSO spectra from the literature selected not to have a metallicity bias. It is from this sample that the majority of the DLAs in our work originate (B0458-020, J2206-1958a, B1228-113, B0201+365, B0551-366, B1230-101, J0453-1305, and J2206-1958b). In addition, three high-metallicity DLAs in our sample — J1305+0924, Q1755+578, and J1013+5615 — were characterized by Berg et al. (2015). Completing our sample are J2222-0946, J2225+0527, and J1709+3258, which were characterized by Fynbo et al. (2010), Krogager et al. (2016), and Kaplan et al. (2010), respectively. The properties of our DLAs — i.e., redshifts, N, and metallicities— are presented in Table 1 and in Figure 1. As is clear from the figures, our 14 target DLAs are dominated by high-metallicity absorbers ([M/H] ).
| QSO | ra | dec | Subsample | Exp. time [hr] | ||
|---|---|---|---|---|---|---|
| B0458-020 | 05:01:12.80 | -01:59:14.25 | 18.69 | 2.29 | control | 1 |
| J2206-1958a† | 22:08:52.07 | -19:43:59.86 | 16.82 | 2.57 | control/CO | 1.5 |
| J2222-0946 | 22:22:56.11 | -09:46:36.28 | 18.04 | 2.93 | control/CO | 1 |
| J1305+0924 | 13:05:42.77 | 09:24:27.75 | 18.95 | 2.04 | CO | 1 |
| B1228-113 | 12:30:55.56 | -11:39:09.79 | 19.63 | 3.53 | CO | 1 |
| B0201+365 | 02:04:55.60 | 36:49:17.99 | 18.04 | 2.91 | CO | 1 |
| B0551-366 | 05:52:46.18 | -36:37:27.60 | 16.98 | 2.32 | CO | 0.83 |
| J2225+0527 | 22:25:14.70 | 05:27:09.06 | 17.84 | 2.32 | CO | 1 |
| J1709+3258 | 17:09:09.28 | 32:58:03.40 | 19.17 | 1.89 | CO | 0.5 |
| B1230-101 | 12:33:13.16 | -10:25:18.44 | 19.26 | 2.39 | CO | 0.83 |
| J0453-1305 | 04:53:13.57 | -13:05:55.09 | 16.99 | 2.26 | blind | 0.66 |
| J2206-1958b† | 22:08:52.07 | -19:43:59.86 | 16.82 | 2.57 | blind | 1.5 |
| Q1755+578 | 17:56:03.63 | 57:48:47.99 | 18.55 | 2.11 | blind | 1.17 |
| J1013+5615 | 10:13:36.38 | 56:15:36.41 | 18.61 | 3.63 | blind | 1 |
Note. — There are two DLAs along the sightline of J2206-1958 ().
2.1 The CO subsample
By design, our sample of target DLAs is dominated by systems with ancillary CO observations. These observational campaigns were conducted with ALMA (Kanekar et al., 2020), NOEMA (Kaur et al., 2022b), and the Karl G. Jansky Very Large Array (JVLA; B. Kaur et al. 2023, in preparation). Those authors searched for mm-wave redshifted CO(1–0), CO(2–1), CO(3–2), or CO(4–3) emission from the fields of 20 high-metallicity ([M/H]) DLAs at . They identified six robust ( significance) and two tentative () detections of redshifted CO emission, obtaining a CO detection rate of galaxies around their highest-metallicity DLAs ([M/H] ). Five of the CO detections have impact parameters in the range kpc (Neeleman et al., 2018; Kanekar et al., 2020; Kaur et al., 2022b). The sixth CO detection is at kpc (Fynbo et al., 2018; Kanekar et al., 2020) in a system at where a DLA galaxy has been identified at kpc (Q0918+1636; Fynbo et al. 2011, 2013). For the 13 CO nondetections, the median 3 upper limit on the molecular gas mass is M⊙, for a CO-to-H2 conversion factor of M⊙ (K km s-1 pc2)-1 (e.g. Bolatto et al., 2013). Of the 14 DLAs in our sample, nine have CO studies, with four CO detections, two tentative detections, and three nondetections see (Tables 1 and 2). We will refer to these nine DLAs as the CO subsample throughout.
2.2 The Control subsample
Earlier Ly searches for galaxies at low impact parameters have obtained detections in two of the DLAs in the CO subsample. Ly emission in the field of the DLA towards J2222-0946 was first reported, at kpc, by Fynbo et al. (2010) (see also Krogager et al., 2013, 2017). The DLA towards J2206-1958 also has an associated Ly-emitting galaxy (at kpc; Møller et al., 2002). No CO emission was detected in either of these fields by Kanekar et al. (2020). A third DLA in our sample, this time without ancillary CO observations, has also been detected in Ly. This galaxy is at towards B0458-020 and at an impact parameter of kpc (Møller et al., 2004; Krogager et al., 2017). Together, the three known Ly emitters in the fields of J2222-0946, J2206-1958, and B0458-020 constitute our control sample. They were used to assess the efficacy of our survey and to search for additional Ly associations at larger impact parameters.
2.3 The “Blind” subsample
The remaining four DLA fields (Table 1) compose the “blind” sample, i.e. absorbers without earlier searches for the associated galaxies. One of these four DLAs lies towards J2206-1958, a sightline containing one of our control DLAs. The remaining three blind-sample DLAs were observed due to their convenient celestial coordinates in the context of our observational strategy. They will be the targets of future CO observations with ALMA , NOEMA, and/or the JVLA.
3 Observations
The 14 DLA fields in this work were observed with the Keck Cosmic Web Imager Integral Field Spectrograph (KCWI; Morrissey et al., 2018), on the Keck II telescope. KCWI is optimized for observations in the Å spectral range with resolution . The size of a spaxel is , which corresponds to a physical size of kpc at . We opted for the configuration with a field of view at a spatial resolution of and with a spectral resolution of or , depending on the target. At , this configuration corresponds to a field-of-view of kpc and a spatial resolution of kpc.
The first set of KCWI observations was conducted in 2019 September and October, with later observing runs in 2021 February and April. The on-target exposure time varied between 0.5 hr and 1.5 hr, with DLAs with ancillary CO observations given priority. We obtained line flux sensitivities of erg s-1 cm-2 at , depending on the exposure time and the DLA redshift (i.e. the redshifted Ly wavelength).
The KCWI data were analysed with PypeIt111https://pypeit.readthedocs.io/en/release/, a Python package designed for the semi-automated reduction of astronomical spectroscopic data222https://pypeit.readthedocs.io/en/release/spectrographs/
keck_kcwi.html. We used the built-in routines to perform bias subtraction, dark correction, and trace pattern identification. For wavelength calibration, we used FeAr lamps. The flat-fielding of the data accounted for pixel-by-pixel variations and the dome illumination pattern. The faintness of our targets allowed PypeIt to use the science frames themselves to perform sky subtraction. Bright objects, such as the QSO in each field, were detected and masked in the computation of the sky model. The astrometric solution of the data cubes was revised using the coordinates of the QSOs.
3.1 Flux calibration
Observations of standard stars () prior to or after the science exposures were used for flux calibration. We used PypeIt to compute the flux sensitivity curves from these standard stars. The first step of the process was to flux calibrate the data cubes of the standard stars. We verified that this step was performed appropriately by comparing the flux-calibrated standard data cubes with the well-characterized standard spectra. Then, the flux-calibrated standard star data cubes were used as the input sensitivity curves in the co-addition of all the data cubes (i.e., exposures) for each target.
To quantify the accuracy of our flux calibration, we searched for publicly available observations of the QSOs (; Table 1) in our sample. Four of the QSOs — J2222-0946, J1305+0924, J1709+3258, and J1013+5615 — were observed in the Baryon Oscillation Spectroscopic Survey (BOSS) of the Sloan Digital Sky Survey (SDSS; Alam et al. 2015). We found that our flux-calibration is consistent with that of SDSS/BOSS within a factor of . To maximize the accuracy of our flux calibration, we estimated a flux-correction factor by maximizing the likelihood between the KCWI and the SDSS/BOSS spectra. An optimal flux correction factor of 1.8 was found and used to re-scale our flux-calibrated spectra. The dispersion among these measurements indicates that our flux calibration has a standard error of 12%. All errors on the line fluxes reported in this paper include this factor of 0.12. Finally, all fluxes were corrected for Milky Way extinction using the Fitzpatrick (1999) extinction curve, the dust reddening maps from Schlegel et al. (1998), and the reddening to conversion tabulated in Schlafly & Finkbeiner (2011).
4 Methodology
4.1 Subtraction of the sky background and the QSO continuum
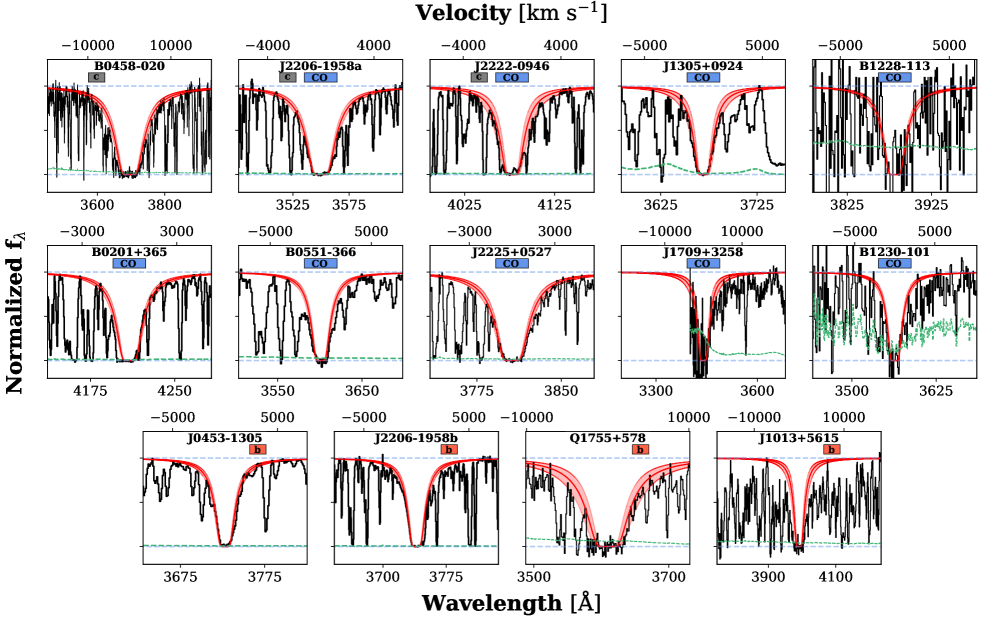
Figure 2 shows the fully-reduced KCWI spectra towards each target QSO centered at, and zoomed in on, the redshifted Ly absorption line of each of the 14 DLAs. Before searching for emission lines at the DLA redshift, characterization of the QSO emission was required. We started by constructing a QSO continuum model for the data cube of every target. To do this, we computed , a least-squares Chebyshev series fit to the QSO continuum in the brightest spaxel. Then, was scaled throughout the data cube to produce the initial continuum model cube
| (1) |
where is the spaxel-dependent QSO continuum scaling factor. The spaxel-dependent error in the spectra — — was then used to estimate
| (2) |
i.e., the mean signal-to-noise of the QSO continuum throughout the data cube. Thresholds in were imposed to identify spaxels affected by the QSO continuum. Depending on the target, we found the optimal value for the threshold — determined through visual inspection — to vary between 5 and 14.
In order to estimate the background emission throughout each cube, all spaxels affected by QSO emission were masked. After masking, the median spectrum across each data cube was fitted with a Chebyshev series to obtain the background model . Implementation of the median instead of the mean ensured that no serendipitous background sources affected our estimate of . For each field, a background-subtracted data cube was then computed, which then was used to measure again; this time without contributions from the sky background. Finally, the QSO continuum model was subtracted from this residual data cube.
4.2 Ly line measurements
We searched for emission lines in the processed data cubes in 1000 km s-1 velocity slices centered at the wavelength of the DLA. To avoid the wings of the DLA, narrower velocity slices had to be used at the position of the QSO. Depending on the target, values between 500 km s-1 and km s-1 were used. Then, gaussian emission lines were fitted in these velocity slices for every spaxel. The free parameters of the fit were the line centroid, the peak flux density, and the line width. This step was repeated 500 times on 500 error-perturbed spectra for every spaxel, which yielded a line flux distribution for every spaxel around the expected redshifted Ly wavelength. The mean and the standard deviation of each distribution were taken as the measured line flux and line flux error (FLyα and ) at every spaxel.
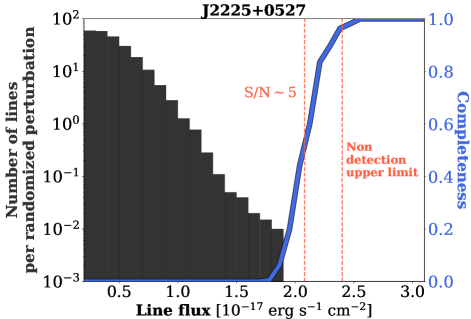
To associate a to an emission line, we quantified the line flux distribution across the data cube around the expected redshifted Ly wavelength. To do this, we first masked all emission lines with significance, and then added back the background and the QSO emission. We then produced 200 error-perturbed data cubes for every target and carried out background- and QSO-subtraction for each such cube. Line fluxes were then measured across these data cubes, yielding a false positive line flux distribution for every spaxel around the redshifted Ly wavelength (see Figure 3). The line fluxes of the error-perturbed data cubes were then rank-ordered to obtain the correspondence between line flux and percentile. This correspondence was used to assign a to every Ly line flux measurement in the original data cube.
We found that effectively separates significant and spurious detections in the KCWI data cubes. For all significant detections, we recomputed the line fluxes to ensure that we account for spatially extended sources. To this end, we coadded the spectra of all the spaxels adjacent to the spaxel containing the detection. Our line flux fitting algorithm (see above) was then used to estimate the total line flux in the coadded spectrum. The Ly line fluxes and errors reported throughout the rest of the paper correspond to the values measured in the coadded spectra. The was not recalculated, i.e., the values of reported throughout were measured in the spaxel showing the highest significance.
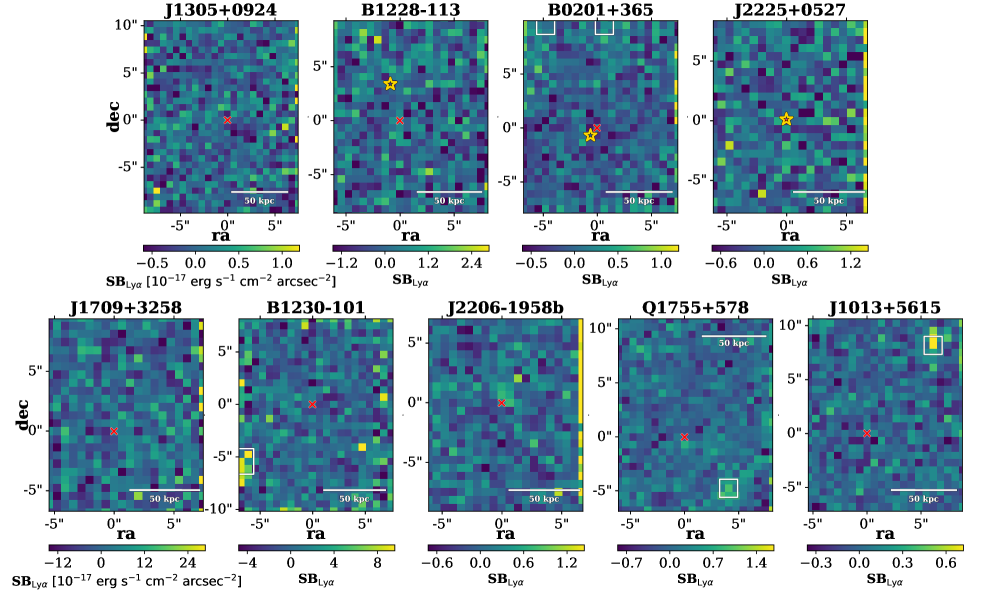
For targets with no significant detections, we characterized our line flux sensitivity within the KCWI field-of-view. To this end, we inserted 10,000 emission lines with varying line fluxes and profile shapes in randomized locations within each data cube. The shapes of the simulated emission lines were chosen to be Gaussian, with 1 widths between 150 km s-1 and 225 km s-1. The line flux at which we were able to recover 95% of the lines with at least was defined as our Ly sensitivity limit (Figure 3).
Inspection of the data cubes revealed 14 sources of continuum emission. With no line emission at the expected redshifted Ly wavelength, these sources are most likely foreground interlopers at redshifts lower than that of the DLA. Of the 14 sources, 7 are bright at the redshifted Ly wavelength, and we therefore highlight them in white boxes in figures throughout the paper.
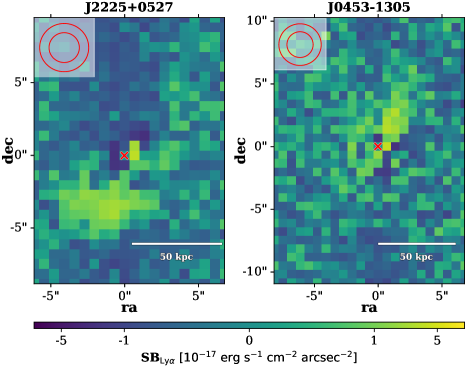
We also performed a search for Ly nebulae around the QSOs of our sample. This search could not be performed for four of the 13 QSOs (J2222-0946, B1228-113, B0201+365, and J1013+5615) because their Ly emission was redshifted out of the spectral coverage of KCWI. Out of the remaining nine QSOs, we found evidence for spatially extended Ly emission in two cases. The emission extends over at least 70 kpc around QSO J2225+0527 and over kpc around QSO J0453-1305. The two Ly nebulae are shown in Figure 4. In passing, we note that the spatial resolution of our observations at the redshift of the QSO is typically kpc FWHM, implying that the Ly emission extends over at least two spatial beams in both cases. Similarly to Herenz et al. (2015), we find that the Ly nebulae incidence rate () is lower than what is typically obtained in dedicated searches (; e.g. Roche et al. 2014; Arrigoni Battaia et al. 2016, 2019; Farina et al. 2017, 2019; Cai et al. 2019; O’Sullivan et al. 2020), although we are limited by small-number statistics.
| QSO | Sample | [M/H] | FLyα | LLyα | b | |||
|---|---|---|---|---|---|---|---|---|
| [] | [ erg s-1 cm-2] | [ erg s-1] | [kpc] | |||||
| B0458-020 | control | 2.0396 | 21.65 0.1 | -1.12 0.1 | 2.041 | (6.3) | ||
| J2206-1958a† | control/CO(✗) | 1.9200 | 20.65 0.1 | -0.60 0.1 | 1.923 | (6.5) | ||
| J2222-0946 | control/CO(✗) | 2.3543 | 20.55 0.2 | -0.53 0.2 | 2.357 | (19.3) | ||
| J1305+0924 | CO(✗) | 2.0184 | 20.4 0.2 | -0.16 0.2 | – | – | ||
| B1228-113 | CO(✓) | 2.1928 | 20.6 0.1 | -0.22 0.1 | – | – | ||
| B0201+365 | CO(✓) | 2.4628 | 20.4 0.1 | -0.24 0.1 | – | – | ||
| B0551-366 | CO(✓) | 1.9622 | 20.5 0.1 | -0.27 0.2 | 1.963 | (9.2) | ||
| 1.957 | (6.4) | |||||||
| J2225+0527 | CO(✓) | 2.1310 | 20.7 0.1 | -0.09 0.1 | – | – | ||
| J1709+3258 | CO() | 1.8300 | 20.95 0.2 | -0.28 0.2 | – | – | ||
| B1230-101 | CO() | 1.9314 | 20.5 0.1 | -0.18 0.1 | – | – | ||
| J0453-1305∗ | blind | 2.0666 | 20.5 0.1 | -1.39 0.1 | 2.067∗ | (4) | ||
| J2206-1958b† | blind | 2.0762 | 20.4 0.1 | -2.26 0.1 | – | – | ||
| Q1755+578 | blind | 1.9692 | 21.4 0.2 | -0.18 0.2 | – | – | ||
| J1013+5615 | blind | 2.2831 | 20.7 0.2 | -0.07 0.2 | – | – |
Note. — The symbols in the second column denote significant detections (✓), tentative detections (), and nondetections (✗) in the CO imaging. There are two DLAs along the sightline of J2206-1958 (). The DLA along B0551-366 has two detections in Ly. The DLA along J0453-1305 is a tentative Ly detection (). The uncertainty on the Ly line flux includes the error on the absolute flux calibration, and thus it should not be used to estimate the significance of the line. The signal-to-noise ratios of the individual detections are listed in parenthesis, next to the Ly flux measurements.

5 Results
We detected 5 statistically significant Ly emission lines in the fields of 4 of the 14 DLAs in our sample — towards B0458-020 (), J2206-1958 (), J2222-0946 (), and B0551-366 ( and ). The spatially integrated Ly emission spectra and the velocity-integrated Ly images for these detections are plotted in Figure 5. Three of these DLAs belong to our Ly control sample, i.e., these three Ly emitters had been earlier identified via slit spectroscopy (Møller et al., 2002, 2004; Fynbo et al., 2010). We also note that two of these control DLAs, towards J2222-0946 and J2206-1958, are part of the CO sample. No CO emission was detected by Kanekar et al. (2020).
The fourth and fifth Ly detections are towards B0551-366. This DLA is part of the CO sample, featuring a CO detection. The Ly emitters are at impact parameters of kpc and kpc (see Figure 5), which are much larger than the impact parameter of the CO emitter in this system ( kpc). Remarkably, the Ly redshift of the galaxy that is kpc away from the DLA sightline is in excellent agreement with the DLA redshift ( km s-1; Figure 5).
None of the 6 DLAs with significant or tentative CO detections show any evidence for Ly emission within kpc of the DLA (see Figures 5 and 6). In passing, we note that the tentative CO detection at towards J1709+3258 is just outside the field-of-view of our KCWI coverage. Finally, of the 4 DLAs in the “blind” sample, we obtained a tentative () detection of Ly emission at towards J0453-1305. The Ly emission spectrum and image for this tentative detection are shown in the last column of Figure 5. Our detections and nondetections of Ly emission are summarized in Table 2.
The Ly emitter associated with the DLA along the sightline to B0458-020 was first reported by Møller et al. (2004, see also , ). The galaxy was found to have a Ly flux of erg s-1 cm-2 at an impact parameter of kpc to the DLA sightline (Krogager et al., 2017). For the DLA along J2222-0946, the Ly emitter was characterized in Fynbo et al. (2010) and Krogager et al. (2013), with a Ly flux of erg s-1 cm-2 at an impact parameter of kpc (Krogager et al., 2017). Finally, the galaxy associated with the DLA towards J2206-1958 was found to have a Ly flux of erg s-1 cm-2 at an impact parameter of kpc by Møller et al. (2002). In all three cases, our measurements for the Ly fluxes and impact parameters of the Ly emitters (see Table 2) are consistent (within significance) with the above measurements from the literature.
For the new Ly detections, the Ly emitters along the sightline towards B0551-366 have fluxes of erg s-1 cm-2 for the source at an impact parameter of kpc, and of erg s-1 cm-2 for the source at kpc. For the tentative Ly detection associated with the DLA towards J0453-1305, we obtain a line flux of erg s-1 cm-2 at an impact parameter of kpc. We obtain for this emitter, which was determined via simulations of the data cubes. Note that the error on the flux is dominated by the error in the flux scale.
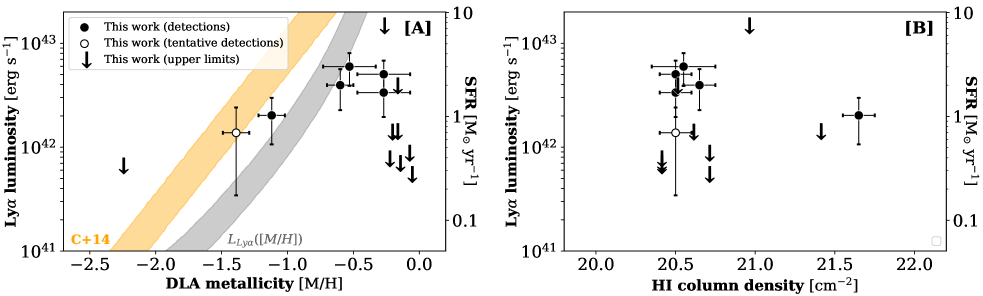
Figure 7 shows the results of our Ly searches from galaxies associated with DLAs at , with Ly luminosity plotted as a function of [A] DLA metallicity and [B] H I column density. Ly detections are shown as filled black circles and Ly nondetections (and upper limits on the Ly luminosity) as downward-pointing arrows. The gray shaded region shows the expected Ly luminosity for a given galaxy metallicity, assuming the observed stellar mass–metallicity relation for star-forming galaxies at (Erb et al., 2006) and the galaxy main-sequence relation at (with an assumed spread of dex; Whitaker et al., 2014; Mérida et al., 2023). After using the H SFR calibration of Kennicutt & Evans (2012), a dust-free Ly to H luminosity ratio of 8.7, and a (Chabrier, 2003) initial mass function (e.g. Matthee et al., 2016; Oyarzún et al., 2017; Sobral & Matthee, 2019), the above relations were used to determine the expected H line luminosity as a function of galaxy metallicity. Similarly, also shown in Figure 7 (orange) is the expected Ly luminosity if one takes the mass-metallicity relation of DLA absorption-selected galaxies with a scatter of 0.38 dex (Møller et al. 2013; Christensen et al. 2014).
It is clear from Figure 7[A] that most of our Ly detections arise in the fields of DLAs with relatively low absorption metallicities. Indeed, only one of the nine DLAs with [M/H] shows a detection of Ly emission, while four of the five DLAs with [M/H] show either clear or tentative detections of Ly emission. Further, the figure shows that many of the Ly detections of our survey lie close to the grey shaded region, i.e. are in reasonable agreement with the expected Ly line luminosity, despite the strong assumptions of (1) a dust-free Ly to H luminosity ratio and (2) absorption metallicity equal to emission metallicity. This is seen to be the case for all DLAs with [M/H] . However, for the higher-metallicity DLAs, with [M/H] , most of the upper limits on the Ly line luminosity are in clear conflict with the expected line luminosity, typically lying more than an order of magnitude below the expected values. The most likely cause of this discrepancy is significant dust extinction of the Ly line in the galaxies in the fields of the highest-metallicity DLAs at (more in Section 6).
While no clear trend is apparent in Figure 7[B], which plots the Ly line luminosity versus DLA H I column density, we cannot yet conclude that Ly luminosity is not correlated with N for DLAs at . Apparent in this figure is that the coverage toward N cm-2 in current surveys is limited. While the survey by Krogager et al. (2017) included some high N DLAs, the associated galaxies are biased toward low impact parameters due to the slit-based nature of their search. Therefore, more data is needed to determine how N and Ly luminosity are related at these redshifts.
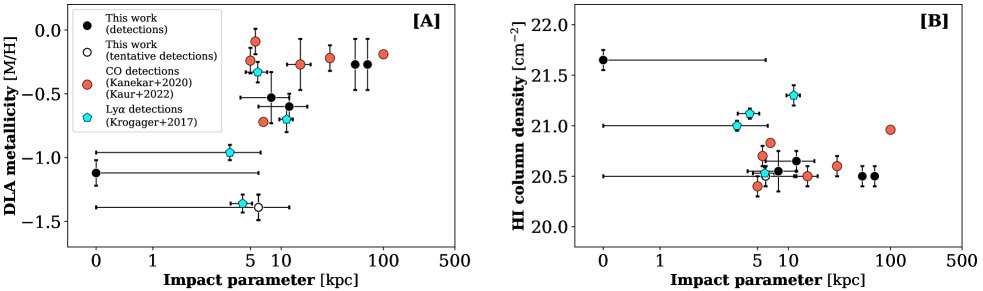
The two panels of Figure 8 show [A] the DLA metallicity [M/H], and [B] the DLA H I column density, plotted against galaxy impact parameter for our six detections of Ly emission at . Besides these Ly detections, we have included the 6 DLA galaxies identified in ALMA and NOEMA CO searches at (Kanekar et al., 2020; Kaur et al., 2022a) and the five Ly detections at similar redshifts obtained via slit spectroscopy in the literature (Krogager et al., 2017).
Figure 8[A] shows that there are galaxies over a wide range of impact parameters ( kpc) in the fields of high-metallicity ([M/H] ) DLAs. This suggests that high-metallicity DLAs at may arise from both galaxy disks and extended gas in the environment of massive galaxies, with the circumgalactic medium (CGM) being enriched due to galactic outflows. Conversely, the DLA galaxies associated with low metallicity ([M/H] ) DLAs are seen to have low impact parameters ( kpc; although we note that there are only four galaxies in this category). Figure 8[B] plots the H I column density against impact parameter for the above sample of Ly-detected and CO-detected galaxies. It is clear that similar H I column densities, cm-2 are found in DLAs over a wide range of galaxy impact parameters, kpc.
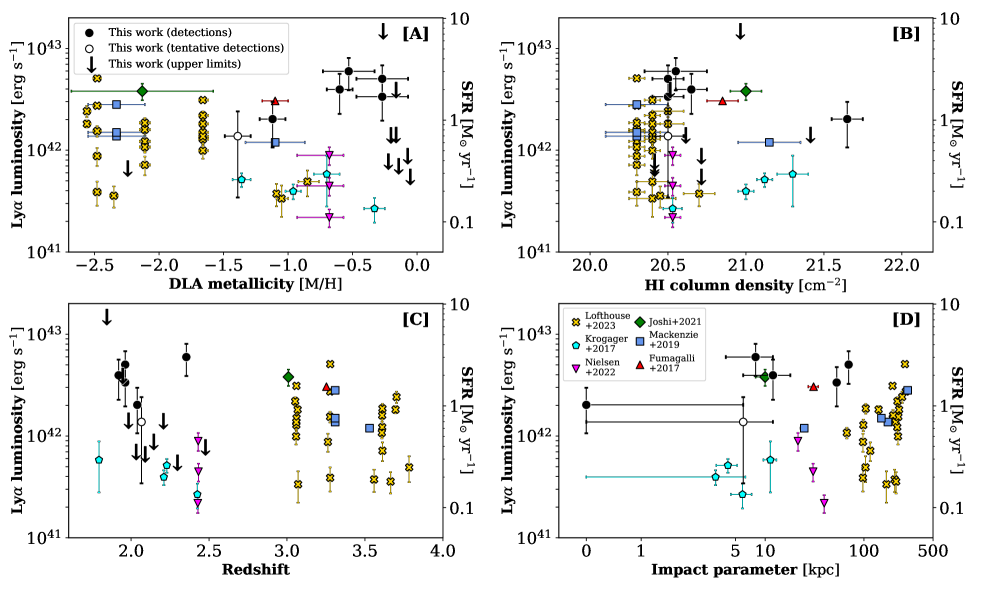
Finally, Figure 9 compares our results to those obtained from IFU- and slit-based Ly searches in the fields of high-redshift DLAs in the literature. Included in this figure are the Ly detections and nondetections from our work, four slit-based detections around four DLAs at (Krogager et al., 2017), 5 Ly emitters around 3 DLAs at (Fumagalli et al., 2017; Mackenzie et al., 2019), a Ly emitter at (Joshi et al., 2021), 3 Ly emitters around a DLA (Nielsen et al., 2022), and 23 Ly emitters around 9 DLAs at (Lofthouse et al., 2023). We emphasize that the Ly detections shown in this figure span a wide range of impact parameters, and that these previous observations have shown that DLAs can arise from galaxy groups (e.g., Fynbo et al., 2018). It is therefore likely that some of the galaxies at large impact parameter are companion galaxies of the galaxy that gives rise to the DLA absorption (e.g. Mackenzie et al., 2019; Lofthouse et al., 2023). This is consistent with the results from hydrodynamical simulations (e.g., Rahmati & Schaye, 2014; Rhodin et al., 2019).
The different panels in Figure 9 show how the Ly luminosity depends on [A] DLA metallicity, [B] H I column density, [C] redshift, and [D] impact parameter. We note that the DLAs with searches for Ly emission at typically have low metallicities, [M/H] , while most of our KCWI searches are in the fields of high-metallicity DLAs. The luminosity of our upper limits decreases with redshift, reflecting how the spectral signal-to-noise decreases substantially for as a result of the degradation in sensitivity of KCWI blueward of 3700 Å.
Figure 8[D] might hint that DLAs at are more often associated with galaxy groups (with galaxies) than DLAs at . Four out of 13 DLAs at feature at least 3 Ly emitters in their fields (Mackenzie et al., 2019; Lofthouse et al., 2023), while only a single DLA at (out of 15) has associated Ly emitters (Nielsen et al., 2022). However, this apparent difference could be driven by variations in survey design. There is a significant difference between the field-of-views of KCWI ( kpc) and VLT-MUSE (), the instrument used by the surveys of Mackenzie et al. (2019) and Lofthouse et al. (2023). This difference becomes even greater when we consider that our effective field-of-view is kpc (Section 3), which can be even smaller if the QSO is not perfectly centered (Figures 5 and 6). Difference in sensitivities between the surveys could also play a role, with Mackenzie et al. (2019) and Lofthouse et al. (2023) achieving lower Ly luminosities than our analysis (Figure 9). Thus, it is clear that searches with wider fields of view and higher sensitivities at are needed to test for possible redshift evolution in DLA environments.
6 Discussion
Our KCWI survey has yielded new detections of Ly emission along the DLA sightline towards B0551-366, a tentative detection from the DLA field towards J0453-1305, and recoveries of all three known Ly detections from the control sample. Restricting to the new (i.e. non-control) searches, we have obtained definite Ly detections along only a single DLA sightline out of 11, with nine of the target DLAs having high metallicities ([M/H] ). We also do not detect Ly emission from any of the 4 CO-emitting galaxies in the sample, although one of these sightlines (B0551-366) shows Ly emission from two other galaxies within km s-1 of the CO and DLA redshifts. We discuss in this section the implications of these results, in conjunction with those from surveys from the literature, to gain insights into the nature of the galaxies associated with high-metallicity DLAs at .
6.1 The galaxies associated with high-metallicity DLAs at are not typical Ly emitters
The left panel of Figure 7 shows that the Ly luminosity of galaxies in the field of high-metallicity ([M/H] ) DLAs at lies well below the predicted Ly luminosity of emission-selected galaxies at similar redshifts. We emphasize that the predicted Ly luminosity has been obtained with the assumption of a dust-free Ly-to-H ratio. There are two possibilities to explain this discrepancy: (1) the galaxies associated with high-metallicity DLAs have low stellar masses, and hence intrinsic Ly luminosities below our detection threshold, or (2) the assumption of a dust-free Ly-to-H ratio breaks down, with the galaxies associated in high-metallicity DLA fields being typically massive, dusty galaxies with high production, high absorption of Ly photons. In this section, we consider the first possibility by turning to two different methods of estimating the luminosities of low mass (M) galaxies. As shown in Oyarzún et al. (2016, 2017), galaxies of this stellar mass have Ly equivalent widths (Å; Charlot & Fall 1993) and escape fractions (; Laursen et al. 2009) that are typical of dust-free interstellar media.
In the first approach, we will assume that any undetected galaxies belong to the star-formation main sequence at . The slope and scatter of the main sequence at has been measured down to a stellar mass of M by Mérida et al. (2023). At this mass, the SFR distribution has an average of log(SFR/M⊙ yr and a scatter of log(SFR/M⊙ yr dex. Following the approach of Section 5, this SFR can be converted into a Ly luminosity LLyα by assuming a dust-free Ly-to-H ratio and the H SFR calibration for a Chabrier IMF. In the resulting LLyα distribution, the probability that a galaxy has a Ly luminosity lower than our upper limits is (on average) for the 8 high-metallicity DLAs with tight upper limits on the Ly luminosity (i.e. J1305+0924, B1228-113, B0201+365, J2225+0527, B1230-101, Q1755+578, and J1013+5615). Thus, the probability that all of these DLAs feature typical Ly emitters with M within kpc of the QSO sightline is .
Alternatively, we can turn to the rest-frame Ly equivalent width (EWLyα) instead of the Ly luminosity. This quantity is defined as
| (3) |
where FLyα is the Ly line flux and is the rest-frame flux density of the galaxy in the near-UV. We note that the EWLyα is a convenient metric because the EWLyα distribution of high-redshift galaxies has been thoroughly quantified in the literature (e.g. Gronwall et al. 2007; Treu et al. 2012; Jiang et al. 2013).
For low-mass galaxies with M and log(SFR/M⊙ yr, the rest-frame near-UV flux densities are typically in the range erg s-1 cm-2 Å-1 (e.g. Skelton et al. 2014). With in hand and the upper limits on the Ly line flux density, we obtain typical upper limits to the rest-frame equivalent width of EWÅ within kpc of the 8 high-metallicity DLAs in our sample.
The expected Ly detection rate of our observations can now be estimated from the known EWLyα distribution of galaxies at . A number of authors have concluded that the EWLyα distribution at this redshift is well fitted by an exponential profile with a scale length of Å (e.g. Nilsson et al., 2009; Guaita et al., 2010; Mawatari et al., 2012; Ciardullo et al., 2014). Knowing that the EWLyα distribution accounts for of the galaxy population at M (; Oyarzún et al. 2016), integration of this probability distribution from EW up to our EWLyα limits yields of the probability that a M galaxy was not detected by our survey. This results in total probabilities of for each of our 8 nondetections, yielding a probability of that all of these 8 high-metallicity DLAs have low stellar mass galaxies within kpc of the QSO sightline.
These results indicate that the majority of the galaxies associated with high-metallicity DLAs at are not unobscured galaxies with low stellar masses, i.e., M. In fact, characterization of the galaxies associated with high-metallicity DLAs at has yielded stellar masses exceeding M⊙ (e.g. Fynbo et al. 2013).
6.2 The galaxies associated with high-metallicity DLAs at are probably massive and dusty
A galaxy can also remain undetected in Ly emission if it has a low Ly escape fraction. This would typically arise because of Ly photon absorption by dust grains, as indicated by several radiative transfer simulations (e.g. Verhamme et al., 2008; Laursen et al., 2009). This has been argued to be the reason for why high-redshift galaxies with redder UV slopes show lower Ly emission equivalent widths (e.g. Blanc et al., 2011; Hayes et al., 2011; Atek et al., 2014; Oyarzún et al., 2017). At the same time, the escape of Ly photons is affected by the scattering of radiation by neutral gas, such that the structure and kinematics of the interstellar and circum-galactic media of galaxies can shape the Ly line profile (e.g. Verhamme et al. 2006).
The dependence of the Ly escape fraction on the neutral gas covering fraction and dust extinction has implications for the use of Ly as a galaxy tracer. Star-forming galaxies with higher neutral gas masses and dust extinctions tend to have higher stellar masses (e.g. Reddy et al., 2006; Finlator et al., 2007; Tacconi et al., 2020), implying that Ly emission might not be a good tracer of the high stellar mass end of the star-forming galaxy population. In agreement with this picture, the equivalent width of the Ly emission line in high-redshift galaxies has been found to anti-correlate with the stellar mass (e.g. Oyarzún et al., 2016).
Instead, massive galaxies tend to be bright in mm or sub-mm emission lines (e.g. CO or [C ii] 158m), whose luminosity correlates with the total molecular gas mass (i.e. with the stellar mass). Thus, it is not surprising that the CO rotational lines have been particularly useful in identifying the galaxies associated with the highest-metallicity DLAs at (Kanekar et al., 2020; Kaur et al., 2022b). Kaur et al. (2022b) find that the detection rate of CO emission is strongly dependent on DLA metallicity, with a CO detection rate of for [M/H], and a far lower CO detection rate at lower metallicities.
The suggestion that Ly and CO emission are efficient at identifying the galaxies associated with DLAs of different metallicities is supported by Figures 8[A] and 9. Galaxies detected through Ly emission tend to be brighter for DLAs with [M/H] . This is likely to arise due to dust obscuration effects, with higher-metallicity galaxies also having high dust contents that impede the escape of Ly photons. Conversely, the requirements of both a high molecular gas mass and a low CO-to-H2 conversion factor imply that searches for CO emission favour the identification of the high-mass galaxies associated with high-metallicity DLAs. In line with the detection of dusty galaxies in association with high-metallicity DLAs, it is plausible that the majority of these absorbers arise from massive, dusty galaxies that are faint in Ly emission (e.g. Fynbo et al., 2013).
In this context, it is interesting to consider why some of the highest-metallicity DLAs show no evidence of CO emission from associated galaxies (Kanekar et al., 2020; Kaur et al., 2022b). This is likely a result of the sensitivities of the current ALMA and NOEMA searches, which typically yield upper limits of on the molecular gas masses of these galaxies (Kanekar et al., 2020; Kaur et al., 2022b). These upper limits are not necessarily constraining, and thus current CO nondetections do not rule out the presence of massive galaxies in the DLA fields.
Given that high-mass galaxies associated with high-metallicity DLAs may be missed in searches for both Ly and CO emission, turning to different diagnostics emerges as a valid strategy. The best probes to identify such galaxies are likely to be H, [O iii]5007, and [C ii] 158m emission. The H and [O iii]5007 lines are less affected by dust obscuration than Ly, and can be used to probe galaxies in the stellar mass range M (e.g. Péroux et al., 2011, 2012; Jorgenson & Wolfe, 2014; Wang et al., 2015). While this line is difficult to access from the ground for galaxies at , the James Webb Space Telescope should allow the H-based identification of large samples of high-mass DLA galaxies out to . Similarly, while the [C ii] 158m emission from galaxies at lies at very high frequencies ( GHz), it should be possible to use ALMA [C ii] 158m searches to identify such galaxies.
6.3 Implications for the nature of H I-selected galaxies at high redshift
Searches for the galaxies associated with DLAs at high redshift have made remarkable progress over the last few years, with more than 40 galaxies identified via Ly, CO, or [C ii] 158m searches (e.g. Krogager et al., 2017; Fumagalli et al., 2017; Neeleman et al., 2017, 2018, 2019; Mackenzie et al., 2019; Kanekar et al., 2020; Kaur et al., 2022b; Lofthouse et al., 2023). While we now have a large sample of H I-selected galaxies, the wide range of DLA redshifts (), DLA metallicities ([M/H] ), and different selection techniques imply that it is not straightforward to draw conclusions about their nature. Here, we briefly summarize the current observational view of this population in order of increasing redshift.
First, the bulk of the H I-selected galaxies identified in slit-based Ly searches at lie at low impact parameters to the QSO sightline (e.g. Fynbo et al., 2013; Krogager et al., 2016, 2017; Joshi et al., 2021). This is not surprising, given that such searches are only sensitive towards galaxies at low impact parameters ( kpc). By design, these DLAs have high metallicities, i.e., between [M/H] and [M/H] (Krogager et al., 2017). The fraction of undetected galaxies and their H I metallicity distribution remains unclear.
At , our KCWI Ly survey has revealed only 2-3 new H I-selected galaxies from a search in 11 DLA fields (excluding the control sample). Nine of our DLA targets have [M/H] , of which only one showed a detection of Ly emission. The KCWI survey is sensitive to galaxies with impact parameters kpc.
At , ALMA and NOEMA CO searches have yielded six definite detections of H I-selected galaxies, all in the fields of DLAs with a metallicity of [M/H] . (Kanekar et al., 2020; Kaur et al., 2022b). Five of the CO detections are at impact parameters of kpc. The sixth system, towards Q0918+1636, has an impact parameter of kpc; however, there is a galaxy at lower impact parameter ( kpc) to the QSO sightline that was identified in the optical (Fynbo et al., 2018). While the field of Q0918+1636 was not targeted by our survey, the DLA galaxy at an impact parameter of kpc has been extensively characterized by Fynbo et al. (2011). The nondetection of Ly emission from this galaxy down to fluxes of erg s-1 cm-2 is indicative of dust supression, especially given the high luminosity of its [O ii] and [O iii] emission (Fynbo et al., 2011).
At , Ly spectroscopy with VLT/MUSE has yielded Ly detections of galaxies in DLA fields (Fumagalli et al., 2017; Mackenzie et al., 2019; Lofthouse et al., 2023). These DLAs have metallicities between [M/H] and [M/H] . Almost all of the Ly detections are at high impact parameters ( kpc), and there are, in some cases, more than 5 galaxies identified in a single DLA field. Such galaxies would not have been detected either in the slit-based Ly surveys (because of the field of view) or in the present KCWI survey (because of the sensitivity and/or field of view).
Finally, searches in [C ii] 158m at with ALMA have identified 10 galaxies in the fields of DLAs with [M/H] (e.g. Neeleman et al., 2017, 2019; Prochaska et al., 2019; Kaur et al., 2021). The impact parameters to the QSO sightline are large ( kpc). Three of the DLA fields have more than 2 galaxies within kpc of the QSO sightline.
Regarding the sizes of H I gas reservoirs, evidence indicates that they are quite extended, especially in low-redshift massive galaxies. Towards , Chowdhury et al. (2022a) have found that a spatial resolution of 90 kpc is needed to recover the total H I 21 cm emission of massive galaxies, indicating that the H I sizes of these galaxies are kpc at these redshifts. In the local Universe, the H I size has been found to correlate with the H I mass, with the diameter of H I disks exceeding 40 kpc in galaxies with H I masses M⊙ (at an H I surface density of /pc2, i.e., similar to the DLA column density threshold; e.g. Broeils & Rhee, 1997; Wang et al., 2016). Thus, both direct measurements of H I 21 cm emission at and the H I mass-size relation at suggest that massive galaxies have large spatial extents in H I.
Chowdhury et al. (2022b) have concluded that H I dominates the baryonic mass of the disks of galaxies, with the H I mass exceeding the stellar mass and the molecular gas mass by factors of . Drawing a comparison with the CO detections of Kanekar et al. (2020) and Kaur et al. (2022b), the measurements by Chowdhury et al. (2022b) would imply an H I diameter of kpc at , even if we assume that the H I mass is only comparable to the molecular gas mass, (). With the H I-selected galaxies associated with high-metallicity ([M/H] ) DLAs at typically found at relatively low impact parameters ( kpc), it is plausible that high-metallicity DLAs at these redshifts arise from the disks of massive galaxies.
As concluded in Section 6.2, the low detection rate of these high-metallicity DLA fields in Ly is likely due to dust obscuration effects in massive galaxies. Instead, less affected by dust obscuration (and brighter in Ly) are expected to be galaxies of low-intermediate stellar masses (Section 6.1). Because of this, it is noteworthy how small the number of companion galaxies identified in Ly is at . Only one of the H I-selected galaxies at low impact parameters (B00551-366) has been found to have companion galaxies within kpc. This is likely to be due to relatively small fields of view of the current Ly searches at .
The situation is somewhat different at , where Ly searches have mostly identified galaxies at very large impact parameters ( kpc) in the fields of DLAs with mostly low metallicities (between [M/H] and [M/H] ; Mackenzie et al. 2019; Lofthouse et al. 2023). If we assume that the low metallicity of the DLA is indication of low dust obscuration, galaxies at low impact parameters would have only been missed if they were intrinsically under-luminous. Under this assumption, DLAs at with [M/H] arise from either low stellar mass galaxies at low impact parameters or from massive, dusty galaxies at large impact parameters. The large number of Ly-emitting companions at distances of kpc in a number of the fields is interesting, and suggests that the DLAs probed by these studies arise mostly in galaxy groups.
Finally, the impact parameters of the H I-selected galaxies identified in [C ii] 158m searches at are kpc (Neeleman et al., 2017, 2019). These [C ii] 158m emitters are all associated with DLAs that have a metallicities of [M/H] , and while multiple galaxies have been identified in some fields, these are all at similar impact parameters ( kpc). Together, the high H I column densities ( cm-2) and relatively large impact parameters hint that high-metallicity, high N DLAs at likely arise from H I clumps in the CGM of massive galaxies. This is consistent with numerical simulations that predict greater amounts of H I in the CGM of galaxies at than at lower redshifts (e.g. Stern et al., 2021).
7 Summary
We used the integral field spectrograph KCWI on the Keck II telescope to carry out a search for Ly emission in the fields of 14 DLAs at . Nine of the 14 targets have high metallicities ([M/H] ). Seven of the 14 fields have been searched for CO emission with ALMA or NOEMA, with 4 confirmed detections. Finally, three of the 14 DLAs are known Ly emitters from the literature that were observed to quantify our Ly detection capability (i.e., the control sample).
We detected Ly emission with the expected strength from the three control-sample DLAs. For the remaining 11 targets, Ly emission was detected from two galaxies in the field of the DLA towards B0551-366 at impact parameters of kpc. Also in the field of B0551-366 is a massive CO-detected galaxy at an impact parameter of kpc from the QSO sightline. This indicates that the Ly emitters do not directly give rise to the DLA absorption. We find that the low Ly detection rate in the fields of high-metallicity DLAs is likely a result of Ly photon absorption by dust produced in massive and dusty galaxies.
We compared the results of our Ly searches in DLA fields at with those of CO searches at , Ly searches at , and [C ii] 158m searches at . The impact parameters of the galaxies associated with high-metallicity DLAs at are typically kpc. We argue that high-metallicity galaxies are likely to have a large H I mass, and hence a large H I spatial extent. High-metallicity DLAs at are thus likely to arise in the H I reservoirs of massive galaxies.
Finally, we found that galaxies associated with high-metallicity DLAs ([M/H] ) may remain unidentified in both CO searches (if they do not have extreme molecular gas masses) and Ly searches (due to high dust obscuration). Searches in the H, [O iii]5007, and [C ii] 158m lines will likely be necessary to identify this population.
We thank the reviewer for detailed comments on an earlier version of this manuscript. This material is based upon work supported by the National Science Foundation under grants AST-2107989 and AST-2107990. MR also acknowledges support from the STScI’s Director’s Discretionary Research Funding (grant ID D0101.90306). RAJ gratefully acknowledges support from the Nantucket Maria Mitchell Association. NK acknowledges the Department of Atomic Energy for funding support, under project 12-R&D-TFR-5.02-0700. The data presented herein were obtained at the W. M. Keck Observatory, which is operated as a scientific partnership among the California Institute of Technology, the University of California and the National Aeronautics and Space Administration. The Observatory was made possible by the generous financial support of the W. M. Keck Foundation. The authors wish to recognize and acknowledge the very significant cultural role and reverence that the summit of Maunakea has always had within the indigenous Hawaiian community. We are most fortunate to have the opportunity to conduct observations from this mountain.
References
- Alam et al. (2015) Alam, S., Albareti, F. D., Allende Prieto, C., et al. 2015, ApJS, 219, 12, doi: 10.1088/0067-0049/219/1/12
- Arrigoni Battaia et al. (2016) Arrigoni Battaia, F., Hennawi, J. F., Cantalupo, S., & Prochaska, J. X. 2016, ApJ, 829, 3, doi: 10.3847/0004-637X/829/1/3
- Arrigoni Battaia et al. (2019) Arrigoni Battaia, F., Hennawi, J. F., Prochaska, J. X., et al. 2019, MNRAS, 482, 3162, doi: 10.1093/mnras/sty2827
- Atek et al. (2014) Atek, H., Kunth, D., Schaerer, D., et al. 2014, A&A, 561, A89, doi: 10.1051/0004-6361/201321519
- Balashev et al. (2017) Balashev, S. A., Noterdaeme, P., Rahmani, H., et al. 2017, MNRAS, 470, 2890, doi: 10.1093/mnras/stx1339
- Begum et al. (2008) Begum, A., Chengalur, J. N., Karachentsev, I. D., Sharina, M. E., & Kaisin, S. S. 2008, MNRAS, 386, 1667, doi: 10.1111/j.1365-2966.2008.13150.x
- Bera et al. (2019) Bera, A., Kanekar, N., Chengalur, J. N., & Bagla, J. S. 2019, ApJ, 882, L7, doi: 10.3847/2041-8213/ab3656
- Berg et al. (2015) Berg, T. A. M., Neeleman, M., Prochaska, J. X., Ellison, S. L., & Wolfe, A. M. 2015, PASP, 127, 167, doi: 10.1086/680210
- Blanc et al. (2011) Blanc, G. A., Adams, J. J., Gebhardt, K., et al. 2011, ApJ, 736, 31, doi: 10.1088/0004-637X/736/1/31
- Bolatto et al. (2013) Bolatto, A. D., Wolfire, M., & Leroy, A. K. 2013, ARA&A, 51, 207, doi: 10.1146/annurev-astro-082812-140944
- Broeils & Rhee (1997) Broeils, A. H., & Rhee, M. H. 1997, A&A, 324, 877
- Cai et al. (2019) Cai, Z., Cantalupo, S., Prochaska, J. X., et al. 2019, ApJS, 245, 23, doi: 10.3847/1538-4365/ab4796
- Cassata et al. (2015) Cassata, P., Tasca, L. A. M., Le Fèvre, O., et al. 2015, A&A, 573, A24, doi: 10.1051/0004-6361/201423824
- Catinella et al. (2018) Catinella, B., Saintonge, A., Janowiecki, S., et al. 2018, MNRAS, 476, 875, doi: 10.1093/mnras/sty089
- Chabrier (2003) Chabrier, G. 2003, PASP, 115, 763, doi: 10.1086/376392
- Charlot & Fall (1993) Charlot, S., & Fall, S. M. 1993, ApJ, 415, 580, doi: 10.1086/173187
- Chowdhury et al. (2022a) Chowdhury, A., Kanekar, N., & Chengalur, J. N. 2022a, ApJ, 937, 103, doi: 10.3847/1538-4357/ac7d52
- Chowdhury et al. (2022b) —. 2022b, ApJ, 935, L5, doi: 10.3847/2041-8213/ac8150
- Chowdhury et al. (2020) Chowdhury, A., Kanekar, N., Chengalur, J. N., Sethi, S., & Dwarakanath, K. S. 2020, Nature, 586, 369, doi: 10.1038/s41586-020-2794-7
- Chowdhury et al. (2021) Chowdhury, A., Kanekar, N., Das, B., Dwarakanath, K. S., & Sethi, S. 2021, ApJ, 913, L24, doi: 10.3847/2041-8213/abfcc7
- Christensen et al. (2014) Christensen, L., Møller, P., Fynbo, J. P. U., & Zafar, T. 2014, MNRAS, 445, 225, doi: 10.1093/mnras/stu1726
- Christensen et al. (2007) Christensen, L., Wisotzki, L., Roth, M. M., et al. 2007, A&A, 468, 587, doi: 10.1051/0004-6361:20066410
- Chung et al. (2009) Chung, A., van Gorkom, J. H., Kenney, J. D. P., Crowl, H., & Vollmer, B. 2009, AJ, 138, 1741, doi: 10.1088/0004-6256/138/6/1741
- Ciardullo et al. (2014) Ciardullo, R., Zeimann, G. R., Gronwall, C., et al. 2014, ApJ, 796, 64, doi: 10.1088/0004-637X/796/1/64
- Cortese et al. (2021) Cortese, L., Catinella, B., & Smith, R. 2021, PASA, 38, e035, doi: 10.1017/pasa.2021.18
- Crighton et al. (2015) Crighton, N. H. M., Murphy, M. T., Prochaska, J. X., et al. 2015, MNRAS, 452, 217, doi: 10.1093/mnras/stv1182
- Dijkstra & Kramer (2012) Dijkstra, M., & Kramer, R. 2012, MNRAS, 424, 1672, doi: 10.1111/j.1365-2966.2012.21131.x
- Duval et al. (2014) Duval, F., Schaerer, D., Östlin, G., & Laursen, P. 2014, A&A, 562, A52, doi: 10.1051/0004-6361/201220455
- Erb et al. (2006) Erb, D. K., Shapley, A. E., Pettini, M., et al. 2006, ApJ, 644, 813, doi: 10.1086/503623
- Farina et al. (2017) Farina, E. P., Venemans, B. P., Decarli, R., et al. 2017, ApJ, 848, 78, doi: 10.3847/1538-4357/aa8df4
- Farina et al. (2019) Farina, E. P., Arrigoni-Battaia, F., Costa, T., et al. 2019, ApJ, 887, 196, doi: 10.3847/1538-4357/ab5847
- Fernández et al. (2016) Fernández, X., Gim, H. B., van Gorkom, J. H., et al. 2016, ApJ, 824, L1, doi: 10.3847/2041-8205/824/1/L1
- Finlator et al. (2007) Finlator, K., Davé, R., & Oppenheimer, B. D. 2007, MNRAS, 376, 1861, doi: 10.1111/j.1365-2966.2007.11578.x
- Fitzpatrick (1999) Fitzpatrick, E. L. 1999, PASP, 111, 63, doi: 10.1086/316293
- Fumagalli et al. (2015) Fumagalli, M., O’Meara, J. M., Prochaska, J. X., Rafelski, M., & Kanekar, N. 2015, MNRAS, 446, 3178, doi: 10.1093/mnras/stu2325
- Fumagalli et al. (2017) Fumagalli, M., Mackenzie, R., Trayford, J., et al. 2017, MNRAS, 471, 3686, doi: 10.1093/mnras/stx1896
- Fynbo et al. (2003) Fynbo, J. P. U., Ledoux, C., Møller, P., Thomsen, B., & Burud, I. 2003, A&A, 407, 147, doi: 10.1051/0004-6361:20030840
- Fynbo et al. (2008) Fynbo, J. P. U., Prochaska, J. X., Sommer-Larsen, J., Dessauges-Zavadsky, M., & Møller, P. 2008, ApJ, 683, 321, doi: 10.1086/589555
- Fynbo et al. (2010) Fynbo, J. P. U., Laursen, P., Ledoux, C., et al. 2010, MNRAS, 408, 2128, doi: 10.1111/j.1365-2966.2010.17294.x
- Fynbo et al. (2011) Fynbo, J. P. U., Ledoux, C., Noterdaeme, P., et al. 2011, MNRAS, 413, 2481, doi: 10.1111/j.1365-2966.2011.18318.x
- Fynbo et al. (2013) Fynbo, J. P. U., Geier, S. J., Christensen, L., et al. 2013, MNRAS, 436, 361, doi: 10.1093/mnras/stt1579
- Fynbo et al. (2018) Fynbo, J. P. U., Heintz, K. E., Neeleman, M., et al. 2018, MNRAS, 479, 2126, doi: 10.1093/mnras/sty1520
- Fynbo et al. (2023) Fynbo, J. P. U., Christensen, L., Geier, S. J., et al. 2023, A&A, 679, A30, doi: 10.1051/0004-6361/202347403
- Gaia Collaboration et al. (2023) Gaia Collaboration, Vallenari, A., Brown, A. G. A., et al. 2023, A&A, 674, A1, doi: 10.1051/0004-6361/202243940
- Gallazzi et al. (2021) Gallazzi, A. R., Pasquali, A., Zibetti, S., & Barbera, F. L. 2021, MNRAS, 502, 4457, doi: 10.1093/mnras/stab265
- Giavalisco et al. (1994) Giavalisco, M., Macchetto, F. D., & Sparks, W. B. 1994, A&A, 288, 103
- Gronke & Dijkstra (2016) Gronke, M., & Dijkstra, M. 2016, ApJ, 826, 14, doi: 10.3847/0004-637X/826/1/14
- Gronke et al. (2016) Gronke, M., Dijkstra, M., McCourt, M., & Oh, S. P. 2016, ApJ, 833, L26, doi: 10.3847/2041-8213/833/2/L26
- Gronwall et al. (2007) Gronwall, C., Ciardullo, R., Hickey, T., et al. 2007, ApJ, 667, 79, doi: 10.1086/520324
- Grove et al. (2009) Grove, L. F., Fynbo, J. P. U., Ledoux, C., et al. 2009, A&A, 497, 689, doi: 10.1051/0004-6361/200811429
- Guaita et al. (2010) Guaita, L., Gawiser, E., Padilla, N., et al. 2010, ApJ, 714, 255, doi: 10.1088/0004-637X/714/1/255
- Gunn & Gott (1972) Gunn, J. E., & Gott, J. Richard, I. 1972, ApJ, 176, 1, doi: 10.1086/151605
- Hayes et al. (2011) Hayes, M., Schaerer, D., Östlin, G., et al. 2011, ApJ, 730, 8, doi: 10.1088/0004-637X/730/1/8
- Haynes et al. (2018) Haynes, M. P., Giovanelli, R., Kent, B. R., et al. 2018, ApJ, 861, 49, doi: 10.3847/1538-4357/aac956
- Heald et al. (2011) Heald, G., Józsa, G., Serra, P., et al. 2011, A&A, 526, A118, doi: 10.1051/0004-6361/201015938
- Herenz et al. (2015) Herenz, E. C., Wisotzki, L., Roth, M., & Anders, F. 2015, A&A, 576, A115, doi: 10.1051/0004-6361/201425580
- Jiang et al. (2013) Jiang, L., Egami, E., Mechtley, M., et al. 2013, ApJ, 772, 99, doi: 10.1088/0004-637X/772/2/99
- Jones et al. (2018) Jones, M. G., Haynes, M. P., Giovanelli, R., & Moorman, C. 2018, MNRAS, 477, 2, doi: 10.1093/mnras/sty521
- Jorgenson et al. (2013) Jorgenson, R. A., Murphy, M. T., & Thompson, R. 2013, MNRAS, 435, 482, doi: 10.1093/mnras/stt1309
- Jorgenson & Wolfe (2014) Jorgenson, R. A., & Wolfe, A. M. 2014, ApJ, 785, 16, doi: 10.1088/0004-637X/785/1/16
- Joshi et al. (2021) Joshi, R., Fumagalli, M., Srianand, R., et al. 2021, ApJ, 908, 129, doi: 10.3847/1538-4357/abd1d5
- Kanekar et al. (2020) Kanekar, N., Prochaska, J. X., Neeleman, M., et al. 2020, ApJ, 901, L5, doi: 10.3847/2041-8213/abb4e1
- Kanekar et al. (2014) Kanekar, N., Prochaska, J. X., Smette, A., et al. 2014, MNRAS, 438, 2131, doi: 10.1093/mnras/stt2338
- Kaplan et al. (2010) Kaplan, K. F., Prochaska, J. X., Herbert-Fort, S., Ellison, S. L., & Dessauges-Zavadsky, M. 2010, PASP, 122, 619, doi: 10.1086/653500
- Kaur et al. (2022a) Kaur, B., Kanekar, N., Rafelski, M., et al. 2022a, ApJ, 933, L42, doi: 10.3847/2041-8213/ac7bdd
- Kaur et al. (2021) —. 2021, ApJ, 921, 68, doi: 10.3847/1538-4357/ac12d2
- Kaur et al. (2022b) Kaur, B., Kanekar, N., Revalski, M., et al. 2022b, ApJ, 934, 87, doi: 10.3847/1538-4357/ac7b2c
- Kawata & Mulchaey (2008) Kawata, D., & Mulchaey, J. S. 2008, ApJ, 672, L103, doi: 10.1086/526544
- Kennicutt & Evans (2012) Kennicutt, R. C., & Evans, N. J. 2012, ARA&A, 50, 531, doi: 10.1146/annurev-astro-081811-125610
- Kereš et al. (2005) Kereš, D., Katz, N., Weinberg, D. H., & Davé, R. 2005, MNRAS, 363, 2, doi: 10.1111/j.1365-2966.2005.09451.x
- Klimenko et al. (2020) Klimenko, V. V., Petitjean, P., & Ivanchik, A. V. 2020, MNRAS, 493, 5743, doi: 10.1093/mnras/staa614
- Krogager et al. (2016) Krogager, J. K., Fynbo, J. P. U., Noterdaeme, P., et al. 2016, MNRAS, 455, 2698, doi: 10.1093/mnras/stv2346
- Krogager et al. (2017) Krogager, J. K., Møller, P., Fynbo, J. P. U., & Noterdaeme, P. 2017, MNRAS, 469, 2959, doi: 10.1093/mnras/stx1011
- Krogager et al. (2013) Krogager, J.-K., Fynbo, J. P. U., Ledoux, C., et al. 2013, MNRAS, 433, 3091, doi: 10.1093/mnras/stt955
- Kulkarni et al. (2006) Kulkarni, V. P., Woodgate, B. E., York, D. G., et al. 2006, ApJ, 636, 30, doi: 10.1086/497885
- Laursen et al. (2009) Laursen, P., Sommer-Larsen, J., & Andersen, A. C. 2009, ApJ, 704, 1640, doi: 10.1088/0004-637X/704/2/1640
- Ledoux et al. (2006) Ledoux, C., Petitjean, P., Fynbo, J. P. U., Møller, P., & Srianand, R. 2006, A&A, 457, 71, doi: 10.1051/0004-6361:20054242
- Leroy et al. (2008) Leroy, A. K., Walter, F., Brinks, E., et al. 2008, AJ, 136, 2782, doi: 10.1088/0004-6256/136/6/2782
- Lofthouse et al. (2020) Lofthouse, E. K., Fumagalli, M., Fossati, M., et al. 2020, MNRAS, 491, 2057, doi: 10.1093/mnras/stz3066
- Lofthouse et al. (2023) —. 2023, MNRAS, 518, 305, doi: 10.1093/mnras/stac3089
- Lowenthal et al. (1991) Lowenthal, J. D., Hogan, C. J., Green, R. F., et al. 1991, ApJ, 377, L73, doi: 10.1086/186120
- Mackenzie et al. (2019) Mackenzie, R., Fumagalli, M., Theuns, T., et al. 2019, MNRAS, 487, 5070, doi: 10.1093/mnras/stz1501
- Matthee et al. (2016) Matthee, J., Sobral, D., Oteo, I., et al. 2016, MNRAS, 458, 449, doi: 10.1093/mnras/stw322
- Mawatari et al. (2012) Mawatari, K., Yamada, T., Nakamura, Y., Hayashino, T., & Matsuda, Y. 2012, ApJ, 759, 133, doi: 10.1088/0004-637X/759/2/133
- Mérida et al. (2023) Mérida, R. M., Pérez-González, P. G., Sánchez-Blázquez, P., et al. 2023, ApJ, 950, 125, doi: 10.3847/1538-4357/acc7a3
- Møller et al. (2004) Møller, P., Fynbo, J. P. U., & Fall, S. M. 2004, A&A, 422, L33, doi: 10.1051/0004-6361:20040194
- Møller et al. (2013) Møller, P., Fynbo, J. P. U., Ledoux, C., & Nilsson, K. K. 2013, MNRAS, 430, 2680, doi: 10.1093/mnras/stt067
- Møller & Warren (1993) Møller, P., & Warren, S. J. 1993, A&A, 270, 43
- Møller et al. (2002) Møller, P., Warren, S. J., Fall, S. M., Fynbo, J. U., & Jakobsen, P. 2002, ApJ, 574, 51, doi: 10.1086/340934
- Morrissey et al. (2018) Morrissey, P., Matuszewski, M., Martin, D. C., et al. 2018, ApJ, 864, 93, doi: 10.3847/1538-4357/aad597
- Neeleman et al. (2018) Neeleman, M., Kanekar, N., Prochaska, J. X., et al. 2018, ApJ, 856, L12, doi: 10.3847/2041-8213/aab5b1
- Neeleman et al. (2017) —. 2017, Science, 355, 1285, doi: 10.1126/science.aal1737
- Neeleman et al. (2019) Neeleman, M., Kanekar, N., Prochaska, J. X., Rafelski, M. A., & Carilli, C. L. 2019, ApJ, 870, L19, doi: 10.3847/2041-8213/aaf871
- Neeleman et al. (2015) Neeleman, M., Prochaska, J. X., & Wolfe, A. M. 2015, ApJ, 800, 7, doi: 10.1088/0004-637X/800/1/7
- Neeleman et al. (2013) Neeleman, M., Wolfe, A. M., Prochaska, J. X., & Rafelski, M. 2013, ApJ, 769, 54, doi: 10.1088/0004-637X/769/1/54
- Nielsen et al. (2022) Nielsen, N. M., Kacprzak, G. G., Sameer, et al. 2022, MNRAS, 514, 6074, doi: 10.1093/mnras/stac1824
- Nilsson et al. (2009) Nilsson, K. K., Möller-Nilsson, O., Møller, P., Fynbo, J. P. U., & Shapley, A. E. 2009, MNRAS, 400, 232, doi: 10.1111/j.1365-2966.2009.15439.x
- Noterdaeme et al. (2008) Noterdaeme, P., Ledoux, C., Petitjean, P., & Srianand, R. 2008, A&A, 481, 327, doi: 10.1051/0004-6361:20078780
- Noterdaeme et al. (2012) Noterdaeme, P., Petitjean, P., Carithers, W. C., et al. 2012, A&A, 547, L1, doi: 10.1051/0004-6361/201220259
- Oke & Gunn (1983) Oke, J. B., & Gunn, J. E. 1983, ApJ, 266, 713, doi: 10.1086/160817
- O’Sullivan et al. (2020) O’Sullivan, D. B., Martin, C., Matuszewski, M., et al. 2020, ApJ, 894, 3, doi: 10.3847/1538-4357/ab838c
- Oyarzún et al. (2017) Oyarzún, G. A., Blanc, G. A., González, V., Mateo, M., & Bailey, John I., I. 2017, ApJ, 843, 133, doi: 10.3847/1538-4357/aa7552
- Oyarzún et al. (2023) Oyarzún, G. A., Bundy, K., Westfall, K. B., et al. 2023, ApJ, 947, 13, doi: 10.3847/1538-4357/acbbca
- Oyarzún et al. (2016) Oyarzún, G. A., Blanc, G. A., González, V., et al. 2016, ApJ, 821, L14, doi: 10.3847/2041-8205/821/1/L14
- Pasquali et al. (2010) Pasquali, A., Gallazzi, A., Fontanot, F., et al. 2010, MNRAS, 407, 937, doi: 10.1111/j.1365-2966.2010.17074.x
- Péroux et al. (2011) Péroux, C., Bouché, N., Kulkarni, V. P., York, D. G., & Vladilo, G. 2011, MNRAS, 410, 2237, doi: 10.1111/j.1365-2966.2010.17598.x
- Péroux et al. (2012) —. 2012, MNRAS, 419, 3060, doi: 10.1111/j.1365-2966.2011.19947.x
- Prochaska et al. (2005) Prochaska, J. X., Herbert-Fort, S., & Wolfe, A. M. 2005, ApJ, 635, 123, doi: 10.1086/497287
- Prochaska et al. (2019) Prochaska, J. X., Neeleman, M., Kanekar, N., & Rafelski, M. 2019, ApJ, 886, L35, doi: 10.3847/2041-8213/ab55eb
- Prochaska & Wolfe (1997) Prochaska, J. X., & Wolfe, A. M. 1997, ApJ, 487, 73, doi: 10.1086/304591
- Prochaska et al. (2013) Prochaska, J. X., Hennawi, J. F., Lee, K.-G., et al. 2013, ApJ, 776, 136, doi: 10.1088/0004-637X/776/2/136
- Rafelski et al. (2014) Rafelski, M., Neeleman, M., Fumagalli, M., Wolfe, A. M., & Prochaska, J. X. 2014, ApJ, 782, L29, doi: 10.1088/2041-8205/782/2/L29
- Rafelski et al. (2012) Rafelski, M., Wolfe, A. M., Prochaska, J. X., Neeleman, M., & Mendez, A. J. 2012, ApJ, 755, 89, doi: 10.1088/0004-637X/755/2/89
- Rahmati & Schaye (2014) Rahmati, A., & Schaye, J. 2014, MNRAS, 438, 529, doi: 10.1093/mnras/stt2235
- Rao et al. (2017) Rao, S. M., Turnshek, D. A., Sardane, G. M., & Monier, E. M. 2017, MNRAS, 471, 3428, doi: 10.1093/mnras/stx1787
- Reddy et al. (2006) Reddy, N. A., Steidel, C. C., Fadda, D., et al. 2006, ApJ, 644, 792, doi: 10.1086/503739
- Rhodin et al. (2019) Rhodin, N. H. P., Agertz, O., Christensen, L., Renaud, F., & Fynbo, J. P. U. 2019, MNRAS, 488, 3634, doi: 10.1093/mnras/stz1479
- Rivera-Thorsen et al. (2015) Rivera-Thorsen, T. E., Hayes, M., Östlin, G., et al. 2015, ApJ, 805, 14, doi: 10.1088/0004-637X/805/1/14
- Roche et al. (2014) Roche, N., Humphrey, A., & Binette, L. 2014, MNRAS, 443, 3795, doi: 10.1093/mnras/stu1430
- Schlafly & Finkbeiner (2011) Schlafly, E. F., & Finkbeiner, D. P. 2011, ApJ, 737, 103, doi: 10.1088/0004-637X/737/2/103
- Schlegel et al. (1998) Schlegel, D. J., Finkbeiner, D. P., & Davis, M. 1998, ApJ, 500, 525, doi: 10.1086/305772
- Shapley et al. (2003) Shapley, A. E., Steidel, C. C., Pettini, M., & Adelberger, K. L. 2003, ApJ, 588, 65, doi: 10.1086/373922
- Sheinis et al. (2002) Sheinis, A. I., Bolte, M., Epps, H. W., et al. 2002, PASP, 114, 851, doi: 10.1086/341706
- Skelton et al. (2014) Skelton, R. E., Whitaker, K. E., Momcheva, I. G., et al. 2014, ApJS, 214, 24, doi: 10.1088/0067-0049/214/2/24
- Smith et al. (1989) Smith, H. E., Cohen, R. D., Burns, J. E., Moore, D. J., & Uchida, B. A. 1989, ApJ, 347, 87, doi: 10.1086/168099
- Sobral & Matthee (2019) Sobral, D., & Matthee, J. 2019, A&A, 623, A157, doi: 10.1051/0004-6361/201833075
- Stark et al. (2009) Stark, D. P., Ellis, R. S., Bunker, A., et al. 2009, ApJ, 697, 1493, doi: 10.1088/0004-637X/697/2/1493
- Steidel et al. (1999) Steidel, C. C., Adelberger, K. L., Giavalisco, M., Dickinson, M., & Pettini, M. 1999, ApJ, 519, 1, doi: 10.1086/307363
- Steidel et al. (2003) Steidel, C. C., Adelberger, K. L., Shapley, A. E., et al. 2003, ApJ, 592, 728, doi: 10.1086/375772
- Steidel et al. (1996) Steidel, C. C., Giavalisco, M., Pettini, M., Dickinson, M., & Adelberger, K. L. 1996, ApJ, 462, L17, doi: 10.1086/310029
- Stern et al. (2021) Stern, J., Sternberg, A., Faucher-Giguère, C.-A., et al. 2021, MNRAS, 507, 2869, doi: 10.1093/mnras/stab2240
- Tacconi et al. (2020) Tacconi, L. J., Genzel, R., & Sternberg, A. 2020, ARA&A, 58, 157, doi: 10.1146/annurev-astro-082812-141034
- Tremonti et al. (2004) Tremonti, C. A., Heckman, T. M., Kauffmann, G., et al. 2004, ApJ, 613, 898, doi: 10.1086/423264
- Treu et al. (2012) Treu, T., Trenti, M., Stiavelli, M., Auger, M. W., & Bradley, L. D. 2012, ApJ, 747, 27, doi: 10.1088/0004-637X/747/1/27
- Trussler et al. (2021) Trussler, J., Maiolino, R., Maraston, C., et al. 2021, MNRAS, 500, 4469, doi: 10.1093/mnras/staa3545
- Tumlinson et al. (2017) Tumlinson, J., Peeples, M. S., & Werk, J. K. 2017, ARA&A, 55, 389, doi: 10.1146/annurev-astro-091916-055240
- Verhamme et al. (2008) Verhamme, A., Schaerer, D., Atek, H., & Tapken, C. 2008, A&A, 491, 89, doi: 10.1051/0004-6361:200809648
- Verhamme et al. (2006) Verhamme, A., Schaerer, D., & Maselli, A. 2006, A&A, 460, 397, doi: 10.1051/0004-6361:20065554
- Verheijen (2001) Verheijen, M. A. W. 2001, ApJ, 563, 694, doi: 10.1086/323887
- Vogt et al. (1994) Vogt, S. S., Allen, S. L., Bigelow, B. C., et al. 1994, in Society of Photo-Optical Instrumentation Engineers (SPIE) Conference Series, Vol. 2198, Instrumentation in Astronomy VIII, ed. D. L. Crawford & E. R. Craine, 362, doi: 10.1117/12.176725
- Walter et al. (2008) Walter, F., Brinks, E., de Blok, W. J. G., et al. 2008, AJ, 136, 2563, doi: 10.1088/0004-6256/136/6/2563
- Walter et al. (2020) Walter, F., Carilli, C., Neeleman, M., et al. 2020, ApJ, 902, 111, doi: 10.3847/1538-4357/abb82e
- Wang et al. (2016) Wang, J., Koribalski, B. S., Serra, P., et al. 2016, MNRAS, 460, 2143, doi: 10.1093/mnras/stw1099
- Wang et al. (2015) Wang, W.-H., Kanekar, N., & Prochaska, J. X. 2015, MNRAS, 448, 2832, doi: 10.1093/mnras/stv171
- Werle et al. (2022) Werle, A., Poggianti, B., Moretti, A., et al. 2022, ApJ, 930, 43, doi: 10.3847/1538-4357/ac5f06
- Wetzel et al. (2013) Wetzel, A. R., Tinker, J. L., Conroy, C., & van den Bosch, F. C. 2013, MNRAS, 432, 336, doi: 10.1093/mnras/stt469
- Whitaker et al. (2014) Whitaker, K. E., Franx, M., Leja, J., et al. 2014, ApJ, 795, 104, doi: 10.1088/0004-637X/795/2/104
- Wolfe et al. (2005) Wolfe, A. M., Gawiser, E., & Prochaska, J. X. 2005, ARA&A, 43, 861, doi: 10.1146/annurev.astro.42.053102.133950
- Zwaan et al. (2005) Zwaan, M. A., Meyer, M. J., Staveley-Smith, L., & Webster, R. L. 2005, MNRAS, 359, L30, doi: 10.1111/j.1745-3933.2005.00029.x