Measurements of nematic susceptibility with phase sensitive nuclear magnetic resonance in pulsed strain fields
Abstract
We present nuclear magnetic resonance data in BaFe2As2 in the presence of pulsed strain fields that are interleaved in time with the radiofrequency excitation pulses. In this approach, the precessing nuclear magnetization acquires a phase shift that is proportional to the strain and pulse time. The sensitivity in this approach is limited by the homogeneous decoherence time, , rather than the inhomogeneous linewidth. We measure the nematic susceptibility as a function of temperature, and demonstrate three orders of magnitude improvement in sensitivity. This approach will enable studies of the strain response in a broad range of materials that previously were inaccessible due to inhomogeneous broadening.
I Introduction
In recent years there has been growing attention to the role of electronic nematicity in strongly correlated electron materials, where the electronic degrees of freedom spontaneously break an underlying discrete symmetry of the lattice [1]. This phenomenon is exemplified in the parent compounds of many iron-based superconductors, where the the Fe orbitals undergo ferro-orbital ordering, accompanied by a tetragonal to orthorhombic structural transition and often the onset of long-range antiferromagnetic order [2, 3]. Below this temperature in the nematic, or orthorhombic, phase, the Fe and orbitals become nondegenerate, with an energy splitting on the order of 40 meV, and different occupation levels [4]. Doping tends to suppress the long-range nematic order and stabilizes unconventional superconductivity. Elastoresistance measurements of the nematic susceptibility [5, 6, 7] revealed the presence of a nematic quantum phase critical point that may be responsible for driving the superconductivity in this system [8, 9, 10, 11].
Several techniques have been developed to probe the nematic degrees of freedom. Anisotropic resistivity [12, 13], elastoresistance [5], elastic constants [14, 15, 16, 17], thermopower [18], electronic Raman scattering [19], polarized light image color analysis [20, 21] and optical conductivity [22] probe bulk anisotropies. Nuclear magnetic resonance (NMR) and neutron scattering have been utilized to investigate the effect of nematicity on the spin fluctuations [23, 24, 25, 26, 27]. NMR studies of quadrupolar nuclei are sensitive to charge degrees of freedom, and have also been utilized to study both nematic fluctuations [28], and changes to the Fe orbital occupations in response to external strain fields [29]. The latter provides a direct microscopic measure of the nematic susceptibility, and has the advantage that it can be measured in the superconducting state, where other measurements such as elastoresistance are unable to operate.
NMR measurements of the nematic susceptibility probe the response of the NMR resonance frequencies as a function of applied strain. Strain can couple to the nuclear spins via either the Knight shift or the electric field gradient (EFG) tensors. These quantities inherit the point group symmetry of the lattice, and if this symmetry is lowered by strain, then these tensors can acquire new asymmetries or off-diagonal components. Note that the Knight shift tensor depends on both the hyperfine coupling and the electronic spin susceptibility, and both could change in response to strain. In the case of FeSe only the latter appears to become anisotropic in the nematic phase [30]. In BaFe2As2, evidence to date says that the Knight shift tensor does not respond to strain, although the EFG tensor changes dramatically. The NMR resonance frequencies depend sensitively on these parameters, and thus one can probe the nematic susceptibility of a material by observing the linear response of the resonance frequency to strain.
A straightforward approach to measuring the nematic suscepibility with NMR is to observe a shift in the spectrum while applying a static strain field. However in order to detect a response, the frequency shift must be on the order of the spectral linewidth, , which often is inhomogeneously broadened. This quantity can exceed the intrinsic decoherence rate, , by orders of magnitude, especially in the presence of doping which creates an inhomogeneous distribution of local EFGs. In such cases the sensitivity of the susceptibility measurements can be severely limited. On the other hand, if the strain field is pulsed while the nuclear spins are coherently precessing, then the shift of the resonance frequency will alter the phase of the precessing magnetization and can be observed via quadrature detection. This process forms the basis of “spin-warp” imaging widely used in magnetic resonance imaging, in which a magnetic field gradient is pulsed during the evolution times of a spin echo sequence [31, 32]. In this case it is , rather than the inhomogeneous linewidth, that limits the sensitivity of the response measurement. A pulsed-strain approach should thus enable measurements in systems with inhomogeneous broadening or manifesting smaller intrinsic suscepetibilities. Indeed, strain pulses were used to study the strain response of color centers in silicon carbide using optically detected magnetic resonance [33].
The approach outlined here is similar to AC strain measurements that have been utilized to measure elastoresistance and elastocaloric effects [34, 35], but an important difference is that the strain fields we apply are pulsed rather than sinusoidal. In this case the response function is a convolution of the frequency dependent nematic susceptibility with the square-wave driving voltage, giving rise to an exponential rise or decay of the nematicity with time constant . This time scale is determined by the electronic degrees of freedom, thus s. Another important time scale, , is determined by the speed of sound as the strain pulse traverses the length of the sample, which we estimate to be s. On the other hand, the shortest time scale in our measurements is at least a microsecond, which is larger than either or , therefore we are operating in the quasi-static limit.
II Experiments
In order to examine the feasibility of a pulsed-strain approach to measuring the nematic susceptibility, we studied the response in a well-characterized system, BaFe2As2 [2]. A single crystal grown by self-flux was cut to dimensions mm long by mm wide, with the long axis parallel to the (110) direction (in the tetragonal basis), and mounted to a commercial piezoelectric strain cell (CS100, Razorbill Instruments) [36]. The crystal was mounted using epoxy (UHU plus endfest 300) in order to orient the magnetic field in-plane, as shown in Fig. 1 and described in [37]. Uniaxial stress was applied along the long-axis by piezoelectric stacks giving rise to a strain , with symmetry. Because the Poisson ratio is non-zero, there will also be strain fields with symmetry, however the nematic order in this material couples primarily to the channel and will dominate the response [38, 6]. The static sample length displacement, was measured by a capacitive dilatometer, and strain, , was determined based an unstressed length of mm at room temperature.
II.1 Pulsed Strain
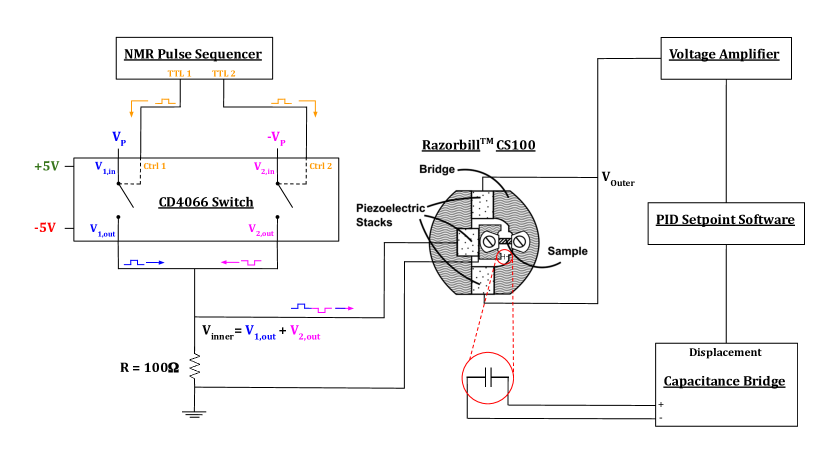
Th strain device utilizes two sets of piezos, the inner and the outer stacks, as illustrated in Fig. 1. In order to implement the strain pulses, we used the outer stack to hold a static strain field, while applying voltage pulses to the inner stack. These strain pulses were created by utilizing TTL pulses from an NMR spectrometer to drive analog switches (CD4066BE, Texas Instruments) that were timed to turn on immediately following the and radiofrequency pulses, as illustrated as in Fig. 2. The time dependent voltage across the inner stacks is shown in the lower panel of Fig. 1. The resistance shown in Fig. 1 is in parallel with the piezo stack, which has an intrinsic capacitance ( F) and was chosen to provide a rise time that is shorter than , so that the strain pulse can be applied between the NMR radiofrequency pulses.
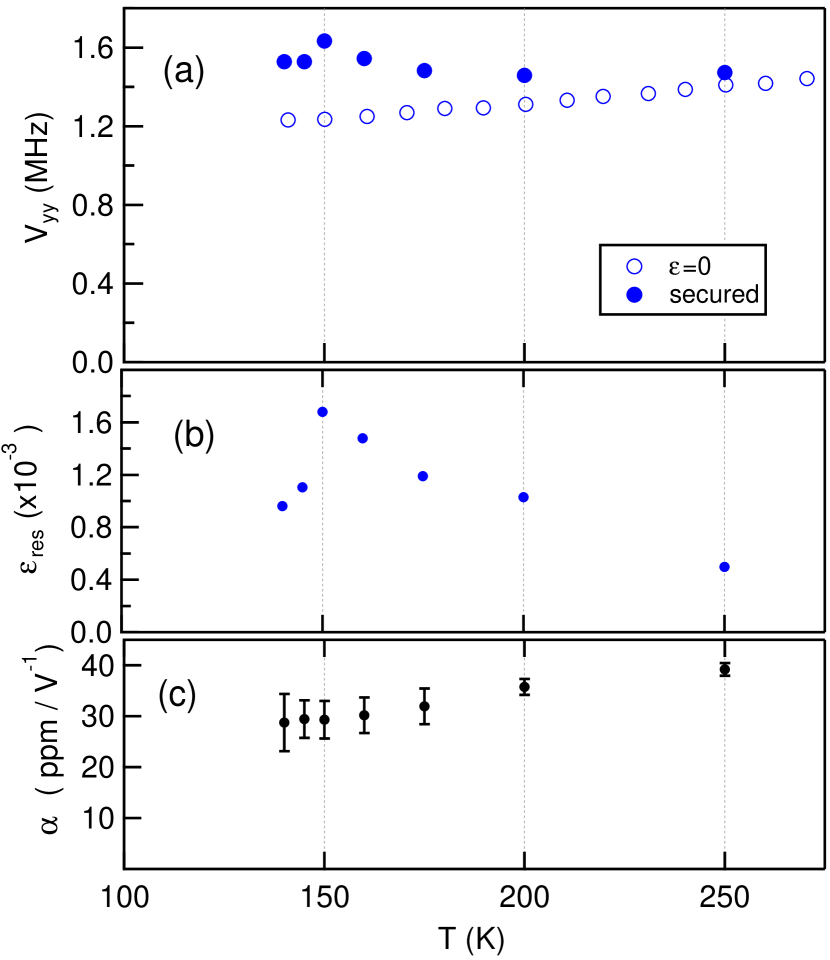
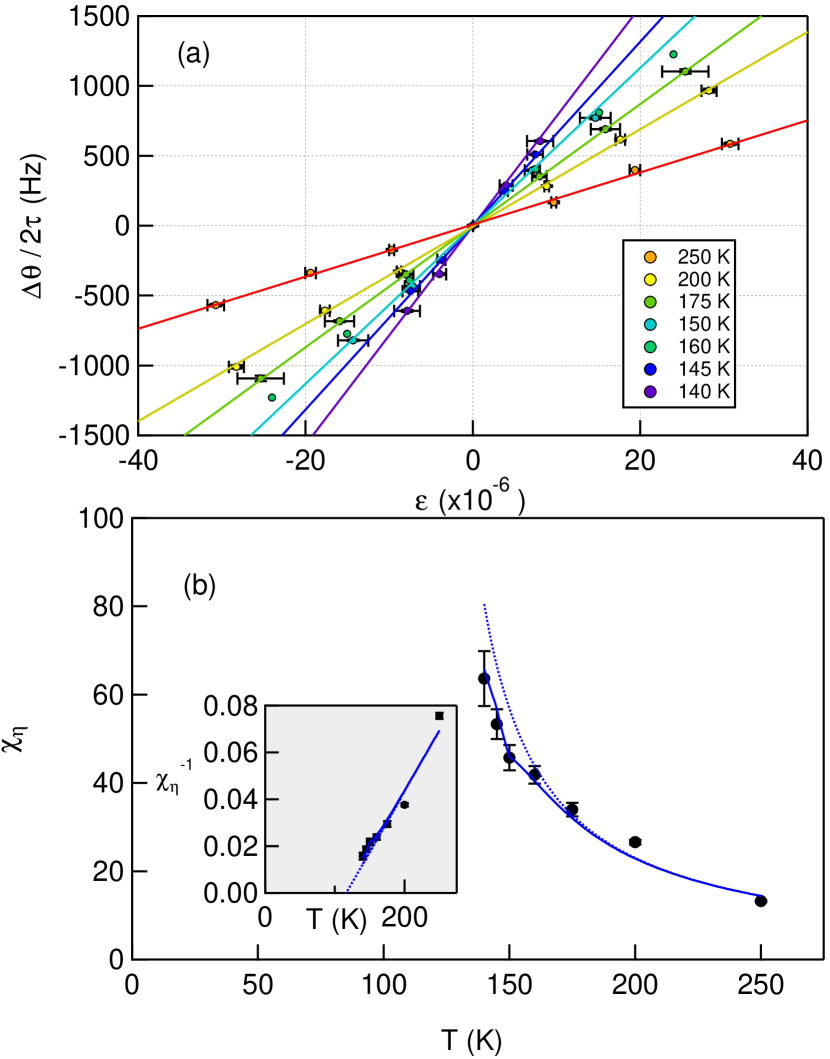
Static displacements are measured via a capacitance bridge, however the time constant for the bridge precludes any measurements during a short strain pulse. We estimate the strain during the pulses using a temperature dependent calibration factor, , shown in Fig. 3(c), which was determined by measurements of the displacement during static applied voltage levels. This approach was utilized in previous AC strain measurements [34, 35], and can lead to overestimates of the strain applied due to the frequency dependence of the calibration factor. As discussed below, the NMR response with pulsed and static strain give similar values, suggesting that the calibration approach is reasonable. The dynamic strain can also give rise to DC heating effects of the strain device on the order of a few Kelvin at finite frequencies, depending on the magnitude of the driving voltage, because the large capacitances and low thermal conductivity of the piezo stacks [34]. To minimize such effects we operated with low driving voltages ( V).
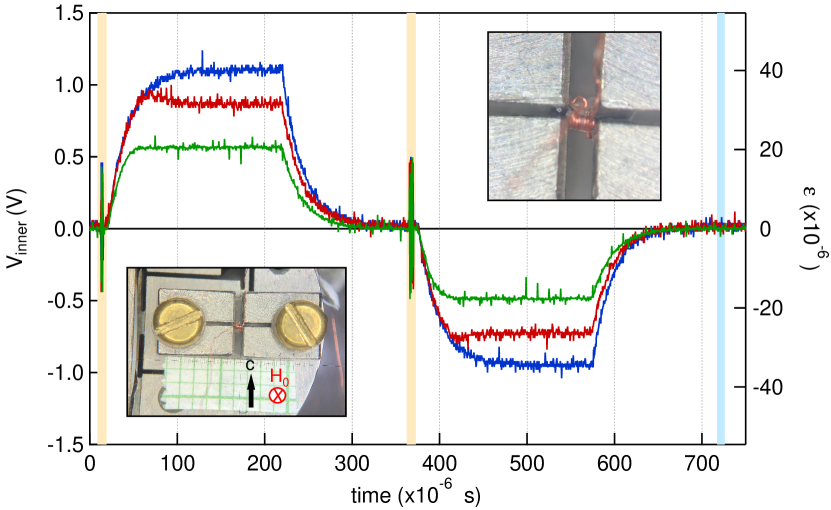
A potential issue with the application of voltage pulses to the strain cell is that natural vibration resonances could be excited in the device. We observed resonances in the range of kHz for our device suggesting that time scales faster than 1 ms could be problematic. In practice, however, the low values of we utilized did not appear to introduce any oscillations measured in , as shown in Fig. 1. We speculate that low mass of the strain cell ensures that these resonances lie outside the bandwidths of our pulses.
II.2 NMR phase sensing
The goal of the experiments is to probe the strain response of the spin 75As nuclei in this material. The resonance frequencies are determined by the eigenvalues of the nuclear spin Hamiltonian:
| (1) |
where kHz/G is the gyromagnetic ratio, are the nuclear spin operators, is the Knight shift tensor, is the largest eigenvalue of the electric field gradient (EFG) tensor, and is the asymmetry parameter. To second order in perturbation theory, the resonance frequencies of the satellites and central transitions for are given by:
| (2) | |||||
where and . If any of the three parameters , or changes in response to strain, then there will be shifts in and .
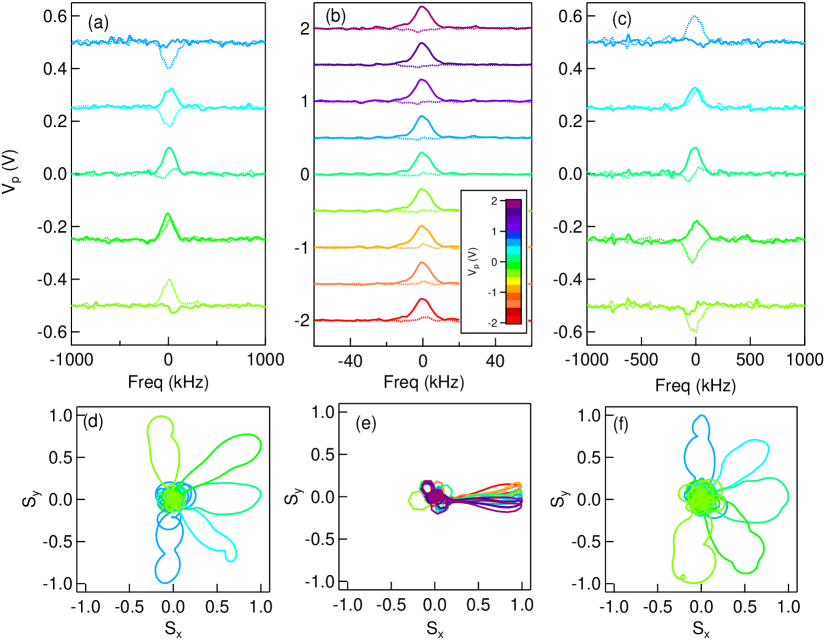
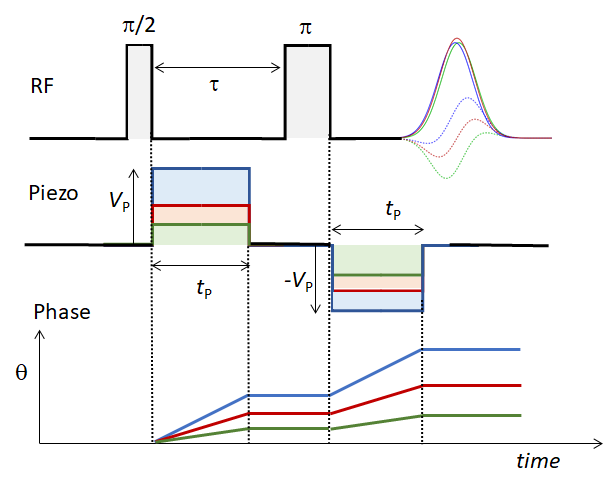
For the pulse sequence shown in Fig. 2, the pulse creates a magnetization that precesses in the plane perpendicular to at the resonance frequency of the particular transition. In the absence of any perturbing strain pulses, the magnetization would remain static in the rotating frame during the evolution time, , between the and pulses. However, if a strain pulse during this period shifts the resonance frequency by an amount, , then the magnetization accumulates an extra phase that is proportional to the product of and , the duration of the strain pulse. The second strain pulse is inverted so that phase accumulation continues even though the direction of precession in the rotating frame is reversed after the pulse. The end result is that the echo acquires a net phase . This phenomenon is illustrated in Fig. 4, where spectra are shown for both quadrature channels, and , for all three transitions of the As. The phase rotation is evident in the changes of the relative intensities of and components as a function of frequency as the magnitude of the piezo voltage, , changes, as well as in plots of versus in the lower panels. The effect is greatest for the two quadrupolar satellites, and smaller for the central transition. Moreover, the lower satellite rotates counterclockwise ( increases with ), whereas the upper and central transition rotate clockwise ( decreases with ). This behavior is summarized in Fig. 4(g), which shows as a function of . Here we determine the angle (in cycles) where are the integrated intensities of the spectra .
We confirmed the behavior of the echo in response to strain pulses via numerical simulations of the full time-dependent Schrodinger equation using the QuTIP package [40, 41] with realistic pulse widths similar to those used in experiment, and modeling strain as a time dependent . The simulated echo phase exhibit behavior nearly identical to the experimental observations, and justifies the use of perturbation theory to express the frequencies of the transitions in Eq. II.2.
II.3 Susceptibility
There are three distinct response functions that can give rise to the behavior in Fig. 4: , , and . The linear response of the resonance frequencies are then given by , where evaluated at zero strain and , or . By measuring and , we can disentangle the strain susceptibility of each parameter individually: . Using the fitted slopes in Fig. 4(g), we find
at 140 K. The value of is comparable to that reported previously [24], however no change to the Knight shift has been previously observed. The value we observe for is too small to detect via static strain techniques: for a maximum static strain , corresponds to a shift of kHz, which is below the static linewidth of kHz.
The nonzero response is surprising, because should only couple quadratically to strain with symmetry. We speculate that the linear response we observe reflects a finite strain field that is induced by the applied stress because of the finite Poisson ratio of our crystal. It is reasonable that because decreases with increasing -axis length in the AFe2As2 (A = Ca, Ba, Sr) family [42].
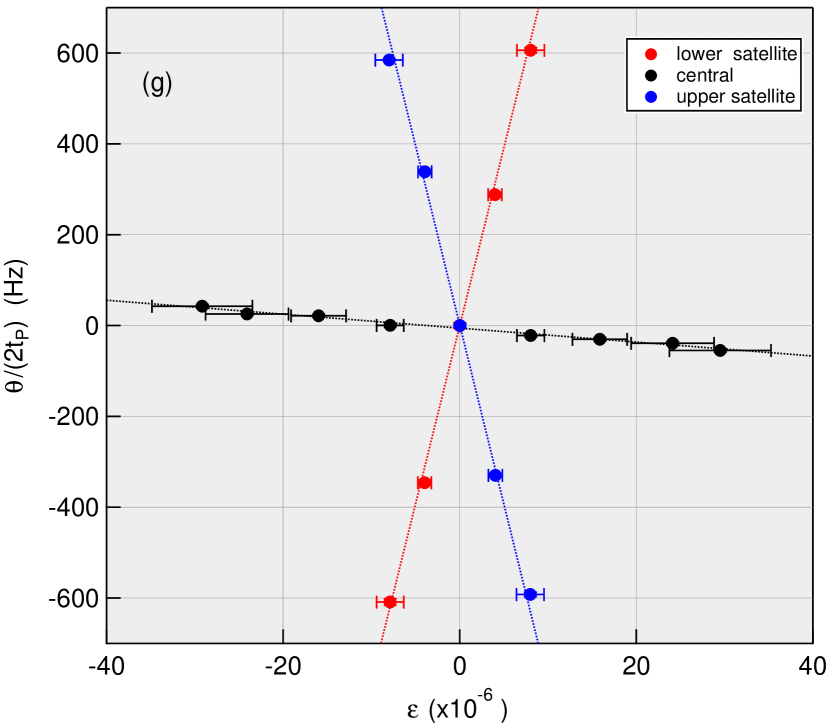
Note that is the dominant source of the shift of the satellite resonance frequencies (Eq. II.2). Therefore it is possible to approximate , rather than measure the response of all three transitions at each temperature. Fig. 5(a) displays the response of the lower transition for a series of temperatures, and Fig. 5(b) displays the temperature dependence of .
For these experiments the sample displacement was held constant as the temperature was lowered. A consequence of this condition is that thermal contraction of the crystal gives rise to a positive residual strain. We estimated this residual strain by observing the EFG splitting of the satellite resonances in the absence of strain pulses. As shown in Fig. 3(a), the EFG splitting, , is temperature dependent and larger than in an the unstrained case. The residual strain can be determined using the nematic susceptibility measured previously using static strain [29]: , and is shown in Fig. 3(b) as a function of temperature using parameters reported previously. The peak at 150 K is due to a software error, in which PID control was temporarily lost.
The residual strain field will tend to suppress the true nematic susceptibility and can alter the temperature dependence of . To model this behavior, we assume that the nematic order parameter, , can be described by a Ginzburg-Landau theory, and find the mean-field solution in the presence of a finite strain field. Expanding the differential susceptibility as a series in gives:
| (3) |
The solid line in Fig. 5(b) is a fit to this expression with K and K and K. The dotted line shows the result with , which should be the response in the absence of . The value of is approximately 40% of that reported previously [29]. The reason for reduction could be errors in the strain-to-voltage calibration factor, . In previous studies using a strain gauge to estimate , this quantity was observed to decrease by up to 8% at frequencies up to 10 kHz [34], therefore it is possible that the strain levels reported here are overestimated, and the magnitude of the nematic susceptibility is underestimated.
III Discussion
Figure 6 compares the NMR frequency shifts measured with pulsed strain and static strain. Despite several orders of magnitude difference in the strain, the slopes are approximately the same for the different temperatures. This result confirms that our approach using the calibration factor for pulsed strain captures the nematic susceptibility reasonably well, despite utilizing strain levels that are 2-3 orders of magnitude smaller.
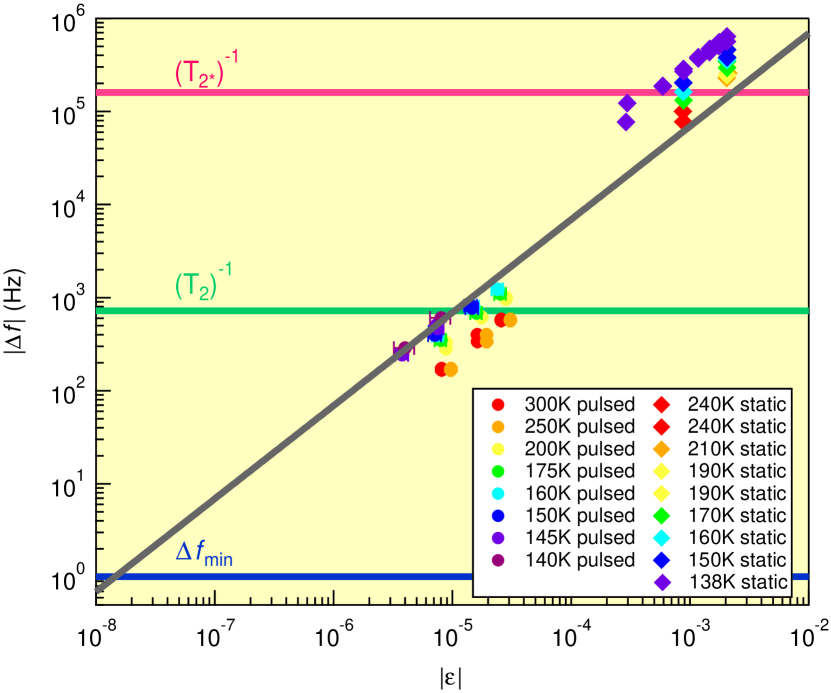
The green and red horizontal lines in Fig. 6 indicate the homogeneous and inhomogeneous linewidths in this material, which set the scale for the sensitivity limits for the measured frequency shift, . It is clear that the pulsed strain approach enables measurements of the nematic susceptibility with much smaller levels of applied strain by taking advantage of the fact that . For the 75As, inhomogeneous strain in the crystal due to imperfections or dopants gives rise to inhomogeneous broadening via the nuclear quadrupole interaction. Although it is possible to detect a frequency shift that is smaller than the linewidth, such an approach requires careful measurements of the full spectrum. On the other hand, the minimum detectable frequency shift using pulsed strain is determined by the precision of the phase angle of the echo. The minimum we measured was 76 Hz at ppm, which required 3.5 hours of measurement time. The precision of our measurements of was for a spectrum with signal to noise ratio . For s, this corresponds to a minimum detectable frequency shift of Hz, shown as the solid blue line in Fig. 6. If the frequency shift is entirely due to , this corresponds to a sensitivity of ppm.
The pulsed strain technique enables measurements of nematic susceptibilities via NMR in a broader range of materials than were previously accessible. This is particularly true for materials with inhomogeneous linewidths, such as the hole or electron-doped iron-based superconductors, e.g. Ba(Fe1-xCox)2As2. Although the nematic susceptibility has been measured in the normal state of these systems previously, pulsed-strain NMR measurements can enable measurements of the nematic response below where elastoresistance studies are not feasible. Below , the NMR signal is usually reduced in a single crystal because the penetration depth is much smaller than the skin depth, requiring longer signal averaging times. In such cases it is difficult to detect spectral shifts in the presence of static strain, however pulsed strain measurements should be straightforward. Another advantage of this approach is that it may also be useful for materials that exhibit a large Young’s modulus, where DC strain approaches are unable to resolve any linewidth changes. Alternatively, because the high sensitivity of this approach does not require large strain values in order to determine the response function, it will be useful for measurements of the nematic susceptibility in materials that are particularly fragile. For example, this technique would be ideal to investigate CaKFe4As4, where is high and the material is nominally pure, yet elastoresistance measurements indicate an enhanced nematic susceptibility in the normal state [43, 44]. Observations of the how the nematic susceptibility changes in the superconducting state may shed important light on whether nematic fluctuations play a role in stabilizing the superconducting state [11]. More broadly, knowledge of the response of the EFG tensor to strain may provide important insights into the electronic structure calculations in strongly correlated materials [45, 46].
Acknowledgements.
We thank A. Chakraborty, J. Barraclough, R. Fernandes, I. Fisher and A. Ward for stimulating discussions. NJC greatly benefited from the International Workshop on the Experimental Advances in the Use of Pressure and Strain to Probe and Control Quantum Matter, PSQM, held in Ames Iowa in May of 2022; many of the key ideas associated with this paper were developed during the workshop time. Work at UC Davis was supported by the NSF under Grants No. DMR-2210613 and PHY-1852581. Work at the Ames National Laboratory was supported by the U.S. Department of Energy, Office of Science, Basic Energy Sciences, Materials Sciences and Engineering Division. Ames National Laboratory is operated for the U.S. Department of Energy by Iowa State University under Contract No. DE-AC02-07CH11358.References
References
- Fradkin et al. [2010] E. Fradkin, S. A. Kivelson, M. J. Lawler, J. P. Eisenstein, and A. P. Mackenzie, “Nematic Fermi fluids in condensed matter physics,” Annu. Rev. Condens. Matter Phys. 1, 153–178 (2010).
- Canfield and Bud’ko [2010] P. C. Canfield and S. L. Bud’ko, “FeAs-based superconductivity: A case study of the effects of transition metal doping on BaFe2As2,” Annu. Rev. Condens. Matter Phys. 1, 27–50 (2010).
- Fernandes et al. [2012] R. M. Fernandes, A. V. Chubukov, J. Knolle, I. Eremin, and J. Schmalian, “Preemptive nematic order, pseudogap, and orbital order in the iron pnictides,” Phys. Rev. B 85, 024534 (2012).
- Yi et al. [2012] M. Yi, D. H. Lu, R. G. Moore, K. Kihou, C.-H. Lee, A. Iyo, H. Eisaki, T. Yoshida, A. Fujimori, and Z.-X. Shen, “Electronic reconstruction through the structural and magnetic transitions in detwinned NaFeAs,” New J. Phys. 14, 073019 (2012).
- Chu et al. [2012] J.-H. Chu, H.-H. Kuo, J. G. Analytis, and I. R. Fisher, “Divergent nematic susceptibility in an iron arsenide superconductor,” Science 337, 710–712 (2012).
- Kuo et al. [2016] H.-H. Kuo, J.-H. Chu, J. C. Palmstrom, S. A. Kivelson, and I. R. Fisher, “Ubiquitous signatures of nematic quantum criticality in optimally doped Fe-based superconductors,” Science 352, 958–962 (2016).
- Worasaran et al. [2021] T. Worasaran, M. S. Ikeda, J. C. Palmstrom, J. A. W. Straquadine, S. A. Kivelson, and I. R. Fisher, “Nematic quantum criticality in an Fe-based superconductor revealed by strain-tuning,” Science 372, 973–977 (2021).
- Fernandes, Chubukov, and Schmalian [2014] R. M. Fernandes, A. V. Chubukov, and J. Schmalian, “What drives nematic order in iron-based superconductors?” Nat. Phys. 10, 97–104 (2014).
- Lederer et al. [2015] S. Lederer, Y. Schattner, E. Berg, and S. A. Kivelson, “Enhancement of superconductivity near a nematic quantum critical point,” Phys. Rev. Lett. 114, 097001 (2015).
- Maier and Scalapino [2014] T. A. Maier and D. J. Scalapino, “Pairing interaction near a nematic quantum critical point of a three-band model,” Phys. Rev. B 90, 174510 (2014).
- Lederer et al. [2017] S. Lederer, Y. Schattnerb, E. Berg, and S. A. Kivelson, “Superconductivity and non-Fermi liquid behavior near a nematic quantum critical point,” PNAS 114, 4905–4910 (2017).
- Tanatar et al. [2010] M. A. Tanatar, E. C. Blomberg, A. Kreyssig, M. G. Kim, N. Ni, A. Thaler, S. L. Bud’ko, P. C. Canfield, A. I. Goldman, I. I. Mazin, and R. Prozorov, “Uniaxial-strain mechanical detwinning of CaFe2As2 and BaFe2As2 crystals: Optical and transport study,” Phys. Rev. B 81, 184508 (2010).
- Chu et al. [2010] J.-H. Chu, J. G. Analytis, K. De Greve, P. L. McMahon, Z. Islam, Y. Yamamoto, and I. R. Fisher, “In-plane resistivity anisotropy in an underdoped iron arsenide superconductor,” Science 329, 824–826 (2010).
- Fernandes et al. [2010] R. M. Fernandes, L. H. VanBebber, S. Bhattacharya, P. Chandra, V. Keppens, D. Mandrus, M. A. McGuire, B. C. Sales, A. S. Sefat, and J. Schmalian, “Effects of nematic fluctuations on the elastic properties of iron arsenide superconductors,” Phys. Rev. Lett. 105, 157003 (2010).
- Böhmer et al. [2015] A. E. Böhmer, T. Arai, F. Hardy, T. Hattori, T. Iye, T. Wolf, H. v. Löhneysen, K. Ishida, and C. Meingast, “Origin of the tetragonal-to-orthorhombic phase transition in FeSe: A combined thermodynamic and NMR study of nematicity,” Phys. Rev. Lett. 114, 027001 (2015).
- He et al. [2016] M. He, L. Wang, F. Ahn, F. Hardy, T. Wolf, P. Adelmann, J. Schmalian, I. Eremin, and C. Meingast, “Dichotomy between in-plane magnetic susceptibility and resistivity anisotropies in extremely strained BaFe2As2,” Nat. Commun. 8, 504 (2016).
- Böhmer and Meingast [2016] A. E. Böhmer and C. Meingast, “Electronic nematic susceptibility of iron-based superconductors,” C. R. Phys. 17, 90 – 112 (2016).
- Jiang et al. [2013] S. Jiang, H. S. Jeevan, J. Dong, and P. Gegenwart, “Thermopower as a sensitive probe of electronic nematicity in iron pnictides,” Phys. Rev. Lett. 110, 067001 (2013).
- Gallais et al. [2013] Y. Gallais, R. M. Fernandes, I. Paul, L. Chauvière, Y.-X. Yang, M.-A. Méasson, M. Cazayous, A. Sacuto, D. Colson, and A. Forget, “Observation of incipient charge nematicity in Ba(Fe1-xCox)2As2,” Phys. Rev. Lett. 111 (2013), 10.1103/PhysRevLett.111.267001.
- Blomberg et al. [2012] E. C. Blomberg, A. Kreyssig, M. A. Tanatar, R. M. Fernandes, M. G. Kim, A. Thaler, J. Schmalian, S. L. Bud’ko, P. C. Canfield, A. I. Goldman, and R. Prozorov, “Effect of tensile stress on the in-plane resistivity anisotropy in BaFe2As2,” Phys. Rev. B 85, 144509 (2012).
- Tanatar et al. [2016] M. A. Tanatar, A. E. Böhmer, E. I. Timmons, M. Schütt, G. Drachuck, V. Taufour, K. Kothapalli, A. Kreyssig, S. L. Bud’ko, P. C. Canfield, R. M. Fernandes, and R. Prozorov, “Origin of the resistivity anisotropy in the nematic phase of FeSe,” Phys. Rev. Lett. 117, 127001 (2016).
- Mirri et al. [2015] C. Mirri, A. Dusza, S. Bastelberger, M. Chinotti, L. Degiorgi, J.-H. Chu, H.-H. Kuo, and I. R. Fisher, “Origin of the resistive anisotropy in the electronic nematic phase of BaFe2As2 revealed by optical spectroscopy,” Phys. Rev. Lett. 115, 107001 (2015).
- Ning et al. [2014] F. L. Ning, M. Fu, D. A. Torchetti, T. Imai, A. S. Sefat, P. Cheng, B. Shen, and H.-H. Wen, “Critical behavior of the spin density wave transition in underdoped Ba(Fe1-xCox)2As2 (): 75As NMR investigation,” Phys. Rev. B 89, 214511 (2014).
- Kissikov et al. [2018] T. Kissikov, R. Sarkar, M. Lawson, B. T. Bush, E. I. Timmons, M. A. Tanatar, R. Prozorov, S. L. Bud’ko, P. C. Canfield, R. M. Fernandes, and N. J. Curro, “Uniaxial strain control of spin-polarization in multicomponent nematic order of BaFe2As2,” Nat. Commun. 9, 1058 (2018).
- Dai [2015] P. Dai, “Antiferromagnetic order and spin dynamics in iron-based superconductors,” Rev. Mod. Phys. 87, 855–896 (2015).
- Man et al. [2015] H. Man, X. Lu, J. S. Chen, R. Zhang, W. Zhang, H. Luo, J. Kulda, A. Ivanov, T. Keller, E. Morosan, Q. Si, and P. Dai, “Electronic nematic correlations in the stress-free tetragonal state of BaFe2-xNixAs2,” Phys. Rev. B 92, 134521 (2015).
- Lu et al. [2014] X. Lu, J. T. Park, R. Zhang, H. Luo, A. H. Nevidomskyy, Q. Si, and P. Dai, “Nematic spin correlations in the tetragonal state of uniaxial-strained BaFe2-xNixAs2,” Science 345, 657 – 660 (2014).
- Dioguardi et al. [2016] A. P. Dioguardi, T. Kissikov, C. H. Lin, K. R. Shirer, M. M. Lawson, H.-J. Grafe, J.-H. Chu, I. R. Fisher, R. M. Fernandes, and N. J. Curro, “NMR evidence for inhomogeneous nematic fluctuations in BaFe2(As1-xPx)2,” Phys. Rev. Lett. 116, 107202 (2016).
- Kissikov et al. [2017a] T. Kissikov, R. Sarkar, M. Lawson, B. T. Bush, E. I. Timmons, M. A. Tanatar, R. Prozorov, S. L. Bud’ko, P. C. Canfield, R. M. Fernandes, W. F. Goh, W. E. Pickett, and N. J. Curro, “Local nematic susceptibility in stressed BaFe2As2 from NMR electric field gradient measurements,” Phys. Rev. B 96, 241108(R) (2017a).
- Baek et al. [2015] S.-H. Baek, D. V. Efremov, J. M. Ok, J. S. Kim, J. van den Brink, and B. Büchner, “Orbital-driven nematicity in FeSe,” Nat. Mater. 14, 210–214 (2015).
- Edelstein et al. [1980] W. A. Edelstein, J. M. S. Hutchison, G. Johnson, and T. Redpath, “Spin warp NMR imaging and applications to human whole-body imaging,” Phys. Med. Biol. 25, 751–756 (1980).
- Johnson et al. [1983] G. Johnson, J. Hutchison, T. Redpath, and L. Eastwood, “Improvements in performance time for simultaneous three-dimensional nmr imaging,” Journal of Magnetic Resonance (1969) 54, 374–384 (1983).
- Falk et al. [2014] A. L. Falk, P. V. Klimov, B. B. Buckley, V. Ivády, I. A. Abrikosov, G. Calusine, W. F. Koehl, Á. Gali, and D. D. Awschalom, “Electrically and mechanically tunable electron spins in silicon carbide color centers,” Phys. Rev. Lett. 112, 187601 (2014).
- Hristov et al. [2018] A. T. Hristov, J. C. Palmstrom, J. A. W. Straquadine, T. A. Merz, H. Y. Hwang, and I. R. Fisher, “Measurement of elastoresistivity at finite frequency by amplitude demodulation,” Rev. Sci. Instrum. 89, 103901 (2018).
- Ikeda et al. [2019] M. S. Ikeda, J. A. W. Straquadine, A. T. Hristov, T. Worasaran, J. C. Palmstrom, M. Sorensen, P. Walmsley, and I. R. Fisher, “AC elastocaloric effect as a probe for thermodynamic signatures of continuous phase transitions,” Rev. Sci. Instrum. 90, 083902 (2019).
- Hicks et al. [2014] C. W. Hicks, M. E. Barber, S. D. Edkins, D. O. Brodsky, and A. P. Mackenzie, “Piezoelectric-based apparatus for strain tuning,” Rev. Sci. Instrum. 85, 065003 (2014).
- Kissikov et al. [2017b] T. Kissikov, R. Sarkar, B. T. Bush, M. Lawson, P. C. Canfield, and N. J. Curro, “Nuclear magnetic resonance probe head design for precision strain control,” Rev. Sci. Instrum. 88, 103902 (2017b).
- Curro et al. [2022] N. J. Curro, T. Kissikov, M. A. Tanatar, R. Prozorov, S. L. Bud’ko, and P. C. Canfield, “Nematicity and glassy behavior probed by nuclear magnetic resonance in iron-based superconductors,” Front. Phys. 10 (2022), 10.3389/fphy.2022.877628.
- Kitagawa et al. [2008] K. Kitagawa, N. Katayama, K. Ohgushi, M. Yoshida, and M. Takigawa, “Commensurate itinerant antiferromagnetism in BaFe2As2: 75As-NMR studies on a self-flux grown single crystal,” J. Phys. Soc. Jpn. 77, 114709 (2008).
- Johansson, Nation, and Nori [2012] J. Johansson, P. Nation, and F. Nori, “QuTiP: An open-source python framework for the dynamics of open quantum systems,” Comput. Phys. Commun. 183, 1760–1772 (2012).
- Johansson, Nation, and Nori [2013] J. Johansson, P. Nation, and F. Nori, “QuTiP 2: A python framework for the dynamics of open quantum systems,” Comput. Phys. Commun. 184, 1234–1240 (2013).
- Dioguardi et al. [2013] A. P. Dioguardi, J. Crocker, A. C. Shockley, N. apRoberts Warren, C. Lin, K. R. Shirer, D. Nisson, A. Lodhia, P. Klavins, and N. J. Curro, “Angular dependent 75As NMR study of the electric field gradient in CaFe2As2,” Supercond. Sci. Technol. 26, 025012 (2013).
- Cui et al. [2017] J. Cui, Q.-P. Ding, W. R. Meier, A. E. Böhmer, T. Kong, V. Borisov, Y. Lee, S. L. Bud’ko, R. Valentí, P. C. Canfield, and Y. Furukawa, “Magnetic fluctuations and superconducting properties of CaKFe4As4 studied by 75As NMR,” Phys. Rev. B 96, 104512 (2017).
- Meier et al. [2016] W. R. Meier, T. Kong, U. S. Kaluarachchi, V. Taufour, N. H. Jo, G. Drachuck, A. E. Böhmer, S. M. Saunders, A. Sapkota, A. Kreyssig, M. A. Tanatar, R. Prozorov, A. I. Goldman, F. F. Balakirev, A. Gurevich, S. L. Bud’ko, and P. C. Canfield, “Anisotropic thermodynamic and transport properties of single-crystalline ,” Phys. Rev. B 94, 064501 (2016).
- Stoll, Meier, and Claxton [2002] E. P. Stoll, P. F. Meier, and T. A. Claxton, “Electric field gradients from first-principles and point-ion calculations,” Phys. Rev. B 65, 064532 (2002).
- Rusz et al. [2008] J. Rusz, P. M. Oppeneer, N. J. Curro, R. R. Urbano, B.-L. Young, S. Lebègue, P. G. Pagliuso, L. D. Pham, E. D. Bauer, J. L. Sarrao, and Z. Fisk, “Probing the electronic structure of pure and doped CeMIn5 (M = Co,Rh,Ir) crystals with nuclear quadrupolar resonance,” Phys. Rev. B 77, 245124 (2008).