The Hubble Tension Survey: A Statistical Analysis of the 2012-2022 Measurements
Abstract
In order to investigate the potential Hubble tension, we compile a catalogue of 216 measurements of the Hubble–Lemaître constant between 2012 and 2022, which includes 109 model-independent measurements and 107 CDM model-based measurements. Statistical analyses of these measurements show that the deviations of the results with respect to the average are far larger than expected from their error bars if they follow a Gaussian distribution. We find that deviation is indeed equivalent in a Gaussian distribution to deviation in the frequency of values, where . Hence, a tension of 5, estimated between the Cepheid-calibrated type Ia supernovae and cosmic microwave background (CMB) data, is indeed a 3 tension in equivalent terms of a Gaussian distribution of frequencies. However, this recalibration should be independent of the data whose tension we want to test. If we adopt the previous analysis of data of 1976-2019, the equivalent tension is reduced to . Covariance terms due to correlations of measurements do not significantly change the results. Nonetheless, the separation of the data into two blocks with and km s-1 Mpc-1 finds compatibility with a Gaussian distribution for each of them without removing any outlier. These statistical results indicate that the underestimation of error bars for remains prevalent over the past decade, dominated by systematic errors in the methodologies of CMB and local distance ladder analyses.
keywords:
cosmological parameters – cosmology: observations – distance scale1 Introduction
Few problems in astrophysics have received as much attention in the last years as what is called ‘Hubble tension’. Hundreds or thousands of papers dedicated to investigating the observations that originate the tension within the standard cosmological model or to propose alternative scenarios have been produced (see reviews by Di Valentino et al. 2021; Perivolaropoulos & Skara 2022; Abdalla et al. 2022; Hu & Wang 2023; Vagnozzi 2023). The tension was mainly triggered with the claim in 2019 of a Hubble–Lemaître constant estimated from the local Cepheid–type Ia supernova (SN Ia) distance ladder being at odds with the value extrapolated from Cosmic Microwave Background (CMB) data, assuming the standard CDM cosmological model, (Riess et al., 2019) and km s-1 Mpc-1 (Planck Collaboration et al., 2020), respectively, which gave an incompatibility at the 4.4 level. This tension was later increased up to 6 depending on the datasets considered (Di Valentino et al., 2021). Very recently, the latest result from the Cepheid–SN Ia sample is km s-1 Mpc-1 (Riess et al., 2022), representing a 5 tension with that estimated from CMB data.
This tension should not be so surprising, given the number of systematic errors that may arise in the measurements. As a matter of fact, there have always been tensions between different measurements in the values of the Hubble–Lemaître constant, which has not received so much attention. Before the 1970s, due to different corrections of errors in the calibration of standard candles, the parameter continuously decreased its value, making incompatible measurements of different epochs (Tully, 2023). But even after the 1970s, a tension has always been present. The compilations of values until the beginning of the 2000s showed an error distribution that was strongly non-Gaussian, with significantly larger probability in the tails of the distribution than predicted by a Gaussian distribution: the 95.4% confidence-level (CL) limits are 7.0 in terms of the quoted errors (Chen et al., 2003). The nature of the possible systematic errors is unknown, and they may dominate over the statistical errors. Twenty years ago, it was estimated that these systematic errors might be of the order of 5 km s-1 Mpc-1 (95% CL) (Gott et al., 2001).
The common likelihood functions used by astronomers contain the assumption of Gaussian errors (D’Agostini, 2005), which is also a requirement of the central limit theorem. Statistical analyses of the measurements of the Hubble–Lemaître constant between 1976 and 2019 (Faerber & López-Corredoira, 2020; López-Corredoira, 2022) have also shown that the dispersion of its value is far much larger than what would be expected in a Gaussian distribution given the published error bars. The only solution to understand this dispersion of values is assuming that most of the statistical error bars associated with the observed parameter measurements have been underestimated, or the systematic errors were not properly taken into account. The fact that the underestimation of error bars for is so common might explain the apparent discrepancy of values. Indeed, a recalibration of the probabilities with this sample of measurements to make it compatible with a Gaussian distribution of deviations finds that a tension of 4.4 would be indeed a 2.1 tension in equivalent terms of a Gaussian distribution of frequencies, and a tension of 6.0 would be indeed a 2.5 tension in equivalent terms of a Gaussian distribution of frequencies (López-Corredoira, 2022). That is, we should not be surprised to find those 4-6 tensions, because they are much more frequent than indicated by the Gaussian statistics, and they stem from underestimation of errors, not from real tensions in the background of physics or cosmology.
In this paper, we want to extend this type of historical statistical analyses focusing only in the years 2012-2022. We know the statistical and systematic errors are much smaller now than some decades ago, but it is still worth to check whether the distribution of these errors follows what is expected in a Gaussian distribution. Clearly, if we focus on the Hubble tension between SN Ia data and CMB data, the answer is negative, but apart from these two types of sources, we want to explore other measurements too and globally evaluate the distribution.
In Sect. 2, we give a description of the bibliographical data we used for our statistical analyses and the criteria to select them. Statistical analyses are presented in Sect. 3. Recalibration of data in order to comply with a Gaussian distribution is presented in Sect. 4. We are aware that many of the data are correlated, they were measured by the same teams and/or with similar calibrators or methods, so we add in Sect. 5 some considerations on the effect of removing correlated data. The last section summarizes and discusses the results and the possible origin of the underestimated statistical errors and/or ‘unknown’ systematic errors.
2 Bibliographical Data
We conduct a comprehensive search for measurements between the years 2012 and 2022 in the NASA Astrophysics Data System111https://ui.adsabs.harvard.edu/., adhering to the following selection criteria:
-
1.
The values were reported by published papers.
-
2.
We only pay attention to the measurements inferred from model-independent methods and within the context of standard CDM. Note that hundreds or thousands of papers dedicated to investigating the Hubble tension. A substantial fraction of them focuses on proposing alternative cosmological models for measuring in order to narrow the discrepancy between the CMB and SN Ia observations. Those measurements obtained under models other than CDM222Numerous models proposed for solving the tension are divided into 11 major categories with 123 subcategories by Di Valentino et al. (2021). are not included in our sample, since they potentially interfere with the analysis of the Hubble tension.
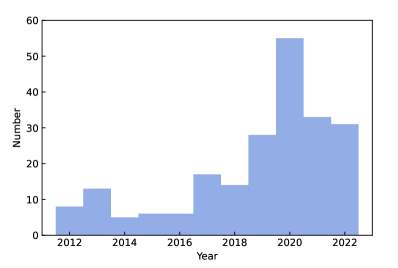
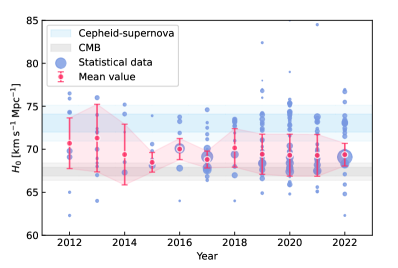
Based on the aforementioned criteria, we compile a total of 216 measured values, with 109 values measured from model-independent methods and 107 values obtained under the CDM model. For the complete catalogue, please refer to LABEL:TabB1 provided in the Appendix. The histogram and scatter of these data are plotted in Figure 1. The size of the scatter dots is inversely proportional to the error. We can find a significant increase in numbers of the measured after the year 2019, primarily attributed to the renowned Hubble tension problem, while concurrently witnessing an improvement in measurement accuracy. It is essential to reexamine these measurements from a statistical perspective. Therefore, we employ the statistical analysis approach proposed by López-Corredoira (2022) to investigate the tension over the past 11 years.
3 Statistical Analysis
3.1 Distributions of Statistical Data
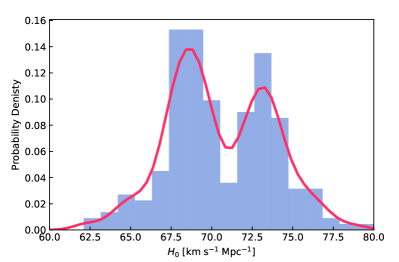
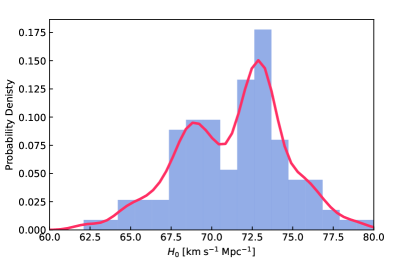
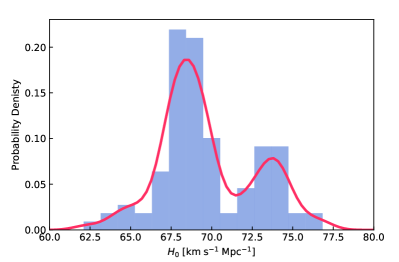
The statistical data of are divided into three categories: complete, model-independent and CDM model-based measurements. These categorizations can be distinguished based on the statements in the respective articles (see LABEL:TabB1). To visualize the distributions of these measurements, in Figure 2 we plot histograms for each category. Notably, significant bimodal distributions are observed in all three subplots, which imply the possible tension: the measurements are clustered around from the CMB data (Planck Collaboration et al., 2020) and from the local Cepheid-supernova distance ladder (Riess et al., 2022). Despite the model-independent measurements tending to favor the results of local distance ladders and the CDM model-based measurements tending to favor the results of Planck CMB observations, the bimodal distributions still exist in both cases. This phenomenon has not been reported in previous analyses conducted using statistical data (Chen & Ratra, 2011; Croft & Dailey, 2015; Zhang, 2018; Faerber & López-Corredoira, 2020; López-Corredoira, 2022).
Moreover, from the perspective of early and late Universe observations, our statistics also reveal some intriguing situations. The methods of the early Universe observations, mainly including CMB and baryon acoustic oscillation (BAO) data, consistently have results around in CDM model-based measurements, aligning with expectations. However, it was previously thought that the measured in late Universe was approximately , which does not match our statistics. Almost all of the model-independent measurements in our statistics are derived from the late Universe observations, but a considerable proportion of these measurements deviate from the value of .
3.2 Statistical Significance of the Bimodality
In this subsection, our focus is on assessing the statistical significance of the double peaks in the distribution. To achieve this objective, we employ the dip test, a general method for testing multimodality of distributions (Hartigan & Hartigan, 1985). The dip test quantifies multimodality in a sample by calculating the discrepancy between the empirical distribution function of the samples and the unimodal distribution function that minimizes the maximum discrepancy. We implement this approach by using the 333https://github.com/RUrlus/diptest/blob/stable. package in Python. The values for the dip test range between 0 and 1, representing the probability of unimodality. The values less than 0.05 indicate significant multimodality.
In addition to the three categories mentioned in the previous subsection, we further segment the complete measurements into two blocks: (118 data) and (98 data) for comparison. The results are summarized in the last column of Table 1. The complete measurements result in and the measurements for the two blocks result in and , respectively. This reveals that the measurements of two blocks exhibit unimodality (), whereas complete measurements exhibit significant multimodality (), specifically bimodality. This implies a potential tension. For the model-independent and CDM model-based measurements, the results of the dip test are and , respectively, indicating that the evidence of multimodality is not robust, and the unimodality is not statistically significant either.
3.3 Statistical Significance of model-independent and CDM model-based measurements
| Number | |||||
| Complete | 216 | 515.99 | 0.01 | ||
| Model-independent | 109 | 181.48 | 0.46 | ||
| CDM model-based | 107 | 237.56 | 0.16 | ||
| 118 | 95.09 | 0.93 | 0.96 | ||
| 98 | 30.05 | 0.98 |
To investigate the causes of the bimodal distributions, we continue to analyse the statistical significance of three categories: complete, model-independent and CDM model-based measurements. We calculate the weighted average value to analyze the statistical characteristic, whereby each data value is assigned a weight based on its inverse variance. Then we can obtain for of three categories:
| (1) |
where and are the measured value and standard deviation, respectively. The weighted average values , along with their corresponding standard deviations , and values are summarized in Table 1. The index is used to measure their statistical significance, representing the probability that sample differences arise solely from chance errors. Typically, the statistical significance is satisfied when . The three categories yield weighted averages of (), (), and (), respectively. The fittings of two blocks are also displayed, with . However, for all three categories, the values are much lower than the threshold 0.05, indicating that it is highly unlikely that the observed trends are due to chance errors.
It is important to note that the implicit assumption in our calculations is that the covariance of each measurement is ignored. A considerable fraction of the measurements were not independent at all, since there were many duplicate data being used. If the data are treated as independent variables, a conservative limit of the real dispersion of data would be obtained. This is because the ‘effective’ number of degrees of freedom is smaller than the number assuming independence, leading to an increase of the reduced value. These defects also make the cause of the bimodal distributions uncertain, as they may arise from a failure to eliminate the correlated data. More discussion can refer to section 5.
3.4 Outliers Screening
| Outliers | Number | |||||
|---|---|---|---|---|---|---|
| Complete | 2.4 | 27 | 189 | 216.42 | 0.08 | |
| Model-independent | 3.6 | 1 | 108 | 84.20 | 0.95 | |
| CDM model-based | 2.6 | 13 | 94 | 106.33 | 0.16 |
Removing sufficient outliers which deviate significantly from the mean would result in values exceeding 0.05. It is imperative to investigate how many outliers lead to a loss of statistical significance. Prior to removal, we define the number of deviations between the measurements and the average as
| (2) |
To ensure a significance level of , data with are excluded, and the calculations for and follow the methodology described in the previous subsection. Our results are listed in Table 2, where the weighted averages are , and , respectively. Additionally, the 27 outliers of the complete category are listed in Table 3. Compared to the values obtained in Table 1, several pieces of information can be inferred:
-
1.
The measurements from model-independent methods perform best. The number of outliers is only one, with a value of , obtained from combining Hubble parameter , Sunyaev-Zel’dovich effect and X-ray data (Huang & Huang, 2017). The outlier is due to its remarkably low error.
-
2.
The outliers in the complete dataset predominantly arise from the observations of Cepheids+SNe Ia, lensing, CMB and BAO. Due to their small error ranges, the deviations are obvious, especially for the renowned results from Riess et al. (2022) and Planck Collaboration et al. (2020). And most of the outliers were obtained after the year 2019.
-
3.
The outliers in the Model-independent and CDM model-based dataset are less than in the complete one, which implies the possible tension between them.
Based on the available evidence, there are signs of the Hubble tension. However, the degree of tension may be overestimated. Therefore, our subsequent analysis aimed to quantify this potential overestimation.
| Year | Authors | Methods | ||
|---|---|---|---|---|
| 2013 | 3.50 | Fiorentino et al. | Cepheids+SNe Ia | |
| 2017 | 3.49 | Alam et al. | BAO+SNe Ia | |
| 2017 | 3.21 | Chavanis et al. | Planck 2015+Lensing+BAO+JLA+HST | |
| 2017 | 2.50 | Wang et al. | Angular diameter distance | |
| 2018 | 2.49 | Riess et al. | Cepheids+SNe Ia | |
| 2019 | 2.87 | Chen et al. | Gravitational lensing | |
| 2019 | 2.97 | Reid et al. | Cepheids+SNe Ia | |
| 2019 | 3.30 | Riess et al. | Cepheids+SNe Ia | |
| 2020 | 3.53 | Camarena et al. | SNe Ia+Angular BAO+ prior | |
| 2020 | 3.56 | Camarena et al. | SNe Ia+Anisotropic BAO+ prior | |
| 2020 | 3.58 | Camarena et al. | SNe Ia+ prior | |
| 2020 | 3.58 | Camarena et al. | SNe Ia+Angular BAO+ prior | |
| 2020 | 2.66 | Millon et al. | Gravitational lensing | |
| 2020 | 3.03 | Millon et al. | Gravitational lensing | |
| 2020 | 3.89 | Planck Collaboration et al. | Planck2018 | |
| 2020 | 2.50 | Qi et al. | Gravitational lensing | |
| 2020 | 2.61 | Wei et al. | Lensing+SNe Ia | |
| 2021 | 3.50 | Balkenhol et al. | Planck2018+SPT+ACT | |
| 2021 | 5.28 | Bonilla et al. | SNe Ia+CC+BAO+H0LiCOW | |
| 2021 | 2.97 | Riess et al. | Cepheids+SNe Ia | |
| 2022 | 2.46 | Kourkchi et al. | Tully-Fisher Relation | |
| 2022 | 2.53 | Mörtsell et al. | Cepheids+SNe Ia | |
| 2022 | 2.97 | Mörtsell et al. | Cepheids+SNe Ia | |
| 2022 | 3.68 | Mörtsell et al. | Cepheids | |
| 2022 | 3.55 | Riess et al. | Cepheids+SNe Ia | |
| 2022 | 3.70 | Riess et al. | Cepheids+SNe Ia | |
| 2022 | 3.92 | Riess et al. | Cepheids+SNe Ia |
4 Recalibration of Probabilities
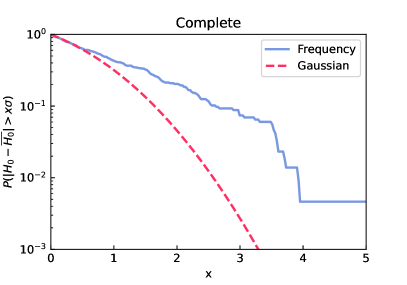
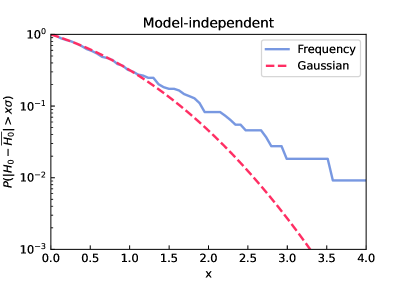
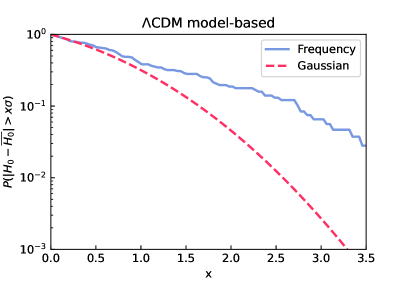
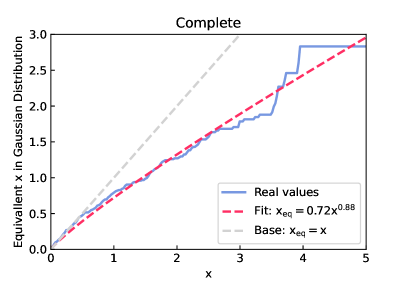
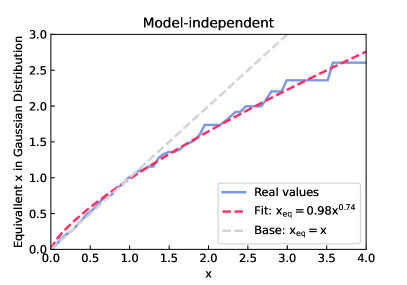
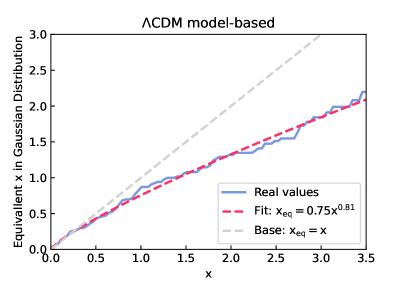
In Figure 3, we display the frequency of deviations larger than from the weighted average values derived using the complete, model-independent and CDM model-based categories. For comparison, the Gaussian cumulative distributions are also given, which enables us to infer the degree to which the sample deviates from the expected Gaussian error distribution with a certain probability. For instance, if , the error is approximately in a Gaussian error distribution, while in real samples, indicating an overestimated deviation of .
To describe this overestimated deviation quantitatively, we calculate the equivalent deviation between the probabilities of Gaussian distributions and the real frequency, which means that there is actually a deviation when the deviation is in the real frequency. And we fit them with the power function, , where and are free parameters. As shown in Figure 4, the equivalent deviations in three categories are
| (3) | |||||
| (4) | |||||
| (5) |
The baselines (i.e., ; gray dashed lines) are also plotted in Figure 4, which represent the expected deviations of a Gaussian distribution without underestimating the error bar. Among three categories, the category of model-independent measurements most closely aligns with the Gaussian distribution (especially when ), while others exhibit significant deviations.
Considering the current 5 tension reported in Riess et al. (2022), the practical equivalent tension calculated using Equation 3 is . However, in order to calibrate and apply it to present-day Hubble tension values, we should use data before the Hubble tension, because the calibration should be independent of the data whose tension we want to test. If we adopt the function of López-Corredoira (2022) with data of 1976-2019, the equivalent tension is reduced to (), which is a more accurate estimation. It also indicates that the Hubble tension is stronger in the past decade, probably due to the improvement in measurement accuracy and the increase in relevant data. Although these findings suggest an increase in the Hubble tension, underestimation of errors is still common.
5 The Effects of Correlated Data
In a large number of measurements, a substantial portion of the observational data is reused, which makes the measurements correlated, but we ignore the correlation between them. As we mentioned in Equation 1, we treat the measurements as independent variables, and sum them without considering the covariance matrix. It is important to reiterate that the data we are investigating is not entirely independent, which means that our analysis may be biased. Therefore, it is necessary to account for the effects of correlated data. In this section, we eliminate 64 correlated data, leaving 152 data (71 model-independent measurements and 81 CDM-based measurements). The removal criteria are that: a) if the measurements are obtained from the same data, we remove the earlier one; b) if one person measures using data A and data B, and the other person uses only data B, we discard the result that uses only data B. We implement the same analysis and find minimal changes in all statistical characteristics as presented in Table 4.
| Number | |||||
| Complete | 152 | 357.49 | 0.12 | ||
| Model-independent | 71 | 123.61 | 0.62 | ||
| CDM model-based | 81 | 193.89 | 0.13 | ||
| 85 | 81.13 | 0.57 | 0.69 | ||
| 67 | 18.35 | 0.98 |
We also examine the statistical properties of double peaks by categorizing the 152 measurements into two blocks: (85 data) and (67 data). The calculated results of the dip test are (complete), () and (), respectively (see Table 4). The bimodality is alleviated but its value is far less significant than that of the two blocks. Additionally, the results of fittings indicate two blocks still satisfy the Gaussian distributions ().
However, there are still some correlated data in the dataset containing the 152 measurements, because it is not feasible to eliminate them using a fair approach. For example, we can not exclude those measurements obtained by the same observational data but with different methods. When we encounter the measurements separately obtained by the combined data A+B and the combined data B+C, although they are correlated, we also can not remove either of them. In any case, if we had a random selection of duplicated points, the reduced is similar, although the effective number of degrees of freedom is lower than the number assuming independence. Probability might be larger when covariance terms are taken into account, but still very low when .
6 Discussion and conclusions
A statistical analysis of 163 measurements of the Hubble–Lemaître constant between 1976 and 2019 was performed by López-Corredoira (2022), indicating a potential underestimation of the statistical error bars or an inadequate consideration of the systematic errors. Over the past decade, however, measurements of have increased in number and precision, making the Hubble tension increasingly important in a way that previous measurements did not. Therefore, we compile a catalogue of 216 measured values from the years 2012-2022, including 109 model-independent measurements and 107 CDM model-based measurements, to investigate the potential tension and biases over the last 11 years.
We find a significant bimodal distribution in the 216 measurements, corresponding to the results from the local distance ladder (; Riess et al. 2022) and CMB observations (; Planck Collaboration et al. 2020), which has not been reported in previous statistical studies yet. In the subsamples of 109 model-independent measurements and 107 CDM model-based measurements, the bimodal distributions still exist. We calculate the weighted averages and the probabilities for complete, model-independent and CDM model-based measurements, yielding (), () and () , respectively. Such low values () indicate that they are lack of statistical significance.
The above results, for instance in Figure 3, show clearly that the deviations of the results with respect to the average are far larger than expected from their error bars if they follow a Gaussian distribution. The underestimated 5 tension may actually be 3 when we recalibrate the frequency of deviations with respect to the average, which is still a significant tension. However, this recalibration should be independent of the data whose tension we want to test. If we adopt the analysis of data of 1976-2019 (López-Corredoira, 2022), the equivalent tension is reduced to .
In addition, the separation of the data into two blocks with and km s-1 Mpc-1 (Sect. 3.2) finds values of , indicating compatibility with a Gaussian distribution for each of them without removing any outliers. It points out that the possible underestimation of errors is related to own methodology in these two groups of measurements.
At km s-1 Mpc-1, recent measurements of with low error bars are dominated by CMB measurements. These values are subject to the errors in the cosmological interpretation of CMB with CDM, and it is subject to the many anomalies still pending to be solved in CMB anisotropies (Schwarz et al., 2016). Moreover, Galactic foregrounds are not perfectly removed (Lopez-Corredoira, 2007; Axelsson et al., 2015; Creswell & Naselsky, 2021), and these are an important source of uncertainties.
At km s-1 Mpc-1, recent measurements of with low error bars are dominated by SN Ia teams, using calibration with Cepheids. Intrinsic scatters in SN Ia measurements are poorly understood (Wojtak & Hjorth, 2022). The usual results are based on the assumption that there is only one hidden (latent) variable behind this scatter, namely the absolute magnitude. With this assumption, one can claim that the error in the distance scale (and consequently in the measurement) can be reduced by increasing the number of observed supernovae. The problem is that the actual space of latent variables behind the intrinsic scatter is much larger: dust extinction in SN Ia depending on the type of host galaxies (Meldorf et al., 2023), variations of the intrinsic luminosity of SN Ia with the age of the host galaxies (Lee et al., 2022), etc. Ignoring all these latent variables can only lead to underestimated errors and possible biases. As a matter of fact, measurements showing a decrease of with in SN Ia measurements (Jia et al., 2023) might indicate precisely the presence of these systematic biases rather than new physics or new cosmology. We must also bear in mind that the value of is determined without knowing on which scales the radial motion of galaxies and clusters of galaxies relative to us is completely dominated by the Hubble–Lemaître flow. The homogeneity scale may be much larger than expected (Sylos Labini, 2011), thus giving important net velocity flows on large scales that are incorrectly attributed to cosmological redshifts.
In conclusion, our statistical analysis indicates that the underestimation of error bars for remains prevalent over the past decade, dominated by systematic errors in the methodologies of CMB and SN Ia analyses which make the tension become increasingly evident.
Acknowledgements
We thank the anonymous referee for useful comments and suggestions. This work is partially supported by the National Natural Science Foundation of China (grant Nos. 12373053, 12321003, and 12041306), the Key Research Program of Frontier Sciences (grant No. ZDBS-LY-7014) of Chinese Academy of Sciences, the Natural Science Foundation of Jiangsu Province (grant No. BK20221562), and the Young Elite Scientists Sponsorship Program of Jiangsu Association for Science and Technology. M.L.C. is supported by Chinese Academy of Sciences President’s International Fellowship Initiative (grant No. 2023VMB0001).
Data Availability
The data underlying this article are available in the article and the cite references.
References
- Abdalla et al. (2022) Abdalla E., et al., 2022, Journal of High Energy Astrophysics, 34, 49
- Axelsson et al. (2015) Axelsson M., Ihle H. T., Scodeller S., Hansen F. K., 2015, A&A, 578, A44
- Chen & Ratra (2011) Chen G., Ratra B., 2011, PASP, 123, 1127
- Chen et al. (2003) Chen G., Gott J. Richard I., Ratra B., 2003, PASP, 115, 1269
- Creswell & Naselsky (2021) Creswell J., Naselsky P., 2021, J. Cosmology Astropart. Phys., 2021, 103
- Croft & Dailey (2015) Croft R. A. C., Dailey M., 2015, arXiv e-prints, p. arXiv:1112.3108
- D’Agostini (2005) D’Agostini G., 2005, arXiv e-prints, p. physics/0511182
- Di Valentino et al. (2021) Di Valentino E., et al., 2021, Classical and Quantum Gravity, 38, 153001
- Faerber & López-Corredoira (2020) Faerber T., López-Corredoira M., 2020, Universe, 6, 114
- Gott et al. (2001) Gott J. Richard I., Vogeley M. S., Podariu S., Ratra B., 2001, ApJ, 549, 1
- Hartigan & Hartigan (1985) Hartigan J. A., Hartigan P. M., 1985, The annals of Statistics, pp 70–84
- Hu & Wang (2023) Hu J.-P., Wang F.-Y., 2023, Universe, 9, 94
- Huang & Huang (2017) Huang H., Huang L., 2017, International Journal of Modern Physics D, 26, 1750129
- Jia et al. (2023) Jia X. D., Hu J. P., Wang F. Y., 2023, A&A, 674, A45
- Lee et al. (2022) Lee Y.-W., Chung C., Demarque P., Park S., Son J., Kang Y., 2022, MNRAS, 517, 2697
- Lopez-Corredoira (2007) Lopez-Corredoira M., 2007, Journal of Astrophysics and Astronomy, 28, 101
- López-Corredoira (2022) López-Corredoira M., 2022, MNRAS, 517, 5805
- Meldorf et al. (2023) Meldorf C., et al., 2023, MNRAS, 518, 1985
- Perivolaropoulos & Skara (2022) Perivolaropoulos L., Skara F., 2022, New Astron. Rev., 95, 101659
- Planck Collaboration et al. (2020) Planck Collaboration et al., 2020, A&A, 641, A6
- Riess et al. (2019) Riess A. G., Casertano S., Yuan W., Macri L. M., Scolnic D., 2019, ApJ, 876, 85
- Riess et al. (2022) Riess A. G., et al., 2022, ApJ, 934, L7
- Schwarz et al. (2016) Schwarz D. J., Copi C. J., Huterer D., Starkman G. D., 2016, Classical and Quantum Gravity, 33, 184001
- Sylos Labini (2011) Sylos Labini F., 2011, Classical and Quantum Gravity, 28, 164003
- Tully (2023) Tully R. B., 2023, arXiv e-prints, p. arXiv:2305.11950
- Vagnozzi (2023) Vagnozzi S., 2023, Universe, 9, 393
- Wojtak & Hjorth (2022) Wojtak R., Hjorth J., 2022, MNRAS, 515, 2790
- Zhang (2018) Zhang J., 2018, PASP, 130, 084502
Appendix A Hubble–Lemaître Constant Catalogue
| Model-independent | CDM model-based | ||||
| Year | References | Year | References | ||
| 2012 | Tammann and Reindl, 2012, Ap&SS, 341, 3. | 2012 | Campanelli et al., 2012, EPJC, 72, 2218. | ||
| 2012 | Lee and Jang, 2012, ApJL, 760, L14. | 2012 | Mehta et al., 2012, MNRAS, 427, 2168. | ||
| 2012 | Freedman et al. 2012, ApJ, 758, 24. | 2012 | Holanda et al., 2012, GReGr, 44, 501. | ||
| 2012 | Chávez et al., 2012, MNRAS, 425, L57. | 2013 | Sereno and Paraficz, 2014, MNRAS, 437, 600. | ||
| 2012 | Courtois and Tully, 2012, ApJ, 749, 174. | 2013 | Hinshaw et al., 2013, ApJS, 208, 19. | ||
| 2013 | Tammann and Reindl, 2013, A&A, 549, A136. | 2013 | Domínguez and Prada, 2013, ApJL, 771, L34. | ||
| 2013 | Colless et al., 2013, IAUS, 289, 319. | 2014 | Planck Collaboration et al., 2014, A&A, 571, A16. | ||
| 2013 | Kuo et al., 2013, ApJ, 767, 155. | 2014 | Verde et al., 2014, PDU, 5, 307. | ||
| 2013 | Braatz et al., 2013, IAUS, 289, 255. | 2014 | Lima and Cunha, 2014, ApJL, 781, L38. | ||
| 2013 | Lee and Jang, 2013, ApJ, 773, 13. | 2015 | Cheng and Huang, 2015, SCPMA, 58, 5684. | ||
| 2013 | Reid et al. 2013, ApJ, 767, 154. | 2015 | Wei et al., 2015, MNRAS, 447, 479. | ||
| 2013 | Humphreys et al., 2013, ApJ, 775, 13. | 2015 | Wei et al., 2015, AJ, 150, 35. | ||
| 2013 | Di Benedetto, 2013, MNRAS, 430, 546. | 2016 | Veropalumbo et al., 2016, MNRAS, 458, 1909. | ||
| 2013 | Sorce et al., 2013, ApJ, 765, 94. | 2016 | Planck Collaboration et al., 2016, A&A, 594, A13. | ||
| 2013 | Fiorentino et al., 2013, MNRAS, 434, 2866. | 2016 | Ichiki et al., 2016, PhRvD, 93, 023529. | ||
| 2014 | Jang and Lee, 2014, ApJ, 792, 52. | 2017 | Melnick et al., 2017, A&A, 599, A76. | ||
| 2014 | Sorce et al., 2014, MNRAS, 444, 527. | 2017 | Alam et al., 2017, MNRAS, 470, 2617. | ||
| 2015 | Rigault et al., 2015, ApJ, 802, 20. | 2017 | Cao et al., 2017, A&A, 606, A15. | ||
| 2015 | Jang and Lee, 2015, ApJ, 807, 133. | 2017 | Chavanis and Kumar, 2017, JCAP, 2017, 018. | ||
| 2015 | Rigault et al., 2015, ApJ, 802, 20. | 2017 | Wang et al., 2017, ApJ, 849, 84. | ||
| 2016 | Bonvin et al. 2017, MNRAS, 465, 4914. | 2017 | Wang and Meng, 2017, PDU, 18, 30. | ||
| 2016 | Riess et al. 2016, ApJ, 826, 56. | 2017 | Wang et al., 2017, ApJ, 849, 84. | ||
| 2016 | Cardona et al., 2017, JCAP, 2017, 056. | 2017 | Wang and Meng, 2017, PDU, 18, 30. | ||
| 2017 | Wu et al., 2017, Frontiers of Physics, 12, 129801. | 2018 | Vega-Ferrero et al., 2018, ApJL, 853, L31. | ||
| 2017 | Wang and Meng, 2017, SCPMA, 60, 110411. | 2018 | Addison et al., 2018, ApJ, 853, 119. | ||
| 2017 | Chen et al., 2017, ApJ, 835, 86. | 2018 | da Silva and Cavalcanti, 2018, BrJPh, 48, 521. | ||
| 2017 | Huang and Huang, 2017, IJMPD, 26, 1750129. | 2018 | Burenin, 2018, AstL, 44, 653. | ||
| 2017 | Braatz et al., 2018, IAUS, 336, 86. | 2018 | Grillo et al., 2018, ApJ, 860, 94. | ||
| 2017 | Abbott et al., 2017, Nature, 551, 85. | 2018 | Grillo et al., 2018, ApJ, 860, 94. | ||
| 2017 | Jang and Lee, 2017, ApJ, 836, 74. | 2019 | Zeng and Yan, 2019, ApJ, 882, 87. | ||
| 2017 | Zhang et al., 2017, MNRAS, 471, 2254. | 2019 | Domínguez et al., 2019, ApJ, 885, 137. | ||
| 2017 | Wong et al., 2017, MNRAS, 465, 4896. | 2019 | Kozmanyan et al., 2019, A&A, 621, A34. | ||
| 2018 | Fernández Arenas et al., 2018, MNRAS, 474, 1250. | 2019 | Domínguez et al., 2019, ApJ, 885, 137. | ||
| 2018 | Cantiello et al., 2018, ApJL, 854, L31. | 2019 | Cuceu et al., 2019, JCAP, 2019, 044. | ||
| 2018 | Burns et al., 2018, ApJ, 869, 56. | 2019 | Zhang et al., 2019, MNRAS, 483, 1655. | ||
| 2018 | Dhawan et al., 2018, A&A, 609, A72. | 2019 | Zhang and Huang, 2019, CoTPh, 71, 826. | ||
| 2018 | Feeney et al., 2018, MNRAS, 476, 3861. | 2019 | Ryane et al., 2019, MNRAS, 488, 3844. | ||
| 2018 | Burns et al., 2018, ApJ, 869, 56. | 2019 | Birrer et al., 2019, MNRAS, 484, 4726. | ||
| 2018 | Follin and Knox, 2018, MNRAS, 477, 4534. | 2019 | Park and Ratra, 2019, Ap&SS, 364, 134. | ||
| 2018 | Riess et al., 2018, ApJ, 855, 136. | 2019 | Jimenez et al., 2019, JCAP, 2019, 043. | ||
| 2019 | Freedman et al., 2019, ApJ, 882, 34. | 2019 | Li et al., 2019, CoTPh, 71, 421. | ||
| 2019 | Hotokezaka et al., 2019, NatAs, 3, 940. | 2019 | Jimenez et al., 2019, JCAP, 2019, 043. | ||
| 2019 | Reid et al., 2019, ApJL, 886, L27. | 2019 | Taubenberger et al., 2019, A&A, 628, L7. | ||
| 2019 | Liao et al., 2019, ApJL, 886, L23. | 2019 | Taubenberger et al., 2019, A&A, 628, L7. | ||
| 2019 | Yuan et al., 2019, ApJ, 886, 61. | 2019 | Collett et al., 2019, PhRvL, 123, 231102. | ||
| 2019 | Reid et al., 2019, ApJL, 886, L27. | 2019 | Chen et al., 2019, MNRAS, 490, | ||
| 2019 | Riess et al., 2019, ApJ, 876, 85. | 2019 | Jee et al., 2019, Science, 365, 1134. | ||
| 2019 | Fishbach et al., 2019, ApJL, 871, L13. | 2020 | Holanda et al., 2020, JCAP, 2020, 053. | ||
| 2019 | Fishbach et al., 2019, ApJL, 871, L13. | 2020 | Birrer et al., 2020, A&A, 643, A165. | ||
| 2019 | Soares-Santos et al., 2019, ApJL, 876, L7. | 2020 | Planck Collaboration et al., 2020, A&A, 641, A6. | ||
| 2020 | Howlett and Davi, 2020, MNRAS, 492, 3803. | 2020 | Aiola et al., 2020, JCAP, 2020, 047. | ||
| 2020 | Kim et al., 2020, ApJ, 905, 104. | 2020 | Philcox et al., 2020, JCAP, 2020, 032. | ||
| 2020 | Dietrich et al., 2020, Science, 370, 1450. | 2020 | Aiola et al., 2020, JCAP, 2020, 047. | ||
| 2020 | Howlett and Davi, 2020, MNRAS, 492, 3803. | 2020 | Ivanov et al., 2020, JCAP, 2020, 042. | ||
| 2020 | Yang and Gong, 2020, JCAP, 2020, 059. | 2020 | Zhang and Huang, 2020, SCPMA, 63, 290402. | ||
| 2020 | Nicolaou et al., 2020, MNRAS, 495, 90. | 2020 | Wang and Huang, 2020, JCAP, 2020, 045. | ||
| 2020 | Vasylyev and Filippenko, 2020, ApJ, 902, 149. | 2020 | d’Amico et al., 2020, JCAP, 2020, 005. | ||
| 2020 | Freedman et al., 2020, ApJ, 891, 57. | 2020 | Philcox et al., 2020, JCAP, 2020, 032. | ||
| 2020 | Vasylyev and Filippenko, 2020, ApJ, 902, 149. | 2020 | Colas et al., 2020, JCAP, 2020, 001. | ||
| 2020 | Qi and Zhang, 2020, ChPhC, 44, 055101. | 2020 | Nadathur et al., 2020, PhRvL, 124, 221301. | ||
| 2020 | Antipova et al., 2020, AstBu, 75, 93. | 2020 | Cao et al., 2020, MNRAS, 497, 3191. | ||
| 2020 | Wang et al., 2020, NatAs, 4, 517. | 2020 | Pogosian et al., 2020, ApJL, 904, L17. | ||
| 2020 | Dhawan et al., 2020, ApJ, 888, 67. | 2020 | Camarena and Marra, 2020, MNRAS, 495, 2630. | ||
| 2020 | Breuval et al., 2020, A&A, 643, A115. | 2020 | Wang and Huang, 2020, JCAP, 2020, 045. | ||
| 2020 | Liao et al., 2020, ApJL, 895, L29. | 2020 | Rusu et al., 2020, MNRAS, 498, 1440. | ||
| 2020 | Breuval et al., 2020, A&A, 643, A115. | 2020 | Nadathur et al., 2020, PhRvL, 124, 221301. | ||
| 2020 | Huang et al., 2020, ApJ, 889, 5. | 2020 | Baxter and Sherwin, 2021, MNRAS, 501, 1823. | ||
| 2020 | Coughlin et al., 2020, NatCo, 11, 4129. | 2020 | Yang et al., 2020, MNRAS, 497, L56. | ||
| 2020 | Pesce et al., 2020, ApJL, 891, L1. | 2020 | Millon et al., 2020, A&A, 639, A101. | ||
| 2020 | Schombert et al., 2020, AJ, 160, 71. | 2020 | Millon et al., 2020, A&A, 639, A102. | ||
| 2020 | Kourkchi et al., 2020, ApJ, 902, 145. | 2020 | Shajib et al., 2020, MNRAS, 494, 6072. | ||
| 2020 | Camarena and Marra, 2020, PhRvR, 2, 013028. | 2020 | Wei and Melia, 2020, ApJ, 897, 127. | ||
| 2020 | de Jaeger et al., 2020, MNRAS, 496, 3403. | 2020 | Camarena and Marra, 2020, MNRAS, 495, 2630. | ||
| 2020 | Coughlin et al., 2020, PhRvR, 2, 022006. | 2020 | Birrer et al., 2020, A&A, 643, A165. | ||
| 2020 | Coughlin et al., 2020, PhRvR, 2, 022007. | 2020 | Camarena and Marra, 2020, MNRAS, 495, 2630. | ||
| 2020 | Coughlin et al., 2020, PhRvR, 2, 022008. | 2020 | Camarena and Marra, 2020, MNRAS, 495, 2630. | ||
| 2021 | GRAVITY Collaboration et al., 2021, A&A, 654, A85. | 2021 | Philcox et al., 2021, PhRvD, 103, 023538. | ||
| 2021 | Sun W., Jiao K., Zhang T.-J., 2021, ApJ, 915, 123. | 2021 | Philcox et al., 2021, PhRvD, 103, 023538. | ||
| 2021 | Mukherjee et al., 2021, A&A, 646, A65. | 2021 | Wan et al., 2021, MNRAS, 504, 1062. | ||
| 2021 | Baklanov et al., 2021, ApJ, 907, 35. | 2021 | Hall, 2021, MNRAS, 505, 4935. | ||
| 2021 | Gayathri et al., 2021, ApJL, 908, L34. | 2021 | Balkenhol et al., 2021, PhRvD, 104, 083509. | ||
| 2021 | Abbott et al., 2021, ApJ, 909, 218. | 2021 | Zhang X., Huang Q.-G., 2021, PhRvD, 103, 043513. | ||
| 2021 | Wang and Giannios, 2021, ApJ, 908, 200. | 2021 | Alam et al., 2021, PhRvD, 103, 083533. | ||
| 2021 | Freedman, 2021, ApJ, 919, 16. | 2021 | Zhang X., Huang Q.-G., 2021, PhRvD, 103, 043514. | ||
| 2021 | Khetan et al., 2021, A&A, 647, A72. | 2021 | Zhang and Huang, 2021, PhRvD, 103, 043513. | ||
| 2021 | Denzel et al., 2021, MNRAS, 501, 784. | 2021 | Cao et al., 2021, MNRAS, 504, 300. | ||
| 2021 | Soltis et al., 2021, ApJL, 908, L5. | 2021 | Dutcher et al., 2021, PhRvD, 104, 022003. | ||
| 2021 | Riess et al., 2021, ApJL, 908, L6. | 2021 | Ivanov, 2021, PhRvD, 104, 103514. | ||
| 2021 | Blakeslee et al., 2021, ApJ, 911, 65. | 2021 | Cao et al., 2021, MNRAS, 501, 1520. | ||
| 2021 | Bonilla et al., 2021, EPJC, 81, 127. | 2021 | Addison, 2021, ApJL, 912, L1. | ||
| 2022 | Zhang et al., 2022, ApJ, 936, 21. | 2021 | Philcox et al., 2021, PhRvD, 103, 023538. | ||
| 2022 | Mörtsell et al., 2022, ApJ, 935, 58. | 2021 | Addison, 2021, ApJL, 912, L1. | ||
| 2022 | Mörtsell et al., 2022, ApJ, 933, 212. | 2021 | Addison, 2021, ApJL, 912, L1. | ||
| 2022 | Gray et al., 2022, MNRAS, 512, 1127. | 2021 | Qi et al., 2021, MNRAS, 503, 2179. | ||
| 2022 | Benndorf et al., 2022, EPJC, 82, 457. | 2021 | Ivanov, 2021, PhRvD, 104, 103514. | ||
| 2022 | Anand et al., 2022, ApJ, 932, 16. | 2022 | Hagstotz et al., 2022, MNRAS, 511, 662. | ||
| 2022 | Mörtsell et al., 2022, ApJ, 933, 212. | 2022 | Philcox et al., 2022, PhRvD, 106, 063530. | ||
| 2022 | Gallego-Cano et al., 2022, A&A, 666, A13. | 2022 | Philcox et al., 2022, PhRvD, 106, 063530. | ||
| 2022 | Liu et al., 2022, ApJ, 939, 37. | 2022 | Zhang et al, 2022, JCAP, 2022, 036. | ||
| 2022 | Liu et al., 2022, ApJ, 939, 38. | 2022 | Schöneberg et al., 2022, JCAP, 2022, 039. | ||
| 2022 | Kenworthy et al., 2022, ApJ, 935, 83. | 2022 | Wu et al., 2022, MNRAS, 515, L1. | ||
| 2022 | Riess et al., 2022, ApJ, 938, 36. | 2022 | Zhang and Cai, 2022, JCAP, 2022, 031. | ||
| 2022 | Riess et al., 2022, ApJL, 934, L7. | 2022 | Farren et al., 2022, PhRvD, 105, 063503. | ||
| 2022 | Riess et al., 2022, ApJ, 938, 36. | 2022 | Cao and Ratra, 2022, MNRAS, 513, 5686. | ||
| 2022 | Mörtsell et al., 2022, ApJ, 933, 212. | 2022 | Cao et al., 2022, MNRAS, 509, 4745. | ||
| 2022 | Mörtsell et al., 2022, ApJ, 933, 212. | 2022 | James et al., 2022, MNRAS, 516, 4862. | ||
| 2022 | Kourkchi et al., 2022, MNRAS, 511, 6160. | 2022 | Liu et al., 2022, A&A, 668, A51. | ||
| 2022 | Mörtsell et al., 2022, ApJ, 933, 212. | ||||
| 2022 | Dhawan et al., 2022, ApJ, 934, 185. | ||||
-
Note. The asymmetrical error bars are averaged.