WISDOM Project - XVI. The link between circumnuclear molecular gas reservoirs and active galactic nucleus fuelling
Abstract
We use high-resolution data from the millimetre-Wave Interferometric Survey of Dark Object Masses (WISDOM) project to investigate the connection between circumnuclear gas reservoirs and nuclear activity in a sample of nearby galaxies. Our sample spans a wide range of nuclear activity types including radio galaxies, Seyfert galaxies, low-luminosity active galactic nuclei (AGN) and inactive galaxies. We use measurements of nuclear millimetre continuum emission along with other archival tracers of AGN accretion/activity to investigate previous claims that at, circumnuclear scales (<100 pc), these should correlate with the mass of the cold molecular gas. We find that the molecular gas mass does not correlate with any tracer of nuclear activity. This suggests the level of nuclear activity cannot solely be regulated by the amount of cold gas around the supermassive black hole (SMBH). This indicates that AGN fuelling, that drives gas from the large scale galaxy to the nuclear regions, is not a ubiquitous process and may vary between AGN type, with timescale variations likely to be very important. By studying the structure of the central molecular gas reservoirs, we find our galaxies have a range of nuclear molecular gas concentrations. This could indicate that some of our galaxies may have had their circumnuclear regions impacted by AGN feedback, even though they currently have low nuclear activity. On the other hand, the nuclear molecular gas concentrations in our galaxies could instead be set by secular processes.
keywords:
galaxies: ISM - galaxies: active - galaxies: nuclei1 Introduction
It has been established that a supermassive black hole (SMBH) exists at the centre of almost all massive galaxies (). A large number of studies have shown that tight correlations exist between the masses of such SMBHs and the properties of their host galaxies (such as the bulge mass: Magorrian et al., 1998; Marconi & Hunt, 2003, e.g. and velocity dispersion: Ferrarese & Merritt, 2000; Tremaine et al., 2002; Gültekin et al., 2009, e.g.), suggesting a self-regulated co-evolution between them (see e.g. Kormendy & Ho 2013 for a review). There is evidence that active galactic nuclei (AGN) and the associated energetic output can play a crucial role in setting up and maintaining SMBH-host galaxy co-evolution, as it can change the physical conditions of the surrounding interstellar medium (ISM) and/or expel it from the nuclear regions (e.g. Bower et al., 2006; Croton et al., 2006; King & Pounds, 2015; Morganti, 2017; Harrison, 2017). The many details of these processes, however, are still poorly understood.
In the local Universe (z < 0.1), the AGN population can be separated into two main (non-exclusive) groups, differentiated by the mode of dominant energetic output: radiative and kinetic (e.g. Heckman & Best, 2014). In the former the accretion occurs at high rates (% of the Eddington limit) through optically-thick and geometrically-thin discs (Shakura & Sunyaev, 1973). This mode is radiatively efficient, so the dominant energy output is from the conversion of the potential energy of the matter accreted onto each SMBH into electromagnetic radiation. Kinetic-mode AGN instead produce little radiation and channel the bulk of the energy generated from the accretion process into collimated outflows of non-thermal plasma (i.e. radio jets). In these objects the geometrically-thin accretion disc is absent or truncated at some inner radii and likely replaced by geometrically-thick, optically-thin advection-dominated accretion flows (i.e. ADAFs; Narayan & Yi, 1995), whereby the material is accreted onto the SMBH at low rates (% of the Eddington limit).
Nearby radiative-mode AGN with weak or no radio jet emission have historically been called Seyfert galaxies. These objects possess all the characteristics of the “conventional” AGN described in the framework of the standard unified model (e.g. Antonucci, 1993; Urry & Padovani, 1995), and are typically hosted by late Hubble type galaxies (e.g. Martini et al., 2003). AGN producing strong kinetic feedback are instead typically identified as radio galaxies (RGs) and - based on their optical spectra - can be divided into two main classes (e.g. Best & Heckman, 2012): high-excitation radio galaxies (HERGs) and low-excitation radio galaxies (LERGs). The former show strong high-ionisation (Seyfert-like) emission lines in their optical spectra, produce both radiative and kinetic AGN feedback, and are typically hosted by massive () early-type galaxies (ETGs). LERGs show no or weak, LINER (low-ionisation nuclear emission-line region)-like emission lines in their optical spectra, produce almost exclusively kinetic feedback, and are typically found in very massive () ETGs. Understanding the source of SMBH fuelling in the AGN populations introduced above is crucial to putting constraints on the physical processes driving and regulating the SMBH-host galaxy co-evolution. Up to now, however, a general picture for the fuelling of active SMBHs in the local Universe is still missing.
The central regions of Seyfert galaxies have been often observed to be dominated by cold atomic and molecular gas (e.g. Combes et al., 2013; García-Burillo et al., 2014), suggesting a potential connection with their nuclear activities. The finding by Izumi et al. (2016) of a positive correlation between the mass of pc-scale circumnuclear disks (CNDs) of dense molecular gas and the black hole mass accretion rate in nearby Seyferts seems to support this hypothesis. More recently, García-Burillo et al. (2021) also found that nuclear activity in these objects can cause deficits in their circumnuclear molecular gas reservoirs, with a negative trend between nuclear 2-10 keV X-ray luminosity and the central gas concentration. In both cases, however, the studies have been conducted on small samples of about 10 AGN of the same type. These samples also span relatively small ranges of AGN luminosities ( erg s-1) and host galaxy properties (almost exclusively barred spirals). It is therefore currently not clear whether or not the inferred cold gas-nuclear activity connection would hold over a broader population of active galaxies.
On the other hand, a long-established scenario suggests that the HERG/LERG dichotomy may be a consequence of different sources for the accreting gas. In this framework, HERGs are fuelled at relatively high rates by cold gas acquired from merging or collisions with gas-rich galaxies (e.g. Best & Heckman, 2012). LERGs are instead powered by the accretion of hot gas from the intergalactic medium (IGM) through Bondi spherical accretion (Bondi, 1952; Hardcastle et al., 2007). This hypothesis was initially supported by studies finding a correlation between jet power and Bondi accretion rate in LERGs (e.g Allen et al., 2006; Hardcastle et al., 2007; Balmaverde et al., 2008). Over the past decade, however, strong evidence has been acquired that cold gas can also play a role in fuelling LERGs, as large masses of cold gas and dust have been often observed at the centres of these objects (i.e. M⊙; Prandoni et al., 2010; Ocaña Flaquer et al., 2010; North et al., 2019; Ruffa et al., 2019a, b; Ruffa et al., 2020). The total molecular gas mass of a sample of nearby ETGs (most of which are LERG hosts) have also been observed to weakly correlate with the AGN jet power, providing further evidence that there could be a close connection between the two (Babyk et al., 2019). Models for cold gas SMBH fuelling in typical LERG hosts have been also developed and imply that the observed cold gas reservoirs originate from cooling of the hot X-ray emitting surrounding halos, either directly and smoothly (e.g. Negri et al., 2014) or after chaotic cooling (as predicted in chaotic cold accretion models, CCA; King & Pringle, 2007; Wada et al., 2009; Nayakshin et al., 2012; Gaspari et al., 2013, 2015, 2017; King & Nixon, 2015, e.g.). Growing observational evidence provide support to this picture, at least for LERGs located in high-density environments (i.e. in rich groups and clusters). The importance of (chaotic) hot gas cooling in more isolated LERGs is still not clear (e.g. Ruffa et al., 2019b, 2022; Maccagni et al., 2023).
In general, both theoretical studies (e.g. Shlosman et al., 1989) and numerical simulations (e.g. Pizzolato & Soker, 2005, 2010; Wagner et al., 2012; McNamara et al., 2016) have shown that cold gas can play a fundamental role in fuelling nearby AGN (both radiative and kinetic mode), with Ward et al. (2022) finding that AGN are preferentially located in galaxies with high molecular gas fractions. A corresponding comprehensive observational picture, however, is still missing.
The mm-Wave Interferometric Survey of Dark Object Masses (WISDOM) project is exploiting high-resolution CO observations from the Atacama Large Millimeter/submillimeter Array (ALMA) with the primary aim of measuring SMBH masses in a morphologically-diverse sample of nearby galaxies (e.g. Onishi et al., 2017; Davis et al., 2017; Davis et al., 2018; Smith et al., 2019; North et al., 2019; Smith et al., 2021a, b; North et al., 2021; Lelli et al., 2022; Ruffa et al., 2023b). In this paper, we use WISDOM data with a typical spatial resolution of 20–30 pc to look for a connection between the circumnuclear molecular gas reservoirs observed with ALMA and the SMBH fuelling across a sample with a wide range of nuclear activities (from low/high luminosity Seyferts to LERGs). Our main aim is to explore the scenarios described above, testing the cold gas-SMBH fuelling correlations and the scales over which it persists.
2 Observations
2.1 WISDOM sample
WISDOM ALMA data (with a typical resolution of or 30 pc) were originally collected with the intent of measuring SMBH masses. The main selection criterion for WISDOM galaxies was thus to have the SMBH sphere of influence (SOI)111The SOI is the region where the gravitational potential of the SMBH dominates over that of the host galaxy and is defined as (1) where is the mass of the SMBH, is the stellar velocity dispersion of the host bulge and G is the gravitational constant. spatially-resolvable with ALMA. Therefore, our sample of galaxies is fairly heterogeneous, containing both nearly-quenched ETGs and star-forming spirals with a range of nuclear activities. In particular, here we study data of 35 WISDOM objects, spanning stellar masses from to , and 1.4 GHz radio luminosities from to . The sample galaxies and their basic parameters are listed in Table 1. The AGN properties of our sample sources are discussed in detail below, and comparisons of these with other literature samples are presented in Section 4.1.
| Galaxy | Distance | Jet | Galaxy type | AGN type | log() | Mass Ref | log(SFR/) | Project code | Reference |
| (Mpc) | |||||||||
| (1) | (2) | (3) | (4) | (5) | (6) | (7) | (8) | (9) | (10) |
| FRL49 | No | E-S0 | Seyfert 2 | 10.30 | L22 | 0.78 | b | Lelli et al. (2022) | |
| FRL1146 | Yes | Sc | Seyfert 1 | 11.32 | - | a,b | This work | ||
| MRK567 | No | Sc | - | 11.26 | C17 | 1.30 | a,b | Davis et al. (2022) | |
| NGC0383 | Yes | E-S0 | LERG | 11.82 | MASSIVE | 0.00 | c,d,e | North et al. (2019) | |
| NGC0404 | No | E-S0 | LINER | 9.10 | S10 | -3.04 | f | Davis et al. (2020) | |
| NGC0449 | No | SBa | Seyfert 2 | 10.07 | z0MGS | 1.19 | c,d | Davis et al. (2022) | |
| NGC0524 | No | S0-a | - | 11.40 | z0MGS | -0.56 | e,g,h | Smith et al. (2019) | |
| NGC0612 | Yes | S0-a | LINER | 11.76 | 0.85 | b,j | Ruffa et al. (2023b) | ||
| NGC0708 | Yes | E | LERG | 11.75 | MASSIVE | -0.29 | e,h,i | North et al. (2021) | |
| NGC1194 | No | S0-a | Seyfert 2 | 10.64 | z0MGS | -1.74 | j | This work | |
| NGC1387 | No | E-S0 | LINER | 10.67 | z0MGS | -0.68 | d,e | Boyce, in prep | |
| NGC1574 | No | E-S0 | - | 10.79 | z0MGS | -0.91 | c,e | Ruffa et al. (2023b) | |
| NGC2110 | No | E-S0 | - | 10.41 | c,k | This work | |||
| NGC3169 | Yes | Sa | Seyfert 1 | 10.84 | z0MGS | 0.29 | e,i | Davis et al. (2022) | |
| NGC3351 | Yes | Sb | LERG | 10.28 | z0MGS | e,n | This work | ||
| NGC3368 | Yes | Sab | LERG | 10.67 | z0MGS | -0.29 | k | Davis et al. (2022) | |
| NGC3607 | No | E-S0 | - | 11.34 | A3D | -0.54 | e,i | Davis et al. (2022) | |
| NGC3862 | Yes | E | LERG | 11.68 | MASSIVE | a,e,i,l | This work | ||
| NGC4061 | Yes | E | - | 11.54 | MASSIVE | -0.71 | a,e,i,l | Davis et al. (2022) | |
| NGC4261 | Yes | E | LINER | 10.80 | a,l | Ruffa et al. (2023b) | |||
| NGC4429 | No | S0-a | - | 11.17 | A3D | -0.84 | e,n | Davis et al. (2018) | |
| NGC4435 | No | S0 | - | 10.69 | A3D | -0.84 | e,i | Davis et al. (2022) | |
| NGC4438 | No | Sa | LINER | 10.75 | z0MGS | -0.3 | e,i | Davis et al. (2022) | |
| NGC4501 | Yes | Sb | Seyfert 2 | 11.00 | z0MGS | 0.43 | e,g | Davis et al. (2022) | |
| NGC4697 | No | E | - | 11.07 | A3D | -1.08 | i | Davis et al. (2017) | |
| NGC4826 | No | SABa | Seyfert 1 | 10.20 | z0MGS | -0.71 | e,n | Davis et al. (2022) | |
| NGC5064 | No | Sb | - | 10.93 | z0MGS | 0.11 | e,g | Davis et al. (2022) | |
| NGC5765b | No | SABb | Seyfert 2 | 11.21 | 1.43 | j | Davis et al. (2022) | ||
| NGC5806 | Yes | Sb | Seyfert 2 | 10.57 | z0MGS | -0.03 | d,e | Davis et al. (2022) | |
| NGC5995 | No | SABa | Seyfert 2 | 11.41 | - | b | This work | ||
| NGC6753 | No | Sb | - | 10.78 | z0MGS | 0.32 | e,g | Davis et al. (2022) | |
| NGC6958 | No | E | - | 10.76 | z0MGS | -0.58 | e,g | Thater, in prep | |
| NGC7052 | Yes | E | 11.75 | MASSIVE | -0.07 | a,l | Smith et al. (2021a) | ||
| NGC7172 | No | Sa | Seyfert 2 | 10.76 | z0MGS | 0.38 | m | Davis et al. (2022) | |
| PGC043387 | No | E | - | 11.12 | -0.48 | i | This work |
Notes: (1) galaxy name, (2) galaxy distance in Mpc, (3) whether a resolved radio jet is present in radio observations of the galaxy, (4) galaxy morphological type, (5) AGN type or HERG/LERG classification (determined using classification from Figure 2 of Best & Heckman 2012). The radio AGN classification of NGC7052 was taken from Gleisinger et al. (2020). (6) galaxy stellar mass, (7) the reference for the stellar mass: L22 refers Lelli et al. (2022), C17 refers to Cook et al. (2017), S10 refers to Seth et al. (2010), A3D refers to Cappellari et al. (2013), MASSIVE refers to Veale et al. (2017), and z0MGS to Leroy et al. (2019). refers to masses estimated from the galaxies -band magnitude using Equation 2 of Cappellari (2013). (8) the star formation rate of the galaxy. The uncertainties on the star formation rates are 0.2 dex for all sources except NGC0404, NGC1194 and PGC043387 which have uncertainties of 0.22, 0.87 and 0.22 dex respectively. 2 represents galaxies where the star formation rate was estimated in this work. (9) ALMA Project codes of each source, where a: 2016.2.00046.S, b: 2017.1.00904.S, c: 2015.1.00419.S, d: 2016.1.00437.S, e: 2016.2.00053.S, f: 2017.1.00572.S, g: 2015.1.00466.S, h: 2017.1.00391.S, i: 2015.1.00598.S, j: 2016.1.01553.S, k: 2016.1.00839.S, l: 2018.1.00397.S, m: 2019.1.00363.S and n: 2013.1.00493. (10) reference where the ALMA data were initially presented.
2.2 ALMA observations and data reduction
Thirty-two sample objects were observed in 12CO(2-1) and 230 GHz continuum using ALMA Band 6, while three (NGC3351, NGC4429, NGC4826) have Band 7 12CO(3-2) and 345 GHz continuum observations. The ALMA observations used in this work were taken between 2013 and 2020 as part of a large number of projects (see Table 1). For each target we used multiple ALMA observations with multiple array configurations. This enabled us to reach high angular resolution, while ensuring adequate uv-plane coverage and excellent flux recovery. The spectral configuration always consisted of four spectral windows (SPWs), one centred on the redshifted frequency of the line (rest frequency 230.5 GHz for the 2–1 transition, 345.8 GHz for 3–2). The other three SPWs were used to observe the continuum. ALMA data were reduced using the Common Astronomy Software Applications (CASA) pipeline (McMullin et al., 2007) version appropriate for each dataset. A standard calibration strategy was adopted for every observation. A single bright object (typically a quasar) was used as both flux and bandpass calibrator, while a second bright object was used as a phase calibrator. More details on the data reduction process can be found in Davis et al. (2022).
2.2.1 Line imaging
In this work we make use of the CO data cubes presented in Davis et al. (2022), or used the same cleaning methods described therein for consistency. The final cleaned cubes have synthesised beam sizes ranging from 0′′.054 to 0′′.659, corresponding to spatial scales from 0.8 to 291 pc, and noise levels ranging from 0.19 to 3.70 . Since we are interested only in the gas reservoirs on scales pc (i.e. those relevant for the SMBH accretion process), we restrict our analysis to the sub-sample of 29 WISDOM galaxies whose ALMA data cubes satisfy such spatial resolution requirement.
2.3 Ancillary Data
We gathered a variety of ancillary data to assess the level of nuclear activity in our targets and test its connection with the cold gas reservoirs observed with ALMA. For each source, we thus retrieved 2–10 keV X-ray, 1.4 GHz radio continuum and optical [OIII]5007 luminosities from the NASA Extragalactic Database (NED)222https://ned.ipac.caltech.edu/ or other literature sources.
All the ancillary observations used in this work are listed in Table 4. In the following, we briefly describe each set of ancillary data and caveats around their use.
2.3.1 X-ray data
We retrieved the nuclear 2–10 keV X-ray luminosities ( of the majority of our sources from Bi et al. (2020), who presented a catalogue of nearby galaxies observed with Chandra. Ten sample galaxies are not included in this catalogue333FRL49, FRL1146, NGC0449,NGC0524, NGC1194, NGC3351, NGC3368, NGC3862, NGC4429 and NGC4826, thus their X-ray data was gathered from NED and comes from a variety of satellites, i.e. Röntgensatellit (ROSAT), EINSTEIN, Advanced Satellite for Cosmology and Astrophysics (ASCA), XMM-Newton and Chandra (see Table 4). For four (NGC3351, NGC3862, NGC4429 and NGC4826) of these ten galaxies, 2–10 keV luminosities were not available, thus we scaled the available measurement (0.2–2 keV for NGC3351 and NGC4429, 0.3–8 keV for NGC3862 and NGC4826) to the 2–10 keV energy band using a power law with an index (corresponding to the mean reported by Reeves & Turner 2000). Eight sample galaxies do not have any X-ray data available.
Thanks to the exquisite Chandra resolution ( on-axis) and the efforts by the authors to remove as much contamination as possible, the nuclear 2–10 keV luminosities from Bi et al. (2020) are expected to trace only emission from the unresolved AGN core (although some negligible contamination from unresolved nuclear X-ray sources may still occur). In the other ten cases, the spatial resolution of the available X-ray observations does not allow to distinguish between nuclear AGN emission and other types of contribution on larger galaxy scales, thus possible sources of contamination need to be considered. This includes emission from the diffuse hot atmospheres in and around galaxies (i.e. the circumgalactic medium, CGM). This low-surface brightness emission, however, usually requires very deep X-ray observations to be detected, and is typically dominant in the softer (0.3–2 keV) energy range. As such, we expect CGM contamination to be minimal even in low-resolution 2–10 keV X-ray data. A relatively larger contribution from the CGM may still be present in faint X-ray sources and in the four cases in which the 2–10 keV luminosities was extrapolated from lower energy bands.
Stellar X-ray binaries are another potential source of contamination. The K-band luminosity has been demonstrated to correlate with the luminosity of low mass X-ray binaries (LMXB). We thus use the -band flux to estimate the contribution of LMXB to the 2–10 keV emission using the relations from Kim & Fabbiano (2004) and Boroson et al. (2011). We find that in three of the ten galaxies for which Chandra data was not available from Bi et al. (2020) the contributions from LMXBs is minimal (<5%). In the other seven galaxies (NGC0449, NGC0524, NGC3351, NGC3368, NGC3862, NGC4429 and NGC4826) the contribution expected from up to 43%. To estimate the potential contamination from high mass X-ray binaries (HMXB) we used the relation between SFR and X-ray luminosity from Grimm et al. (2003). In this case, we find three galaxies have minimal contributions (<5%), six (NGC0449, NGC0524, NGC3368, NGC3351, NGC4429 and NGC4826) have larger contributions up to 73%, and one (FRL1146) where we do not have information on the SFRs so we could not calculate the contributions from HMXB. We therefore assume that the 2-10 keV luminosity of most of our targets is dominated by AGN emission from the core. In few individual sources, however, it is possible that we slightly overestimate the AGN luminosity due to the aforementioned uncertainties.
2.3.2 Radio data
We used 1.4 GHz radio observations to probe the type of nuclear activity, and the presence of radio jets in our sources. The data used in this work are mostly from the Very Large Array sky surveys, such as the Faint Images of the Radio Sky at Twenty-Centimeters (FIRST; Becker et al., 1994), and the NRAO VLA Sky Survey (NVSS; Condon et al., 1998). The spatial resolution of these surveys is typically very poor (e.g. 45 for the NVSS). While this does not allow us to resolve nuclear radio structures, it does ensures that no radio emission is resolved out and that any associated large-scale radio jet is detected. For the one source (NGC1574) for which 1.4 GHz observations were not available, we scaled the available 5GHz radio data to 1.4 GHz using a power law with a spectral index (for ), as typical for optically-thin radio jet emission (e.g. Komissarov & Gubanov, 1994; Laing & Bridle, 2013).
It is possible that some of the radio emission detected in our targets is contaminated by star formation within the galaxy (e.g. from supernova remnants). To quantify such putative contribution, we gathered the star formation rates (SFRs) of our sample sources from Davis et al. (2022), when available, as before. For the 6 sample galaxies not included in that work, we estimated the SFRs adopting the following relation:
| (2) |
where is the total molecular gas mass withing the galaxy (calculated as described in Section 3.1), and is the depletion time, assumed to be 2 Gyr (e.g Leroy et al., 2008). We then estimated the expected 1.4 GHz radio luminosity due to star formation using the following relation (Murphy et al., 2011):
| (3) |
which can be rearranged to:
| (4) |
where is the observed frequency, is the electron temperature and is the non-thermal spectral index. We assumed K (Murphy et al., 2011) and (Murphy et al., 2011). The relation combines thermal radio emission (calculated from the ionizing photon production rate) and non-thermal radio emission from supernovae, both of which are related directly to the SFR.
From the ratio between the total radio luminosity and that expected from star formation, , we calculate what we call the radio excess factor (). In galaxies with significantly larger than zero, the detected radio emission cannot be explained by star formation, and thus likely arises from nuclear activity. The radio excess factor for each galaxy is tabulated in Table 4.
2.3.3 Optical line data
[O III]5007 is typically the strongest emission line in optical spectra of AGN and arises from gas in the narrow line regions (NLRs) that has been photo-ionised by the AGN radiation. It is then usually considered as a good proxy of the AGN bolometric luminosity (e.g. Heckman & Best, 2014). [O III] has also the advantage to be a more ubiquitous tracer of nuclear activity than the 2-10 keV luminosity, as it is observed in both kinetic- and radiative-mode AGN and does not suffer of any obscuration from the dusty torus (present in typical Seyfert-like objects). We therefore collected [OIII]5007 luminosities from a variety of instruments/surveys, such as the double spectrograph at the Hale Telescope (Ho et al., 1995), El Leoncito Astronomical Complex (CASLEO; Bonatto & Pastoriza, 1997; Rodríguez-Ardila et al., 2000), the DOLORES (Device Optimized for the LOw RESolution) spectrograph at Galileo National Telescope (TNG; Buttiglione et al., 2009), Sloan Digital Sky Survey (SDSS; Zhu et al., 2011), MPG/ESO telescope (Tadhunter et al., 1993), the spectrograph on the Shane Telescope at Lick Observatory (De Robertis & Osterbrock, 1986; Crawford et al., 1999) and the CTIO Telescope (Moustakas et al., 2010). We note that the [OIII]5007 line may be contaminated by star formation or old stars, or be affected by extinction arising within the host galaxy. However, star formation is only expected to contribute significantly in higher-redshift galaxies (whereas it should be negligible in nearby objects such as our sample sources; Suzuki et al., 2016). Where available, we additionally gathered H, [N II]6583 and H luminosities. These are useful to calculate the [OIII]/H and [NII]/H ratios which we can use to construct the BPT diagrams of our objects, and thus asses their dominant excitation mechanism (e.g. Baldwin et al., 1981; Kewley et al., 2006). Eighteen of our sample galaxies have all the lines required to construct a BPT diagram, showing that 5 sources fall in the AGN-dominated region (FRL49, NGC0612,NGC1194,NGC2110, NGC5765b), 4 in the LINER region (NGC3368, NGC3862, NGC5995, NGC6753), 8 in the composite region (NGC1387, NGC3351, NGC4061, NGC4261, NGC4826, NGC5064, NGC7172, PGC043387) and 1 (MRK567) in the SF-dominated region. The log([OIII]/H) ratios for 9 other galaxies (FRL1146, NGC0404, NGC0524, NGC3169, NGC3607, NGC4429, NGC4435, NGC4438, NGC4501) have values ranging from -0.44 to 0.71. Depending on their unknown log([NII]/H) ratios, they could thus be placed in the star formation, composite, LINER regions or AGN regions.
2.3.4 ALMA nuclear continuum emission
We gathered the ALMA nuclear continuum luminosities from Ruffa et al. (2023a), with the mm continuum flux which have been measured from the innermost beam at the position of the AGN in the ALMA continuum map of each galaxy.
2.3.5 Accretion tracer correlations
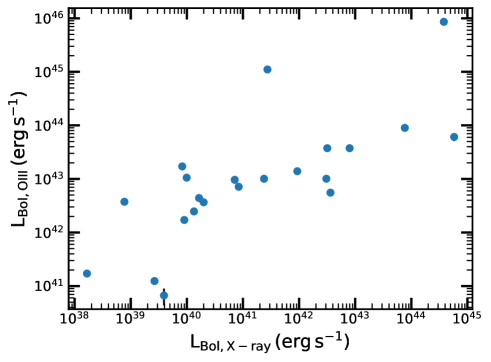
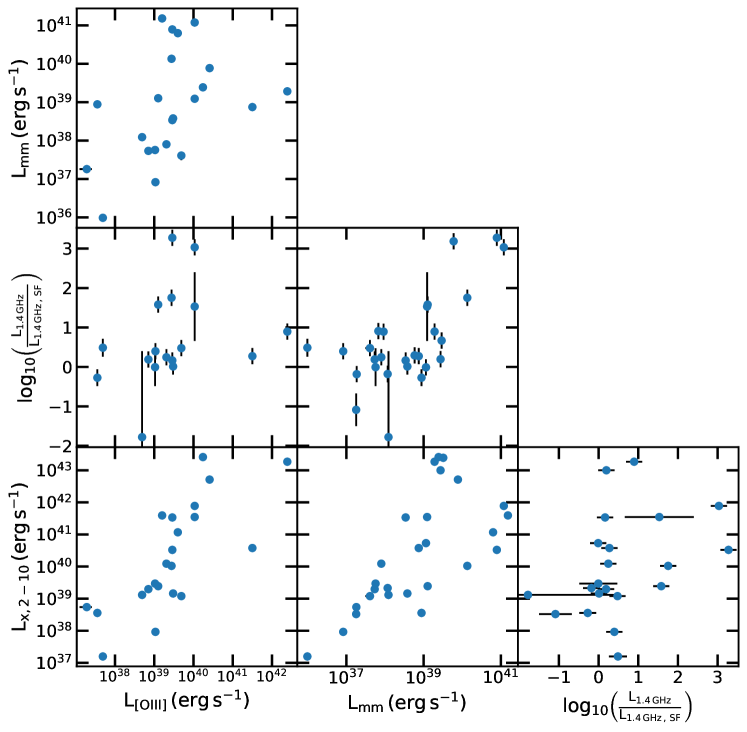
The correlations between the nuclear mm luminosity, X-ray luminosity, [OIII] luminosity and excess radio factor are shown in Figure 1, with the correlation coefficients and p-values listed in Table 3. This figure shows that the four tracers of activity mostly correlate with each other despite different contaminants, suggesting we are tracing nuclear activity rather then larger scale emission. This also shows that, even though some of the galaxies in our sample are not formally classified as AGN, low-level nuclear activity seems to be present.
2.3.6 Stellar masses
The stellar masses of the majority of our sample galaxies were taken from Davis et al. (2022), who in turn collected them from the ATLAS3D (Cappellari et al., 2013) and MASSIVE (Veale et al., 2017) surveys, and the z=0 Multiwavelength Galaxy Synthesis (z0MGS) project (Leroy et al., 2019). The stellar masses for MRK 567 and NGC 0404 were taken from Cook et al. (2017) and Seth et al. (2010), respectively. Where stellar mass measurements were not available in the literature, we estimated them from the -band magnitudes measured in the extended source catalogue of the 2 micron All-Sky Survey (2MASS; Jarrett et al., 2003). We used Equation 2 of Cappellari (2013), with no correction for the emission from the AGN (as this should be small at these frequencies in our low-luminosity sources):
| (5) |
where is the stellar mass and is the -band magnitude.
3 Methodology and derived quantities
In this work we search for correlations between circumnuclear molecular gas reservoirs and SMBH fuelling across a sample of galaxies with a range of nuclear activities. This requires us to assess both the amount of molecular gas present in the circumnuclear regions, and its structure. Furthermore, we need to constrain the SMBH accretion rate in our sources, and the type of nuclear activity. Below we describe the methodology we adopted to determine these quantities.
3.1 Molecular gas masses
We adopt the following relation to estimate the molecular hydrogen gas masses () of our galaxies within different apertures (Bolatto et al., 2013):
| (6) |
where is the mass of the hydrogen atom, is the rest wavelength of the observed molecular transition, is the Boltzmann constant, is the CO-to- conversion factor, is the luminosity distance, is the line intensity ratio (i.e. the ratio between the ground state and the observed CO line brightness temperature), and is the integrated flux density of the CO(1-0) line, with units matching those of . This was estimated by integrating the spectrum of the observed CO transition within a given aperture over all the velocity channels of the line. Equation 6 can be simplified to
| (7) |
where is the upper state rotational quantum number of the observed transition (here is 2 or 3) and =. As most of our galaxies are massive and metal-rich, we assume a Milky Way-like CO-to- conversion factor of (Strong et al., 1988). We also assume the line ratios to be and (see e.g. Leroy et al., 2022). For sample galaxies observed with ALMA at adequate spatial resolutions, we estimated the molecular gas mass within three different elliptical apertures of radii 100, 75, and 50 pc. We additionally measure the molecular gas mass in a elliptical aperture with a radius of 200 pc to measure the nuclear molecular gas concentration. The resulting M are listed in Table 2. As mentioned above, the molecular gas masses were all calculated with a fixed XCO factor. We note, however, that the CO-to- conversion factors in galaxy centres may vary (Sandstrom et al., 2013), adding uncertainty at a 0.3 dex level. To aid comparisons with different XCO prescriptions, we provide the CO integrated flux densities measured within the different apertures in Table 6. We assume an additional 10% error on our molecular gas masses due to ALMA calibration uncertainties.
To assess the structure of the molecular gas at the centre of each sample galaxy, following García-Burillo et al. (2021), we also calculated the molecular concentration parameter:
| (8) |
where and are the molecular gas surface density and mass, respectively, within a elliptical aperture of radius pc. We assumed that the gas lies within a flat disc so =.
| Galaxy | log M | log M | log M | log M | ||||||||
|---|---|---|---|---|---|---|---|---|---|---|---|---|
| (200 pc) | (100 pc) | (75 pc) | (50 pc) | |||||||||
| (dex) | (dex) | (dex) | (dex) | (mJy) | (mJy) | |||||||
| (1) | (2) | (3) | (4) | (5) | (6) | (7) | (8) | (9) | (10) | (11) | ||
| FRL49 | 8.34 | 0.04 | 7.87 | 0.04 | - | - | - | - | 0.93 | 0.038 | ||
| FRL1146 | - | - | - | - | - | - | - | - | 0.47 | 0.0272 | ||
| MRK567 | 8.90 | 0.04 | 8.52 | 0.04 | - | - | - | - | <0.11 | 0.0354 | ||
| NGC0383 | 8.15 | 0.04 | 7.71 | 0.04 | 7.48 | 0.04 | 7.08 | 0.04 | 63 | 0.101 | ||
| NGC0404 | 6.18 | 0.04 | 6.18 | 0.04 | 6.17 | 0.04 | 6.14 | 0.04 | 0.38 | 0.012 | ||
| NGC0449 | - | - | - | - | - | - | - | - | 0.60 | 0.0246 | ||
| NGC0524 | 7.42 | 0.04 | 6.93 | 0.05 | 6.75 | 0.04 | 6.47 | 0.04 | 5.7 | 0.023 | ||
| NGC0612 | 8.20 | 0.04 | 7.62 | 0.04 | 7.50 | 0.04 | 7.35 | 0.05 | 25 | 0.06 | ||
| NGC0708 | 8.12 | 0.04 | 7.66 | 0.04 | 7.47 | 0.04 | 7.13 | 0.05 | 1.3 | 0.0165 | ||
| NGC1194 | 7.48 | 0.04 | 7.13 | 0.04 | 6.95 | 0.05 | - | - | 1.6 | 0.0286 | ||
| NGC1387 | 7.66 | 0.04 | 7.05 | 0.04 | 6.80 | 0.04 | 6.43 | 0.04 | 1.0 | 0.0535 | ||
| NGC1574 | 6.79 | 0.04 | 6.74 | 0.04 | 6.66 | 0.04 | 6.40 | 0.04 | 3.3 | 0.033 | ||
| NGC2110 | 7.35 | 0.04 | 6.77 | 0.04 | - | - | - | - | 21 | 0.453 | ||
| NGC3169 | 8.26 | 0.04 | 7.80 | 0.04 | 7.60 | 0.04 | - | - | 3.4 | 0.107 | ||
| NGC3351 | 7.66 | 0.04 | 7.39 | 0.04 | 7.16 | 0.04 | 6.91 | 0.04 | <0.45 | 0.148 | ||
| NGC3368 | 8.36 | 0.04 | 7.87 | 0.04 | 7.68 | 0.05 | 7.42 | 0.04 | <0.56 | 0.202 | ||
| NGC3607 | 7.89 | 0.04 | 7.51 | 0.04 | 7.33 | 0.04 | - | - | 2.7 | 0.164 | ||
| NGC3862 | - | - | - | - | - | - | - | - | 64 | 1.43 | ||
| NGC4061 | 7.65 | 0.04 | 7.10 | 0.04 | 6.90 | 0.04 | - | - | 2.4 | 0.18 | ||
| NGC4261 | 7.32 | 0.04 | 7.29 | 0.04 | 7.21 | 0.04 | 7.02 | 0.04 | 220 | 1.53 | ||
| NGC4429 | 7.31 | 0.04 | 6.64 | 0.04 | 6.38 | 0.04 | 5.88 | 0.04 | 1.1 | 0.0853 | ||
| NGC4435 | 7.61 | 0.04 | 7.25 | 0.04 | 7.05 | 0.05 | 6.78 | 0.04 | 0.73 | 0.0246 | ||
| NGC4438 | 8.19 | 0.04 | 7.78 | 0.04 | 7.58 | 0.04 | 7.24 | 0.04 | 0.52 | 0.126 | ||
| NGC4501 | 8.06 | 0.04 | 7.72 | 0.04 | 7.52 | 0.05 | 7.22 | 0.04 | 1.4 | 0.0789 | ||
| NGC4697 | 6.02 | 0.04 | 5.93 | 0.04 | 5.83 | 0.04 | 5.61 | 0.04 | 0.48 | 0.0444 | ||
| NGC4826 | 7.66 | 0.04 | 7.55 | 0.04 | 7.25 | 0.04 | 7.60 | 0.04 | 0.38 | 0.0746 | ||
| NGC5064 | 8.13 | 0.04 | 7.67 | 0.04 | 7.41 | 0.04 | 7.10 | 0.04 | 0.28 | 0.0259 | ||
| NGC5765b | 8.41 | 0.04 | - | - | - | - | - | - | 0.328 | 0.0616 | ||
| NGC5806 | 7.57 | 0.04 | 7.16 | 0.04 | 7.02 | 0.04 | 6.77 | 0.05 | <0.14 | 0.0473 | ||
| NGC5995 | - | - | - | - | - | - | - | - | 0.99 | 0.0331 | ||
| NGC6753 | 8.63 | 0.04 | 8.16 | 0.05 | 7.94 | 0.04 | 7.62 | 0.04 | <0.14 | 0.0447 | ||
| NGC6958 | 7.70 | 0.04 | 7.17 | 0.04 | 6.96 | 0.04 | 6.61 | 0.04 | 11 | 0.0569 | ||
| NGC7052 | 7.75 | 0.04 | 7.39 | 0.04 | 7.17 | 0.04 | 6.79 | 0.04 | 18 | 0.0823 | ||
| NGC7172 | 8.36 | 0.04 | 7.48 | 0.04 | 7.14 | 0.04 | 6.74 | 0.04 | 8.4 | 0.32 | ||
| PGC043387 | - | - | - | - | - | - | - | - | <0.31 | 0.104 | ||
Notes: (1) galaxy name. (2) mass measured within a elliptical aperture of 200 pc radius, with its uncertainty in (3). (4)-(9) follow the same pattern, for 100, 75 and 50 pc apertures. (10) nuclear mm continuum flux derived from all our ALMA data (fluxes measured separately from the lower and upper sidebands in Table A), (11) nuclear mm continuum flux uncertainty.
3.2 Accretion rates
To estimate the SMBH accretion rates in each source, we use the following relation (Alexander & Hickox, 2012):
| (9) |
where is the AGN bolometric luminosity and is the mass-energy conversion efficiency factor, typically assumed to be 0.1 (e.g. Marconi et al., 2004).
We follow two prescriptions to estimate the AGN bolometric luminosities. The 2–10 keV X-ray luminosity is generally considered a good proxy of the AGN bolometric luminosity in radiative-mode AGN (e.g. Ho, 2008), as X-ray emission in these sources is expected to come from the corona above the accretion disc. In this case, the bolometric luminosity can be calculated by inverting the bolometric correction relation of Marconi et al. (2004):
| (10) |
where .
In kinetic-mode AGN, the accretion disc is expected to be absent and the 2–10 keV emission may instead arise from inverse Compton up-scattering of non-thermal photons from the radio jet (e.g. Blundell et al., 2006). For this reason, we additionally used the [OIII]5007 luminosity as a proxy of , adopting the bolometric correction (Heckman et al., 2004), to ensure both types of AGN are covered. [OIII]5007 is a more ubiquitous tracer of nuclear activity as it is usually the brightest emission-line in optical spectra of AGN and is less contaminated than other emission lines. As illustrated in Table 1, a clear AGN classification is missing for some of our sample galaxies (13/35), whereas the majority of them consist on a mix of radiative- and kinetic-mode AGN. For each source, we thus calculate using both the 2–10 keV and [OIII]5007 luminosity as tracers. We show the relation between these two derived bolometric luminosities in Figure 9. We note there is reasonably large scatter in the two measures of bolometric luminosity. This is likely due to the mix of radiative- and kinetic-mode objects in our sample, with the X-ray emission not being a good proxy for the bolometric luminosity of the latter (see above).
| Mass–Luminosity Correlations | ||||||
| log ( | log () | log () | ||||
| (1) | (2) | (3) | ||||
| Coefficient | p-value | Coefficient | p-value | Coefficient | p-value | |
| log() | 0.32 | |||||
| log() | 0.31 | |||||
| log() | 0.002 | |||||
| log() | 0.31 | |||||
| log() | 0.27 | |||||
| Luminosity–Luminosity Correlations | ||||||
| Coefficient | p-value | |||||
| (4) | ||||||
| 0.76 | 3.37E-6 | |||||
| 0.57 | 0.008 | |||||
| 0.16 | 0.56 | |||||
| 0.78 | 2.27E-5 | |||||
| 0.15 | 0.60 | |||||
| 0.52 | 0.01 | |||||
Notes: (1) Spearman rank correlation coefficients and -value for the 100 pc radius aperture, (2) and (3) same quantities for the 75 and 50 pc radius apertures. (4) lists the Spearman rank correlation coefficients and -values between the luminosities studied.
4 Results and Analysis
4.1 Properties of WISDOM AGN
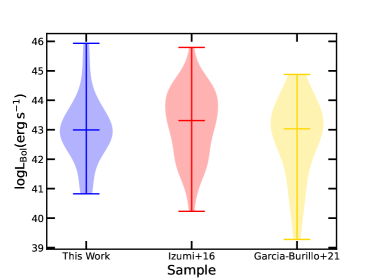
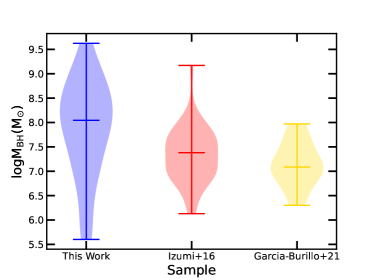
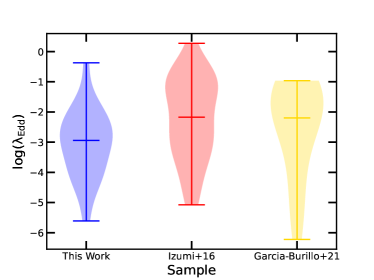
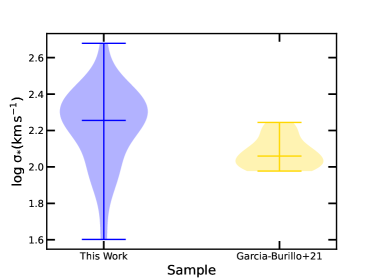
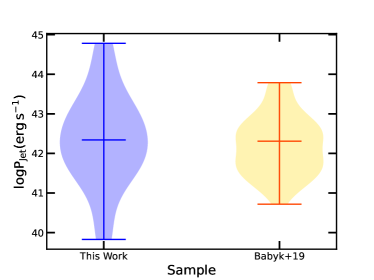
As discussed above, in this work we aim to investigate previous claims that at circumnuclear scales (<100 pc) accretion rate tracers correlate with the mass and structure of the cold molecular gas mass. As illustrated in Table 1, our sample consists on systems with a diverse range of nuclear activities. In order to further place the WISDOM galaxies in context with previous studies, in Figure 2 we illustrate the main properties of the AGN in our sample (i.e. bolometric luminosity, black hole mass, Eddington ratio 444The Eddington ratio is a measure of the level of nuclear activity and is defined as , where is the AGN bolometric luminosity and erg s-1 is the Eddington luminosity. , central velocity dispersion and jet power), compared with those from the works of Izumi et al. (2016), Babyk et al. (2019) and García-Burillo et al. (2021), with the medians for the samples used and the KS test p-values between the sample are shown in Table 7. In this work we calculated the jet power using the same method as Babyk et al. (2019). We calculated the radio power using the relation:
| (11) |
This was then used to calculate the jet power using this relation from Cavagnolo et al. (2010):
| (12) |
It is clear from Figure 2 that the bolometric luminosities of our AGN are consistent with those of the samples studied by Izumi et al. (2016) and García-Burillo et al. (2021), and we probe a range of radio jet powers similar to that of the sources analysed by Babyk et al. (2019). On the other hand, the SMBH masses of the AGN in our sample are larger - on average - than those probed in such previous studies, and thus their Eddington ratios are slightly lower (at least when compared with the work of Izumi et al. 2016).
More generally, Figure 2 shows that there is overlap between the main properties of the AGN in our sample and those in the previous reference studies, with the WISDOM objects being also clearly complementary to such works. In the following, we will further discuss potential differences and if/how these may affect our results.
4.2 AGN luminosity – molecular gas mass correlations
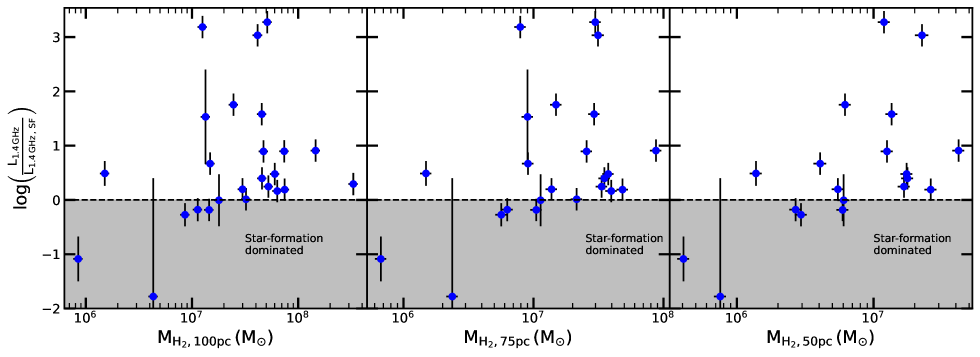
In Figures 3-5 we show the obtained circumnuclear masses plotted against excess 1.4 GHz continuum, 2-10 keV X-ray and nuclear mm-continuum luminosity, respectively. To check for the statistical significance of such relations, we carried out a Spearman rank analysis, where we consider relations with p-values as statistically significant. The resulting Spearman rank coefficients and p-values are presented in Table 3
4.2.1 Excess radio luminosity– molecular mass correlation
We show in Figure 3 the correlation between molecular gas mass on sub-kpc scales and excess radio emission. There is no strong correlation between these quantities, as indicated by Spearman rank analysis (reported in the first row of Table 3). The correlation coefficient is 0.32 for the 100 pc radius aperture, and increases to 0.35 for the 75 pc and 0.56 for the 50 pc radius aperture, with p-values of 0.12, 0.11 and 0.01, respectively. We note that, based on these results, a mild correlation may be present at the 50 pc scale. However, we checked that this is driven by galaxies that are dominated by star formation. When these objects are excluded, the Spearman rank coefficient becomes -0.07, with a p-value of 0.82, thus finding no evidence for any correlation.
4.2.2 X-ray luminosity-molecular gas mass correlation
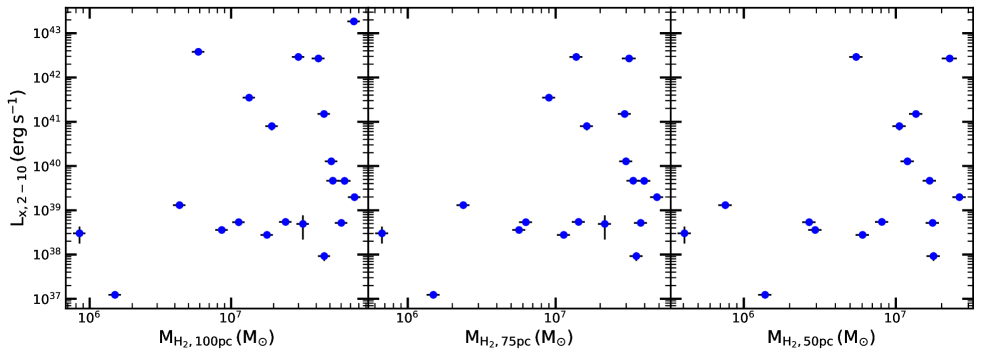
We show in Figure 4 the relation between the molecular gas mass on sub-kiloparsec scales and 2-10 keV X-ray luminosity. Also in this case, there is no significant correlation between the two quantities within any aperture size, as supported by the Spearman rank analysis (reported in the second row of Table 3). The correlation coefficients are 0.31 with a p-value of 0.16 for the case of the molecular gas mass calculated within a 100 pc radius aperture, 0.29 with a p-value of 0.21 for the 75 pc radius aperture, and 0.29 with a p-value of 0.26 for the 50 pc radius aperture.
4.2.3 mm continuum luminosity– molecular gas mass correlation
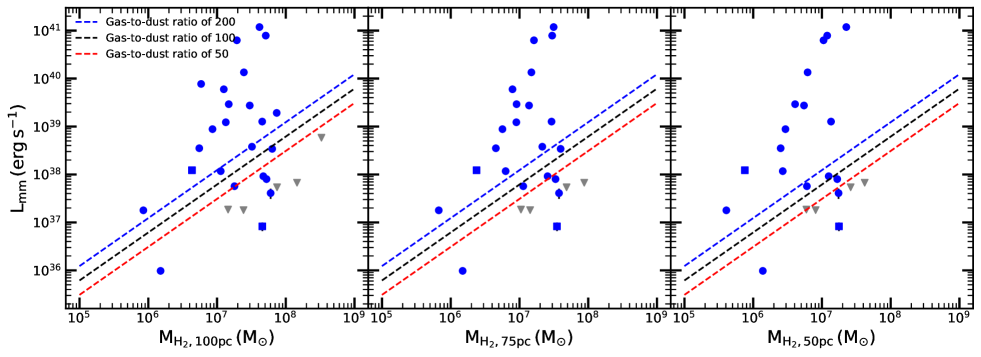
The nuclear millimetre continuum luminosity is another proxy of the nuclear activity. Indeed, excess mm luminosity has been observed in AGN hosting galaxies, with the excess being attributed to the AGN itself (e.g. Behar et al., 2015, 2018; Doi & Inoue, 2016; Wu et al., 2018; Kawamuro et al., 2022). We show in Figure 5 the total nuclear millimetre luminosity (calculated on scales pc) against the molecular gas mass on sub-kiloparsec scales, again finding no correlation between the two. The lack of correlation is supported by the Spearman rank analysis (reported in the third row of Table 3). The correlation coefficients are 0.002, 0.14 and 0.11 with p-values 0.99, 0.55 and 0.66 for the 100 pc, 75 pc and 50 pc regions, respectively.
4.3 Accretion rate–mass correlation
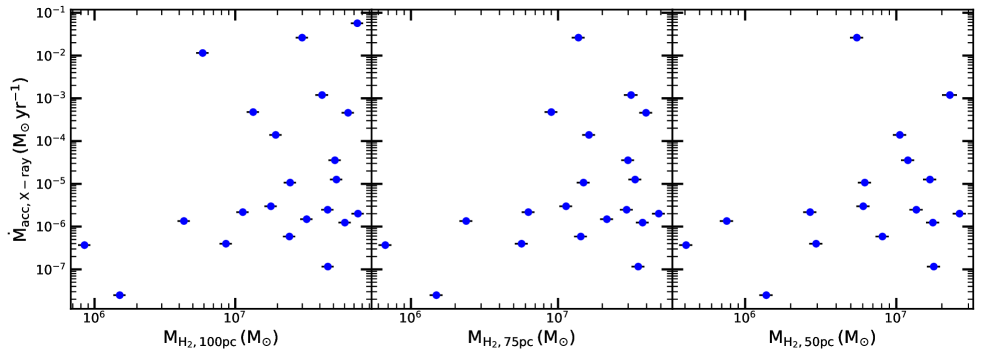
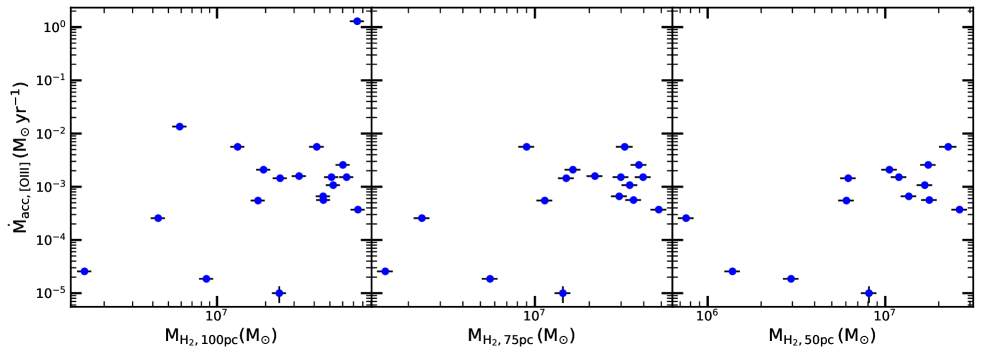
In Figures 6 and 7 we investigate relations between the molecular gas mass and AGN accretion rate, as calculated using the 2-10 keV and [OIII] line luminosity proxies. Also in this case, we do not find any clear correlation. The corresponding Spearman rank analysis (reported in the fourth and fifth rows of Table 3) mostly confirms this scenario.
For accretion rates calculated using the 2-10 keV luminosity as a proxy, a Spearman rank correlation coefficient of 0.31 with a p-value of 0.16 is obtained for the 100 pc radius aperture. For the 75 and 50 pc regions, the Spearman rank coefficients are 0.29 and 0.29, respectively, with associated p-values of 0.21 and 0.26.
For accretion rates calculated using the [OIII] line luminosity as a proxy, the Spearman rank coefficients are 0.27, 0.38 and 0.53 with p-values of 0.26, 0.13 and 0.05 for the 100 pc, 75 pc and 50 pc regions, respectively. These values imply that - as the aperture size decreases - a mildly significant correlation seems to be present. Whether this is real or coincidental due to the reduced number of data points should be investigated further.
5 Discussion
5.1 AGN activity and the circumnuclear molecular gas
As described above, we do not find any strong correlation between the masses of molecular gas in the nuclear regions of our diverse sample galaxies and their AGN activities, as traced in a variety of ways. This is despite multiple authors reporting such correlations when studying specific AGN-selected samples of galaxies (Izumi et al., 2016; Babyk et al., 2019; Koss et al., 2021, e.g). Our galaxies were not selected to be AGN, but do cover similar ranges of AGN properties (see Figure 2).
Our results suggests that the level of nuclear activity in a given galaxy cannot purely depend on the amount of cold gas around its SMBH. This supports recent work by Molina et al. (2023), where no correlation between the CO(2-1) and AGN luminosity has been reported. In this work, Molina et al. (2023) looked at the correlations between the cold molecular gas mass and AGN properties in a sample of radiative-mode AGN at z0.5, using the 5100Å AGN luminosity as analogy for the AGN bolometric luminosity. In this way, they initially find a weak correlation between CO(2-1) and AGN luminosity, but this then disappears when correcting for the cosmic evolution of the molecular gas content in galaxies. This also clearly highlights that the mechanism(s) driving gas from the wider galaxy scales to the nuclear regions are likely to be different in different types of AGN, and that timescale variations may be important. Below we discuss each of our tracers, and the conclusions that can be drawn from the differences between our results and others in literature.
5.1.1 X-ray emission
As described in Sections 4.2.2 and 4.3 (and illustrated in Figures 4 and 6, respectively), there is no correlation between the cold molecular gas masses in the circumnuclear regions and the X-ray luminosities/X-ray derived accretion rates of our sample galaxies. These results are consistent with those found in other recent works. Rosario et al. (2018) looked at the relationship between the 2–10 keV X-ray luminosity and the CO(2-1) brightness in a sample of Seyfert galaxies with X-ray luminosities that fall within the range of those studied in our work ( to ). The authors find no correlation between the two quantities, and ascribe that to the differences between the spatial scale probed by the single dish beam and and that of the SMBH accretion disc. García-Burillo et al. (2021) also studied the correlation between the molecular gas mass on kpc scales (0.4-1.2 kpc) and the X-ray luminosity in a sample of nearby Seyferts with similar ( to ) and molecular gas masses ( to ) to the objects studied in this work, finding again no correlation between the two quantities. In this case, the lack of correlation is explained by the different spatial scales and timescales involved with the last steps of the SMBH fuelling process and the kpc-scales molecular gas reservoirs.
These results are in contrast to Izumi et al. (2016), who reported a positive correlation between the dense () molecular gas mass at pc scales and the X-ray traced accretion rates (calculated using the same methods adopted here) onto the SMBHs of a small sample of 10 nearby Seyfert galaxies. This was interpreted as supporting the role of CNDs in the AGN fuelling process.
Differences between their results and ours may arise for several reasons. Firstly, as also discussed in Rosario et al. (2018) and García-Burillo et al. (2021) it is believed that in radiative-mode AGN X-ray emission traces recently accreted material, as in these cases X-rays are expected to be produced very close to the central SMBH (e.g. Galeev et al., 1979). In this scenario, X-ray emission can be highly time-variable. However, it would take dynamical timescales of several hundred thousand years for the gas at the scales we are investigating to fall onto the SMBHs. This difference in timescales and spatial scales could explain why we do not find correlation between the circumnuclear gas mass and the X-ray luminosity.
Izumi et al. (2016) also investigated the correlation between dense molecular gas mass of the CND and accretion rate only in ten Seyfert galaxies, whereas we consider a times larger sample of galaxies with a varied range of nuclear activities (see Figure 2) and AGN types (see Table 1). However, even when considering only the Seyferts in our sample, our results remain unchanged.
Furthermore, the correlation reported by Izumi et al. (2016) involves the dense () molecular gas mass of the CNDs, estimated using the HCN molecule as tracer. Here we instead use the total molecular gas mass on circumnuclear scales, which has been estimated via CO emission. However, we still cannot make the Seyfert galaxies in our sample follow the correlation of Izumi et al. (2016) without requiring extremely low dense-gas fractions that also vary wildly between galaxies, a behaviour currently not observed in these kind of objects (e.g. Jiménez-Donaire et al., 2019).
We also note that the lack of correlation may be also ascribed to contamination from other (unresolved) sources of X-ray luminosity in the galaxies, such as stellar X-ray binaries (see Section 2.3.1). However, even when restricting our analysis only to sources observed at high spatial resolution with Chandra (i.e. where the nuclear emission from the AGN can be spatially isolated), we still do not observe any correlation. This suggests that contamination is not driving our results.
Another more speculative possibility that could explain the lack of correlation is that different mechanisms usually give rise to the observed X-ray emission in different AGN types. In radiative-mode AGN such as Seyferts, X-rays are typically produced by inverse Compton up-scattering of photons from the accretion disc by the corona (Ciotti & Ostriker, 1997). Whilst, in kinetic-mode AGN, classic accretion discs are either not present or truncated at inner radii (see Section 1), and X-ray emission likely arises from other processes, such as Compton up-scattering of non-thermal photons from the radio jets (e.g. Blundell et al., 2006). These two emission processes may not correlate directly or may differ in how they correlate with the cold molecular gas mass of the circumnuclear regions.
Finally another more speculative possibility is that the Seyfert galaxies observed by Izumi et al. (2016) may have been caught in a special phase with bright HCN emission, possibly suggesting a bias in the sample selection. Such bright HCN emission may be more common in Seyferts with sizeable dense molecular gas reservoirs, leading also to higher accretion rates than most of those probed by our sample. Further investigation of diverse galaxy samples in central regions pc in radius and using denser gas tracers will allow us to confirm/discard this hypothesis.
5.1.2 Radio emission
Babyk et al. (2019) reported a correlation between the molecular gas mass up to kpc scales and jet power in a sample of nearby ETGs, most of which are LERGs. We wanted to expand this study probing the gas mass down to circumnuclear scales and in a more diverse sample of galaxies. If the results reported by Babyk et al. (2019) held at circumnuclear scales, we would have expected to observe at least some correlation between the circumnuclear gas masses of our sample galaxies and the excess 1.4 GHz radio luminosities (as ; e.g. Cavagnolo et al. 2010). As discussed in Section 4.2.1 and illustrated in Figure 3, we do not find any sign of such correlation in this work. This could be explained if the correlation reported by Babyk et al. (2019) does not have anything to do with the SMBH fuelling, but instead arise because more massive galaxies tend to have more massive SMBHs, thus producing higher-power radio jets (Liu et al., 2006). Babyk et al. (2019) also report a link between the hot X-ray-emitting diffuse gas and the molecular gas content in their sample galaxies. This correlation is explained by the cooling of hot gas which is turned into molecular gas in the galaxy. This cooling of hot gas may then be connected to the radio power in these galaxies and would explain why we do not find a correlation at circumnuclear scales. We note that a result similar to that of Babyk et al. (2019) has been recently reported by Fujita et al. (2023a) and Fujita et al. (2023b), who studied the correlation between the jet power estimated from X-ray cavities () and the molecular gas mass within 500 pc in a sample of massive elliptical galaxies. This difference is results could be explained by the sample studied by these two works. In these works they study 9 and 13 objects respectively which is significantly smaller then the 35 objects used in our work. They also look for correlations exclusively in elliptical galaxies compared to diverse range of galaxies and activities types study in our work.
Overall, the lack of correlation between the circumnuclear molecular gas mass and radio emission in our sample may suggest that jets are not directly powered by accretion from circumnuclear gas reservoirs, or that such correlation only exists over very long timescales. As discussed above, the dynamical times at the spatial scales probed here are still long compared to most AGN lifetime estimates. While radio jets can extend on large scales (and thus allow us to average AGN activity over longer timescales than direct tracers such as X-ray emission), this timescale mismatch may be too large to lead to any strong correlation.
5.1.3 Optical line emission
As described in Section 2.3.3, we estimated the accretion rate in our sources using also the [OIII] line emission as a tracer, finding again no correlation with the molecular gas mass in the circumnuclear regions (see Section 4.3 and Figure 7). One could ascribe this lack of correlation to contamination from other sources of [OIII] emission on larger scales (e.g. [OIII] can also be a tracer of star-forming regions). This kind of contamination, however, has been found to be relevant only in higher redshift galaxies (e.g. Suzuki et al., 2016), and should therefore be minimal in nearby galaxies like our sample sources.
This result provides support to the hypotheses formulated above that either the level of nuclear activity in a given galaxy does not exclusively depend on the amount of cold gas around the central SMBH, or temporal variations in the accretion rate wash out any correlation. These results also support the idea that AGN fuelling mechanisms are not ubiquitous and different processes may be at play in different AGN types.
5.2 Nuclear activity and structure of the molecular gas reservoir
For a sample of nearby Seyfert galaxies, García-Burillo et al. (2021) reported that AGN luminosity (traced by 2-10 keV X-ray emission) correlates strongly with the structure of the molecular ISM (traced by CO) in the central 200 pc. This could be due to AGN feedback impacting the cold molecular gas reservoirs at these scales, and driving the molecular gas away from (and/or heating/destroying it in) the centres of the galaxies.
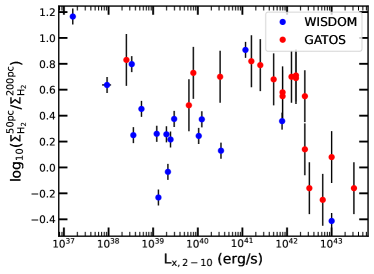
As discussed in - e.g. - Davis et al. (2018), some of the WISDOM sample galaxies have central molecular gas holes, and so it is possible the same mechanism is occurring here. We test this in Figure 8, where we plot the 2–10 keV X-ray luminosity against molecular gas concentration (as defined in Section 2) for both our sample and that of García-Burillo et al. (2021). Our galaxies span a range of X-ray luminosities and molecular gas concentrations similar to those of García-Burillo et al. (2021), but do not seem to follow the same correlation.
The lack of any correlation in our galaxy sample, which spans a wide range of AGN types and () and does include a significant number of Seyferts (albeit not selected to be especially active), suggests two possibilities:
-
1.
The central structure of the molecular gas in galaxies is set by secular (non AGN-driven) process(es). The correlation of García-Burillo et al. (2021) could then arise if these processes correlate with the SMBH mass (or another variable SMBH mass correlates with, such as spheroid mass/velocity dispersion), and thus the maximum AGN power possible. Some putative processes that could cause nuclear holes in the cold gas distributions (such as shear; see Davis et al. 2018) could naturally follow such a scaling.
-
2.
The central structure of the molecular gas in our galaxies has been impacted by AGN feedback, but the black hole is now in a phase of lower activity. If this was the case, a galaxy would be expected to obey the García-Burillo et al. (2021) correlation until its AGN episode dies off, then decrease in X-ray luminosity while presenting its feedback-affected molecular gas structure for some time, before further inflows reset the cycle.
Comparing the WISDOM sample to the galaxies studied in García-Burillo et al. (2021), it seems that secular processes are the more likely scenario. Our sample contains more early-type hosts, but other galaxy and AGN properties are similar. It is unclear why the SMBH and its energy output (set on sub-parsec scales) would care about the large-scale galaxy properties, thus implying that the central molecular gas concentration is set by secular processes rather than by the nuclear activity. On the other hand, the parameter space explored in García-Burillo et al. (2021) could represent the turnover point between secular processes and AGN feedback, with the turnover happening at X-ray luminosities around erg s-1. Our points would then fit this model with the sample AGN with X-ray luminosities lower than erg s-1 and a range of molecular gas concentrations set by secular processes. The few galaxies in our sample with X-ray luminosities higher than erg s-1 instead follow the relation found in García-Burillo et al. (2021). Determining which of these possibilities is at work in our sample galaxies is interesting, but will require further observations and simulations of molecular gas at the centres of active galaxies of all luminosities. This will be explored further in future works.
6 Conclusions
We have searched for correlations between the cold molecular gas masses on the circumnuclear regions of a sample of 35 nearby galaxies and AGN activity tracers at radio, X-ray, optical and sub-mm wavelengths. We find that the molecular gas masses of our sample sources, measured within a range of elliptical apertures with radii from 50 to 100 pc, do not correlate with any of the adopted tracers.
The sample analysed in this study includes galaxies with a range of nuclear activities and global properties, and we are unable to reproduce any of the results found for other AGN-specific sub-samples. This suggests the level of nuclear activity in a given galaxy cannot purely be due the amount of cold gas fuel reservoir around the central SMBH. The fuelling mechanism of active galaxies is not ubiquitous and may vary between AGN types, and timescale variations are likely very important.
We also probed the molecular concentration of the circumnuclear gas discs in our sample galaxies to assess whether they had been impacted by AGN feedback. There is no evidence of a relation between structure on circumnuclear scales and current accretion rate, in contrast to results found for some nearby Seyfert galaxies selected to be in an active phase and despite our objects spanning the same range in circumnuclear properties. This could indicate that these galaxies were previously in a more active phase that impacted the circumnuclear gas, or that these molecular concentrations arise naturally within circumnuclear gas discs and are not related to AGN processes.
Further observations and theoretical studies are clearly needed to make further progress to determine the link between circumnuclear gas reservoirs and nuclear activity. For instance, dense gas may be better linked to the direct reservoirs for accretion, and expanded sample sizes may help to overcome timescale issues.
Acknowledgements
This work is supported by the UKRI AIMLAC CDT, funded by grant EP/S023992/1. TAD and IR acknowledges support from STFC grant ST/S00033X/1. MB was supported by STFC consolidated grant "Astrophysics at Oxford" ST/H002456/1 and ST/K00106X/1. TGW acknowledges funding from the European Research Council (ERC) under the European Union’s Horizon 2020 research and innovation programme (grant agreement No. 694343). JG gratefully acknowledges financial support from the Swiss National Science Foundation (grant no CRSII5_193826).
This research made use of ASTROPY 555http://www.astropy.org/, a community-developed PYTHON package for Astronomy (Astropy Collaboration et al., 2013, 2018), MATPLOTLIB 666https://matplotlib.org/, an open source visualisation package (Hunter, 2007), NUMPY 777https://numpy.org/, an open source numerical computation library (Harris et al., 2020) and PANDAS888https://pandas.pydata.org/, a data manipulation software library (Wes McKinney, 2010; pandas development team, 2022).
This paper makes use of ALMA data. ALMA is a partnership of the ESO (representing its member states), NSF (USA), and NINS (Japan), together with the NRC (Canada), NSC, ASIAA (Taiwan), and KASI (Republic of Korea), in cooperation with the Republic of Chile. The Joint ALMA Observatory is operated by the ESO, AUI/NRAO, and NAOJ.
This paper has also made use of the NASA/IPAC Extragalactic Database (NED) which is operated by the Jet Propulsion Laboratory, California Institute of Technology under contract with NASA.
Data Availability
The data underlying this article are available in the ALMA archive, at http://almascience.eso.org/aq/. Archival data are available from the NASA/IPAC Extragalactic Database (NED), at https://ned.ipac.caltech.edu/ and Dustpedia, at http://dustpedia.astro.noa.gr/. The data used and the final plots will be shared upon a reasonable request to the first author.
References
- Alexander & Hickox (2012) Alexander D. M., Hickox R. C., 2012, New Astron. Rev., 56, 93
- Allen et al. (2006) Allen S. W., Dunn R. J. H., Fabian A. C., Taylor G. B., Reynolds C. S., 2006, MNRAS, 372, 21
- Antonucci (1993) Antonucci R., 1993, ARA&A, 31, 473
- Astropy Collaboration et al. (2013) Astropy Collaboration et al., 2013, A&A, 558, A33
- Astropy Collaboration et al. (2018) Astropy Collaboration et al., 2018, AJ, 156, 123
- Babyk et al. (2019) Babyk I. V., McNamara B. R., Tamhane P. D., Nulsen P. E. J., Russell H. R., Edge A. C., 2019, ApJ, 887, 149
- Baldwin et al. (1981) Baldwin J. A., Phillips M. M., Terlevich R., 1981, PASP, 93, 5
- Balmaverde et al. (2008) Balmaverde B., Baldi R. D., Capetti A., 2008, A&A, 486, 119
- Becker et al. (1994) Becker R. H., White R. L., Helfand D. J., 1994, in Crabtree D. R., Hanisch R. J., Barnes J., eds, Astronomical Society of the Pacific Conference Series Vol. 61, Astronomical Data Analysis Software and Systems III. p. 165
- Behar et al. (2015) Behar E., Baldi R. D., Laor A., Horesh A., Stevens J., Tzioumis T., 2015, MNRAS, 451, 517
- Behar et al. (2018) Behar E., Vogel S., Baldi R. D., Smith K. L., Mushotzky R. F., 2018, MNRAS, 478, 399
- Best & Heckman (2012) Best P. N., Heckman T. M., 2012, MNRAS, 421, 1569
- Bi et al. (2020) Bi S., Feng H., Ho L. C., 2020, ApJ, 900, 124
- Blundell et al. (2006) Blundell K. M., Fabian A. C., Crawford C. S., Erlund M. C., Celotti A., 2006, ApJ, 644, L13
- Bolatto et al. (2013) Bolatto A. D., Wolfire M., Leroy A. K., 2013, ARA&A, 51, 207
- Bonatto & Pastoriza (1997) Bonatto C. J., Pastoriza M. G., 1997, ApJ, 486, 132
- Bondi (1952) Bondi H., 1952, MNRAS, 112, 195
- Boroson et al. (2011) Boroson B., Kim D.-W., Fabbiano G., 2011, ApJ, 729, 12
- Bower et al. (2006) Bower R. G., Benson A. J., Malbon R., Helly J. C., Frenk C. S., Baugh C. M., Cole S., Lacey C. G., 2006, MNRAS, 370, 645
- Buttiglione et al. (2009) Buttiglione S., Capetti A., Celotti A., Axon D. J., Chiaberge M., Macchetto F. D., Sparks W. B., 2009, A&A, 495, 1033
- Cappellari (2013) Cappellari M., 2013, ApJ, 778, L2
- Cappellari et al. (2013) Cappellari M., et al., 2013, MNRAS, 432, 1862
- Cavagnolo et al. (2010) Cavagnolo K. W., McNamara B. R., Nulsen P. E. J., Carilli C. L., Jones C., Bîrzan L., 2010, ApJ, 720, 1066
- Ciotti & Ostriker (1997) Ciotti L., Ostriker J. P., 1997, ApJ, 487, L105
- Combes et al. (2013) Combes F., et al., 2013, A&A, 558, A124
- Condon et al. (1998) Condon J. J., Cotton W. D., Greisen E. W., Yin Q. F., Perley R. A., Taylor G. B., Broderick J. J., 1998, AJ, 115, 1693
- Cook et al. (2017) Cook D. O., van Sistine A., Singer L., Kasliwal M. M., Kaplan D., Iptf Collaboration Growth Collaboration 2017, GRB Coordinates Network, 21707, 1
- Crawford et al. (1999) Crawford C. S., Allen S. W., Ebeling H., Edge A. C., Fabian A. C., 1999, MNRAS, 306, 857
- Croton et al. (2006) Croton D. J., et al., 2006, MNRAS, 365, 11
- Davis et al. (2017) Davis T. A., Bureau M., Onishi K., Cappellari M., Iguchi S., Sarzi M., 2017, MNRAS, 468, 4675
- Davis et al. (2018) Davis T. A., et al., 2018, MNRAS, 473, 3818
- Davis et al. (2020) Davis T. A., et al., 2020, MNRAS, 496, 4061
- Davis et al. (2022) Davis T. A., et al., 2022, MNRAS, 512, 1522
- De Robertis & Osterbrock (1986) De Robertis M. M., Osterbrock D. E., 1986, ApJ, 301, 727
- Doi & Inoue (2016) Doi A., Inoue Y., 2016, PASJ, 68, 56
- Ferrarese & Merritt (2000) Ferrarese L., Merritt D., 2000, ApJ, 539, L9
- Fujita et al. (2023a) Fujita Y., Izumi T., Kawakatu N., Nagai H., Hirasawa R., Ikeda Y., 2023a, arXiv e-prints, p. arXiv:2303.16927
- Fujita et al. (2023b) Fujita Y., Izumi T., Nagai H., Kawakatu N., Kawanaka N., 2023b, arXiv e-prints, p. arXiv:2310.03794
- Galeev et al. (1979) Galeev A. A., Rosner R., Vaiana G. S., 1979, ApJ, 229, 318
- García-Burillo et al. (2014) García-Burillo S., et al., 2014, A&A, 567, A125
- García-Burillo et al. (2021) García-Burillo S., et al., 2021, A&A, 652, A98
- Gaspari et al. (2013) Gaspari M., Ruszkowski M., Oh S. P., 2013, MNRAS, 432, 3401
- Gaspari et al. (2015) Gaspari M., Brighenti F., Temi P., 2015, A&A, 579, A62
- Gaspari et al. (2017) Gaspari M., Temi P., Brighenti F., 2017, MNRAS, 466, 677
- Gleisinger et al. (2020) Gleisinger R. C., O’Dea C. P., Gallimore J. F., Wykes S., Baum S. A., 2020, ApJ, 905, 42
- Grimm et al. (2003) Grimm H. J., Gilfanov M., Sunyaev R., 2003, MNRAS, 339, 793
- Gültekin et al. (2009) Gültekin K., et al., 2009, ApJ, 698, 198
- Hardcastle et al. (2007) Hardcastle M. J., Evans D. A., Croston J. H., 2007, MNRAS, 376, 1849
- Harris et al. (2020) Harris C. R., et al., 2020, Nature, 585, 357
- Harrison (2017) Harrison C. M., 2017, Nature Astronomy, 1, 0165
- Heckman & Best (2014) Heckman T. M., Best P. N., 2014, ARA&A, 52, 589
- Heckman et al. (2004) Heckman T. M., Kauffmann G., Brinchmann J., Charlot S., Tremonti C., White S. D. M., 2004, ApJ, 613, 109
- Ho (2008) Ho L. C., 2008, ARA&A, 46, 475
- Ho et al. (1995) Ho L. C., Filippenko A. V., Sargent W. L., 1995, ApJS, 98, 477
- Hunter (2007) Hunter J. D., 2007, Computing in Science and Engineering, 9, 90
- Izumi et al. (2016) Izumi T., Kawakatu N., Kohno K., 2016, ApJ, 827, 81
- Jarrett et al. (2003) Jarrett T. H., Chester T., Cutri R., Schneider S. E., Huchra J. P., 2003, AJ, 125, 525
- Jiménez-Donaire et al. (2019) Jiménez-Donaire M. J., et al., 2019, ApJ, 880, 127
- Kawamuro et al. (2022) Kawamuro T., et al., 2022, arXiv e-prints, p. arXiv:2208.03880
- Kewley et al. (2006) Kewley L. J., Groves B., Kauffmann G., Heckman T., 2006, MNRAS, 372, 961
- Kim & Fabbiano (2004) Kim D.-W., Fabbiano G., 2004, ApJ, 611, 846
- King & Nixon (2015) King A., Nixon C., 2015, MNRAS, 453, L46
- King & Pounds (2015) King A., Pounds K., 2015, ARA&A, 53, 115
- King & Pringle (2007) King A. R., Pringle J. E., 2007, MNRAS, 377, L25
- Komissarov & Gubanov (1994) Komissarov S. S., Gubanov A. G., 1994, A&A, 285, 27
- Kormendy & Ho (2013) Kormendy J., Ho L. C., 2013, ARA&A, 51, 511
- Koss et al. (2021) Koss M. J., et al., 2021, ApJS, 252, 29
- Laing & Bridle (2013) Laing R. A., Bridle A. H., 2013, MNRAS, 432, 1114
- Lelli et al. (2022) Lelli F., Davis T. A., Bureau M., Cappellari M., Liu L., Ruffa I., Smith M. D., Williams T. G., 2022, MNRAS, 516, 4066
- Leroy et al. (2008) Leroy A. K., Walter F., Brinks E., Bigiel F., de Blok W. J. G., Madore B., Thornley M. D., 2008, AJ, 136, 2782
- Leroy et al. (2019) Leroy A. K., et al., 2019, ApJS, 244, 24
- Leroy et al. (2022) Leroy A. K., et al., 2022, ApJ, 927, 149
- Liu et al. (2006) Liu Y., Jiang D. R., Gu M. F., 2006, ApJ, 637, 669
- Maccagni et al. (2023) Maccagni F. M., et al., 2023, A&A, 675, A59
- Magorrian et al. (1998) Magorrian J., et al., 1998, AJ, 115, 2285
- Marconi & Hunt (2003) Marconi A., Hunt L. K., 2003, ApJ, 589, L21
- Marconi et al. (2004) Marconi A., Risaliti G., Gilli R., Hunt L. K., Maiolino R., Salvati M., 2004, MNRAS, 351, 169
- Martini et al. (2003) Martini P., Regan M. W., Mulchaey J. S., Pogge R. W., 2003, ApJ, 589, 774
- McMullin et al. (2007) McMullin J. P., Waters B., Schiebel D., Young W., Golap K., 2007, in Shaw R. A., Hill F., Bell D. J., eds, Astronomical Society of the Pacific Conference Series Vol. 376, Astronomical Data Analysis Software and Systems XVI. p. 127
- McNamara et al. (2016) McNamara B. R., Russell H. R., Nulsen P. E. J., Hogan M. T., Fabian A. C., Pulido F., Edge A. C., 2016, ApJ, 830, 79
- Molina et al. (2023) Molina J., Shangguan J., Wang R., Ho L. C., Bauer F. E., Treister E., 2023, arXiv e-prints, p. arXiv:2304.01017
- Morganti (2017) Morganti R., 2017, Frontiers in Astronomy and Space Sciences, 4, 42
- Moustakas et al. (2010) Moustakas J., Kennicutt Robert C. J., Tremonti C. A., Dale D. A., Smith J.-D. T., Calzetti D., 2010, ApJS, 190, 233
- Murphy et al. (2011) Murphy E. J., et al., 2011, ApJ, 737, 67
- Narayan & Yi (1995) Narayan R., Yi I., 1995, ApJ, 452, 710
- Nayakshin et al. (2012) Nayakshin S., Power C., King A. R., 2012, ApJ, 753, 15
- Negri et al. (2014) Negri A., Posacki S., Pellegrini S., Ciotti L., 2014, MNRAS, 445, 1351
- North et al. (2019) North E. V., et al., 2019, MNRAS, 490, 319
- North et al. (2021) North E. V., et al., 2021, MNRAS, 503, 5179
- Ocaña Flaquer et al. (2010) Ocaña Flaquer B., Leon S., Combes F., Lim J., 2010, A&A, 518, A9
- Onishi et al. (2017) Onishi K., Iguchi S., Davis T. A., Bureau M., Cappellari M., Sarzi M., Blitz L., 2017, MNRAS, 468, 4663
- Pizzolato & Soker (2005) Pizzolato F., Soker N., 2005, ApJ, 632, 821
- Pizzolato & Soker (2010) Pizzolato F., Soker N., 2010, MNRAS, 408, 961
- Prandoni et al. (2010) Prandoni I., Laing R. A., de Ruiter H. R., Parma P., 2010, A&A, 523, A38
- Reeves & Turner (2000) Reeves J. N., Turner M. J. L., 2000, MNRAS, 316, 234
- Rodríguez-Ardila et al. (2000) Rodríguez-Ardila A., Pastoriza M. G., Donzelli C. J., 2000, ApJS, 126, 63
- Rosario et al. (2018) Rosario D. J., et al., 2018, MNRAS, 473, 5658
- Ruffa et al. (2019a) Ruffa I., et al., 2019a, MNRAS, 484, 4239
- Ruffa et al. (2019b) Ruffa I., et al., 2019b, MNRAS, 489, 3739
- Ruffa et al. (2020) Ruffa I., Laing R. A., Prandoni I., Paladino R., Parma P., Davis T. A., Bureau M., 2020, MNRAS, 499, 5719
- Ruffa et al. (2022) Ruffa I., Prandoni I., Davis T. A., Laing R. A., Paladino R., Casasola V., Parma P., Bureau M., 2022, MNRAS, 510, 4485
- Ruffa et al. (2023a) Ruffa I., et al., 2023a, arXiv e-prints, p. arXiv:2307.13872
- Ruffa et al. (2023b) Ruffa I., et al., 2023b, MNRAS, 522, 6170
- Sandstrom et al. (2013) Sandstrom K. M., et al., 2013, ApJ, 777, 5
- Seth et al. (2010) Seth A. C., et al., 2010, ApJ, 714, 713
- Shakura & Sunyaev (1973) Shakura N. I., Sunyaev R. A., 1973, A&A, 24, 337
- Shlosman et al. (1989) Shlosman I., Frank J., Begelman M. C., 1989, Nature, 338, 45
- Smith et al. (2019) Smith M. D., et al., 2019, MNRAS, 485, 4359
- Smith et al. (2021a) Smith M. D., et al., 2021a, MNRAS, 500, 1933
- Smith et al. (2021b) Smith M. D., et al., 2021b, MNRAS, 503, 5984
- Strong et al. (1988) Strong A. W., et al., 1988, A&A, 207, 1
- Suzuki et al. (2016) Suzuki T. L., et al., 2016, MNRAS, 462, 181
- Tadhunter et al. (1993) Tadhunter C. N., Morganti R., di Serego Alighieri S., Fosbury R. A. E., Danziger I. J., 1993, MNRAS, 263, 999
- Tremaine et al. (2002) Tremaine S., et al., 2002, ApJ, 574, 740
- Urry & Padovani (1995) Urry C. M., Padovani P., 1995, PASP, 107, 803
- Veale et al. (2017) Veale M., Ma C.-P., Greene J. E., Thomas J., Blakeslee J. P., McConnell N., Walsh J. L., Ito J., 2017, MNRAS, 471, 1428
- Wada et al. (2009) Wada K., Papadopoulos P. P., Spaans M., 2009, ApJ, 702, 63
- Wagner et al. (2012) Wagner A. Y., Bicknell G. V., Umemura M., 2012, ApJ, 757, 136
- Ward et al. (2022) Ward S. R., Harrison C. M., Costa T., Mainieri V., 2022, MNRAS, 514, 2936
- Wes McKinney (2010) Wes McKinney 2010, in Stéfan van der Walt Jarrod Millman eds, Proceedings of the 9th Python in Science Conference. pp 56 – 61, doi:10.25080/Majora-92bf1922-00a
- Wu et al. (2018) Wu Q., Feng J., Fan X., 2018, ApJ, 855, 46
- Zhu et al. (2011) Zhu G., Zaw I., Blanton M. R., Greenhill L. J., 2011, ApJ, 742, 73
- pandas development team (2022) pandas development team T., 2022, pandas-dev/pandas: Pandas, doi:10.5281/zenodo.7093122, https://doi.org/10.5281/zenodo.7093122
Appendix A Emission data and derived values
| Galaxy | X-ray Source | ||||||||||||
| () | () | () | () | () | () | (mag) | (mag) | ||||||
| (1) | (2) | (3) | (4) | (5) | (6) | (7) | (8) | (9) | (10) | (11) | (12) | (13) | (14) |
| FRL49 | 9.06E+38 | 9.06E+37 | 0.90 | 0.205 | 1.85E+43 | 1.85E+42 | Chandra | 1.92E+39 | 7.85E+37 | 42.39 | 0.04 | 9.8 | 0.0100 |
| FRL1146 | - | - | - | - | 2.58E+43 | 2.58E+42 | XMM | 2.44E+39 | 1.41E+38 | 40.24 | 0.07 | 11 | 0.00800 |
| MRK567 | 7.48E+38 | 7.91E+37 | 0.29 | 0.205 | - | - | - | 5.84E+38 | - | - | - | 11 | 0.0450 |
| NGC0383 | 3.59E+40 | 3.59E+39 | 3.3 | 0.205 | 3.31E+40 | 3.31E+39 | Chandra | 7.86E+40 | 1.26E+38 | 39.46 | 0.04 | 10 | 0.00700 |
| NGC0404 | 5.36E+34 | 6.99E+33 | 0.49 | 0.227 | 1.58E+37 | 1.58E+36 | Chandra | 9.76E+35 | 3.08E+34 | 37.69 | 0.04 | 10 | 0.00700 |
| NGC0449 | 5.55E+38 | 5.78E+37 | 0.27 | 0.205 | 3.78E+40 | 3.78E+39 | XMM | 7.47E+38 | 3.05E+37 | 41.50 | 0.04 | 12 | 0.0230 |
| NGC0524 | 2.80E+36 | 4.61E+35 | -0.27 | 0.212 | 3.59E+38 | 3.59E+37 | Chandra | 8.81E+38 | 3.56E+36 | 37.55 | 0.04 | 10 | 0.0730 |
| NGC0612 | 1.46E+41 | 1.47E+40 | 3.0 | 0.205 | 7.76E+41 | 7.76E+40 | Chandra | 1.19E+41 | 2.84E+38 | 40.03 | 0.04 | 9.9 | 0.0990 |
| NGC0708 | 3.72E+38 | 3.72E+37 | 1.6 | 0.205 | 2.45E+39 | 2.45E+38 | Chandra | 1.27E+39 | 1.58E+37 | 39.10 | 0.04 | 12 | 0.0600 |
| NGC1194 | 1.18E+37 | 1.18E+36 | 1.5 | 0.871 | 3.50E+41 | 3.50E+40 | XMM | 1.23E+39 | 2.22E+37 | 40.03 | 0.04 | 11 | 0.0320 |
| NGC1387 | 2.64E+36 | 4.22E+35 | -0.18 | 0.212 | 2.14E+39 | 2.14E+38 | Chandra | 1.17E+38 | 6.03E+36 | - | - | 10 | 0.111 |
| NGC1574 | - | - | - | - | - | - | - | 3.52E+38 | 3.50E+36 | - | - | 10 | 0.0980 |
| NGC2110 | 6.34E+38 | 6.76E+37 | - | - | 5.13E+42 | 5.13E+41 | Chandra | 7.72E+39 | 1.64E+38 | 40.41 | 0.04 | 10 | 0.0580 |
| NGC3169 | 5.43E+37 | 5.43E+36 | 0.16 | 0.205 | 3.39E+41 | 3.39E+40 | Chandra | 3.42E+38 | 1.07E+37 | 39.46 | 0.04 | 10 | 0.0920 |
| NGC3351 | 7.08E+36 | 7.08E+35 | - | - | 5.46E+38 | 5.67E+37 | ROSAT | 1.81E+37 | - | 37.28 | 0.15 | 9.0 | 0.0150 |
| NGC3368 | 1.52E+37 | 1.52E+36 | 0.19 | 0.205 | 1.98E+39 | 1.98E+38 | ASCA | 5.40E+37 | - | 38.85 | 0.04 | 9.5 | 0.0680 |
| NGC3607 | 5.67E+36 | 6.57E+35 | 0.010 | 0.206 | 1.45E+39 | 1.45E+38 | Chandra | 3.79E+38 | 2.31E+37 | 39.48 | 0.04 | 9.5 | 0.0420 |
| NGC3862 | 8.13E+40 | 8.13E+39 | - | - | 3.92E+41 | 3.92E+40 | Chandra | 1.52E+41 | 3.43E+39 | 39.20 | 0.04 | 11 | 0.0370 |
| NGC4061 | 5.70E+39 | 5.70E+38 | 3.2 | 0.205 | - | - | - | 5.98E+39 | 4.46E+38 | - | - | 11 | 0.0400 |
| NGC4261 | 3.74E+40 | 4.12E+39 | - | - | 1.17E+41 | 1.17E+40 | Chandra | 6.28E+40 | 4.43E+38 | 39.60 | 0.04 | 9.0 | 0.0150 |
| NGC4429 | 4.59E+34 | 2.30E+35 | -1.8 | 2.18 | 1.31E+39 | 1.31E+38 | Einstein | 1.23E+38 | 9.42E+36 | 38.69 | 0.04 | 10 | 0.0650 |
| NGC4435 | 2.72E+36 | 2.72E+36 | -0.010 | 0.478 | 2.95E+39 | 2.95E+38 | Chandra | 5.69E+37 | 1.92E+36 | 39.02 | 0.04 | 10 | 0.0590 |
| NGC4438 | 2.87E+37 | 2.87E+36 | 0.48 | 0.205 | 1.20E+39 | 1.20E+38 | Chandra | 4.08E+37 | 9.81E+36 | 39.69 | 0.04 | 8.8 | 0.0150 |
| NGC4501 | 9.05E+37 | 9.05E+36 | 0.25 | 0.205 | 1.23E+40 | 1.23E+39 | Chandra | 8.01E+37 | 4.39E+36 | 39.31 | 0.04 | 9.0 | 0.0150 |
| NGC4697 | 1.30E+35 | 1.08E+35 | -1.1 | 0.413 | 3.31E+38 | 3.31E+37 | Chandra | 1.79E+37 | 1.65E+36 | - | - | 9.7 | 0.0660 |
| NGC4826 | 9.30E+36 | 9.03E+35 | 0.40 | 0.204 | 9.23E+37 | 2.05E+37 | Chandra | 8.27E+36 | 1.64E+36 | 39.03 | 0.04 | 8.0 | 0.0150 |
| NGC5064 | 1.93E+38 | 1.93E+37 | 0.89 | 0.205 | - | - | - | 9.19E+37 | 8.53E+36 | - | - | 11 | 0.0730 |
| NGC5765b | 5.03E+38 | 5.03E+37 | -0.010 | 0.205 | 5.37E+40 | 5.37E+39 | Chandra | 1.15E+39 | 2.17E+38 | - | - | 10.9 | 0.0700 |
| NGC5806 | 1.17E+37 | 1.17E+36 | -0.18 | 0.205 | - | - | - | 1.85E+37 | - | - | - | 11 | 0.0730 |
| NGC5995 | 5.91E+38 | 6.36E+37 | - | - | 2.45E+43 | 2.45E+42 | Chandra | 3.22E+39 | 1.07E+38 | - | - | 10 | 0.0390 |
| NGC6753 | 3.23E+38 | 3.53E+37 | 0.91 | 0.205 | - | - | - | 6.73E+37 | - | - | - | 11 | 0.0990 |
| NGC6958 | 2.34E+37 | 2.81E+36 | 0.67 | 0.207 | - | - | - | 2.92E+39 | 1.51E+37 | - | - | 10 | 0.0600 |
| NGC7052 | 9.21E+38 | 9.30E+37 | 1.8 | 0.205 | 1.05E+40 | 1.05E+39 | Chandra | 1.35E+40 | 6.23E+37 | 39.44 | 0.04 | 11 | 0.0420 |
| NGC7172 | 7.20E+37 | 7.66E+36 | 0.20 | 0.205 | 1.00E+43 | 1.00E+42 | Chandra | 2.74E+39 | 1.04E+38 | - | - | 10 | 0.0560 |
| PGC043387 | - | - | - | - | - | - | - | 8.02E+38 | - | - | - | 10.7 | 0.0110 |
Notes: (1) Galaxy name, (2) 1.4GHz luminosity, (3) 1.4GHz luminosity uncertainty, (4) Excess radio fraction, (5) Excess radio fraction uncertainty, (6) 2-10 keV X-ray luminosity, (7) (2-10) keV X-ray luminosity uncertainty, (8) The telescope used for the X-ray observation, (9) Nuclear mm luminosity, (10) Nuclear mm luminosity uncertainty, (11) [OIII] luminosity, (12) [OIII] luminosity uncertainty, (13) -band magnitude, (14) -band magnitude uncertainty.
| Galaxy | ||||
| (1) | (2) | (3) | (4) | (5) |
| FRL49 | 5.70E-02 | 5.70E-03 | 1.29E+00 | 1.19E-01 |
| FRL1146 | 8.70E-02 | 8.70E-03 | 9.12E-03 | 1.47E-03 |
| MRK567 | - | - | - | - |
| NGC0383 | 3.55E-05 | 3.55E-06 | 1.51E-03 | 1.39E-04 |
| NGC0404 | 2.50E-08 | 2.50E-09 | 2.57E-05 | 2.37E-06 |
| NGC0449 | 4.10E-05 | 4.10E-06 | 1.66E-01 | 1.53E-02 |
| NGC0524 | 3.98E-07 | 3.98E-08 | 1.86E-05 | 1.72E-06 |
| NGC0612 | 1.19E-03 | 1.19E-04 | 5.63E-03 | 5.18E-04 |
| NGC0708 | 2.48E-06 | 2.48E-07 | 6.61E-04 | 6.09E-05 |
| NGC1194 | 4.77E-04 | 4.77E-05 | 5.63E-03 | 5.18E-04 |
| NGC1387 | 2.17E-06 | 2.17E-07 | - | - |
| NGC1574 | - | - | - | - |
| NGC2110 | 1.15E-2 | 1.15E-3 | 1.91E-02 | 1.76E-03 |
| NGC3169 | 4.60E-04 | 4.60E-05 | 1.51E-03 | 1.39E-04 |
| NGC3351 | 5.88E-07 | 6.10E-08 | 1.00E-05 | 3.46E-06 |
| NGC3368 | 2.01E-06 | 2.01E-07 | 3.72E-04 | 3.42E-05 |
| NGC3607 | 1.49E-06 | 1.49E-07 | 1.59E-03 | 1.46E-04 |
| NGC3862 | 5.43E-04 | 5.43E-05 | 8.32E-04 | 7.67E-05 |
| NGC4061 | - | - | - | - |
| NGC4261 | 1.39E-04 | 1.39E-05 | 2.09E-03 | 1.93E-04 |
| NGC4429 | 1.34E-06 | 1.34E-07 | 2.57E-04 | 2.37E-05 |
| NGC4435 | 2.98E-06 | 2.98E-07 | 5.50E-04 | 5.06E-05 |
| NGC4438 | 1.24E-06 | 1.24E-07 | 2.57E-03 | 2.37E-04 |
| NGC4501 | 1.26E-05 | 1.26E-06 | 1.07E-03 | 9.87E-05 |
| NGC4697 | 3.68E-07 | 3.68E-08 | - | - |
| NGC4826 | 1.16E-07 | 2.56E-08 | 5.63E-04 | 5.18E-05 |
| NGC5064 | - | - | - | - |
| NGC5765b | 5.96E-05 | 5.96E-06 | - | - |
| NGC5806 | - | - | - | - |
| NGC5995 | 8.14E-02 | 8.14E-03 | - | - |
| NGC6753 | - | - | - | - |
| NGC6958 | - | - | - | - |
| NGC7052 | 1.07E-05 | 1.07E-6 | 1.45E-03 | 1.33E-04 |
| NGC7172 | 2.63E-02 | 2.63E-03 | - | - |
| PGC043387 | - | - | - | - |
Notes: (1) Galaxy name. (2) X-ray-traced accretion rate. (3) X-ray-traced accretion rate uncertainty. (4) [OIII]-traced accretion rate. (5) [OIII]-traced accretion rate uncertainty.
| Galaxy | ||||||||
| (200 pc) | (100 pc) | (75 pc) | (50 pc) | |||||
| (1) | (2) | (3) | (4) | (5) | (6) | (7) | (8) | (9) |
| FRL49 | 7.75 | 0.78 | 2.39 | 0.24 | - | - | - | - |
| FRL1146 | - | - | - | - | - | - | - | - |
| MRK567 | 9.58 | 0.96 | 3.98 | 0.4 | - | - | - | - |
| NGC0383 | 7.60 | 0.76 | 2.74 | 0.27 | 1.6 | 0.16 | 0.64 | 0.06 |
| NGC0404 | 39.62 | 3.96 | 39.73 | 3.97 | 39.07 | 3.91 | 36.14 | 3.61 |
| NGC0449 | - | - | - | - | - | - | - | - |
| NGC0524 | 11.64 | 1.16 | 3.77 | 0.38 | 2.48 | 0.25 | 1.29 | 0.13 |
| NGC0612 | 2.22 | 0.22 | 0.58 | 0.06 | 0.44 | 0.05 | 0.32 | 0.04 |
| NGC0708 | 9.24 | 0.92 | 3.18 | 0.32 | 2.05 | 0.21 | 0.95 | 0.1 |
| NGC1194 | 2.58 | 0.26 | 1.13 | 0.11 | 0.76 | 0.08 | - | - |
| NGC1387 | 27.95 | 2.80 | 6.8 | 0.68 | 3.78 | 0.38 | 1.62 | 0.16 |
| NGC1574 | 3.98 | 0.40 | 3.53 | 0.35 | 2.89 | 0.29 | 1.6 | 0.16 |
| NGC2110 | 4.62 | 0.46 | 1.21 | 0.12 | - | - | - | - |
| NGC3169 | 125.84 | 12.58 | 43.18 | 4.32 | 26.99 | 2.7 | - | - |
| NGC3351 | 104.99 | 10.50 | 55.74 | 5.57 | 32.78 | 3.28 | 18.57 | 1.86 |
| NGC3368 | 170.74 | 17.07 | 54.79 | 5.48 | 35.54 | 3.55 | 19.23 | 1.92 |
| NGC3607 | 37.39 | 3.74 | 15.56 | 1.56 | 10.37 | 1.04 | - | - |
| NGC3862 | - | - | - | - | - | - | - | - |
| NGC4061 | 1.21 | 0.12 | 0.34 | 0.03 | 0.21 | 0.02 | - | - |
| NGC4261 | 5.91 | 0.59 | 5.49 | 0.55 | 4.59 | 0.46 | 2.98 | 0.3 |
| NGC4429 | 17.38 | 1.74 | 3.64 | 0.36 | 2 | 0.2 | 0.64 | 0.06 |
| NGC4435 | 35.67 | 3.57 | 15.68 | 1.57 | 9.91 | 0.99 | 5.28 | 0.53 |
| NGC4438 | 134.20 | 13.42 | 52.63 | 5.26 | 32.86 | 3.29 | 15.26 | 1.53 |
| NGC4501 | 137.79 | 13.78 | 63.66 | 6.37 | 40.61 | 4.06 | 20.26 | 2.03 |
| NGC4697 | 1.90 | 0.19 | 1.55 | 0.16 | 1.23 | 0.12 | 0.74 | 0.07 |
| NGC4826 | 276.92 | 27.69 | 193.02 | 19.3 | 148.73 | 14.87 | 74.96 | 7.5 |
| NGC5064 | 27.91 | 2.79 | 9.7 | 0.97 | 5.27 | 0.53 | 2.58 | 0.26 |
| NGC5765b | 4.70 | 0.47 | - | - | - | - | - | - |
| NGC5806 | 19.20 | 1.92 | 7.53 | 0.75 | 5.46 | 0.55 | 3.09 | 0.31 |
| NGC5995 | - | - | - | - | - | - | - | - |
| NGC6753 | 57.58 | 5.76 | 19.66 | 1.97 | 11.8 | 1.18 | 5.65 | 0.56 |
| NGC6958 | 12.76 | 1.28 | 3.76 | 0.38 | 2.3 | 0.23 | 1.03 | 0.11 |
| NGC7052 | 5.06 | 0.51 | 2.2 | 0.22 | 1.33 | 0.13 | 0.55 | 0.06 |
| NGC7172 | 47.03 | 4.70 | 6.19 | 0.62 | 2.85 | 0.29 | 1.14 | 0.11 |
| PGC043387 | - | - | - | - | - | - | - | - |
Notes: (1) Galaxy name. (2) 200pc radius aperture integrated CO intensity. (3) 200pc aperture CO intensity uncertainty. (4)-(9) follows the same trend for the 100, 75 and 50 pc radius apertures.
| Median values for samples | ||||
| This Work | Garcia-Burillo+21 | Izumi+16 | Babyk+19 | |
| log | 43.2 | 43.0 | 43.3 | - |
| log | 8.04 | 7.09 | 7.38 | - |
| log () | -2.57 | -2.20 | -2.17 | - |
| log | 42.3 | - | - | 42.3 |
| KS test | ||||
| Samples | p-values | |||
| This Work-GB+21 () | 0.015 | |||
| This Work-Izumi+16 () | 0.001 | |||
| This Work-GB+21 () | 0.0003 | |||
| This Work-Izumi+16 () | 7.27 | |||
| This Work-GB+21 () | 0.03 | |||
| This Work-Izumi+16 () | 0.003 | |||
| This Work-Babyk+19 () | 0.53 | |||