SERENADE II: An ALMA Multi-Band Dust-Continuum Analysis of 28 Galaxies at and
the Physical Origin of the Dust Temperature Evolution
Abstract
We present an analysis of ALMA multi-band dust-continuum observations for 28 spectroscopically-confirmed bright Lyman-break galaxies at . Our sample consists of 11 galaxies at newly observed in our ALMA program, which substantially increases the number of galaxies with both rest-frame 88 and 158 continuum observations, allowing us to simultaneously measure the IR luminosity and dust temperature for a statistical sample of galaxies for the first time. We derive the relationship between the UV slope () and infrared excess (IRX) for the galaxies, and find a shallower IRX- relation compared to the previous results at –4. Based on the IRX- relation consistent with our results and the - relation including fainter galaxies in the literature, we find a limited contribution of the dust-obscured star formation to the total SFR density, at . Our measurements of the dust temperature at , on average, supports a gentle increase of from to –7. Using an analytic model with parameters consistent with recent JWST results, we discuss that the observed redshift evolution of the dust temperature can be reproduced by an increase in the gas depletion timescale and decrease of the metallicity. The variety of observed at high redshifts can also be naturally explained by scatters around the star-formation main sequence and average mass-metallicity relation, including an extremely high dust temperature of observed in a galaxy at .
1 Introduction
The cosmic star formation rate density (SFRD) is one of the most important quantities to understand the evolution of galaxies as well as the history of the universe. Over recent decades, the SFRD has been derived through the UV emission of galaxies from the present day () to by utilizing ground-based and space telescopes such as the Canada-France-Hawaii Telescope (CFHT), Keck Telescope, Subaru Telescope, Hubble Space Telescope (HST) and James-Webb Space Telescope (JWST; e.g., Lilly et al., 1996; Madau et al., 1996; Steidel et al., 1999; Bouwens et al., 2007; Oesch et al., 2010, 2013; Coe et al., 2013; Ellis et al., 2013; Bouwens et al., 2015; Finkelstein et al., 2015; Moutard et al., 2020; Bouwens et al., 2023a, b; Harikane et al., 2023a, b). These observations revealed that the SFRD traced by rest-frame UV emission peaks at –3 and subsequently declines toward the early Universe (Madau & Dickinson, 2014, and references therein).
Given that the UV radiation from young massive stars within galaxies is easily absorbed by interstellar dust, it is necessary to measure both direct and re-processed stellar emission corresponding to both the rest-frame ultraviolet (UV) and the rest-frame far infrared (FIR), respectively. The dust-obscured SFRD is explored with FIR to sub-mm observatories such as Spitzer, Herschel, and the James Clark Maxwell Telescope (JCMT), revealing a monotonic increase by an order of magnitude from to (e.g., Chary & Elbaz, 2001; Magnelli et al., 2009, 2011, 2013). However, at , the dust-obscured SFRD is poorly constrained, with the discrepancy among studies reaching nearly two orders of magnitude (Robertson et al., 2010; Gruppioni et al., 2020; Khusanova et al., 2021; Zavala et al., 2021; Casey et al., 2021; Fudamoto et al., 2021; Algera et al., 2023b; Barrufet et al., 2023a; Fujimoto et al., 2023). The relation between infrared excess (IRX) and the UV spectral slope () can be used to correct for the dust-absorbed UV emission in the absence of the FIR/sub-mm observations. Since this relationship is useful for inferring the total (UV+IR) star formation activity of galaxies from the rest-frame UV observations alone, it has been extensively explored using several types of local galaxies such as local starbursts (Meurer et al., 1999; Calzetti et al., 2000; Takeuchi et al., 2012) and Small Magellanic Cloud (SMC; Gordon et al., 2003), and galaxies at –3 (Reddy et al., 2015; Álvarez-Márquez et al., 2016; Reddy et al., 2018; Álvarez-Márquez et al., 2019). With the advent of the Atacama Large Millimeter-submillimeter Array (ALMA), some studies investigated the IRX- relation at . For example, Fudamoto et al. (2020a) examined the IRX- relation at , and found a redshift evolution at . Recent ALMA observations towards UV-selected galaxies suggest a significant contribution of the dust-obscured star formation at high redshift (Fudamoto et al., 2021; Algera et al., 2023b; Barrufet et al., 2023a).
While these ALMA studies shed light on the dust-obscured star formation at , the IR luminosity depends on their assumption of the shape of FIR spectral energy distribution (SED). The variations in FIR SEDs are challenging to account for at due to sensitivity limitations in observing the peak of dust thermal emission at mid-to-far IR wavelengths in the observed frame. As the FIR SED might depend on the UV slope (e.g., Álvarez-Márquez et al., 2019), considering its variation is essential for constructing an accurate IRX- relationship. Specifically, the luminosity-weighted dust temperature () is one of the key parameters that determine the shape of the FIR SEDs. For instance, the dust temperature severely affects estimates of and therefore the dust-obscured SFR. Moreover, in the case of the UV-to-FIR SED modeling based on the energy balance principle with a single ALMA observation, the assumed can influence inferred stellar ages or metallicities due to the degeneracy with dust attenuation. While there is observational (e.g., Magnelli et al., 2014; Béthermin et al., 2015; Schreiber et al., 2018; Faisst et al., 2020a; Sommovigo et al., 2021, 2022; Viero et al., 2022) and theoretical (e.g., Ferrara et al., 2017; Ma et al., 2019; Liang et al., 2019; Sommovigo et al., 2020) evidence suggesting higher in higher- galaxies, the redshift dependence at is still unclear because of the limited sample size (Faisst et al., 2020a; Akins et al., 2022; Witstok et al., 2022; Algera et al., 2023b). Theoretical studies suggest that could be related to galaxies’ metal content or star formation surface densities (Ma et al., 2019; Liang et al., 2019), although this has not been confirmed observationally. Hence, obtaining representative values and examining the potential origin of its variation is essential as a prior assumption to calculate SFR and .
In this paper, we examine the FIR property of galaxies at with our new ALMA Band-6/8 observations toward 11 Lyman-Break Galaxies (LBGs) at . The ALMA Band-8, covering rest-frame dust continuum near the peak of the dust thermal emission at , enables us to constrain . In addition to individual measurements, stacking analysis can derive an IRX- relationship with the consideration of the variety of the FIR SEDs at . We aim to inform the IRX-beta relation at by comparing our multi-band analysis with single-band measurements in the literature. We also examine the representative with a statistically significant number of –8 galaxies by compiling our new observations and archival data of additional 14 galaxies at –8. We re-analyze the archival data in a homogeneous way to our target galaxies at for a fair comparison. An observational attempt to constrain and their evolution yields fundamental information to understand the dust-obscured star formations in the early Universe.
The paper is organized as follows: Section 2 provides an overview of the datasets used in this work. Section 3 describes the method of measurements for UV and IR properties, and shows the parameter coverage of this work compared with previous studies. In Section 4, we report the IRX- and - relations, the contribution of the dust-obscured star formation at , and the results of measurements. Discussions of the model of evolution are described in Section 5. The conclusions are presented in Section 6. Throughout this paper, we assume a flat universe with the cosmological parameters of , , , and km s-1.
2 Observation and Data
2.1 SERENADE overview
SERENADE (Systematic Exploration in the Reionization Epoch using Nebular And Dust Emission) is an ALMA program (ID:#2022.1.00522.S, PI: Yuichi Harikane) designed to observe the two brightest FIR fine structure lines ([C ii] 158m and [O iii] 88m) from LBGs at . The parent sample of the target galaxies is selected from the literature, mostly from the galaxy sample identified in Hyper Suprime-Cam Subaru Strategic Program (HSC-SSP; Matsuoka et al., 2016; Aihara et al., 2018; Matsuoka et al., 2018a, b; Ono et al., 2018; Harikane et al., 2022), based on the following four criteria: (1) spectroscopic confirmation of their redshifts, (2) redshifted [O iii] 88m and Ly falling into ALMA Band-8 and ground-based optical telescopes, respectively (–6.3), (3) the absence of clear AGN/QSO signatures in their rest-frame UV spectra, and (4) sufficient expected brightness for the detection of emission lines within a relatively short observing time (hours). We select 19 galaxies as our targets to encompass a broad dynamic range in a Star Formation Rate (SFR), including two lensed galaxies (see Table 1). Observations were conducted between October and December 2022 using the C43-1/2/3 configuration. Since one targeting galaxy (J023536-031737) was not observed in either Band-6 or Band-8, we address the remaining 18 LBGs in this paper. Among 18 LBGs, 11 are observed in both 158 m and 88 m.
We have also incorporated three galaxies reported in Harikane et al. (2020b) for the galaxy sample with the 158 m and 88 m coverage. In total, the SERENADE galaxies are composed of 21 galaxies (18 galaxies in Cycle-9 and 3 galaxies in the pilot study in Harikane et al. 2020b) at , including 14 galaxies (11 from Cycle-9 and 3 from Harikane et al. 2020b) with the 158 m and 88 m coverage. We provide more details on the continuum detection and flux measurements in Section 3.3. Among the 21 target galaxies, observations were conducted for 20 [C ii] and 15 [O iii] emission lines. Of these, 16 [C ii] and 10 [O iii] emission lines were detected with a signal-to-noise ratio (S/N) greater than 3. A comprehensive discussion of the emission line data is beyond the scope of this paper and will be provided in an upcoming paper (Paper I; Harikane et al. in prep).
2.2 Addtional samples
We incorporate an additional 14 galaxies at with multi-band ALMA coverage in this study; four galaxies at (Faisst et al., 2020a), and ten galaxies at (Watson et al., 2015; Knudsen et al., 2017; Hashimoto et al., 2019; Inoue et al., 2020; Sugahara et al., 2021; Bakx et al., 2021; Witstok et al., 2022; Akins et al., 2022; Algera et al., 2023b). We collect galaxies at with both Band-6 and Band-8 observations publicly available in the ALMA science archive. For a fair comparison, we re-analyze these datasets in the same manner as the SERENADE galaxies. The differences between our measurement and previous studies mainly come from the flux measurement methodology, but we note that our results are broadly consistent with the previously mentioned studies.
2.3 Summary of the samples
In total, we have 28 galaxies with multi-band ALMA coverage composed of 14 SERENADE galaxies and the additional 14 galaxies at in literature. Among 28 galaxies, 21 are individually detected, and can be estimated. This is the largest sample of galaxies with multi-band dust continuum observation.
3 Analysis
3.1 Measurement of and
To compare the dust continuum properties with the rest-frame UV continuum properties, we estimate parameters that characterize the UV continuum, such as UV continuum slope (; ) and absolute magnitude (). The slope of the UV spectrum is mainly determined by the stellar age, stellar metallicity, and the amount of dust attenuation. Our calculations utilize broad-band photometry spanning a rest-frame wavelength range as large as 800–3000Å depending on the data availability at the position of each galaxy. All of the utilized photometries, along with their references, are listed in Table 1. We cross-match catalog coordinates with the central coordinate of our target galaxies derived from the detection in previous papers. For galaxies residing in the Cosmic Evolution Survey (COSMOS Scoville et al., 2007), Subaru/XMM-Newton Deep Field (SXDF Pierre et al., 2004), and XMM Large Scale Structure survey (XMM-LSS Pierre et al., 2004), we obtain ,,,, and -band photometries from the latest COSMOS2020 catalog (Weaver et al., 2022), SPLASH-SXDF multi-wavelength catalog (Mehta et al., 2018), and VISTA Deep Extragalactic Observations catalog (Jarvis et al., 2013), respectively. We take ,, and -band photometry from the HSC-PDR3 catalog (Aihara et al., 2022) for the galaxies originally identified in the wide layer of the HSC-SSP survey (Aihara et al., 2018). If the galaxies are covered in the United Kingdom Infrared Telescope Deep Sky Survey (UKIDSS, Lawrence et al., 2007) or VISTA Kilo-degree Infrared Galaxy survey (VIKING, Jarvis et al., 2013), we combine the photometries at NIR wavelengths with the ,, and -band photometry following Matsuoka et al. (2019). For galaxies not covered by the aforementioned catalogs, we refer to the photometries measured in the literature (mostly from HST observations, e.g., Smit et al., 2018), or directly adopt and/or values (e.g., Huang et al., 2016) when the photometries are not publicly available.
| ID | ¶ | † | † | ,,† | ,† | ,† | ref | ||||
|---|---|---|---|---|---|---|---|---|---|---|---|
| [Å] | |||||||||||
| SERENADE (Cycle-9) | |||||||||||
| J020038-021052 | 6.1120 | - | - | - | 1,2 | ||||||
| J021033-052304 | 5.9007 | - | - | - | - | 1,3,4 | |||||
| J021041-055917 | 5.8216 | - | - | - | - | 1,3 | |||||
| J021244-015824 | 6.00 | - | - | - | - | 1,4 | |||||
| J021735-051032 | 6.12 | - | 6,7 | ||||||||
| J021807-045841 | 6.0446 | 6,7 | |||||||||
| J021838-050943 | 6.1860 | - | 6,7 | ||||||||
| J022023-050431 | 5.8403 | - | - | - | 8,9 | ||||||
| J022627-045238 | 6.0675 | - | 9,10 | ||||||||
| J024801-033258‡ | 6.0271 | - | 11,12 | ||||||||
| J045408-030014‡ | 6.3163 | - | - | - | - | - | - | 13 | |||
| J085723+014254 | 5.8394 | - | - | - | 1,3 | ||||||
| J091436+044231 | 5.8433 | - | - | - | - | 1,14 | |||||
| J100008+021136 | 5.8650 | 15,16 | |||||||||
| J100634+030005 | 5.8588 | - | - | - | - | 1,14 | |||||
| J114412-000613 | 6.05 | - | - | - | - | 1,8 | |||||
| J135348-001026 | 6.1702 | - | - | 1,17 | |||||||
| J142824+015934 | 5.9881 | - | - | - | - | 1,14 | |||||
| SERENADE pilot (Harikane et al., 2020b) | |||||||||||
| J1211+0118 | 6.0293 | - | - | - | 1,14 | ||||||
| J0217+0208 | 6.2037 | - | - | - | 1,14 | ||||||
| J0235+0532 | 6.0901 | - | - | - | 1,14 | ||||||
| LBGs (Hashimoto et al., 2019; Bakx et al., 2021; Akins et al., 2022; Witstok et al., 2022; Algera et al., 2023b) | |||||||||||
| COS-2987030247 | 6.8076 | - | 16,18 | ||||||||
| COS-3018555981 | 6.854 | - | - | 16,18 | |||||||
| UVISTA-Z-001 | 7.0611 | - | - | 16,19 | |||||||
| UVISTA-Z-007 | 6.7498 | - | 16,19 | ||||||||
| UVISTA-Z-019 | 6.7544 | - | - | 16,19 | |||||||
| A1689-zD1 | 7.133 | - | - | - | - | 20,21,22 | |||||
| B14-65666 | 7.1521 | - | - | - | - | - | 23,24 | ||||
| REBELS-12 | 7.3459 | - | - | 25,26 | |||||||
| REBELS-25 | 7.3065 | - | - | 25,26 | |||||||
| REBELS-38 | 6.5770 | - | 25,26 | ||||||||
| LBGs (Faisst et al., 2020b) | |||||||||||
| HZ4 | 5.544 | - | 16,27,28 | ||||||||
| HZ6 | 5.293 | - | 16,27,28 | ||||||||
| HZ9 | 5.541 | - | 16,27,28 | ||||||||
| HZ10 | 5.657 | - | - | - | - | 16,27,28 | |||||
Note. — ¶¶footnotetext: The difference in the number of decimal places reflects the precision. For instance, the redshifts of the SERENADE galaxies determined by [C ii]/[O iii] emission lines and Lya emission/UV absorption lines have four and two decimals, respectively. ††footnotetext: The , , and represent the Subaru/HSC, HST, and VISTA photometric bands, respectively. ‡‡footnotetext: Lensed galaxies. Lens magnification factors are 2.5 and 4.4 for J024801-033258 and J045408-030014, respectively (Bradley et al., 2014; Huang et al., 2016). The absolute magnitudes, , are corrected for the magnification factors, while the observed magnitudes are not. ††footnotetext: [references] 1) Aihara et al. (2022), 2) Ono et al. in prep, 3) Matsuoka et al. (2016), 4) Harikane et al. (2020b), 5) Matsuoka et al. (2018a), 6) Curtis-Lake et al. (2012), 7) Mehta et al. (2018), 8) Sawicki et al. in prep, 9) Jarvis et al. (2013), 10) Willott et al. (2015), 11) Mainali et al. (2018), 12) Bradley et al. (2014), 13) Huang et al. (2016), 14) Matsuoka et al. (2018b), 15) Mallery et al. (2012), 16) Weaver et al. (2022), 17) Matsuoka et al. (2019), 18) Smit et al. (2018), 19) Schouws et al. (2022), 20) Watson et al. (2015), 21) Wong et al. (2022), 22) Akins et al. (2022), 23) Bowler et al. (2014), 24) Hashimoto et al. (2019), 25) Bouwens et al. (2022), 26) Algera et al. (2023b), 27) Capak et al. (2015), 28) Faisst et al. (2020b)
We fit the broad-band photometry from the catalogs to estimate and , assuming a simple power-law spectral shape described by with a truncation at Å corresponding to the intergalactic medium (IGM) absorption by Hi gas. We take into account the contribution of the Ly emission line if the line is clearly detected in the spectroscopic observations. The brightness of the Ly line is obtained from the literature or calculated from spectra following the methodologies in Harikane et al. (2020b). We fit model UV SEDs created with the logarithmic ranges of [-0.5, 0.5] for the normalization flux in the -band and [-5, 3] for the UV slope . From each set of parameters, we derive by interpolating the model spectrum to the rest frame of 1500Å. The best-fit value and associated 1 uncertainty of and are derived as the value showing the minimum and the deviation at which from that the minimum value, respectively. We find a typical reduced value is , except for the sources covered in two photometric bands.
3.2 vs relationship
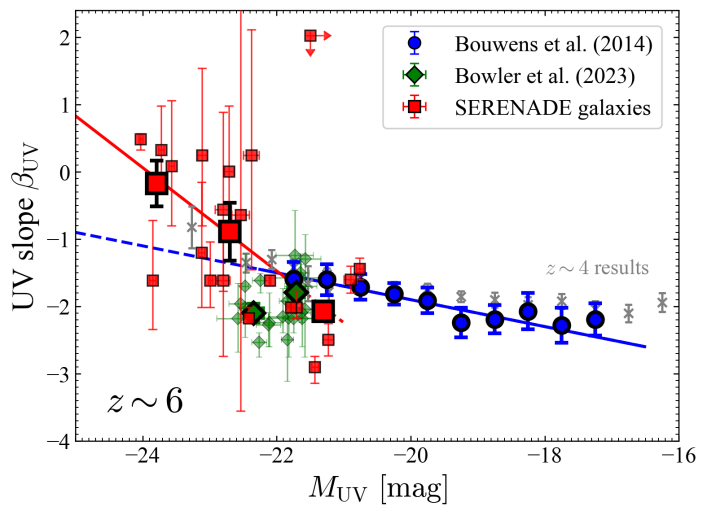
In Figure 1, we plot individual galaxy measurements of - and representative average data points by binning our galaxies into three bins of [-24.5:-23.5], [-23.5:-22.0] and [-22.0:-20.5]. The error bar represents a standard deviation of the sample. This result is consistent with the previous results, supporting the idea that more UV-luminous star-forming galaxies have redder UV-slope (e.g., Reddy et al., 2010; Bouwens et al., 2014; Yamanaka & Yamada, 2019). The UV slope could be redder than the extrapolated relationship from Bouwens et al. (2014) (hereafter B14) at . Such a bending trend at the bright end has been reported in previous studies (e.g., Lee et al., 2011). Our best-fit relationship normalized in is represented as . In contrast, Bowler et al. (2023) show potential flattening or turnover at , which may originate from a low dust obscuration due to clumpy geometry of the REBELS galaxies.
The Lyman-break selection technique could introduce biases favoring blue galaxies (i.e., small ). The typical -dropout selection criteria are composed of not only a red - color to identify the Lyman-break but also a blue - color coming from blue UV continuum (e.g., Bouwens et al., 2012, 2014; Harikane et al., 2022, see also Steidel et al. 1999). For example, the selection criteria used in Bouwens et al. (2012) select galaxies with at –6.3. Given that our target galaxies are collected from a variety of surveys, potential biases could permeate our results. While it is difficult to evaluate the biases on relationship, we test the potential bias by limiting galaxies selected from Subaru High- Exploration of Low-luminosity Quasars (SHELLQs) survey and follow-up spectroscopic observations. As the galaxies from the SHELLQs survey are selected without any color criteria on the UV-slope (see Figure 11 in Matsuoka et al., 2018a), the galaxy sample offers a more homogeneous selection compared to the galaxies culled from surveys external to the SHELLQs.111As the selection of quasars in the SHELLQs survey are composed of the red color originated from Lyman break () and the compactness, there may cause other bias apart from the UV slope (see Matsuoka et al., 2016, for more detail). As a result, there is no major change if we calculate the average values only with the galaxies from the SHELLQs survey. Consequently, we conclude that the overall trend is authentic although enlarging the sample size is imperative to draw robust conclusions. Note that an average in the range may be biased to bluer since all five galaxies in this range originate from inhomogeneous surveys.
3.3 Dust continuum fluxes
In this section, we describe the detection and measurement of the dust continuum fluxes. First, we make data cubes with the taper scale of and apply a single Gaussian fitting to the spectra extracted at the phase center to identify [C ii] 158 m or [O iii] 88 m emission lines. If any emission line feature is identified (i.e., Gaussian fitting converges), we mask a frequency range that is three times wider than the line velocity dispersion using CASA/mstransform. For cases with non-detection, we exclude the frequencies at (equivalent to ) from the expected central frequency from their prior redshift to ensure eliminating potential emission line contamination to the dust continuum. Subsequently, we generate continuum images with CASA/tclean. To recover all possible extended structures, we reconstruct images with taper of , , , , and in addition to the naturally-weighted image without tapering. We obtain peak flux density within a radius from each galaxy’s central position, under the assumption that dust continuum emission is included within a single beam. Noise levels are estimated in the images without primary beam corrections as the root-mean-square (RMS) of pixel values within the Field-of-View (FoV) where the primary beam correction value exceeds 0.5. As the fiducial signal-to-noise ratio (S/N) of each galaxy, we adopt the highest S/N among the images. Galaxies with fiducial in any band are considered as continuum detection.
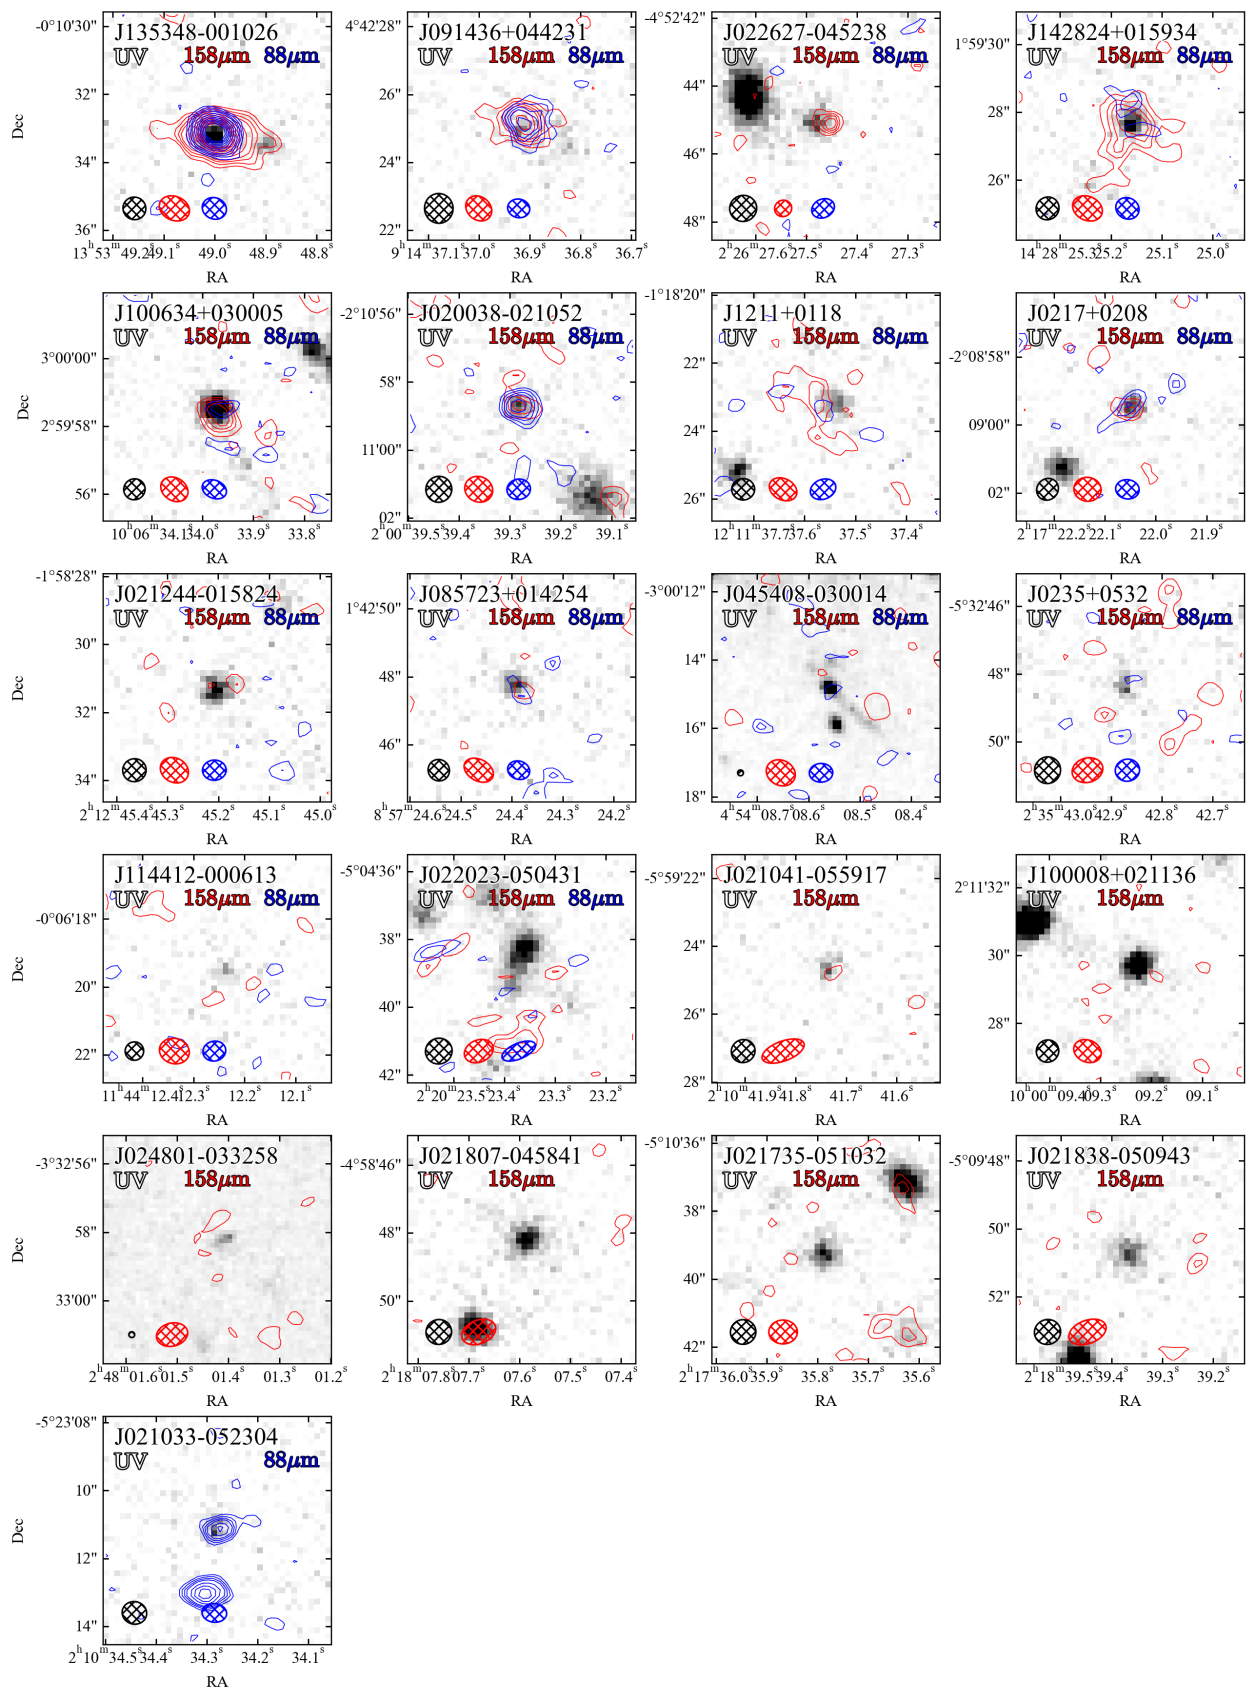
Figure 2 shows the thumbnails of the SERENADE galaxies. The contours of the natural-weighted dust continuum in the rest-frame (red) and (blue) are overlayed on the HSC -band or HST combined images. Of the 14 galaxies observed in both Band-6 and Band-8, six galaxies are detected in both the rest-frame and , two galaxies are only detected in the rest-frame dust continuum, and six galaxies are detected neither nor . There are also six galaxies observed solely in Band-6 and one in Band-8.
We measure the total flux density at multiple frequencies with consideration for the different spatial resolution between the rest-frame and continuum. To ensure that the total fluxes are measured and to achieve uniform measurements across frequencies, we employ the following three methods to calculate fiducial flux values; (1) For the galaxies detected in both rest-frame and , we execute CASA/imfit, (2) For those detected only in , we get the peak flux density and RMS in images with taper of following the S/N calculations described above, (3) For the galaxies not detected in any bands, we calculate upper limits from the naturally weighted images. The reason behind method (2) is to ensure uniformity in the calculation of the RMS levels between the detected and undetected frequencies. To avoid the flux misestimation in imfit due to the mismatch of dirty and clean beams, we apply modest tapers for some sources before running imfit. From the comparison between the fiducial flux value calculated above and the total flux derived from the visibility analysis presented in the Appendix, we find that calculated fiducial fluxes, in any case, are consistent with those from the visibility analysis. We also find that CASA/imfit achieves better flux recovering than that from the images with the multiple taper scales. These comparisons are shown in Figure 10 in Appendix A.
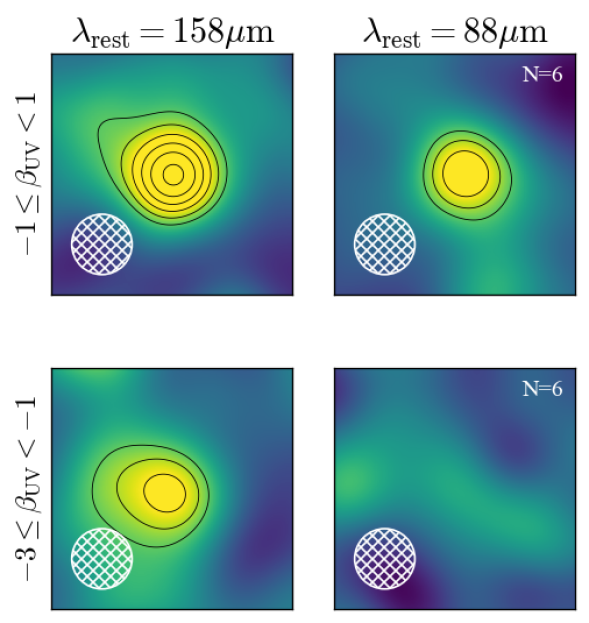
3.4 Stacking analysis
In this section, we stack the dust continuum of the SERENADE galaxies at to obtain an average representation that is not biased by individual detection. We perform the stacking of both rest-frame 88 and 158 dust continuums from galaxies in two distinct bins of and , where each bin include approximately an equal number of galaxies. Only galaxies observed in both Band-6 and Band-8 are used in the stacking analysis for the sake of homogeneity. Additionally, we exclude two galaxies (J020038-021052 and J024801-033258) because J020038-021052 do not have estimation and J024801-033258 is lensed. The resulting stacked images are shown in Figure 3. Given the variable nature of the ALMA beam sizes, we construct continuum images with a round beam by applying CASA/imsmooth for the images with a prior taper. For the reference position of the stacking, we use central positions derived in the rest-frame UV continuum (i.e., phase center of the ALMA observations). We note that spatial offsets identified in individual galaxies between UV and IR do not significantly impact the flux measurement since the spatial offsets are less than . Then we also compute the weighted average with the following weight based on the UV luminosity of -th galaxy in the sample:
| (1) |
This reciprocal weighting with respect to allows us to avoid bias towards bright galaxies. Finally, we measure fluxes with the same procedure described in Section 3.3. We find that there is no major difference when we use the weighted median instead of the weighted average.
3.5 and estimation
We fit a modified blackbody (MBB) to constrain the properties of the dust emission. The MBB profile is mainly determined by three parameters, dust temperature (), dust mass (), and emissivity of the dust grain (). The general formulation of the observed MBB flux density at is as follows:
| (2) |
Here and are the luminosity distance at redshift and the optical depth of the dust grain, respectively. represents the blackbody radiation at the temperature of . The absorption coefficient is assumed by with the nomalization of Milky Way value, [, ]=[10.41 cm-2g-1, 1900 GHz] (e.g., Bakx et al., 2021; Algera et al., 2023b; Ferrara et al., 2022). The dust optical depth is defined by the net absorption over the line of sight and represented as , where represents the surface dust mass density. is also commonly written as , where is a frequency at which the optical depth may exceed unity (e.g., around –200 for dusty star-forming galaxies; Casey 2012).
It is important to take into account the cosmic microwave background (CMB) effect, especially in the high- universe since the CMB temperature increases with redshift as . The CMB affects the measurements in two ways; (1) additional heating source of dust grains within galaxies (2) background radiation against which we observe the submillimeter fluxes from galaxies (da Cunha et al., 2013). After considering these effects following da Cunha et al. (2013), the equation (2) becomes
| (3) |
In the optically thin limit (, and thus ), the term representing the effect of the optical depth () is asymptotically unity. Therefore the formula of the optically thin MBB becomes
| (4) |
In this work, we use equation (4) to estimate , , in the same manner as previous studies.We note that the resulting does not change under the assumption of the optically thick MBB with , whereas becomes higher than those with the optically thin assumption.
| ID | * | ||||||||
|---|---|---|---|---|---|---|---|---|---|
| SERENADE | |||||||||
| J020038-021052 | - | - | - | - | |||||
| J021033-052304 | - | - | - | - | - | (45) | |||
| J021041-055917 | - | - | - | - | - | (45) | |||
| J021244-015824 | - | - | - | - | (45) | - | |||
| J021735-051032 | - | - | - | - | - | (45) | |||
| J021807-045841 | - | - | - | - | - | (45) | |||
| J021838-050943 | - | - | - | - | - | (45) | |||
| J022023-050431 | - | - | - | - | (45) | - | |||
| J022627-045238 | - | - | - | - | |||||
| J024801-033258 | - | - | - | - | - | (45) | |||
| J045408-030014 | - | - | - | - | (45) | - | |||
| J085723+014254 | - | - | - | - | (45) | - | |||
| J091436+044231 | - | - | - | - | |||||
| J100008+021136 | - | - | - | - | - | (45) | |||
| J100634+030005 | - | - | - | - | |||||
| J114412-000613 | - | - | - | - | (45) | ||||
| J135348-001026 | - | - | - | - | |||||
| J142824+015934 | - | - | - | - | |||||
| SERENADE pilot (Harikane et al., 2020b) | |||||||||
| J1211+0118 | - | - | - | ||||||
| J0217+0208 | - | - | - | ||||||
| J0235+0532 | - | - | - | ||||||
| LBGs (Hashimoto et al., 2019; Bakx et al., 2021; Akins et al., 2022; Witstok et al., 2022; Algera et al., 2023b) | |||||||||
| COS-2987030247 | - | - | - | - | (45) | ||||
| COS-3018555981 | - | - | - | - | |||||
| UVISTA-Z-001 | - | - | - | - | |||||
| UVISTA-Z-007 | - | - | - | - | (45) | ||||
| UVISTA-Z-019 | - | - | - | - | |||||
| A1689-zD1 | - | - | |||||||
| B14-65666 | - | - | - | ||||||
| REBELS-12 | - | - | - | - | |||||
| REBELS-25 | - | - | - | - | |||||
| REBELS-38 | - | - | - | - | |||||
| LBGs (Faisst et al., 2020b) | |||||||||
| HZ4 | - | - | - | ||||||
| HZ6 | - | - | - | ||||||
| HZ9 | - | - | - | ||||||
| HZ10 | - | - | - | ||||||
| stack | |||||||||
| - | - | - | - | ||||||
| - | - | - | - | ||||||
Note. — ∗∗footnotetext: For the galaxies whose dust temperatures are not constrained due to insufficient observations or non-detections, we assume the representative dust temperature of the SERENADE galaxies ().
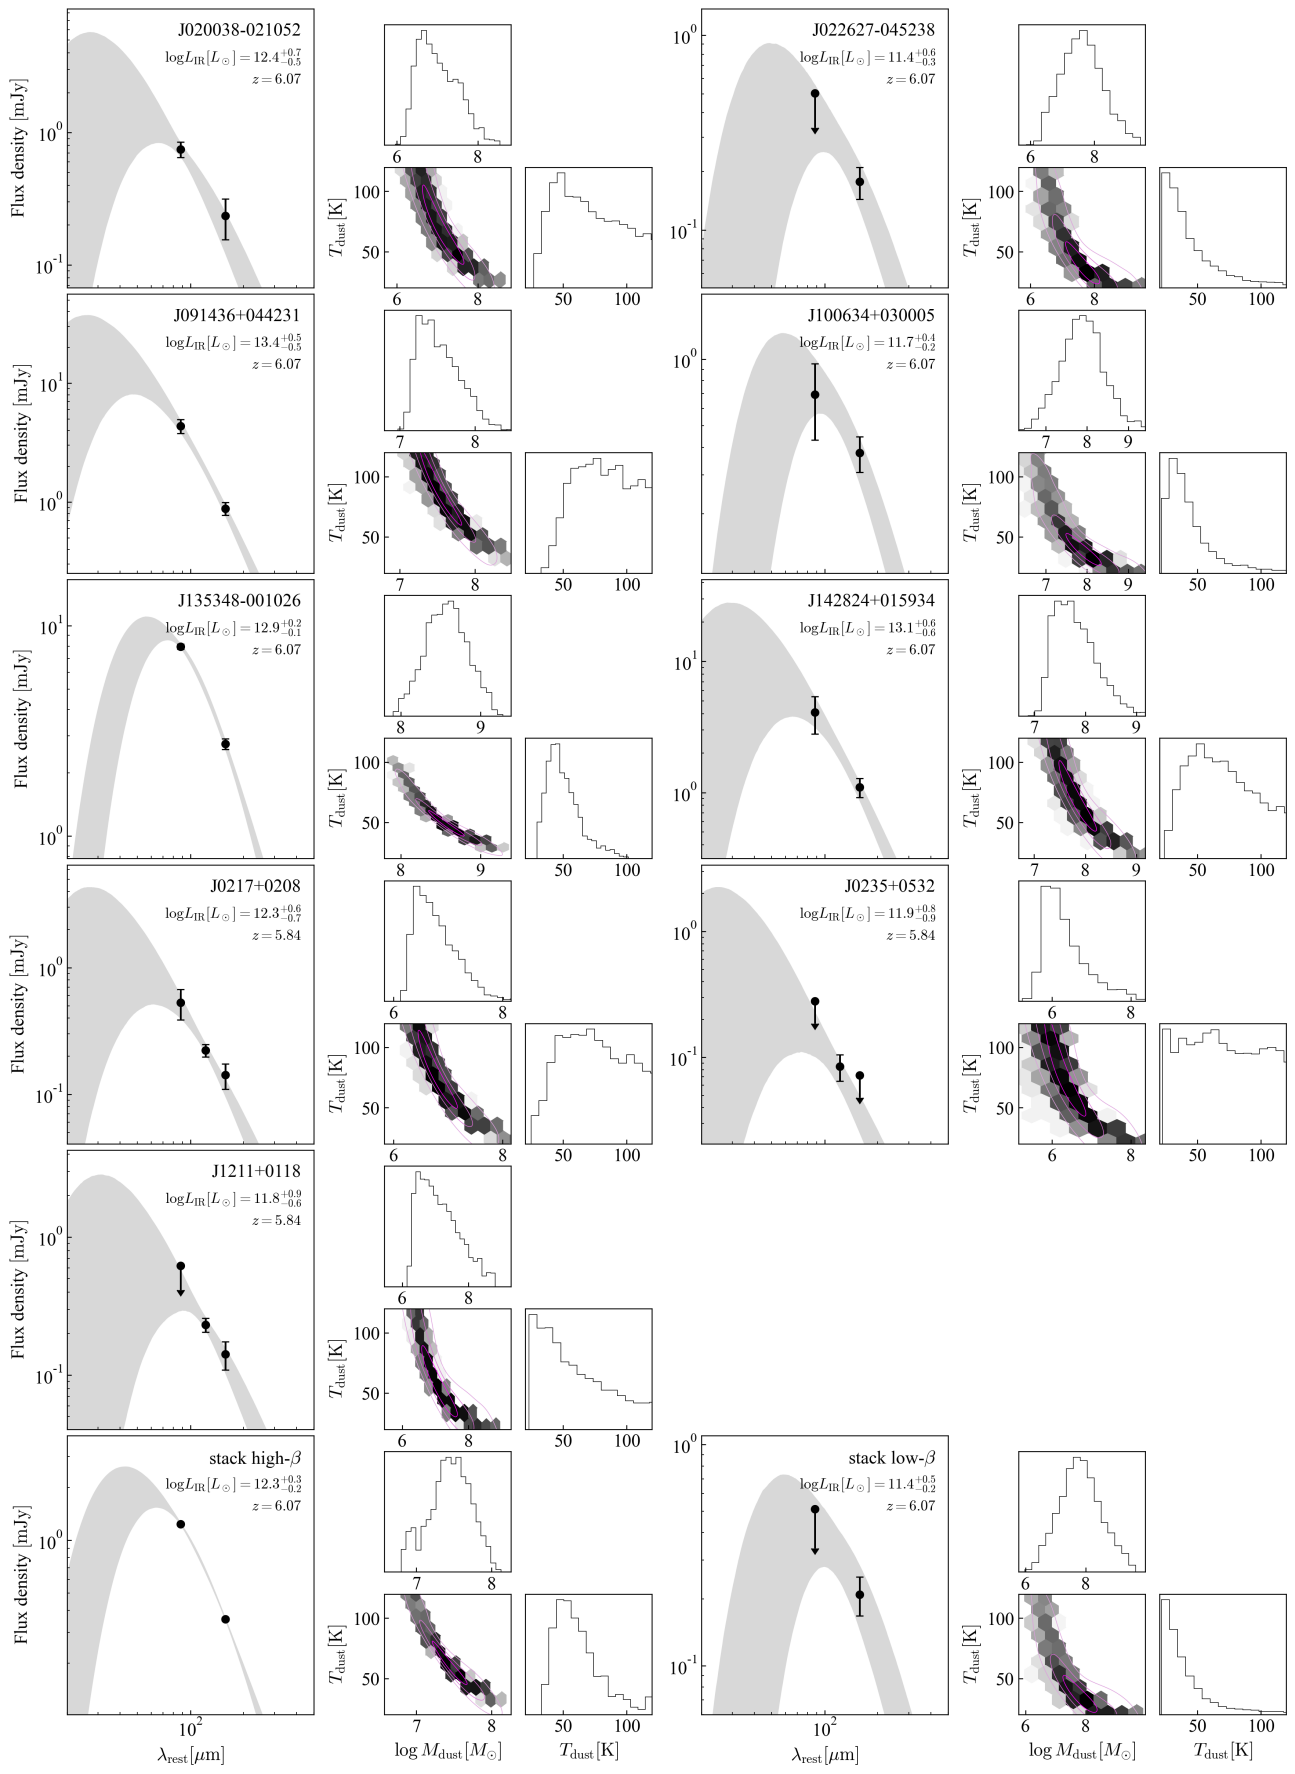
We use the Markov Chain Monte Carlo (MCMC) algorithm to fit the MBB profiles by utilizing the emcee library. The fitting results are shown in Figure 4. We adopt a logarithmically uniform prior on the dust masses and dust temperatures with a range of and , respectively. Note that there is no significant impact on our conclusion if we change the upper edge of the prior distribution of to . Since the sampling range of the FIR SED is not enough to constrain , we adopt a Gaussian prior with a mean value of and a standard deviation of to take the uncertainties into account to those of , and the resulting . This value is consistent with that of Milky Way (Planck Collaboration et al., 2014), the local galaxies (Cortese et al., 2014; Lamperti et al., 2019), local ULIRG (Clements et al., 2018), and high-z galaxies (da Cunha et al., 2021; Witstok et al., 2023). The results do not strongly depend on the prior distribution of as there is no significant difference if we apply a uniform prior of 111In the case of the uniform prior, the fitting results tend to prefer slightly lower and values compared with those under the gaussian prior. We fit the optically thin MBB model to the measured flux densities. In the case that the measured ALMA fluxes in any bands are upper limit, we adopt the methodology described in Sawicki (2012), which accounts for the Gaussian noise distribution of the probability distribution. In a nutshell, the probability of a model flux can be calculated by integrating a Gaussian distribution, which has a center of and dispersion of , from negative infinity to the 3- value of the upper limits. For instance, the probabilities taking model fluxes of or are penalized by 0.1% or 50% respectively. Therefore the model fluxes above 3- are not forbidden but the model fluxes much smaller than 3- are preferred. This is a reason why the resulting MBB sometimes yields model fluxes above the 3 upper limit (see Figure 4). We compute best-fit values and 1 uncertainties from the modes with the highest posterior density intervals.
Figure 4 shows the results of the MBB fittings for the SERENADE galaxies. Our MBB fitting successfully constrains , and , while some galaxies such as J020038-021052 or J0235+0532 need observations at shorter wavelengths or deeper observations are necessary to obtain more robust constraints on the parameters. The fitting results are summarized in Table 2.
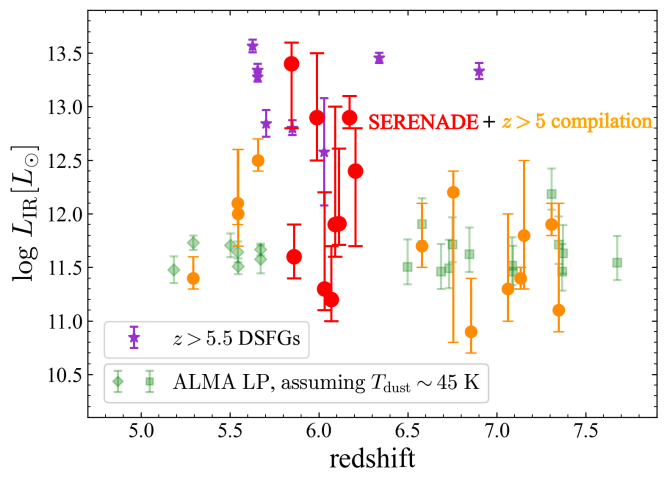
We compare the derived infrared luminosities (,8–) of the SERENADE galaxies with the literature in Figure 5. For a fair comparison with the galaxies previously reported, we conduct the same flux measurements and MBB fittings for the galaxies at in the literature. While our target galaxies were originally selected by their bright UV emission, the of the SERENADE galaxies spans a wide range, specifically from comparable to normal galaxies at (e.g., Ferrara et al., 2022) to similar to dusty starburst galaxies (e.g., Riechers et al., 2013).
4 Results
4.1 vs IRX relationship
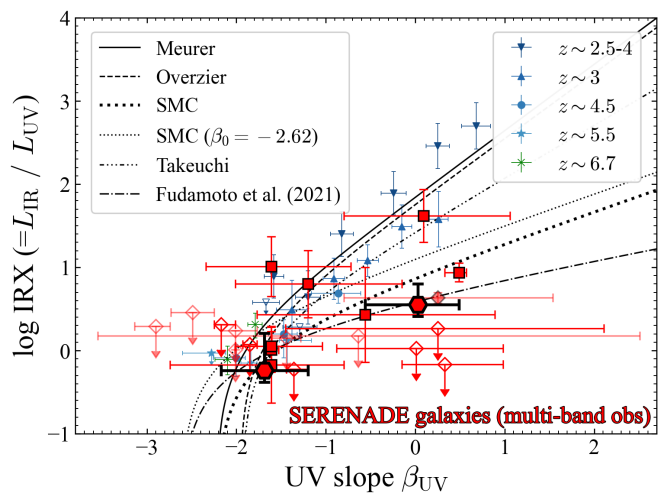
In Figure 6, we plot the IRX- diagram of the SERENADE galaxies. The results for the individually detected galaxies include uncertainties of the FIR SED. Meanwhile, the upper limits of the undetected galaxies are calculated by assuming (a representative of SERENADE galaxies). We find that our result from the stacking analysis supports a shallower IRX- relation than the Calzetti (Calzetti et al., 2000) and Meurer (Meurer et al., 1999) relations. Furthermore, our results prefer a shallower relation than the SMC extinction (e.g., Pettini et al., 1998; Gordon et al., 2003; Reddy et al., 2018) regardless of the intrinsic UV slope ( or ) and match well the relation reported in Fudamoto et al. (2020a) with . This shallower relation aligns with the findings of Reddy et al. (2018). They expect that galaxies with lower stellar metallicities at high redshift () favor a shallow IRX- relation with bluer intrinsic UV-slope . Since our target luminous LBGs at are expected to have sub-solar stellar metallicities, such as as presented in Harikane et al. (2020a), our results have a good agreement with the prediction in Reddy et al. (2018). As discussed in Bowler et al. (2023), the difference from the results at –7 (Fudamoto et al., 2020a; Bowler et al., 2023) at mainly comes from the difference in . Our estimate of for the stacking sample with from multi-band observations is lower by than the assumptions in these studies, and it leads to offset in the IRX.
We test potential biases in sample selection with the same procedure in Section 3.4 and find that the result remains consistent even when selecting galaxies only from the SHELLQs survey. Some studies have implied that the methodology for estimating could systematically change the IRX- relation. For instance, Álvarez-Márquez et al. (2019) suggested that the estimated by power-law fitting () may be biased to redder values by than that derived by SED fitting (). Furthermore, Reddy et al. (2015) demonstrated that calculated within the rest-frame wavelength range of 1260Å–1750Å () might be redder than that within the range of 1260Å–2600Å () especially in the spectrum with large . Given the analysis in Reddy et al. (2015), the redder bin of our galaxies, spanning , may intrinsically be bluer than the current estimation such as since four of five galaxies within have limited wavelength coverages of 1260Å–1700Å. However, even after changing to , our results still favor a shallow IRX- relation such as results from Fudamoto et al. (2020a). To secure robust measurements of UV slopes, NIR observations that cover the rest-frame optical wavelengths at are imperative.
4.2 SFR density at
As our observations are follow-up observations of UV-bright galaxies, we estimate the dust-obscured star formation activities of the UV-selected galaxies at . The focus of this paper, the contribution of dust-obscured star formation in the UV-selected galaxies, is complementary to the studies based on the IR-based source identification (e.g., Gruppioni et al., 2020; Zavala et al., 2021; Fujimoto et al., 2023) to comprehensively understand the dust-obscured star formation. Our starting point is the galaxy UV luminosity function presented in Harikane et al. (2022). The selection criteria adopted in their study allow the identification of not only blue -dropout LBGs but also those with moderately red colors encompassing a range of . We convert the UV luminosities of the galaxies into UV and IR luminosities in each UV absolute magnitude bin by utilizing both the – relation including fainter galaxies in the literature (Figure 1) and IRX- relation (Figure 6). For the IRX- relation, we adopt the extinction curve reported in Fudamoto et al. (2020a) as a fiducial one due to its alignment with our results. We estimate uncertainties using bootstrap techniques, ensuring the propagation of uncertainties in each relationship. Subsequently, we derive the total (UV+IR) SFR from the UV and IR luminosities following the conversion factors in Madau & Dickinson (2014) with Chabrier (2003) IMF,
| (5) |
| (6) |
and obtain the number densities of the galaxies as a function of their total SFR. We then integrate the SFR function with a range from mag following previous studies (e.g., Bouwens et al., 2012, 2021).
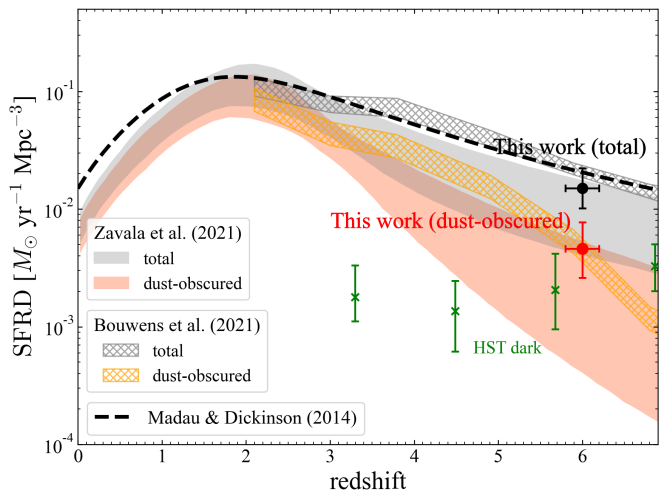
Figure 7 shows the SFRD as a function of redshift. Our total and dust-obscured SFRD estimates are represented in the black and red-filled circles respectively. Our analyses indicate that the dust-obscured star formation in UV-selected galaxies contributes to the total star formation at . This contribution is slightly larger than that predicted in Bouwens et al. (2021), . The reason for this discrepancy comes from our adoption of the Fudamoto et al. (2020a) IRX- relation, which is shallower IRX but smaller intrinsic of -2.62 than the Meurer relation used in Bouwens et al. (2021). Our estimation of the contribution of the dust-obscured star formation is near the upper bound of the results in Zavala et al. (2021) while their study focuses on dusty galaxies identified with ALMA.
For a further comparison, we also calculate the SFRD with the different combinations of the – and IRX- relation. We test the following two cases with bluer UV slopes than our fiducial estimate above to consider the possibility that the slope is overestimated as discussed in Section 4.1: (1) linear – and SMC IRX- relation (2) linear – and Calzetti IRX- relation. The calculated SFRDs are listed in Table 3. We find that the IRX- relation has a more profound impact on the resulting SFRD than the – relation, but the maximum contribution of the dust-obscured star formation is even with aggressive dust correction assumptions of (2), which is not preferred from the IRX measurements in this study. Thus, we conclude that the contribution of the dust-obscured star formation activity from LBGs is not dominant and the assumption of the dust correction does not strongly change the total SFRD at . Note that our estimations of the dust-obscured star formation miss very dusty galaxies such as SMGs (e.g., Dudzevičiūtė et al., 2020) or HST-dark galaxies (Wang et al., 2019) given our focus on the UV-bright galaxies. Recent JWST investigation on HST-dark galaxies imply an almost constant contribution of the dust-obscured star formation activity from faint dusty galaxies from to (Barrufet et al., 2023b), although their contributions are predicted to be comparable with that of our estimation at .
4.3 Obscured fraction of the star formation
Apart from using the - and IRX- relationships, the dust-obscured star formation in LBGs can be estimated through the direct compilation of the obscured fraction of the star formation, presented as a function of either stellar mass or absolute UV magnitude (- or -). The obscured fraction is defined by the ratio of the obscured star formation rate () to the total (UV+IR) star formation rate (). The dust-obscured SFRD is directly derived via the UV luminosity function and - relation in a similar way to that via the stellar mass function and - relation utilized in some previous studies (e.g., Algera et al., 2023b).
| assumption | total | dust-obscured | |
|---|---|---|---|
| – + IRX- | |||
| B14+This work | Fudamoto et al. (2020c) | ||
| B14 extrapolation | SMC | ||
| B14 extrapolation | Meurer | ||
| – | |||
| This work | |||
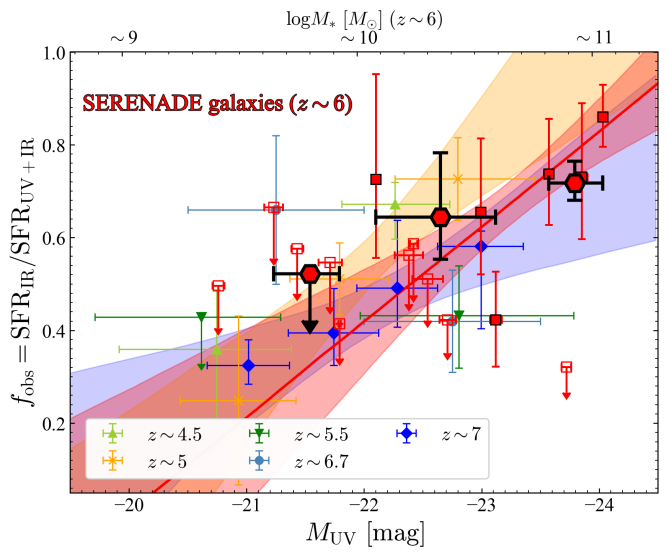
To investigate the - relation for the SERENADE galaxies, we split the sample into three distinct bins, =[-24.5, -23.5], [-23.5, -22.0] and [-22.0, -20.5]. Owing to the limited observation in m within the =[-22.0, -20.5] range, we conduct the stacking analysis for just the rest-frame 158, rather than limiting the sample to the galaxies observed in both Band-6 and Band-8. Following the methodologies in Section 3.4 and 3.3, we estimate stacked dust continuum fluxes and convert them to assuming an optically-thin MBB profile with and to perform a fair comparison with the previous results (Fudamoto et al., 2020a; Algera et al., 2023b). Then we calculate by translating the inferred into and the average of the bin into . We also calculate individual for reference.
Figure 8 shows the derived individual and stacked values in red markers. The best-fit - relation and 1 uncertainties estimated by bootstrap are also shown in red solid line and shaded area. Given that previous studies at , 5.5, and 7 have measured the relative to the stellar mass, we convert them to based on the scaling relations in Song et al. (2016). We note that the conversion is just for reference given the large uncertainties in the star formation histories of high- galaxies (e.g., Tacchella et al., 2022; Stiavelli et al., 2023; Looser et al., 2023). Our results show a good agreement in the range of with the previous result at , and add a constraint within the range of =[-24.5, -23.5] corresponding to . Our best-fit relation at shows a positive trend between the UV brightness and . This is similar to the previous results showing positive trends with at , , and from ALPINE, CRISTAL and REBELS survey (Fudamoto et al., 2020a; Algera et al., 2023b, Mitsuhashi et al. in prep). Our results show slightly higher than that of ALPINE galaxies at (Fudamoto et al., 2020a) at the range of –11.1 corresponding . Selecting targets on the basis of Ly- emission might induce a bias toward dust-poor galaxies, and result in the slightly lower in Fudamoto et al. (2020a). While a significant population (90%) of the ALPINE galaxies within –11.1 are identified by Ly- emission (Faisst et al., 2020b), only 50% of the SERENADE galaxies show Ly- emission. Bowler et al. (2023) suggest the anti-correlation between and at , which is contrary to the other results at . As described in Section 3.2, the effect of scatter in the obscuration or geometry of their target galaxies may be one of the causes of this difference.
Based on the estimated - relation and the UV luminosity function presented in Harikane et al. (2022), we calculate the total and the dust-obscured SFRD, following in Section 4.2. The calculated SFRDs are shown in Table 3, corroborating the limited contribution of the dust-obscured star formation activity from LBGs () as shown in Section 4.2.

4.4 evolution
In Figure 9, we plot as a function of the redshift. Among 28 galaxies covered in the multi-band observations, we plot 21 galaxies that are individually detected in Band-6 and/or Band-8, allowing us to measure . To estimate average at –7, we also perform the stacking analysis of the galaxies observed in both 88 and 158 . From the 28 galaxies, we exclude four galaxies due to the different rest-frame wavelength coverage and two galaxies as in Section 3.4, resulting in a total of 22 galaxies for the stacking analysis. We conduct an average stack and estimate and its uncertainty from MBB fitting with the Gaussian prior as described in Section 3.5. There is no major difference in the resulting when we use a median stacking instead of the average stacking. Individual measurements from SERENADE (red circles) and additional galaxies from the literature (orange circles) are shown, along with the stacked result (magenta hexagon). The stacked result suggests that an average dust temperature is . Our results support the linear relation of (Schreiber et al., 2018) rather than the quadratic relation (Viero et al., 2022). The individual measurements have a large scatter of at –8 (see also, Hashimoto et al., 2019; Laporte et al., 2019; Faisst et al., 2020a; Sugahara et al., 2021; Bakx et al., 2020, 2021; Witstok et al., 2022; Algera et al., 2023a).
5 Discussion
As shown in the previous section, our result of supports a mild increase of as a function of redshift. The theoretical predictions from Liang et al. (2019) also support our result, where they expect an increase of sSFR may result in an increasing trend of against the redshift. Our result matches the evolution trend presented in Sommovigo et al. (2022) with gas column density of under the optically thin assumption, where they predict that increasing trend of against redshift associates with higher SFR or shorter gas depletion timescale () at high- (see also, Vallini et al., 2024).
To better understand the increasing trend of , we calculate the evolution by combining the analytical model presented in Sommovigo et al. (2022) with recent observational constraints. Since an average stellar mass of galaxies are , we calculate evolution with . We start with equations (7) and (9) in Sommovigo et al. (2022),
| (7) |
and
| (8) |
where Equation (7) can be obtained by integrating Equation (2) with . The dust mass can be calculated from the gas mass, , where represents the dust-to-gas ratio proportional to the metallicity as shown in equation (3) in Sommovigo et al. (2022). Here and are the conversion factor from the UV luminosity to the SFR (=) and the intrinsic UV luminosity, respectively. and represent the effective dust attenuation optical depth at 1500Å and Galactic dust-to-gas ratio, respectively. A combination of these equations results in
| (9) |
where represents the gas depletion timescale (=). For the redshift evolution of the metallicity, we assume a power-law dependence of with a value of at (Sanders et al., 2021), which is consistent with recent JWST observations (Nakajima et al., 2023; Curti et al., 2023). As the metallicity dependence with redshift is still uncertain at (Nakajima et al., 2023; Curti et al., 2023), we also compute the redshift evolution under the assumption of no metallicity evolution at . We use following in Tacconi et al. (2020) for the Chabrier IMF. Assuming and (Rémy-Ruyer et al., 2014), equation (9) becomes
| (10) |
Here we use to match the observation at , 27.2 K, in Schreiber et al. (2018) for galaxies with –. The value can be converted to with
| (11) |
based on equation (8), which is consistent with the measurements up to (Heinis et al., 2014; Whitaker et al., 2017; Fudamoto et al., 2020a; Algera et al., 2023b). We plot the calculated evolution in Figure 9. The calculated matches our observational estimate for –7 galaxies ().
The observed scatter of among –7 galaxies () can also be naturally explained by dispersions in the and (so-called main sequence) relations. The dispersion from the main sequence (MS) of (see Tacconi et al., 2020) results in the change of . A variance of (see Sanders et al., 2021) from an average relationship also changes by . Based on the fundamental mass-metallicity relation, the metallicity decreases with increasing SFR at the fixed stellar mass (e.g., Andrews & Martini, 2013). Therefore, the positive offset from the MS may correlate with the negative offset in the average relation, and both offsets result in the positive offset in . A sum of the dispersions in the MS and relation is , which is comparable to our observational result for the scatter in . We note that the assumption of (the Gaussian prior with and ) does not strongly contribute to the spread of given a small dispersion in the best-fit values of corresponding to . The sampling of the continuum SED at longer wavelengths is necessary to obtain more precise values. Interestingly, the high in the MACS0416-Y1 (Tamura et al., 2019; Bakx et al., 2020) can also be explained by our calculation, since its high sSFR (, corresponding to –1.6 dex; Speagle et al. 2014; Topping et al. 2022) and low metallicity (–) are consistent with the measured lower limit of the dust temperature of . Although our targeted galaxies do not have stellar mass or the metallicity estimates due to the lack of rest-frame optical coverage, future JWST observations may be able to confirm what changes .
6 Summary and Conclusions
In this paper, we have examined the dust continuum emissions of 28 LBGs at –8 by utilizing multi-band dust-continuum observations obtained with ALMA. We conduct the MBB fitting with the MCMC algorithm to constrain parameters characterizing the FIR SEDs such as and . The 11 galaxies newly observed in our program, SERENADE, are originally UV-selected but cover a wide range of that spans from dust-poor galaxies (non-detection) to HyLIRG-class galaxies. The brightest galaxies in among our target galaxies exhibit intense starbursts comparable with the dusty star-forming galaxies at . From the individual measurements as well as the stacking analysis, we have found:
-
•
The IRX- relation derived from multi-band observations at appears to be lower than that at at . Our observational constraints show good agreement with the previous results based on single-band ALMA observations. The dust-obscured star formation calculated with the - relation including fainter galaxies in literature and the IRX- relations consistent with our results suggest contribution to the total SFRD at .
-
•
The - relation at is consistent with the results at and . The contribution of dust-obscured star formation among LBGs based on the - relation comprises of total SFRD, consistent with our estimates based on the - and IRX- relations within errors.
-
•
We present dust temperature measurements of LBGs at . Our measurements remain consistent with a linear redshift evolution []. On the basis of the analytical model presented in Sommovigo et al. (2022), we calculate the average evolution of by combining (Tacconi et al., 2020) and evolution (Sanders et al., 2021) for galaxies with consistent with the recent JWST measurements in Nakajima et al. (2023) and Curti et al. (2023). The calculated evolution exhibits an excellent agreement with our measurements at as well as literature results at . The large observed scatter in can be interpreted as the results from the scatter around the star formation main sequence and the average mass-metallicity relation.
Since ALMA has capabilities of high-frequency observation in Band-9/10, future ALMA high-frequency observations for a large sample of galaxies will further improve constraints and enable us to reach more precise conclusions. The recent JWST discovery of a large fraction of the broad line AGN (Type-1, Harikane et al., 2023c; Maiolino et al., 2023; Matthee et al., 2023; Kocevski et al., 2023) may suggest that the IR luminosity and the dust temperature are boosted by the possible presence of Type-2 AGN, as shown in McKinney et al. (2021, see also, , ), although the estimated luminosity-weighted dust temperatures in this work have a very good agreement with those without strong effect of the AGN in the cosmological simulation (Di Mascia et al., 2021). Spetially-resolved observations in Band-9/10 may allow us to evaluate the AGN contribution to the radiation in FIR wavelength. Also, future ALMA wideband sensitivity upgrades will enable us to access the very faint dust continuum from high- galaxies to constrain the IRX or values of UV faint galaxies.
Appendix A flux comparison
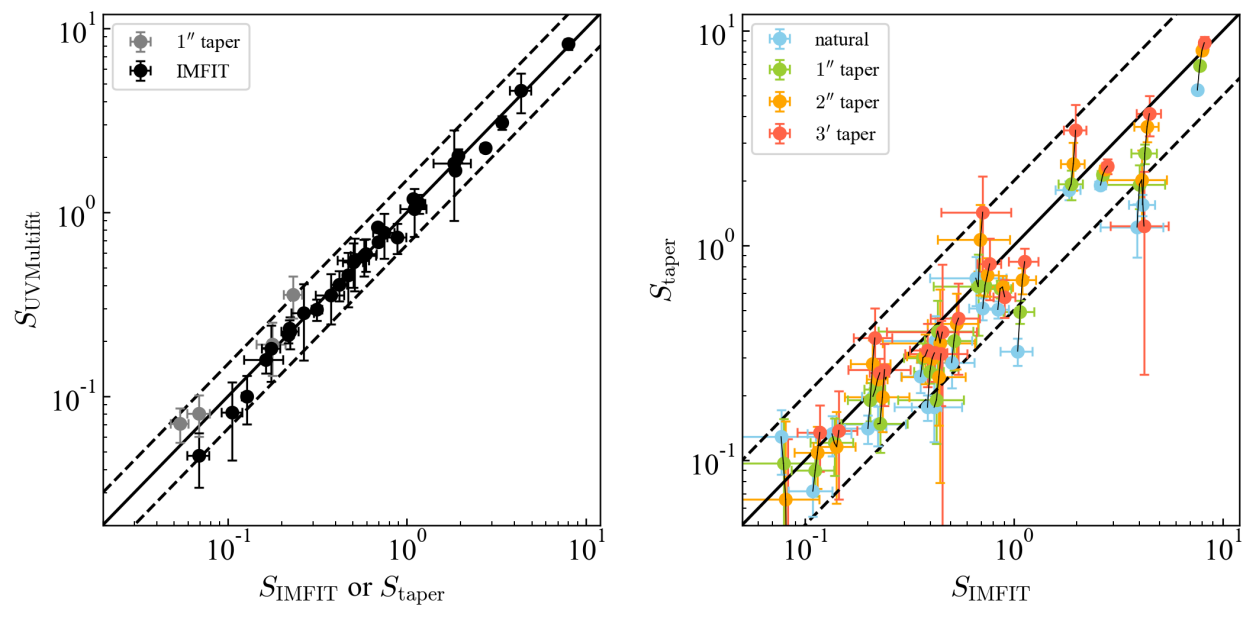
Because the amplitude of the visibilities at the zero baseline length could be a good indicator of the total flux, we also measure the fluxes from visibility data with UVMultifit assuming Sérsic index just to check the flux recovery. Details of this visibility-based analysis will be presented in Mitsuhashi et al. (in prep).
In Figure 10, we compare the flux densities calculated with the different methodologies. Figure 10 (left) compares the fluxes derived from visibility fitting with UVMultifit and from the image-based measurement. As described in Section 3, we apply two different ways to measure fluxes in the image, the CASA task imfit or peak flux with the Tapered images. We find a very good consistency between visibility- and image-based flux densities we used in this work.
Figure 10 (right) plots the flux densities based on the CASA/imfit against the peak flux in the images with different taper scales. The taper scale needed to recover total fluxes changes depending on the spatial extent of the sources. The uncertainties in the taper scales of tend to be larger than those from imfit although taper scales of – are necessary to recover the fluxes.
References
- Aihara et al. (2018) Aihara, H., Arimoto, N., Armstrong, R., et al. 2018, PASJ, 70, S4
- Aihara et al. (2022) Aihara, H., AlSayyad, Y., Ando, M., et al. 2022, PASJ, 74, 247
- Akins et al. (2022) Akins, H. B., Fujimoto, S., Finlator, K., et al. 2022, ApJ, 934, 64
- Algera et al. (2023a) Algera, H., Inami, H., Sommovigo, L., et al. 2023a, arXiv e-prints, arXiv:2301.09659
- Algera et al. (2023b) Algera, H. S. B., Inami, H., Oesch, P. A., et al. 2023b, MNRAS, 518, 6142
- Álvarez-Márquez et al. (2019) Álvarez-Márquez, J., Burgarella, D., Buat, V., Ilbert, O., & Pérez-González, P. G. 2019, A&A, 630, A153
- Álvarez-Márquez et al. (2016) Álvarez-Márquez, J., Burgarella, D., Heinis, S., et al. 2016, A&A, 587, A122
- Andrews & Martini (2013) Andrews, B. H., & Martini, P. 2013, ApJ, 765, 140
- Bakx et al. (2020) Bakx, T. J. L. C., Tamura, Y., Hashimoto, T., et al. 2020, MNRAS, 493, 4294
- Bakx et al. (2021) Bakx, T. J. L. C., Sommovigo, L., Carniani, S., et al. 2021, MNRAS, 508, L58
- Barrufet et al. (2023a) Barrufet, L., Oesch, P. A., Bouwens, R., et al. 2023a, MNRAS, 522, 3926
- Barrufet et al. (2023b) Barrufet, L., Oesch, P. A., Weibel, A., et al. 2023b, MNRAS, 522, 449
- Béthermin et al. (2015) Béthermin, M., Daddi, E., Magdis, G., et al. 2015, A&A, 573, A113
- Béthermin et al. (2020) Béthermin, M., Fudamoto, Y., Ginolfi, M., et al. 2020, A&A, 643, A2
- Bouwens et al. (2023a) Bouwens, R., Illingworth, G., Oesch, P., et al. 2023a, MNRAS, 523, 1009
- Bouwens et al. (2007) Bouwens, R. J., Illingworth, G. D., Franx, M., & Ford, H. 2007, ApJ, 670, 928
- Bouwens et al. (2012) Bouwens, R. J., Illingworth, G. D., Oesch, P. A., et al. 2012, ApJ, 754, 83
- Bouwens et al. (2014) —. 2014, ApJ, 793, 115
- Bouwens et al. (2015) —. 2015, ApJ, 803, 34
- Bouwens et al. (2021) Bouwens, R. J., Oesch, P. A., Stefanon, M., et al. 2021, AJ, 162, 47
- Bouwens et al. (2022) Bouwens, R. J., Smit, R., Schouws, S., et al. 2022, ApJ, 931, 160
- Bouwens et al. (2023b) Bouwens, R. J., Stefanon, M., Brammer, G., et al. 2023b, MNRAS, 523, 1036
- Bowler et al. (2014) Bowler, R. A. A., Dunlop, J. S., McLure, R. J., et al. 2014, MNRAS, 440, 2810
- Bowler et al. (2023) Bowler, R. A. A., Inami, H., Sommovigo, L., et al. 2023, arXiv e-prints, arXiv:2309.17386
- Bradley et al. (2014) Bradley, L. D., Zitrin, A., Coe, D., et al. 2014, ApJ, 792, 76
- Calzetti et al. (2000) Calzetti, D., Armus, L., Bohlin, R. C., et al. 2000, ApJ, 533, 682
- Capak et al. (2015) Capak, P. L., Carilli, C., Jones, G., et al. 2015, Nature, 522, 455
- Casey (2012) Casey, C. M. 2012, MNRAS, 425, 3094
- Casey et al. (2019) Casey, C. M., Zavala, J. A., Aravena, M., et al. 2019, ApJ, 887, 55
- Casey et al. (2021) Casey, C. M., Zavala, J. A., Manning, S. M., et al. 2021, ApJ, 923, 215
- Chabrier (2003) Chabrier, G. 2003, PASP, 115, 763
- Chary & Elbaz (2001) Chary, R., & Elbaz, D. 2001, ApJ, 556, 562
- Clements et al. (2018) Clements, D. L., Pearson, C., Farrah, D., et al. 2018, MNRAS, 475, 2097
- Coe et al. (2013) Coe, D., Zitrin, A., Carrasco, M., et al. 2013, ApJ, 762, 32
- Cortese et al. (2014) Cortese, L., Fritz, J., Bianchi, S., et al. 2014, MNRAS, 440, 942
- Curti et al. (2023) Curti, M., Maiolino, R., Curtis-Lake, E., et al. 2023, arXiv e-prints, arXiv:2304.08516
- Curtis-Lake et al. (2012) Curtis-Lake, E., McLure, R. J., Pearce, H. J., et al. 2012, MNRAS, 422, 1425
- da Cunha et al. (2013) da Cunha, E., Groves, B., Walter, F., et al. 2013, ApJ, 766, 13
- da Cunha et al. (2021) da Cunha, E., Hodge, J. A., Casey, C. M., et al. 2021, ApJ, 919, 30
- Di Mascia et al. (2021) Di Mascia, F., Gallerani, S., Behrens, C., et al. 2021, MNRAS, 503, 2349
- Dudzevičiūtė et al. (2020) Dudzevičiūtė, U., Smail, I., Swinbank, A. M., et al. 2020, MNRAS, 494, 3828
- Ellis et al. (2013) Ellis, R. S., McLure, R. J., Dunlop, J. S., et al. 2013, ApJ, 763, L7
- Faisst et al. (2020a) Faisst, A. L., Fudamoto, Y., Oesch, P. A., et al. 2020a, MNRAS, 498, 4192
- Faisst et al. (2020b) Faisst, A. L., Schaerer, D., Lemaux, B. C., et al. 2020b, ApJS, 247, 61
- Ferrara et al. (2017) Ferrara, A., Hirashita, H., Ouchi, M., & Fujimoto, S. 2017, MNRAS, 471, 5018
- Ferrara et al. (2022) Ferrara, A., Sommovigo, L., Dayal, P., et al. 2022, MNRAS, 512, 58
- Finkelstein et al. (2015) Finkelstein, S. L., Ryan, Russell E., J., Papovich, C., et al. 2015, ApJ, 810, 71
- Fudamoto et al. (2020a) Fudamoto, Y., Oesch, P. A., Faisst, A., et al. 2020a, A&A, 643, A4
- Fudamoto et al. (2020b) Fudamoto, Y., Oesch, P. A., Magnelli, B., et al. 2020b, MNRAS, 491, 4724
- Fudamoto et al. (2020c) Fudamoto, Y., Oesch, P. A., Faisst, A., et al. 2020c, A&A, 643, A4
- Fudamoto et al. (2021) Fudamoto, Y., Oesch, P. A., Schouws, S., et al. 2021, Nature, 597, 489
- Fujimoto et al. (2023) Fujimoto, S., Kohno, K., Ouchi, M., et al. 2023, arXiv e-prints, arXiv:2303.01658
- Gordon et al. (2003) Gordon, K. D., Clayton, G. C., Misselt, K. A., Landolt, A. U., & Wolff, M. J. 2003, ApJ, 594, 279
- Gruppioni et al. (2020) Gruppioni, C., Béthermin, M., Loiacono, F., et al. 2020, A&A, 643, A8
- Harikane et al. (2020a) Harikane, Y., Laporte, N., Ellis, R. S., & Matsuoka, Y. 2020a, ApJ, 902, 117
- Harikane et al. (2023a) Harikane, Y., Nakajima, K., Ouchi, M., et al. 2023a, arXiv e-prints, arXiv:2304.06658
- Harikane et al. (2020b) Harikane, Y., Ouchi, M., Inoue, A. K., et al. 2020b, ApJ, 896, 93
- Harikane et al. (2022) Harikane, Y., Ono, Y., Ouchi, M., et al. 2022, ApJS, 259, 20
- Harikane et al. (2023b) Harikane, Y., Ouchi, M., Oguri, M., et al. 2023b, ApJS, 265, 5
- Harikane et al. (2023c) Harikane, Y., Zhang, Y., Nakajima, K., et al. 2023c, arXiv e-prints, arXiv:2303.11946
- Hashimoto et al. (2019) Hashimoto, T., Inoue, A. K., Mawatari, K., et al. 2019, PASJ, 71, 71
- Heinis et al. (2014) Heinis, S., Buat, V., Béthermin, M., et al. 2014, MNRAS, 437, 1268
- Huang et al. (2016) Huang, K.-H., Bradač, M., Lemaux, B. C., et al. 2016, ApJ, 817, 11
- Inami et al. (2022) Inami, H., Algera, H. S. B., Schouws, S., et al. 2022, MNRAS, 515, 3126
- Inoue et al. (2020) Inoue, A. K., Hashimoto, T., Chihara, H., & Koike, C. 2020, MNRAS, 495, 1577
- Jarvis et al. (2013) Jarvis, M. J., Bonfield, D. G., Bruce, V. A., et al. 2013, MNRAS, 428, 1281
- Khusanova et al. (2021) Khusanova, Y., Bethermin, M., Le Fèvre, O., et al. 2021, A&A, 649, A152
- Knudsen et al. (2017) Knudsen, K. K., Watson, D., Frayer, D., et al. 2017, MNRAS, 466, 138
- Kocevski et al. (2023) Kocevski, D. D., Onoue, M., Inayoshi, K., et al. 2023, ApJ, 954, L4
- Lamperti et al. (2019) Lamperti, I., Saintonge, A., De Looze, I., et al. 2019, MNRAS, 489, 4389
- Laporte et al. (2019) Laporte, N., Katz, H., Ellis, R. S., et al. 2019, MNRAS, 487, L81
- Lawrence et al. (2007) Lawrence, A., Warren, S. J., Almaini, O., et al. 2007, MNRAS, 379, 1599
- Lee et al. (2011) Lee, K.-S., Dey, A., Reddy, N., et al. 2011, ApJ, 733, 99
- Liang et al. (2019) Liang, L., Feldmann, R., Kereš, D., et al. 2019, MNRAS, 489, 1397
- Lilly et al. (1996) Lilly, S. J., Le Fevre, O., Hammer, F., & Crampton, D. 1996, ApJ, 460, L1
- Looser et al. (2023) Looser, T. J., D’Eugenio, F., Maiolino, R., et al. 2023, arXiv e-prints, arXiv:2302.14155
- Ma et al. (2019) Ma, X., Hayward, C. C., Casey, C. M., et al. 2019, MNRAS, 487, 1844
- Madau & Dickinson (2014) Madau, P., & Dickinson, M. 2014, ARA&A, 52, 415
- Madau et al. (1996) Madau, P., Ferguson, H. C., Dickinson, M. E., et al. 1996, MNRAS, 283, 1388
- Magnelli et al. (2009) Magnelli, B., Elbaz, D., Chary, R. R., et al. 2009, A&A, 496, 57
- Magnelli et al. (2011) —. 2011, A&A, 528, A35
- Magnelli et al. (2013) Magnelli, B., Popesso, P., Berta, S., et al. 2013, A&A, 553, A132
- Magnelli et al. (2014) Magnelli, B., Lutz, D., Saintonge, A., et al. 2014, A&A, 561, A86
- Mainali et al. (2018) Mainali, R., Zitrin, A., Stark, D. P., et al. 2018, MNRAS, 479, 1180
- Maiolino et al. (2023) Maiolino, R., Scholtz, J., Curtis-Lake, E., et al. 2023, arXiv e-prints, arXiv:2308.01230
- Mallery et al. (2012) Mallery, R. P., Mobasher, B., Capak, P., et al. 2012, ApJ, 760, 128
- Marrone et al. (2018) Marrone, D. P., Spilker, J. S., Hayward, C. C., et al. 2018, Nature, 553, 51
- Matsuoka et al. (2016) Matsuoka, Y., Onoue, M., Kashikawa, N., et al. 2016, ApJ, 828, 26
- Matsuoka et al. (2018a) —. 2018a, PASJ, 70, S35
- Matsuoka et al. (2018b) Matsuoka, Y., Iwasawa, K., Onoue, M., et al. 2018b, ApJS, 237, 5
- Matsuoka et al. (2019) —. 2019, ApJ, 883, 183
- Matthee et al. (2023) Matthee, J., Naidu, R. P., Brammer, G., et al. 2023, arXiv e-prints, arXiv:2306.05448
- McKinney et al. (2021) McKinney, J., Hayward, C. C., Rosenthal, L. J., et al. 2021, ApJ, 921, 55
- Mehta et al. (2018) Mehta, V., Scarlata, C., Capak, P., et al. 2018, ApJS, 235, 36
- Meurer et al. (1999) Meurer, G. R., Heckman, T. M., & Calzetti, D. 1999, ApJ, 521, 64
- Moutard et al. (2020) Moutard, T., Sawicki, M., Arnouts, S., et al. 2020, MNRAS, 494, 1894
- Nakajima et al. (2023) Nakajima, K., Ouchi, M., Isobe, Y., et al. 2023, arXiv e-prints, arXiv:2301.12825
- Oesch et al. (2010) Oesch, P. A., Bouwens, R. J., Carollo, C. M., et al. 2010, ApJ, 725, L150
- Oesch et al. (2013) Oesch, P. A., Bouwens, R. J., Illingworth, G. D., et al. 2013, ApJ, 773, 75
- Ono et al. (2018) Ono, Y., Ouchi, M., Harikane, Y., et al. 2018, PASJ, 70, S10
- Overzier et al. (2011) Overzier, R. A., Heckman, T. M., Wang, J., et al. 2011, ApJ, 726, L7
- Pettini et al. (1998) Pettini, M., Kellogg, M., Steidel, C. C., et al. 1998, ApJ, 508, 539
- Pierre et al. (2004) Pierre, M., Valtchanov, I., Altieri, B., et al. 2004, J. Cosmology Astropart. Phys, 2004, 011
- Planck Collaboration et al. (2014) Planck Collaboration, Abergel, A., Ade, P. A. R., et al. 2014, A&A, 571, A11
- Prevot et al. (1984) Prevot, M. L., Lequeux, J., Maurice, E., Prevot, L., & Rocca-Volmerange, B. 1984, A&A, 132, 389
- Reddy et al. (2010) Reddy, N. A., Erb, D. K., Pettini, M., Steidel, C. C., & Shapley, A. E. 2010, ApJ, 712, 1070
- Reddy et al. (2015) Reddy, N. A., Kriek, M., Shapley, A. E., et al. 2015, ApJ, 806, 259
- Reddy et al. (2018) Reddy, N. A., Oesch, P. A., Bouwens, R. J., et al. 2018, ApJ, 853, 56
- Rémy-Ruyer et al. (2014) Rémy-Ruyer, A., Madden, S. C., Galliano, F., et al. 2014, A&A, 563, A31
- Reuter et al. (2020) Reuter, C., Vieira, J. D., Spilker, J. S., et al. 2020, ApJ, 902, 78
- Riechers et al. (2013) Riechers, D. A., Bradford, C. M., Clements, D. L., et al. 2013, Nature, 496, 329
- Robertson et al. (2010) Robertson, B. E., Ellis, R. S., Dunlop, J. S., McLure, R. J., & Stark, D. P. 2010, Nature, 468, 49
- Sanders et al. (2021) Sanders, R. L., Shapley, A. E., Jones, T., et al. 2021, ApJ, 914, 19
- Sawicki (2012) Sawicki, M. 2012, PASP, 124, 1208
- Schouws et al. (2022) Schouws, S., Stefanon, M., Bouwens, R., et al. 2022, ApJ, 928, 31
- Schreiber et al. (2018) Schreiber, C., Elbaz, D., Pannella, M., et al. 2018, A&A, 609, A30
- Scoville et al. (2007) Scoville, N., Aussel, H., Brusa, M., et al. 2007, ApJS, 172, 1
- Smit et al. (2018) Smit, R., Bouwens, R. J., Carniani, S., et al. 2018, Nature, 553, 178
- Sommovigo et al. (2021) Sommovigo, L., Ferrara, A., Carniani, S., et al. 2021, MNRAS, 503, 4878
- Sommovigo et al. (2020) Sommovigo, L., Ferrara, A., Pallottini, A., et al. 2020, MNRAS, 497, 956
- Sommovigo et al. (2022) —. 2022, MNRAS, 513, 3122
- Song et al. (2016) Song, M., Finkelstein, S. L., Ashby, M. L. N., et al. 2016, ApJ, 825, 5
- Speagle et al. (2014) Speagle, J. S., Steinhardt, C. L., Capak, P. L., & Silverman, J. D. 2014, ApJS, 214, 15
- Steidel et al. (1999) Steidel, C. C., Adelberger, K. L., Giavalisco, M., Dickinson, M., & Pettini, M. 1999, ApJ, 519, 1
- Stiavelli et al. (2023) Stiavelli, M., Morishita, T., Chiaberge, M., et al. 2023, ApJ, 957, L18
- Sugahara et al. (2021) Sugahara, Y., Inoue, A. K., Hashimoto, T., et al. 2021, ApJ, 923, 5
- Tacchella et al. (2022) Tacchella, S., Finkelstein, S. L., Bagley, M., et al. 2022, ApJ, 927, 170
- Tacconi et al. (2020) Tacconi, L. J., Genzel, R., & Sternberg, A. 2020, ARA&A, 58, 157
- Takeuchi et al. (2012) Takeuchi, T. T., Yuan, F.-T., Ikeyama, A., Murata, K. L., & Inoue, A. K. 2012, ApJ, 755, 144
- Tamura et al. (2019) Tamura, Y., Mawatari, K., Hashimoto, T., et al. 2019, ApJ, 874, 27
- Topping et al. (2022) Topping, M. W., Stark, D. P., Endsley, R., et al. 2022, MNRAS, 516, 975
- Traina et al. (2023) Traina, A., Gruppioni, C., Delvecchio, I., et al. 2023, arXiv e-prints, arXiv:2309.15150
- Tsukui et al. (2023) Tsukui, T., Wisnioski, E., Krumholz, M. R., & Battisti, A. 2023, MNRAS, 523, 4654
- Vallini et al. (2024) Vallini, L., Witstok, J., Sommovigo, L., et al. 2024, MNRAS, 527, 10
- Viero et al. (2022) Viero, M. P., Sun, G., Chung, D. T., Moncelsi, L., & Condon, S. S. 2022, MNRAS, 516, L30
- Wang et al. (2019) Wang, T., Schreiber, C., Elbaz, D., et al. 2019, Nature, 572, 211
- Watson et al. (2015) Watson, D., Christensen, L., Knudsen, K. K., et al. 2015, Nature, 519, 327
- Weaver et al. (2022) Weaver, J. R., Kauffmann, O. B., Ilbert, O., et al. 2022, ApJS, 258, 11
- Whitaker et al. (2017) Whitaker, K. E., Pope, A., Cybulski, R., et al. 2017, ApJ, 850, 208
- Willott et al. (2015) Willott, C. J., Carilli, C. L., Wagg, J., & Wang, R. 2015, ApJ, 807, 180
- Witstok et al. (2023) Witstok, J., Jones, G. C., Maiolino, R., Smit, R., & Schneider, R. 2023, MNRAS, 523, 3119
- Witstok et al. (2022) Witstok, J., Smit, R., Maiolino, R., et al. 2022, MNRAS, 515, 1751
- Wong et al. (2022) Wong, Y. H. V., Wang, P., Hashimoto, T., et al. 2022, ApJ, 929, 161
- Yamanaka & Yamada (2019) Yamanaka, S., & Yamada, T. 2019, PASJ, 71, 51
- Zavala et al. (2018) Zavala, J. A., Montaña, A., Hughes, D. H., et al. 2018, Nature Astronomy, 2, 56
- Zavala et al. (2021) Zavala, J. A., Casey, C. M., Manning, S. M., et al. 2021, ApJ, 909, 165