2021
[1]\fnmBenjamin M. \surWynne
1]\orgdivSchool of Physics and Astronomy, \orgnameUniversity of Edinburgh, \orgaddress\cityEdinburgh, \countryUK
2]\orgdivBHF-University Centre for Cardiovascular Science, \orgnameUniversity of Edinburgh, \orgaddress\cityThe Queen’s Medical Research Institute, Edinburgh BioQuarter, \countryUK
3]\orgdivEdinburgh Imaging, \orgnameUniversity of Edinburgh, \orgaddress\cityThe Queen’s Medical Research Institute, Edinburgh BioQuarter, Edinburgh, \countryUK
Parameterised Geant4 simulation for total body PET research
Abstract
Background: Total-body positron emission tomography (PET) imaging has the potential to transform medical care of a number of diseases and augment our knowledge of systems biology. Various detector designs and geometries are currently under development for total-body PET imaging of humans. This variety, in particular the variation in axial field-of-view (aFOV), motivates a need to compare the performance of these devices in a consistent simulated environment.
Methods: We present an open-source Geant4 simulation package that allows variation of relevant parameters such as the detector aFOV and the tracer radioisotope from the command line. Two simplified detector geometries based on the Siemens Biograph Vision Quadra and United Imaging uEXPLORER models are supported with variable granularity. The intrinsic radioactivity of the detector crystals is fully simulated. The simulation can be viewed with the built-in GUI, and the results are saved in a plain text format for easy analysis. Example Python analysis code is provided with the simulation, demonstrating calculation of the noise equivalent count rate (NECR) figure of merit using an approximation to the NEMA NU 2-2012 standard method.
Results: A good agreement between the simulated count rate performance and experimental data is observed for both geometries. The differences in results are attributed to simplifications in the simulation code, namely not accounting for the light-collection efficiency or readout dead-time. We demonstrate the importance of assessing the scanner performance using appropriate phantom length which significantly affects the obtained results. A dependence between the detector aFOV and the length of the source, with peak NECR plateauing as the detector extends beyond the region of interest is also presented.
Conclusion: Simulation allows for the rapid assessment of detector performance in a variety of scenarios, demonstrating a link between aFOV and the test source length that was not explicit in published experimental data. Further studies with low source activity, or detector intrinsic radioactivity, may also demonstrate the importance of detector aFOV.
keywords:
PET, Total-Body PET, Simulation, Geant41 Background
A conventional PET scanner has an axial field-of-view (aFOV, the length of the detector along the cylindrical -axis) of around cm. More recently, ‘total-body’ PET scanners, with aFOV m were proposed cherryTBPET ; StateTBPET , and models with differing geometries and aFOV values are coming to market quadra ; explorer . A total-body PET scanner improves in several aspects compared to previous PET scanners. Its extended axial field of view covers nearly the entire body, allowing to make a single scan without adjusting bed position. This not only provides a more comprehensive insight into the body’s metabolism and the distribution of radiotracers throughout the system but also significantly reduces scan time, enhancing patient comfort and minimising movement artefacts that might impact image quality. The comprehensive perspective offered by total-body PET scanners improves the assessment of how different parts of the body interact and influence each other. This proves especially valuable in pinpointing metastases, tracking disease progression, and devising treatment strategies across multiple body regions simultaneously. A notable enhancement of total-body PET is the reduced radiation dose it offers. This decrease is beneficial for patients, reducing their exposure to radiation, which is of particular importance in paediatric medicine, while maintaining high-quality diagnostic images cherryTBPET .
Assessment of promising research directions, or the consideration of the purchase of expensive new equipment crystal-cost , requires comparison of the performance of different approaches. While simulated and experimental results are available, and National Electrical Manufacturers Association (NEMA) standards are defined for conventional PET scanner characterisation, such comparison can still be cumbersome. Several software packages exist that allow simulation of the transport of particles through matter. These encompass versatile tools such as Geant4 geant4 , EGS4 EGS4 , and MCNP MCNP . Within the domain of medical applications targeted towards PET research, solutions like GATE GATE , PETSIM PETSIM-MC , SIMSET SIMSET , PeneloPET peneloPET , and gPET gPET have been developed. In this article, we demonstrate a Geant4 simulation that allows easy variation of parameters such as aFOV, and provides a consistent environment for evaluating widely-varying technologies. We compare simulated performance with published results for specific geometries and demonstrate more general results by scanning the parameter space.
2 Methods
2.1 Detector simulation
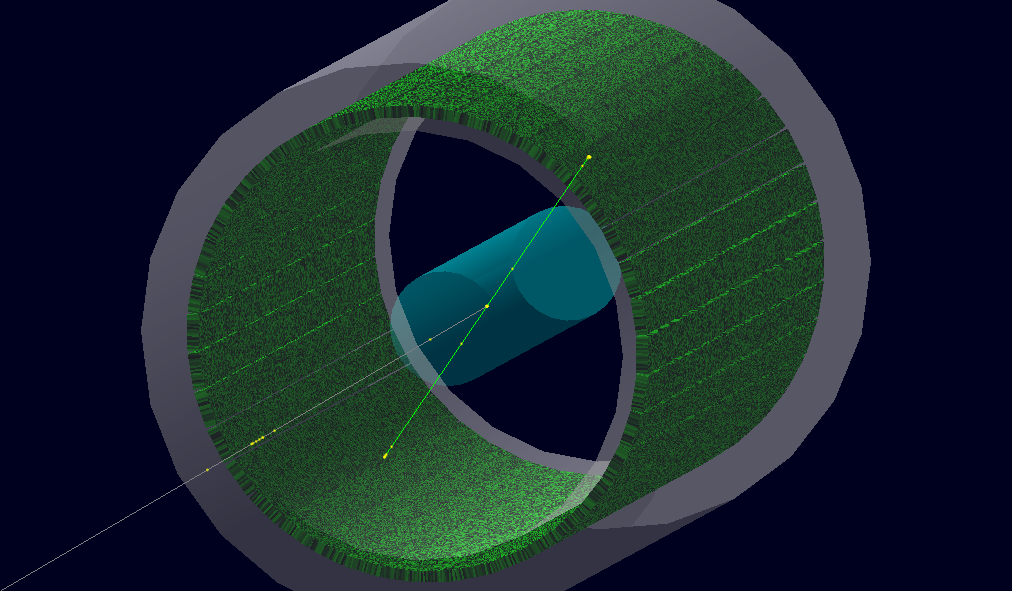
The PET scanner simulation is based on the Geant4 geant4 toolkit and the code is available for download github-repo . A single unit of the scintillating material is defined, and then duplicated many times (potentially O) at different positions. This allows an entire PET detector to be created from a simple mathematical description of the scintillator placement, the parameters of which can then be varied without any corresponding code change. In this way, two simplified detector geometries based on the Siemens Biograph Vision Quadra quadra and United Imaging uEXPLORER explorer models are defined. The smallest unit of scintillator crystal (as described by the manufacturers) is used for each detector, but versions are also available that combine multiple crystals into a single block, allowing a trade-off between simulation fidelity and speed. At present, no attempt is made to simulate the performance of the detector electronics; it is assumed that energy deposited in the scintillator will be recorded. Besides the scintillator crystals, the only other object included in the simulation is a cylindrical polyethylene phantom in the centre of the detector, as illustrated in Figure 1. The default phantom has a diameter of 20.3 cm and a length of 70 cm. The tracer is uniformly distributed along the -axis in the middle of the phantom.
The simulation can run in two modes: either modelling radioactive decay of a tracer isotope, or the intrinsic radioactivity of the detector itself. Individual atoms from either source are allowed to decay using the built-in radioactivity models provided by Geant4. Atoms of the tracer isotope are placed at a random position along the -axis of the detector, i.e. along the centre of the phantom. This is not exactly as defined in the NEMA NU 2 standard NEMA-NU-2-2012 , which requires a linear source parallel to, but offset from, the -axis. However, this change simplifies the geometry of the system allowing for rapid calculation of figures-of-merit such as the noise equivalent count rate (NECR), without compromising the utility of the results. When simulating the intrinsic radioactivity of the detector, atoms are placed at a random and coordinate within the scintillator material, but are constrained to . This takes advantage of the fact that detectors are assumed to be (approximately) symmetrical in , as is the phantom.
The simulation can be run from the command line, specifying parameters such as the aFOV and detector material as arguments. The output data from the simulated decays are saved as a plain text file for ease of use. A 3D-rendering of the detector and simulated events is available, as provided by Geant4 geant4 and shown in Figure 1.
2.2 Analysis
We provide example Python code in the form of Jupyter notebooks, which read the output files from the simulation and can reproduce the results in this communication. The intention is for others to be able to use the simulation in their own analyses, and so these examples are by no means exhaustive or definitive. Nonetheless, our approach is explained below.
PET detectors have characteristically large output datasets, beyond what is practical to simulate on a regular basis. Hence, we use a relatively small (O) collection of simulated decay events for a given detector geometry and randomly resample them over the course of an analysis. When simulating a period of data-taking, radioactive decays are requested at time intervals following a simple Poissonian model, and an event from the simulation is associated with each one. The length of the simulated data-taking period used is 10 ms, again to reduce the resources required by the simulation. High and low energy thresholds defined as 435.0 and 585.0 keV for Siemens Biograph Vision Quadra, and similiarly to 430.0 and 645.0 keV for United Imaging uEXPLORER, are applied for the detected photons, corresponding to recommended clinical values. A coincidence time-window of length ns (consistent with Reference quadra ) is opened if a photon passes the criteria. If at the end of the window exactly two photons have passed the energy requirements, this pair is analysed using a simplified technique.
Rather than constructing sinograms from the photon pairs, we take advantage of the earlier choice to simulate the tracer radioisotope as a linear source along the detector -axis. An approximation to the standard NECR value can be calculated using only values as input. The offset of the line of response from the centre of the detector (i.e. the -axis) is , given the simple geometry shown in Figure 2.

This offset, , is analogous to the “radial distance from maximum pixel [of the sinogram]” used in the NEMA standard, since the line source is guaranteed to lie on the -axis of our simulation. We create a histogram of the values, and events with mm are taken to be background. In the central region mm, the contribution from background is calculated by linear interpolation between the values found at mm. This contribution is subtracted from the total in the central region to give the true events. Events with mm are ignored. The calculation is then re-run with the requirement that both detected photons originated from the same positron, using their identifiers from the simulation output. This allows the (unphysical) elimination of random coincidences, and thus the scattered event rate can be calculated separately, and subtracted from the total background to give the random rate. Thus the rates for all events (), true (), random (), and scatter () events, and NECR () in a data acquisition time, , can be expressed as
Here is the combined background rate, and denotes values calculated with the constraint that detected photons must originate from the same positron. The histogram binning is chosen so that must be bin edges, and so the values and are given by the mean of the counts in the adjacent bins.
2.3 Uncertainty estimation
Emphasising the speed and the simplicity of approach, most example results do not include an uncertainty estimation, only a single value for each data point. However, three sources of experimental uncertainty are examined in a separate calculation.
The calculation of NECR at a given time-point requires the collection of a set of simulated photon pairs. Consequently, there is a Poissonian statistical uncertainty on the NECR value arising from the total number of photon pairs collected. Typically, the relative energy and time resolution values for current-generation PET scanners are around 10% and ns respectively. The impact of these uncertainties is estimated by re-running calculations as a set of pseudoexperiments. In each trial, the energy and detection-time values for the photons have random, Gaussian-distributed perturbations applied, with the Gaussian parameter corresponding to the resolution value. Sampling the simulated data and applying the resolution effects is controlled by an independent random number generator in each pseudoexperiment. The uncertainty is then taken to be the envelope of the results from all pseudoexperiments, and the mean values are taken as nominal. Ten pseudoexperiments are used.
The effect of increasing the number of simulated events collected in a pseudoexperiment is to reduce all the uncertainties mentioned, at the cost of CPU time. For the results presented here, the ms simulated data taking periods give rise to uncertainties of approximately %, and this value should be assumed unless others are explicitly stated.
3 Results
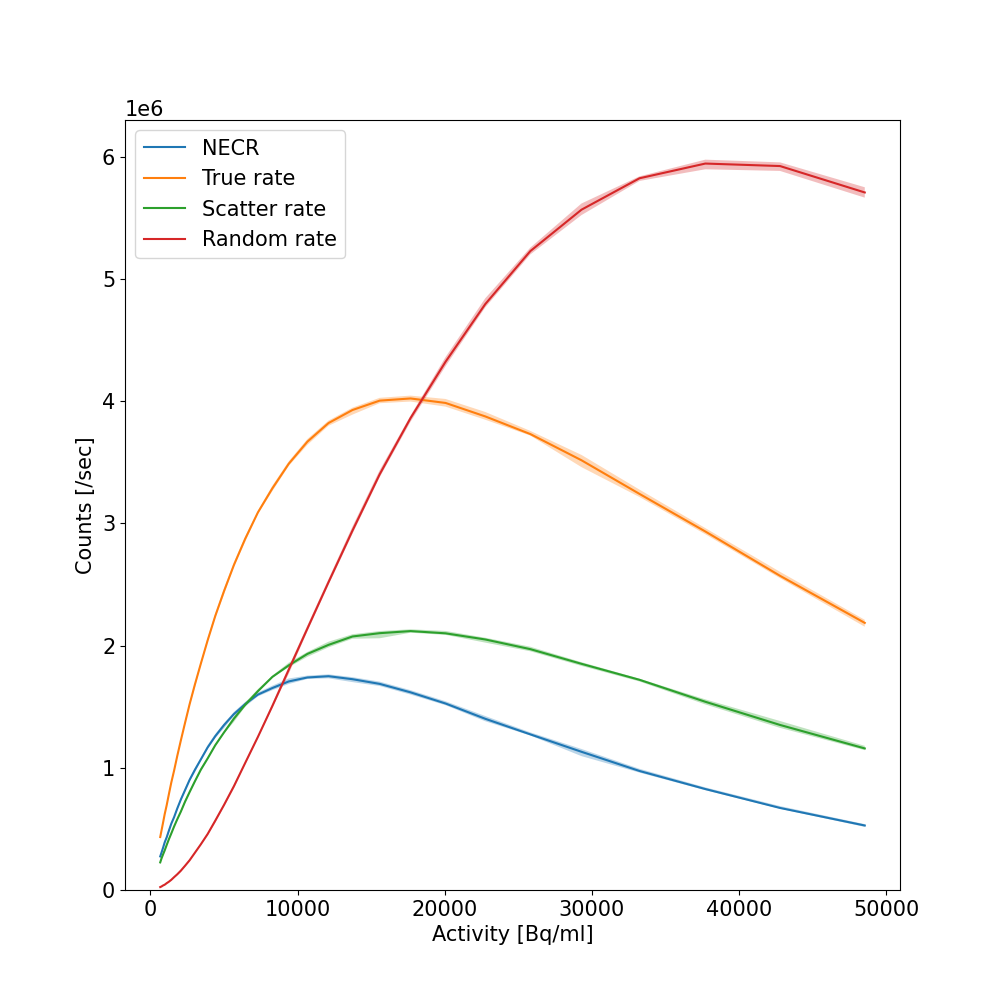
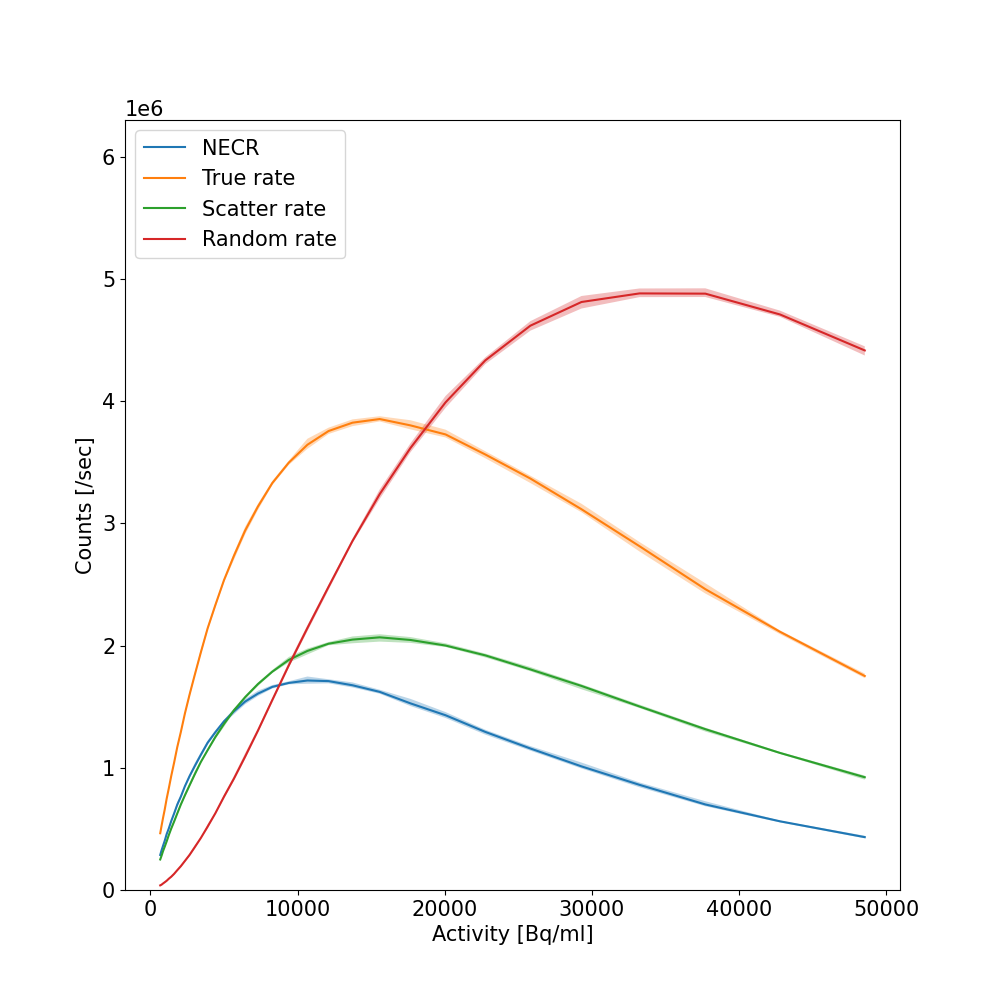
Figure 3 presents the NECR along with the true, scatter and random coincidence rates, calculated following the NEMA NU 2-2012 standard, for the two tested total-body PET geometries. The Siemens Biograph Vision Quadra (Reference quadra , Figure 3(a)) and the United Imaging uEXPLORER (Reference explorer , Figure 3(b)) results show similar maximum NECR of counts/sec at a source activity of kBq/ml. The scatter fraction is stable across the whole activity range and for both geometries is on average 35%, which agrees well with 37% quoted for Siemens quadra and United Imaging explorer scanners.
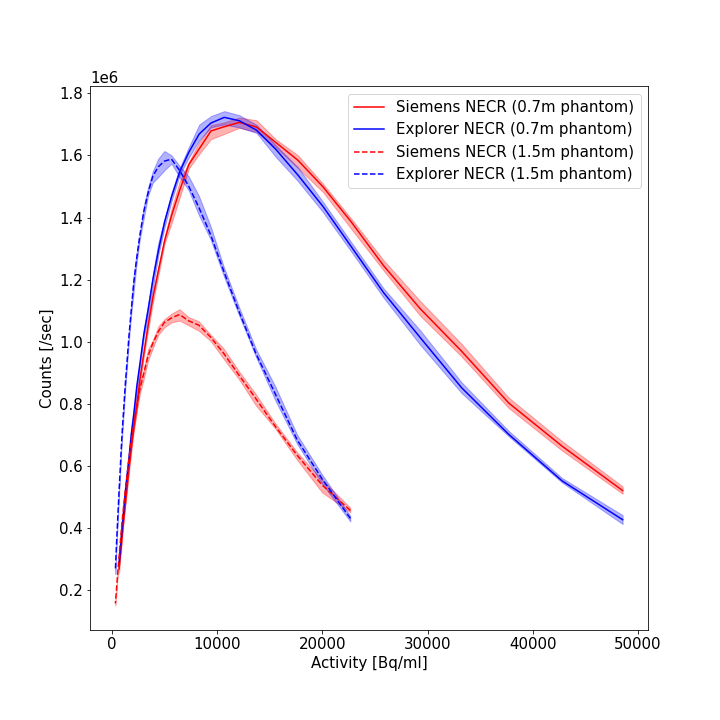
Figure 4 shows a comparison when a 70 cm and cm phantom is used to illustrate effect of phantom length on count rate performance.
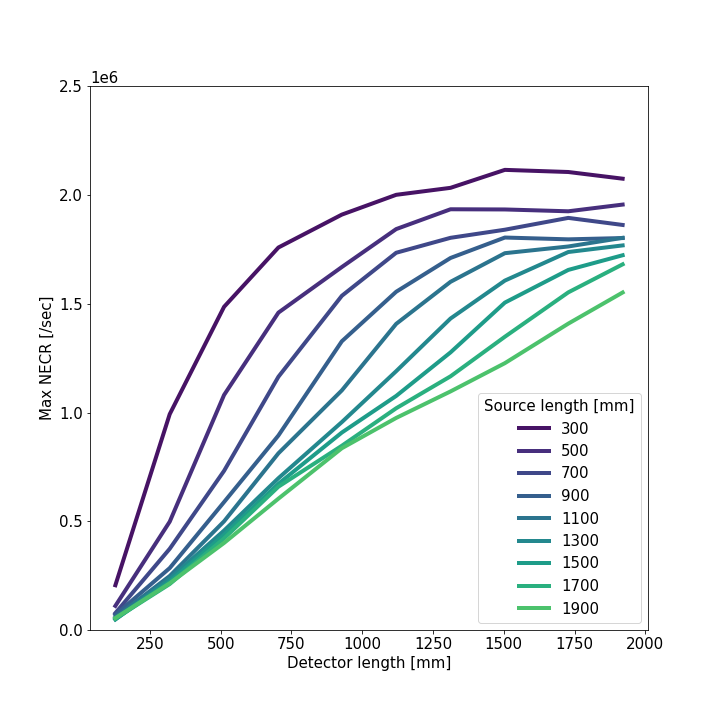
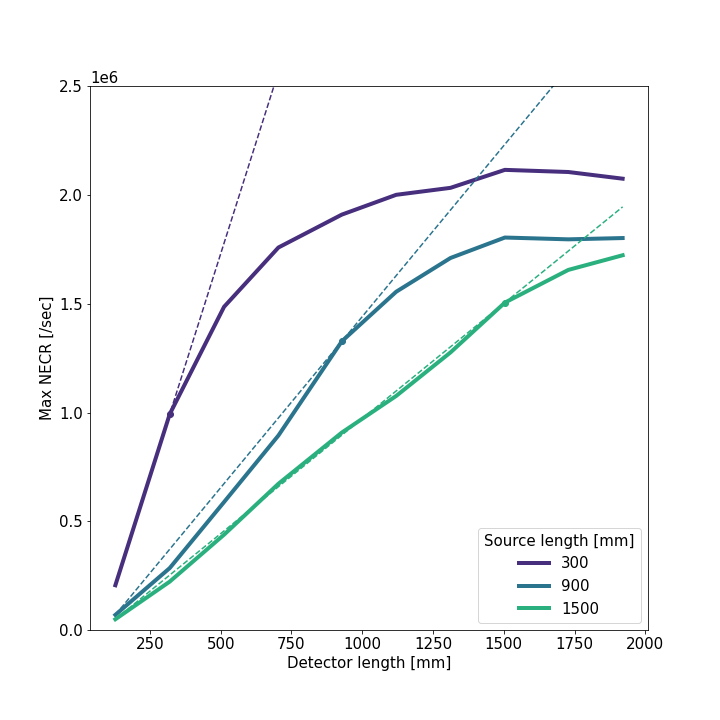
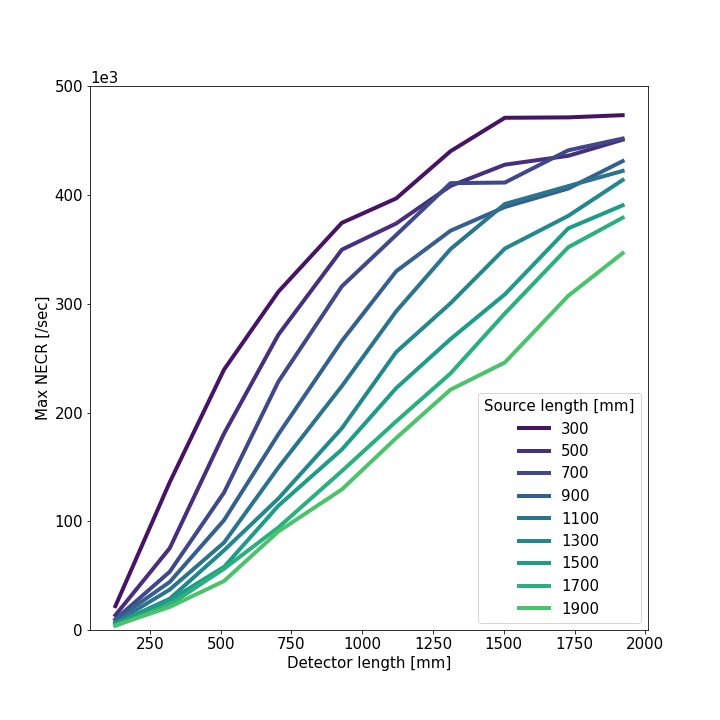
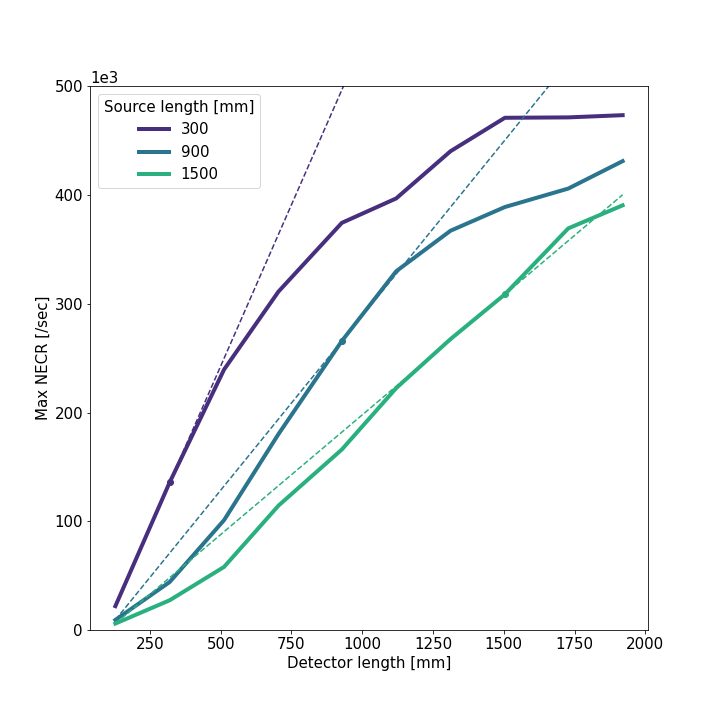
Taking advantage of the parameterised geometry in the simulation, we repeat the study of NECR for a range of detector aFOV values and phantom lengths. All results use aFOV variations of the Siemens Biograph Vision Quadra detector — while there are other distinctions between the Siemens Biograph Vision Quadra and United Imaging uEXPLORER devices (e.g. scintillator material) the choice of aFOV is most significant in this test. For each simulation the starting activity is 1100 MBq following Reference quadra . The peak NECR value is obtained and compared in Figure 5. The same distributions produced with a starting source activity of 20 MBq to avoid a saturation effect are presented in Figure 6.
4 Discussion
The trends of the simulated results shown in Figure 3 differ from experiment, peaking earlier and then declining at higher activity values. This is likely due to the simulation making no attempt to account for light collection efficiency or readout dead-time, thus displaying an idealised detector performance. In the interests of allowing consistent comparison between detector geometries we do not attempt to reproduce more specialised behaviours of the systems, and thus such differences between simulated and experimental results will remain.
It is interesting to note that both detectors have similar performance, despite the United Imaging uEXPLORER aFOV being almost double that of the Siemens Biograph Vision Quadra. This can be explained by the NEMA NU 2-2012 standard phantom for NECR measurement being cm in axial length. Essentially, the phantom is of a similar size to the Biograph Vision Quadra detector, whereas the uEXPLORER detector is significantly longer — length that could be considered wasted in this test. Distributions in Figure 4 demonstrate how important it is to define the phantom length to assess the scanner performance. The 150 cm long phantom extends well beyond the Siemens aFOV, but is still fully enclosed by the uEXPLORER detector. This leads to dramatically reduced performance from the shorter geometry.
We observe an approximately linear relationship between detector aFOV and maximum NECR as presented in Figure 5 and Figure 6, up to the point where the aFOV equals the phantom length. As the detector becomes longer than the phantom, the improvement in performance slows and eventually plateaus. For example, when measuring a mm phantom, tripling the detector aFOV from to mm only results in a doubling of NECR performance, and further extending the detector to mm gives minimal additional benefit. This relationship is shown more clearly in Figure 5(b). Note that each phantom has the same total activity, which explains why the shorter phantoms give the most rapid initial increase in detector performance with length: a greater percentage of the total activity is enclosed for a given increase in aFOV. While increasing the detector aFOV is never demonstrated to be detrimental, the study shows that for a given size region of interest a similar length detector is most efficient. Increasing length beyond the region of interest will improve performance at a limited rate, towards an upper bound. The cost of current detector technology is largely driven by the scintillating crystals used crystal-cost . Extending the aFOV gives a corresponding increase in the amount of scintillator material and thus cost. Once this is accounted for, it is clear that the ideal detector length may be less than the maximum available, depending on the intended use. The potential of total-body PET scanners is to image a full adult body, and here a correspondingly long detector will be preferred. However, if the intention is to study a smaller region of interest (e.g. the torso, or a single organ) then a smaller detector may provide equivalent performance for lower cost.
This effect is not simply geometric: we have shown that it is related to detector saturation when the radiotracer activity is higher. Different detectors may already account for this in the readout by imposing additional criteria on forming photon coincidences (e.g. Reference explorer ) but we do not simulate this. Lower radiotracer activity also reduces potential saturation, although at the cost of the overall reduction in sensitivity that would be expected. For a clinical procedure, less injected radioactivity would be beneficial for the patient, and we have shown that a longer detector aFOV does help recover lost sensitivity, although still with diminishing returns.
In general, rapid simulation approaches such as this allow optimisation of detector geometry for its intended role. The space of a given parameter like aFOV can be uniformly scanned in a consistent environment, and ideal values identified, rather than attempting to compare different experimental results or develop specialised simulated models.
5 Conclusion
Geant4 is used to simulate the Siemens Biograph Vision Quadra and United Imaging uEXPLORER long-aFOV PET scan detectors, with additional parameters introduced to allow free variation of the detector geometry, scintillator material, or radioisotope. The utility of this simulation is demonstrated by reproducing experimental results for the performance of these detectors, and then by freely varying the aFOV parameter with respect to the length of a phantom source. We show that detector NECR improves linearly as aFOV is increased up to the length of the source, but that further improvement is less rapid and eventually plateaus.
The simulation package used for these studies is available for others to use and it is intended to develop it further, adding more detail and functionality.
Declarations
Ethics approval and consent to participate
Not applicable
Consent for publication
Not applicable
Availability of data and material
All data used in the study was generated and analysed using the simulation code available at https://github.com/bwynneHEP/SimplePetScanner, and can be reproduced using this code.
Competing interests
Not applicable
Funding
This research is supported by a grant from the STFC cancer diagnosis network (CDN+, STFC Grant ST/S005404/1) held by BW. AAST was funded by the British Heart Foundation (FS/19/34/34354). AAST is a recipient of a Welcome Trust Technology Development Award (221295/Z/20/Z). This publication has been made possible in part by CZI grant DAF2021-225273 and grant DOI https://doi.org/10.37921/690910twdfoo from the Chan Zuckerberg Initiative DAF, an advised fund of Silicon Valley Community Foundation (funder DOI 10.13039/100014989), to AAST.
Authors’ contributions
BMW wrote the simulation and analysis code, and was the principal contributor in writing the manuscript. HBB created the analysis for the background due to scattered events and the corresponding plots, and edited the manuscript. MN and AAST supervised the research and edited the manuscript. All authors read and approved the final manuscript.
Acknowledgments
The authors acknowledge Dr Gary Smith for the original funding application for this project, although he was unable to be involved in the research.
References
- \bibcommenthead
- (1) Cherry S, Jones T, Karp J, Qi J, Moses W, Badawi R. Total-Body PET: Maximizing Sensitivity to Create New Opportunities for Clinical Research and Patient Care. Journal of Nuclear Medicine. 2017 09;59. 10.2967/jnumed.116.184028.
- (2) Vandenberghe S, Moskal P, Karp JS. State of the art in total body PET. EJNMMI Phys. 2020 7;35. 10.1186/s40658-020-00290-2.
- (3) Prenosil G, Sari H, Fuerstner M, Afshar-Oromieh A, Shi K, Rominger A, et al. Performance Characteristics of the Biograph Vision Quadra PET/CT system with long axial field of view using the NEMA NU 2-2018 Standard. Journal of Nuclear Medicine. 2021 07;63. 10.2967/jnumed.121.261972.
- (4) Spencer B, Berg E, Schmall J, Omidvari N, Leung E, Abdelhafez Y, et al. Performance evaluation of the uEXPLORER Total-body PET/CT scanner based on NEMA NU 2-2018 with additional tests to characterize long axial field-of-view PET scanners. Journal of Nuclear Medicine. 2020 10;62. 10.2967/jnumed.120.250597.
- (5) Poon JK, Dahlbom ML, Moses WW, Balakrishnan K, Wang W, Cherry SR, et al. Optimal whole-body PET scanner configurations for different volumes of LSO scintillator: a simulation study. Phys Med Biol. 2012;57(13):4077–4094. 10.1088/0031-9155/57/13/4077.
- (6) Agostinelli S, Allison J, Amako K, Apostolakis J, Araujo H, Arce P, et al. Geant4—a simulation toolkit. Nuclear Instruments and Methods in Physics Research Section A: Accelerators, Spectrometers, Detectors and Associated Equipment. 2003;506(3):250–303. 10.1016/S0168-9002(03)01368-8.
- (7) Nelson WR, Hirayama H, Rogers DWO. EGS4 code system; 1985. Available from: https://www.osti.gov/biblio/6137659.
- (8) Forster RA, Godfrey TNK. MCNP - a general Monte Carlo code for neutron and photon transport. In: Monte-Carlo Methods and Applications in Neutronics, Photonics and Statistical Physics. Berlin, Heidelberg: Springer Berlin Heidelberg; 1985. p. 33–55.
- (9) Jan S, Santin G, Strul D, Staelens S, Assié K, Autret D, et al. GATE: a simulation toolkit for PET and SPECT. Physics in Medicine & Biology. 2004 09;49(19):4543. 10.1088/0031-9155/49/19/007.
- (10) Thompson CJ, Moreno-Cantu J, Picard Y. PETSIM: Monte Carlo simulation of all sensitivity and resolution parameters of cylindrical positron imaging systems. Physics in Medicine & Biology. 1992 03;37(3):731. 10.1088/0031-9155/37/3/017.
- (11) Harrison RL, Lewellen TK. The SimSET Program. CRC Press; 2012. p. 87–110.
- (12) España S, Herraiz JL, Vicente E, Vaquero JJ, Desco M, Udias JM. PeneloPET, a Monte Carlo PET simulation tool based on PENELOPE: features and validation. Physics in Medicine & Biology. 2009 02;54(6):1723. 10.1088/0031-9155/54/6/021.
- (13) Lai Y, Zhong Y, Chalise A, Shao Y, Jin M, Jia X, et al. gPET: a GPU-based, accurate and efficient Monte Carlo simulation tool for PET. Physics in Medicine & Biology. 2019 12;64(24):245002. 10.1088/1361-6560/ab5610.
- (14) Wynne BM, Borecka-Bielska H.: SimplePetScanner. GitHub. https://github.com/bwynneHEP/SimplePetScanner.
- (15) NEMA Standards Publication NU 2-2012 – Performance Measurements of Positron Emission Tomographs. Rosslyn, VA: National Electrical Manufacturers Association; 2012.