An Algorithm to Mitigate Charge Migration Effects in Data from the Near Infrared Imager and Slitless Spectrograph on the James Webb Space Telescope111This work is based on observations made with the NASA/ESA/CSA James Webb Space Telescope. The data were obtained from the Mikulski Archive for Space Telescopes at the Space Telescope Science Institute, which is operated by the Association of Universities for Research in Astronomy, Inc., under NASA contract NAS 5-03127 for JWST. These observations are associated with programs # 1083, 1093, 1094, and 1096.
Abstract
We present an algorithm that mitigates the effects of charge migration due to the “brighter-fatter effect” (BFE) that occurs for highly illuminated stars in the Teledyne HAWAII-2RG detectors used in the NIRCam, NIRISS, and NIRSpec science instruments aboard the James Webb Space Telescope (JWST). The impact of this effect is most significant for photometry and spectrophotometry of bright stars in data for which the point spread function (PSF) is undersampled, which is the case for several observing modes of the NIRISS instrument. The main impact of BFE to NIRISS data is incorrect count rate determinations for pixels in the central regions of PSFs of bright stars due to jump detections that are caused by charge migration from peak pixels to surrounding pixels. The effect is especially significant for bright compact sources in resampled, distortion-free images produced by the drizzle algorithm: quantitatively, apparent flux losses of % can occur in such images due to BFE. We describe the algorithm of the “charge_migration” mitigation step that has been implemented in version 10.0 of the operational JWST calibration pipeline as of Dec 5, 2023. We illustrate the impact of this step in terms of the resulting improvements of the precision of imaging photometry of point sources. The algorithm renders the effects of BFE on photometry and surface brightness measurements to stay within 1%.
1 Introduction
The Near InfraRed Imager and Slitless Spectrograph (NIRISS; Doyon et al. 2023) on board the James Webb Space Telescope (JWST, Gardner et al., 2023) has four observing modes: (1) aperture masking interferometry (AMI; Sivaramakrishnan et al., 2023), (2) direct imaging, (3) single-object slitless spectroscopy (SOSS; Albert et al., 2023), and (4) wide field slitless spectroscopy (WFSS; Willott et al., 2022). NIRISS uses a single Hawaii-2RG (H2RG) HgCdTe array manufactured by Teledyne Imaging Systems as its detector, covering a useful wavelength range out to 5 m. It features a pixel size of 00656, for which the JWST point spread function (PSF) is critically sampled at a wavelength 4 m.
The brighter-fatter effect (BFE) is a non-linear process that blurs the intensity distribution of brighter sources on the detector to a larger extent than it does for fainter sources. BFE was first observed and characterized in charge coupled devices (CCDs) of several instruments such as Euclid (Niemi et al., 2015), the Dark Energy Camera (Gruen et al., 2015) and the LSST/Rubin telescope (Lage et al., 2017). In CCDs, the effect is due to changes in the electric field geometry within detector pixels as photoelectrons accumulate within the pixel potential well (e.g., Antilogus et al., 2014). Further accumulation of photoelectrons is progressively hindered by the increasing transverse electric field which repulses additional incoming photoelectrons to neighboring pixels (see also Hirata & Choi, 2020). In NIR detectors such as those on JWST, where photo-generated charges are collected in a depletion region generated at a p-n diode at the detector layer which induces a change of voltage that is read using non-destructive sampling, the physical reason to expect a BFE is different: as charge accumulates in a pixel, the substrate voltage changes and the local depletion region shrinks. If it shrinks significantly relative to that of a neighboring pixel, then new charge generated in that area has a larger probability to get collected in the neighboring pixel (with larger depletion region). The effect has been reported in ground testing of a H2RG near-infrared detector for Euclid (Plazas et al. 2017, 2018; see also Zengilowski et al. 2021). The latter differ from the H2RG detectors used on JWST in terms of wavelength coverage, with the Euclid devices having a HgCdTe cutoff of 2.3 m, while most JWST devices cut off at 5.2 m. As such, a study of the impact of the BFE on science with H2RG detectors on JWST seems warranted.
The BFE is not the only effect that involves nearest-neighbor interactions between H2RG detector pixels. Infrared detectors also suffer from electronic cross-talk due to capacitive coupling between neighboring pixels, an effect usually referred to as inter-pixel capacitance (IPC). Although the main effect of IPC is signal-independent, it can have a non-linear component that is signal-dependent (NL-IPC; see, e.g., Donlon et al., 2018, and references therein)). While the data and analysis used in the current paper formally do not allow one to separate the effects of NL-IPC and BFE, we note that Hirata & Choi (2020) introduced a framework to connect the cross-correlation signal of different flat field time samples to different non-linear detector behaviors. This formalism was applied to a large dataset of flat field exposures with long ramps taken with a development H4RG detector for the WFIRST (now Roman) mission by Choi & Hirata (2020) and Freudenburg et al. (2020). In each of several different tests, they found that the BFE dominated over the NL-IPC. In this paper, we assume that the signal-dependent effect of charge transfer to neighboring pixels in JWST H2RG devices is due to the BFE.
An important feature of the BFE is that the magnitude of its effect scales with pixel-to-pixel contrast: the larger the contrast between the charge accumulated in neighboring pixels, the more efficient is the transfer of charge from the brightest pixel to its neighbors. As such, the effect is strongest for bright point sources, especially in observing modes for which the point spread function (PSF) is undersampled by the detector pixels. Severe PSF undersampling with JWST occurs for three NIRISS observing modes. This includes NIRISS Imaging and WFSS using filter passbands at wavelengths m, for which the PSF is undersampled by factors 2, and AMI observations with the non-redundant aperture mask for which the spatial resolution is given by the Michelson criterion (), a resolution roughly twice as high as for regular direct imaging (e.g., Sivaramakrishnan et al., 2023).
The BFE is particularly problematic for projects that rely on PSF modeling to provide the highest possible precision in photometric, astrometric, or morphological measurements. Good examples in terms of JWST science are PSF-fitting photometry of point sources for studies of resolved stellar populations and/or high-precision proper motion measurements of sources that are either too faint for GAIA or in regions that are too crowded to be resolved by GAIA (e.g., Libralato et al., 2023), or cosmological studies of weak lensing and cosmic shear (e.g., Amara & Réfrégier, 2008; Amara et al., 2010). The issue is that a systematic misrepresentation of the PSF when measured from profiles of bright stars (to reach the necessary signal-to-noise ratio) biases the resulting brightnesses of fainter stars, or shape measurements of galaxies, to levels that can significantly limit the possible science goals. An additional issue caused by the BFE that specifically affects data that is read out using non-destructive reads (i.e., NIR and mid-IR data) is that the BFE changes the effective count rate during integration ramps, rendering the ramp non-linear. For pixels with intrinsically high count rates, this causes false positives in outlier detection schemes during detector-level data processing. In the absence of a BFE mitigation algorithm, this causes problems for point source photometry when multiple dithered images are combined and resampled onto a common distortion-free pixel grid using the drizzle algorithm (Fruchter & Hook, 2002) in conjunction with the common weighting method of inverse variance mapping (IVM; see Casertano et al., 2000). This is discussed in detail in Section 3.
In this paper we describe the effects of BFE on NIRISS data and its impact on science, and we introduce an algorithm that mitigates these effects and was recently implemented as a new step in the JWST Calibration Pipeline.
2 Data Processing
Before describing examples of the impact of BFE on NIRISS data, we briefly review the relevant processing steps in the JWST Calibration Pipeline (see Bushouse et al., 2023).
2.1 Overview of JWST Pipeline Processing of H2RG Data
Detector-level processing of JWST H2RG exposures is done in the first pipeline stage, calwebb_detector1, which processes the data from non-destructively read integration ramps to slope images (with count rate units of ADU/s). The first steps flag the dead, hot, noisy, and saturated pixels, followed by the subtraction of a superbias frame and a reference pixel correction which corrects for drifts between rows and columns of the charge injected by the readout electronics. A non-linearity correction and optional persistence correction are then applied, followed by subtraction of the dark signal. Jumps (such as those caused by cosmic ray hits) are then flagged in the so-called jump step which uses the two-point difference method described in Anderson & Gordon (2011). The final step in calwebb_detector1 is the ramp_fitting step which fits a slope to the reads of each pixel during an integration ramp, after discarding the reads that were flagged during the previous steps. If an exposure contains multiple ramps, a file with the slope averaged over all integrations is also produced.
During the second pipeline stage, called calwebb_image2, world coordinate system (WCS) and flux calibration information is added to the file and a flat-field correction is applied. Finally, calwebb_image2 resamples the input image into a distortion-free product, using the WCS and distortion information added earlier. By default, the input-to-output pixel mapping applied during this resample step uses the IVM weighting scheme that uses the inverse of the read noise variance array that was stored in each image during the ramp_fitting step in calwebb_detector1. Relevant suffix names of output files of the calwebb_detector1 and calwebb_image2 pipelines are listed in Table 1.
The third and last pipeline stage, calwebb_image3, combines multiple exposures (e.g., all dither positions in a dithered exposure sequence) taken with a given filter into a single drizzled image, using the same resampling and weighting scheme as that mentioned above during the calwebb_image2 stage.
The impact of BFE on science with point source imaging data of undersampled PSFs with H2RG detectors is mainly due to the logic of the jump and ramp_fitting steps of the calwebb_detector1 pipeline stage. This will be described in detail in the next Section.
| Pipeline Name | File Suffix | Notes |
|---|---|---|
| calwebb_detector1 | _ramp.fits | Calibrated ramps just before ramp slope fitting. Only produced when setting save_calibrated_ramp = True. |
| _rateints.fits | Calibrated count rate (one per ramp) | |
| _rate.fits | Calibrated count rate (averaged over all ramps) | |
| calwebb_image2 | _cal.fits | WCS added and flat-field correction applied; pixel values converted to surface brightness in MJy/sr |
| _i2d.fits | Resampled onto distortion-free image array. Only produced when setting resample.single = True and resample.skip = False. |
3 Impact of BFE to NIRISS H2RG Images
3.1 Undersampled PSFs
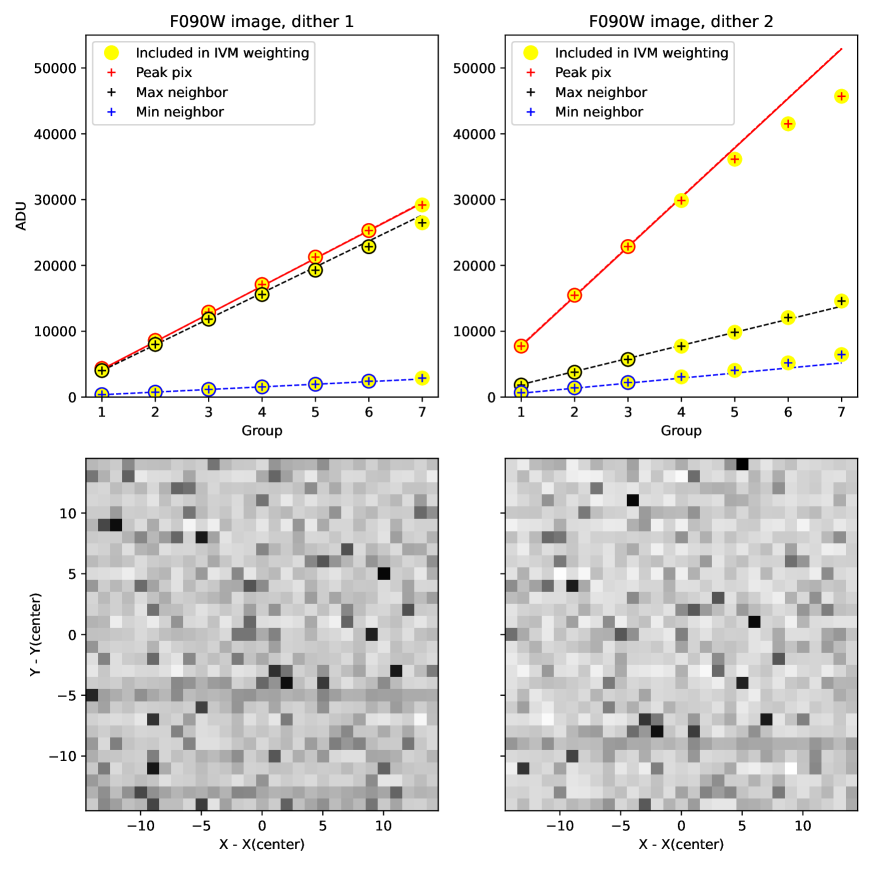
A good example of the significant impact BFE can have on point source science with undersampled PSFs is provided by the dataset for exposure specification # 9 of JWST program 1094 (PI: A. Martel). This dataset consists of F090W images of a flux standard star (LDS 749, a DBQ4 white dwarf, cf. Bohlin & Koester 2008) taken at two dither positions that differ in pixel phase by (, ) = (0.5, 0.5) pixels. In this particular case, the star was centered near a pixel corner in the first dither position and near a pixel center in the second position. As shown in Figure 1, this setup resulted in the peak pixel reaching a count rate 50% higher in dither position 2 than in position 1. Obviously, the F090W PSF is strongly undersampled by the NIRISS detector.
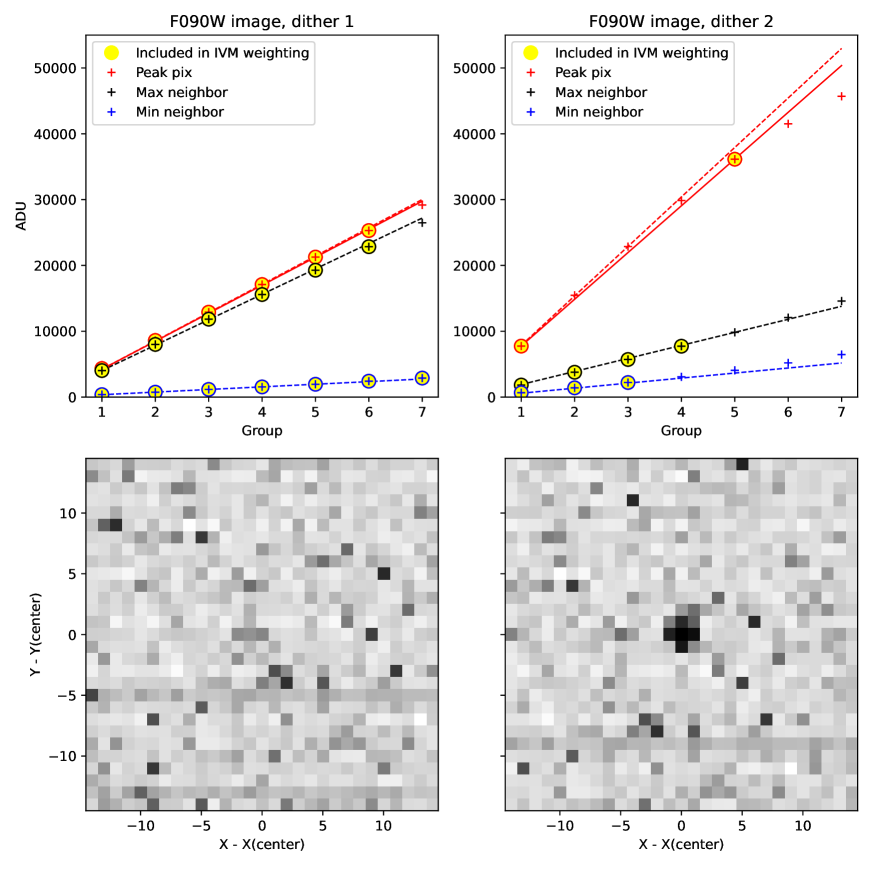
The plus signs in the top panels of Figure 1 show the linearized count levels attained during the integration ramp of those two images, for their peak pixels and two neighboring pixels. For comparison, two lines are drawn for the peak pixels: the solid line depicts the ramp slope calculated by the ramp_fitting step in calwebb_detector1, while the dashed line depicts a linear fit to the first three reads (hereafter referred to as “groups” following the JWST nomenclature) of the ramp. Note that the two slopes are virtually identical for the first dither position and fit the data very well (and this is also the case for the neighboring pixels), while the signal levels of the data for the second dither position get progressively below the dashed line at accumulated signal levels 25,000 ADU. This is the BFE, and it is accompanied by signal levels in the neighboring pixels that are above their respective linear fits to the groups of the ramp for which the peak pixel stays below 25,000 ADU. This “surplus charge” in the pixels next to the peak pixel represents charge that migrated from the peak pixel to its neighbors with significantly lower signal levels.
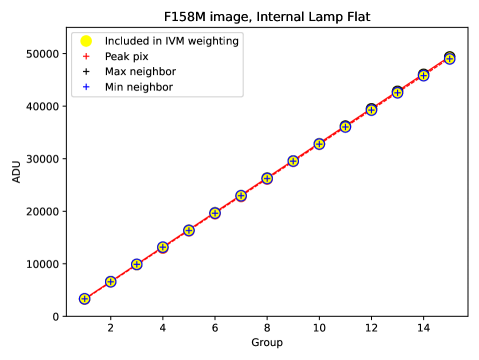
Before going into details regarding the impact of BFE to science with undersampled images, it is important to realize that the linearity correction that is applied to JWST H2RG data in the calibration pipeline is not affected by the BFE. This linearity correction is derived from a set of images taken with a dedicated external lamp during ground testing, providing stable and uniform illumination of the flight detector (see Morishita et al., 2020). The BFE has no detectable effect on such uniformly illuminated data, as illustrated in Figure 2.
The impact of BFE to the derived ramp slopes for stars in undersampled H2RG data is
mainly due to the flagging done in the jump step within calwebb_detector1, which iteratively flags groups if
the absolute two-point difference
is larger than the median absolute two-point difference of the full ramp by a
certain threshold; this threshold is defaulted at where
refers to the read noise for two groups. This default threshold value was found
from testing to provide solid flagging of cosmic ray hits
(see Anderson & Gordon, 2011).
However, the jump step introduces negative side effects for exposures that
suffer from significant BFE. Taking the second dither position of the dataset
presented here as an example, the jump step assigned flags to all
groups except # 1 and 5 in case of the peak pixel, while jump flags were
assigned to groups 4 in the neighboring pixels. This
caused two problems:
-
1.
The ramp slope calculated by the pipeline for the peak pixel is lower (in this case by 4.5%) than that calculated from the groups with accumulated signal levels of 25,000 ADU, while the charge that migrated from the peak pixel to the surrounding pixels is not used by the ramp slope calculations for the latter pixels, since that surplus charge is flagged as jumps, and groups with jumps are excluded from ramp slope calculations. As a result, the integrated flux for the star is skewed low, which was noticed during NIRISS commissioning when comparing the measured integrated fluxes from the two dithered exposures.
-
2.
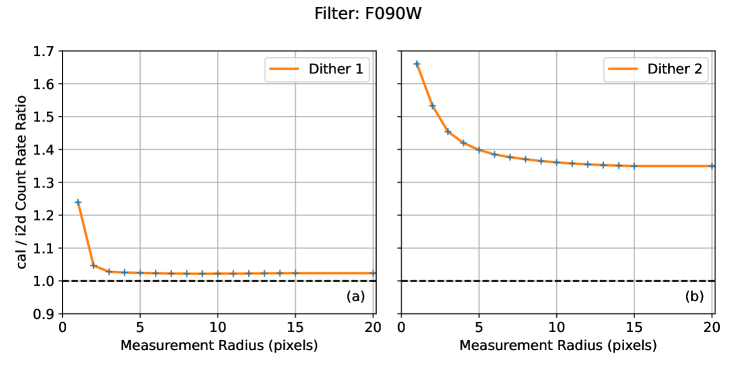
Perhaps more importantly for science applications that involve image combination of distortion-free images using the drizzle algorithm, the flagging of multiple groups by the jump step in pixels affected by BFE can cause significant loss of flux in the resampled and combined images. This is due to the IVM weighting used to resample images onto a distortion-free pixel grid within the drizzle algorithm to combine dithered images in the calwebb_image3 pipeline. IVM weights are derived for each pixel as where is the variance of the slope of a ramp (or ramp segment) due to read noise (see ReadTheDocs article for the ramp_fitting step for details), which is represented by the VAR_RNOISE extension of the _rate and _cal pipeline products. The IVM weight maps of the 30 30 pixel region around the star in the two dither positions in the dataset discussed here are shown in the bottom panels of Figure 1. Note the low IVM weights assigned to the central pixels of the star in the second dither position (i.e., the one significantly affected by BFE), which are due to significant numbers of groups getting flagged as “jumps” in that image for those pixels. The consequence of these low IVM weights for the pixels with high signal level is that the resample step, which resamples the input image onto a distortion-free pixel grid, effectively lowers the pixel values in the PSF region in the output _i2d image relative to the situation in the input image. This is readily seen when comparing aperture photometry of the star from the _cal and _i2d pipeline products using multiple measurement radii: Figure 3 shows that the integrated count rate of the star in the _i2d image of the second dither position is lower by 36% relative to the input _cal image, while the _cal and _i2d count rates of the star in the first dither position (for which only one group in the central pixels was affected by BFE) are consistent with each other to within 2%.
3.2 Adequately Sampled PSFs
For purposes of comparison with the case of undersampled PSFs, we now illustrate the impact of BFE on images with adequately sampled PSFs, using filter F480M for which the PSF has a FWHM of 2.5 pixels. This is done using direct images taken during observation # 23 of JWST program 1093 (PI: D. Thatte). This dataset consists of F480M images of CPD67607, a bright K giant star used as PSF reference star, taken in two dither positions, again differing in pixel phase by (, ) = (0.5, 0.5) pixels. In this case the star was centered very close to a pixel center in the first dither position and near a pixel corner in the second position. The difference of the measured count rates for the peak pixel between the two dithers is only 14% in this case, as opposed to 50% for the strongly undersampled F090W images described in Sect. 3.1.
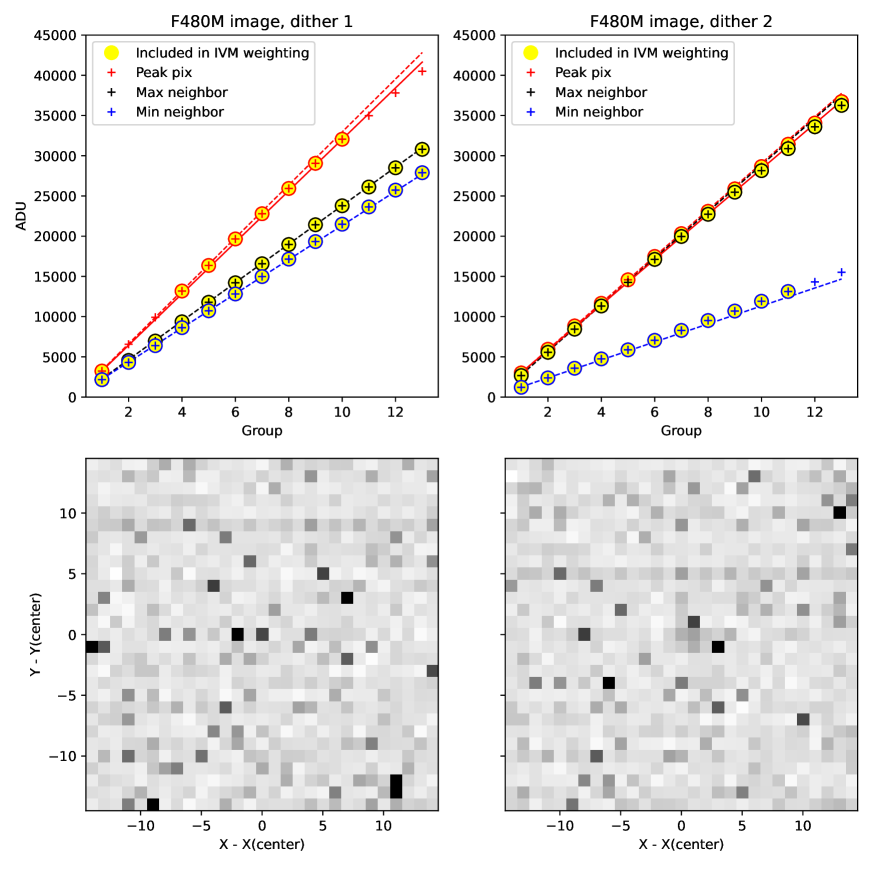
The linearized ramps and IVM weight maps for the two F480M images as determined by the operational pipeline are shown in Figure 4 which has the same setup as Figure 1. For the F480M exposure in which the PSF was centered on a pixel, the BFE caused the jump step to flag 5 out of the 13 groups up the ramp for the peak pixel, yielding a ramp slope that is lower by 2.1% than the slope calculated from the groups with accumulated signal levels of 25,000 ADU (see top left panel of Figure 4). This is reflected in a relatively low IVM weight for the peak pixel (see bottom left panel). However, in contrast with the case of the undersampled PSF in the F090W image that was centered on a pixel, the amount of charge that was migrated to the adjacent pixels due to the BFE was too low to cause jump detections there, likely because of the relatively low contrast in signal level between the peak pixel and its neighbors. For the F480M exposure that was centered near a pixel corner (see right-hand panels of Figure 4), the peak pixel and one adjacent pixel had very similar count rates and only one of the 13 groups was flagged by the jump step, while the neighboring pixel with the lowest count rate did receive a detectable amount of migrated charge (as evidenced by jump detections) in the last two groups, likely because of the relatively large contrast in signal level with its neighbors. As such, several pixels near the center of the PSF received a small but non-negligible lowering of IVM weights (see bottom left panel of Figure 4). Furthermore, the ramp slope for the peak pixel calculated by the operational pipeline for this exposure is 1.8% lower than that calculated from the groups with accumulated signal levels of 25,000 ADU.
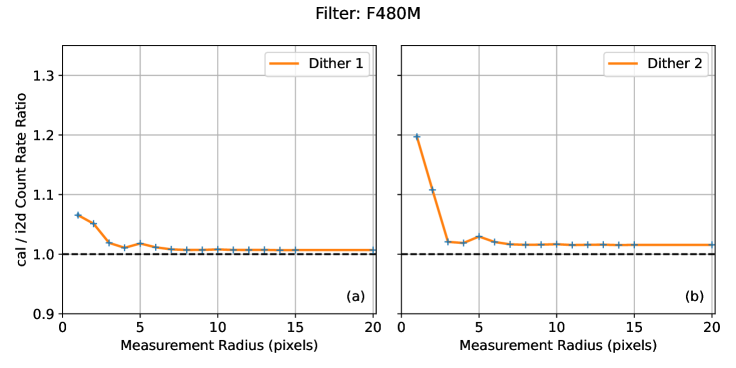
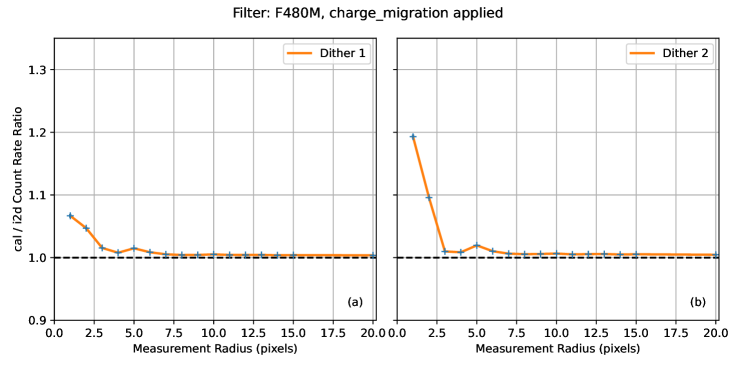
The impact of the IVM weights for these F480M images is shown in terms of the “cal/i2d” ratio of integrated count rates in Figure 5. The resampling process used to create the _i2d image resulted in a net loss of integrated count rate of 2% for both dithers, due to the jump detections in some groups for the pixels at or near the PSF centers as described above. While this count rate loss for adequately sampled PSFs due to the BFE is significantly lower than it is in undersampled data with similar levels of total charge, it is still significant and relevant to mitigate the issue to improve photometric precision.
4 The charge_migration Algorithm
4.1 Description
To address the issues caused by the BFE for undersampled H2RG data described in the previous section, we designed an additional step within the calwebb_detector1 pipeline called charge_migration which is inserted in between the dark_current and jump steps. The new step has one input parameter signal_threshold, which has a default value of 25,000 ADU which can be replaced by other values for a given exposure type or set of optical elements by means of parameter reference files. The determination of the values of signal_threshold for NIRISS modes is described in the Appendix.
The charge_migration step assigns a data quality (DQ) flag called CHARGELOSS to any non-saturated group in any integration whose accumulated signal is above the value of signal_threshold. Furthermore, the same DQ flag is also assigned to the same groups of the pixels that are immediate neighbors of those high-signal pixels. This is done to ensure that the inclusion or exclusion of groups from calculations in the jump and ramp_fitting steps is done in the same way for pixels with values above signal_threshold and their neighbors who receive “surplus” charge that is migrated from the high-signal pixel due to the BFE. The presence of the CHARGELOSS DQ flag (which are saved in the GROUPDQ array associated with the data file) results in certain actions in the subsequent jump and ramp_fitting steps, both of which have been updated along with the implementation of the charge_migration step222As of version 1.12.3 of the jwst python package and CRDS context 1135, the charge_migration step has been activated for data taken with NIRISS observing modes AMI, Imaging, and WFSS.. These actions are as follows:
-
•
in the jump step, the groups with the CHARGELOSS DQ flag are being excluded from the jump detection calculations (i.e., the two-point difference calculations), similar to groups with the SATURATION DQ flag. The groups with the CHARGELOSS flag are therefore not issued a jump DQ flag.
-
•
in the subsequent ramp_fitting step, the groups with the CHARGELOSS flag are being excluded from the ramp slope calculations. However, since those groups were not assigned a jump DQ flag, they are included in the calculation of the variance of the slope due to read noise (i.e., the VAR_RNOISE array). This prevents them from being assigned a low IVM weight during the resample step in the calwebb_image2 and calwebb_image3 pipelines, which they were before the implementation of the charge_migration step.
We remind the reader that the main purpose of the use of IVM weights based on read noise during image combination (as opposed to weighting by exposure time) is to optimize sensitivity for faint objects (see Casertano et al., 2000). The modification of the IVM weighting scheme performed by the charge_migration step only affects the brightest objects in images, for which the read noise is typically negligible relative to the poisson noise associated with the source333In our tests, we find /var for all flagged pixels.. As such, the benefits of IVM weighting are fully retained when running the charge_migration step.
4.2 Results
The impact of the charge_migration step in addressing the effect of the BFE on science for H2RG data can be significant, especially in the case of spatially undersampled data of bright stars. This is illustrated in this section using files produced by re-running the calwebb_detector1 pipeline on the _uncal.fits files, now with the charge_migration step activated.
4.2.1 Undersampled data
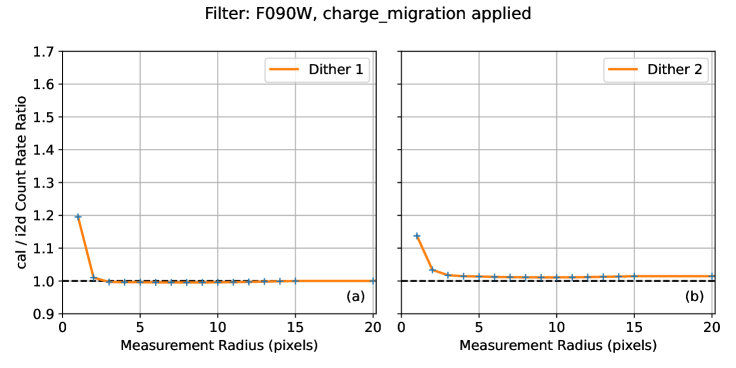
Figure 6 is the same as Figure 1 for the F090W dataset, but now showing the ramps, ramp-fitting results, and IVM weight assignments of the pixels around the star in the two dither positions in the data produced after activating the charge_migration step. Note that the inappropriate assignments of low IVM weights to the central pixels of the PSF have now disappeared. Furthermore, the integrated flux measurements of the star in the resampled _i2d images are now consistent with those in the flat-fielded _cal images to within 1% for both dither positions, as shown in Figure 7.
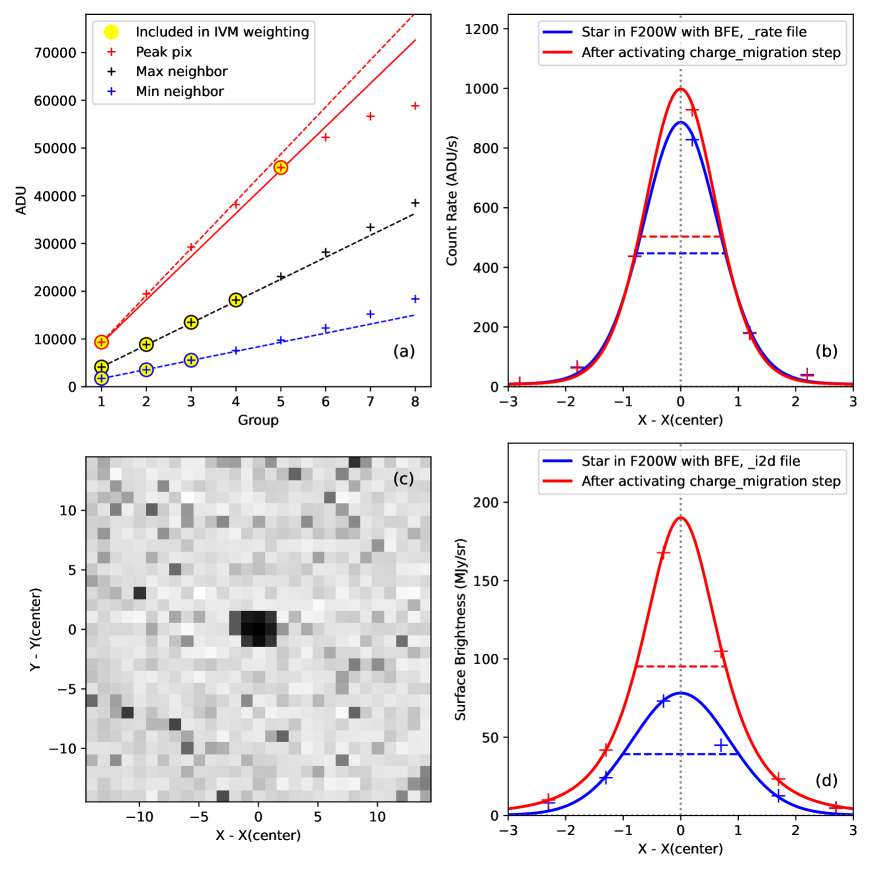
Another effect of BFE is that it causes an apparent widening of the PSF due to the peak signal being depressed relative to that of the surrounding pixels. As already described in Section 3 and shown in Figure 1, the efficacy of the BFE scales with pixel-to-pixel contrast, which for undersampled PSFs includes the placement of PSFs within pixel boundaries. As such, this issue affects efforts to create proper sets of empirical PSFs (ePSFs; see, e.g., Anderson & King, 2000, 2006; Libralato et al., 2023) for high-precision astrometry and photometry of point sources in undersampled H2RG data from JWST. The effect on PSF width and shape is again most significant in the resampled _i2d files due to the IVM weighting described above. To illustrate this effect, we use an F200W image with a ramp of 8 groups taken as part of JWST Commissioning Program 1096 (PI: A. Martel) in which a star is centered very close to a pixel center. The data for this star show a particularly strong efficacy of the BFE because the signal level of the peak pixel almost reaches the saturation threshold at the last group, causing a particularly strong downward curvature of the (linearity-corrected) ramp beyond the signal_threshold value, which is already reached at the third group. As shown in panel (a) of Figure 8, the jump step causes the ramp slope to be derived from only 2 groups for the peak pixel (one of which is significantly affected by BFE), and from 3 (different) groups for its neighbors. This in turn causes very low IVM weight assignments for the central pixels as shown in panel (c) of Figure 8.
The effect of this to the PSF shape in the _cal and _i2d images is shown in panels (b) and (d) of Figure 8, respectively, both before and after the charge_migration step was implemented into the pipeline. In the case of the flatfielded _cal image, the application of the charge_migration step yielded a flux increase of 13% in the peak pixel, the integrated flux of the star was increased by 2%, and the measured FWHM of the PSF showed a moderate decrease (from 1.55 to 1.46 pixels). However, for the resampled _i2d images, the differences are quite dramatic: the peak pixel flux increased by 144%, the integrated flux increased by 52%, and the FWHM decreased significantly as well (from 2.02 to 1.56 pixels). As such, the implementation of the charge_migration step yields a significant improvement of the quality and internal consistency of PSFs and PSF (or ePSF) reference libraries for PSF-fitting photometry of undersampled JWST imaging modes such as NIRISS imaging at wavelengths m and NIRISS AMI data.
4.2.2 Adequately Sampled Data
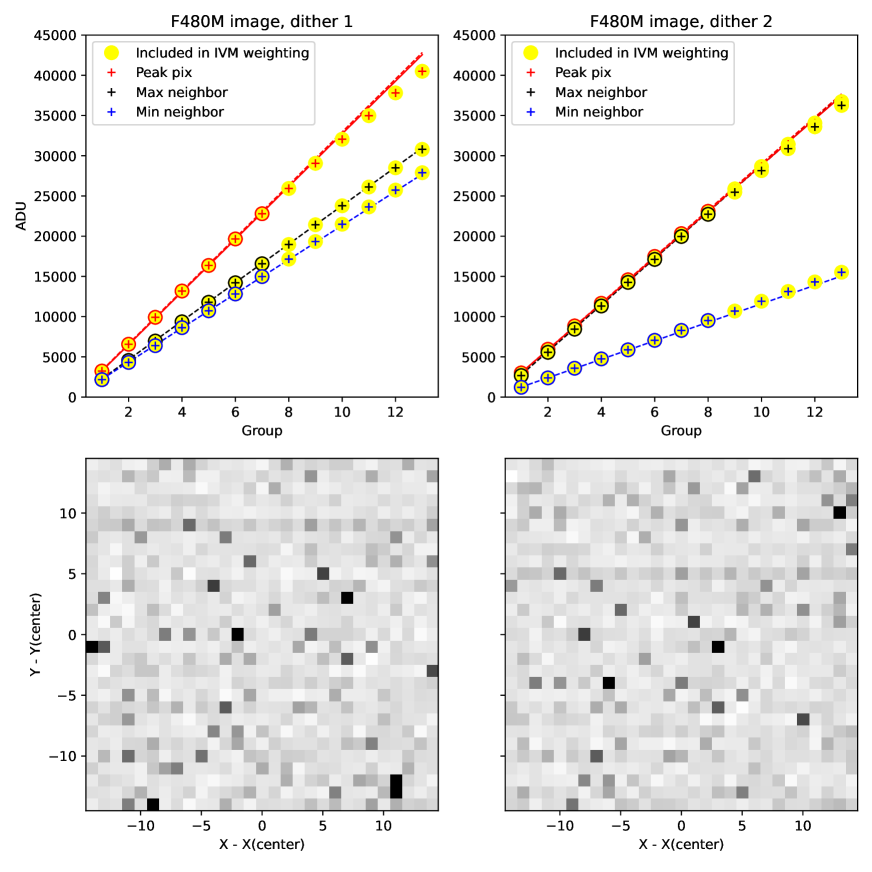
The ramps, ramp-fitting results, and IVM weight assignments of the pixels around the star in the two dither positions in the F480M images produced after activating the charge_migration step are shown in Figure 9. Similar to the case of the undersampled F090W images, the low IVM weights of the central pixels of the PSF have now disappeared. This is reflected in the integrated flux measurements of the star in the resampled images, which are now consistent with those in the flat-fielded images to within 0.5% for both dither positions (see Figure 10).
5 Summary
We describe the negative impacts of the Brighter-Fatter Effect (BFE) to data of the NIRISS instrument aboard the James Webb Space Telescope (JWST). The efficacy of the BFE becomes significant when a pixel’s accumulated signal levels reaches beyond a certain threshold (of order 20,000 – 25,000 ADU depending on the sharpness of the point spread function (PSF)), at which point charge starts to migrate to neighboring pixels with lower signal levels by detectable amounts. This process leads to detections of “jumps” in reads within integration ramps of the affected pixels by the JWST calibration pipeline. The reads that get flagged as jumps for the peak pixel due to this effect are typically different from those flagged for the neighboring pixels, causing incorrect determinations of both peak pixel count rate and total source signal. Furthermore, the jump flags caused by this effect (which can be significant in number) cause low weights for the central pixels of PSFs of bright stars in the “inverse variance mapping” (IVM) weighting scheme, which is the default scheme used in the resample step of the JWST calibration pipeline which resamples images onto a distortion-free pixel grid. These low IVM weights for the bright central pixels can cause significant loss of source flux in the output images of the resample step relative to the input images, especially in the case of spatially undersampled images. Flux losses of 50% have been identified in this context.
We describe an algorithm to mitigate the effects mentioned above, called the charge_migration step, which has been implemented within the calwebb_detector1 stage of build 10.0 of the JWST calibration pipeline, which was released on December 5, 2023. This step limits the negative impacts of the BFE in NIRISS imaging data to within 1% in signal level, both for flatfielded images and images resampled to a distortion-free pixel grid.
Appendix A Determination of signal_threshold for NIRISS imaging data
To determine appropriate values for the signal_threshold parameter in the context of the charge_migration step, the goal we aim to achieve is a situation where integrated fluxes of (bright but unsaturated) stars measured from resampled _i2d images are consistent with those measured from individual flatfielded _cal images to within 1%. From the results described in Sections 3 and 4, this corresponds to ramp slopes calculated for the peak pixel of the PSF that are consistent to within 1% with those determined from the groups with signal levels low enough for the efficacy of BFE to be negligible.
With this goal in mind, we identify suitable imaging datasets for a variety of NIRISS passbands. These images contain a star for which the integrations of the peak pixel feature the following:
-
•
The integrations contain at least 3 groups with accumulated signal level 18,000 ADU (at which no sign of charge migration has been detected). This is to assure a robust ramp slope measurement. For the discussion below, we define as the last group in the integration ramp for which the peak pixel reaches a signal level 18,000 ADU.
-
•
The integration ramps contain at least 2 groups with accumulated signal level 25,000 ADU. This is to ensure a robust quantification of the effect of charge migration on the derived ramp slope.
Exposures with these features identified among publically available NIRISS data are listed in Table 2. For each of these exposures, we obtain linearized ramps by running the calwebb_detector1 pipeline with the save_calibrated_ramp = True setting, but without the new charge_migration step activated. Ramp slopes slopeN are then calculated for both the peak pixel and the sum of the inner 55 pixels for groups with . Note that the calculation of slopeN involves groups 1 through , using linear regression, and we ignore jump detections in the slope determination in this case. We define the “Fractional Count Rate” fracrateN as
| (A1) |
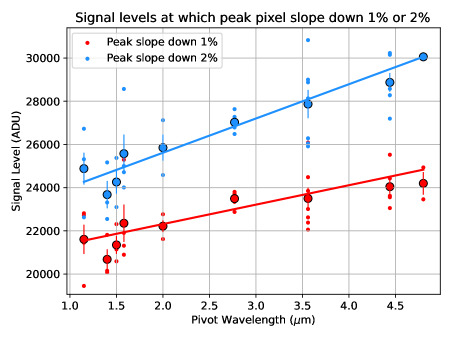
We then calculate fracrateN for each group up the ramp, averaging over all ramps in the exposure using iterative clipping statistics. Finally, we use linear interpolation to calculate the signal levels for which fracrateN equals 0.99 and 0.98 for the peak pixel, i.e., the signal levels at which the BFE has caused the ramp slope (or derived count rate) of the peak pixel to decrease by 1% and 2%, respectively. For the remainder of this Appendix, we define these two signal levels as and , respectively.
Values of fracrateN as a function of signal level at group are plotted in Figure 11 for four different filter passbands. Note that fracrateN steadily decreases beyond 18,000 ADU for the peak pixel, while it stays constant to well within 1% for the set of the inner 55 pixels. This illustrates that even without application of the charge_migration algorithm presented in this paper, charge migration caused by BFE does in principle not impact total flux measurements of (non-saturated) stars provided that (1) the measurement aperture radius is large enough (i.e., 2 pixels) and (2) jump detections due to the BFE are dealt with properly during ramp slope fitting. Application of the charge_migration step mitigates the negative impacts of the BFE to the count rate levels derived by ramp fitting for the inner few pixels of bright stars or other unresolved sources. Figure 11 also suggests that the functional form of fracrateN for the peak pixel is consistent across different datasets and that it may be possible to model BFE as functions of signal level and contrast with neighboring pixels in NIR data simulation software for JWST such as MIRAGE444https://mirage-data-simulator.readthedocs.io/en/latest. This will be further explored in the future.

Values of and for all exposures listed in Table 2 are included in that table and plotted as a function of filter pivot wavelength in Figure 12. There is a significant dependence on filter pivot wavelength, which we attribute to the known increase of BFE efficacy with increasing pixel-to-pixel contrast (e.g., Hirata & Choi, 2020) since this contrast increases in narrower PSFs, i.e., those with decreasing pivot wavelengths. Quantitatively, linear least-squares fits to the values of and as a function of pivot wavelength in m yield the following results:
| (A2) | |||||
| (A3) |
Finally, values for the signal_threshold parameter of the charge_migration step were chosen according to eq. A2. These values have been implemented as parameter reference files in the JWST Calibration Reference Data System (CRDS) (context # 1135) as of the release of version 10.0 of the Operational JWST Calibration Pipeline. As such, the charge_migration pipeline step will be automatically applied to NIRISS AMI, imaging, and WFSS data taken after December 5, 2023555Updates to the parameter reference files for the AMI modes with the non-redundant mask in the pupil wheel are in process and planned to be implemented before this paper is published.. NIRISS data taken before that date will be recalibrated over the few weeks after that date and made available again in the MAST archive. In the mean time, users can download the JWST python package version 1.12.3 (or higher) using pip666see https://github.com/spacetelescope/jwst in order to run the charge_migration package on NIRISS data that was downloaded before December 5, 2023.
| JWST Dataset Name | Observing Date | Filter | NGROUPS | NINTS | Subarray | ||
|---|---|---|---|---|---|---|---|
| (1) | (2) | (3) | (4) | (5) | (6) | (7) | (8) |
| jw01094001001_02101_00002 | May 5, 2022 | F115W | 25 | 5 | SUB64 | 22720 | 26726 |
| jw01094001001_02103_00002 | May 5, 2022 | F150W | 40 | 5 | SUB64 | 22311 | 25375 |
| jw01094001001_02105_00002 | May 5, 2022 | F200W | 75 | 5 | SUB64 | 21619 | 24583 |
| jw01094001001_0210b_00002 | May 5, 2022 | F140M | 20 | 3 | SUB128 | 20074 | 22549 |
| jw01094001001_0210d_00001 | May 5, 2022 | F158M | 25 | 3 | SUB128 | 20895 | 24008 |
| jw01094001001_0210d_00002 | May 5, 2022 | F158M | 25 | 3 | SUB128 | 21313 | 24700 |
| jw01094001001_0210f_00002 | May 5, 2022 | F115W | 7 | 3 | SUB128 | 22812 | 25314 |
| jw01094001001_0210p_00002 | May 5, 2022 | F356W | 180 | 3 | SUB128 | 22055 | 26047 |
| jw01094001001_0210p_00001 | May 5, 2022 | F356W | 180 | 3 | SUB128 | 22382 | 25910 |
| jw01094001001_0210r_00001 | May 5, 2022 | F444W | 340 | 3 | SUB128 | 23054 | 27194 |
| jw01094001001_0210r_00002 | May 5, 2022 | F444W | 340 | 3 | SUB128 | 23621 | 28575 |
| jw01094001001_0210t_00001 | May 5, 2022 | F277W | 80 | 3 | SUB128 | 22875 | 26482 |
| jw01094001001_0210t_00002 | May 5, 2022 | F277W | 80 | 3 | SUB128 | 23804 | 27634 |
| jw01094001001_0210v_00001 | May 5, 2022 | F277W | 20 | 3 | SUB256 | 23708 | 27011 |
| jw01094001001_0210v_00002 | May 5, 2022 | F277W | 20 | 3 | SUB256 | 23671 | 26786 |
| jw01094001001_0210x_00001 | May 5, 2022 | F444W | 90 | 3 | SUB256 | 23556 | 30230 |
| jw01094001001_0210x_00002 | May 5, 2022 | F444W | 90 | 3 | SUB256 | 24427 | 28803 |
| jw01094001001_0210z_00001 | May 5, 2022 | F356W | 40 | 3 | SUB256 | 24485 | 29008 |
| jw01094001001_0210z_00002 | May 5, 2022 | F356W | 40 | 3 | SUB256 | 23849 | 28132 |
| jw01094001001_0211b_00002 | May 5, 2022 | F140M | 6 | 3 | SUB256 | 20152 | 23314 |
| jw01096001001_02101_00002 | May 14, 2022 | F200W | 8 | 1 | FULL | 22767 | 27121 |
| jw01096001001_02107_00001 | May 14, 2022 | F158M | 14 | 1 | FULL | 25292 | 28567 |
| jw01096001001_0210d_00001 | May 14, 2022 | F277W | 12 | 1 | FULL | 23343 | 26963 |
| jw01096001001_0210h_00001 | May 14, 2022 | F356W | 18 | 1 | FULL | 26084 | 30829 |
| jw01096001001_0210h_00002 | May 14, 2022 | F356W | 18 | 1 | FULL | 23010 | 28875 |
| jw01093023001_03103_00001 | June 5, 2022 | F480M | 13 | 232 | SUB80 | 24934 | 30043 |
| jw01093023001_03103_00002 | June 5, 2022 | F480M | 13 | 232 | SUB80 | 23459 | 30068 |
| jw01094003001_02101_00002 | June 6, 2022 | F115W | 25 | 5 | SUB64 | 21449 | 24853 |
| jw01094003001_02103_00002 | June 6, 2022 | F150W | 40 | 5 | SUB64 | 21144 | 24305 |
| jw01094003001_02105_00002 | June 6, 2022 | F200W | 75 | 5 | SUB64 | 22263 | 25846 |
| jw01094003001_02109_00002 | June 6, 2022 | F150W | 10 | 3 | SUB128 | 20590 | 23099 |
| jw01094003001_0210r_00001 | June 6, 2022 | F444W | 340 | 3 | SUB128 | 25523 | 30150 |
| jw01094003001_0210r_00002 | June 6, 2022 | F444W | 340 | 3 | SUB128 | 24080 | 28278 |
| jw01094003001_0210b_00002 | June 6, 2022 | F140M | 20 | 3 | SUB128 | 21814 | 25167 |
| jw01094003001_0210d_00001 | June 6, 2022 | F158M | 25 | 3 | SUB128 | 21905 | 25010 |
| jw01094003001_0210f_00002 | June 6, 2022 | F115W | 7 | 3 | SUB128 | 19451 | 22628 |
| jw01094003001_0210p_00002 | June 6, 2022 | F356W | 180 | 3 | SUB128 | 22623 | 26284 |
| jw01094003001_0210t_00002 | June 6, 2022 | F277W | 80 | 3 | SUB128 | 23544 | 27275 |
References
- Albert et al. (2023) Albert, L., Lafrenière, D., René, D., et al. 2023, PASP, 135, 075001, doi: 10.1088/1538-3873/acd7a3
- Amara & Réfrégier (2008) Amara, A., & Réfrégier, A. 2008, MNRAS, 391, 228, doi: 10.1111/j.1365-2966.2008.13880.x
- Amara et al. (2010) Amara, A., Réfrégier, A., & Paulin-Henriksson, S. 2010, MNRAS, 404, 926, doi: 10.1111/j.1365-2966.2010.16326.x
- Anderson & King (2000) Anderson, J., & King, I. R. 2000, PASP, 112, 1360, doi: 10.1086/316632
- Anderson & King (2006) —. 2006, PSFs, Photometry, and Astronomy for the ACS/WFC, Instrument Science Report ACS 2006-01, 34 pages
- Anderson & Gordon (2011) Anderson, R. E., & Gordon, K. D. 2011, PASP, 123, 1237, doi: 10.1086/662593
- Antilogus et al. (2014) Antilogus, P., Astier, P., Doherty, P., Guyonnet, A., & Regnault, N. 2014, Journal of Instrumentation, 9, C03048, doi: 10.1088/1748-0221/9/03/C03048
- Astropy Collaboration et al. (2013) Astropy Collaboration, Robitaille, T. P., Tollerud, E. J., et al. 2013, A&A, 558, A33, doi: 10.1051/0004-6361/201322068
- Astropy Collaboration et al. (2018) Astropy Collaboration, Price-Whelan, A. M., Sipőcz, B. M., et al. 2018, AJ, 156, 123, doi: 10.3847/1538-3881/aabc4f
- Astropy Collaboration et al. (2022) Astropy Collaboration, Price-Whelan, A. M., Lim, P. L., et al. 2022, ApJ, 935, 167, doi: 10.3847/1538-4357/ac7c74
- Bohlin & Koester (2008) Bohlin, R. C., & Koester, D. 2008, AJ, 135, 1092, doi: 10.1088/0004-6256/135/3/1092
- Bradley et al. (2022) Bradley, L., Sipőcz, B., Robitaille, T., et al. 2022, astropy/photutils: 1.5.0, 1.5.0, Zenodo, doi: 10.5281/zenodo.6825092
- Bushouse et al. (2023) Bushouse, H., Eisenhamer, J., Dencheva, N., et al. 2023, JWST Calibration Pipeline, 1.10.2, Zenodo, doi: 10.5281/zenodo.7829329
- Casertano et al. (2000) Casertano, S., de Mello, D., Dickinson, M., et al. 2000, AJ, 120, 2747, doi: 10.1086/316851
- Choi & Hirata (2020) Choi, A., & Hirata, C. M. 2020, PASP, 132, 014502, doi: 10.1088/1538-3873/ab4504
- Donlon et al. (2018) Donlon, K., Ninkov, Z., & Baum, S. 2018, PASP, 130, 074503, doi: 10.1088/1538-3873/aac261
- Doyon et al. (2023) Doyon, R., Willott, C. J., Hutchings, J. B., et al. 2023, PASP, 135, 098001, doi: 10.1088/1538-3873/acd41b
- Elson et al. (1987) Elson, R. A. W., Fall, S. M., & Freeman, K. C. 1987, ApJ, 323, 54, doi: 10.1086/165807
- Freudenburg et al. (2020) Freudenburg, J. K. C., Givans, J. J., Choi, A., et al. 2020, PASP, 132, 074504, doi: 10.1088/1538-3873/ab9503
- Fruchter & Hook (2002) Fruchter, A. S., & Hook, R. N. 2002, PASP, 114, 144, doi: 10.1086/338393
- Gardner et al. (2023) Gardner, J. P., Mather, J. C., Abbott, R., et al. 2023, PASP, 135, 068001, doi: 10.1088/1538-3873/acd1b5
- Gruen et al. (2015) Gruen, D., Bernstein, G. M., Jarvis, M., et al. 2015, Journal of Instrumentation, 10, C05032, doi: 10.1088/1748-0221/10/05/C05032
- Harris et al. (2020) Harris, C. R., Millman, K. J., van der Walt, S. J., et al. 2020, Nature, 585, 357–362, doi: 10.1038/s41586-020-2649-2
- Hirata & Choi (2020) Hirata, C. M., & Choi, A. 2020, PASP, 132, 014501, doi: 10.1088/1538-3873/ab44f7
- Hunter (2007) Hunter, J. D. 2007, Computing in science & engineering, 9, 90
- Lage et al. (2017) Lage, C., Bradshaw, A., & Tyson, J. A. 2017, Journal of Instrumentation, 12, C03091, doi: 10.1088/1748-0221/12/03/C03091
- Libralato et al. (2023) Libralato, M., Bellini, A., van der Marel, R. P., et al. 2023, ApJ, 950, 101, doi: 10.3847/1538-4357/acd04f
- Morishita et al. (2020) Morishita, T., Goudfrooij, P., Volk, K., & Espinoza, N. 2020, NIRISS Linearity Correction using Markov Chain Monte Carlo Techniques, Technical Report JWST-STScI-007522 (STScI)
- Niemi et al. (2015) Niemi, S.-M., Cropper, M., Szafraniec, M., & Kitching, T. 2015, Experimental Astronomy, 39, 207, doi: 10.1007/s10686-015-9440-7
- Plazas et al. (2018) Plazas, A. A., Shapiro, C., Smith, R., Huff, E., & Rhodes, J. 2018, PASP, 130, 065004, doi: 10.1088/1538-3873/aab820
- Plazas et al. (2017) Plazas, A. A., Shapiro, C., Smith, R., Rhodes, J., & Huff, E. 2017, Journal of Instrumentation, 12, C04009, doi: 10.1088/1748-0221/12/04/C04009
- Sivaramakrishnan et al. (2023) Sivaramakrishnan, A., Tuthill, P., Lloyd, J. P., et al. 2023, PASP, 135, 015003, doi: 10.1088/1538-3873/acaebd
- Van Rossum & Drake (2009) Van Rossum, G., & Drake, F. L. 2009, Python 3 Reference Manual (Scotts Valley, CA: CreateSpace)
- Willott et al. (2022) Willott, C. J., Doyon, R., Albert, L., et al. 2022, PASP, 134, 025002, doi: 10.1088/1538-3873/ac5158
- Zengilowski et al. (2021) Zengilowski, G. R., Cabrera, M. S., McMurtry, C. W., et al. 2021, Journal of Astronomical Telescopes, Instruments, and Systems, 7, 026002, doi: 10.1117/1.JATIS.7.2.026002