Underluminous Type Ia supernovae are standardizable candles
Abstract
It is widely accepted that the width-luminosity relation used to standardize normal Type Ia supernovae (SNe Ia) breaks down in underluminous, 1991bg-like SNe Ia. This breakdown may be due to the choice of parameter used as a stand-in for the width of the SN Ia light curve. Using the colour stretch parameter instead of older parameters resolves this issue. Here, I assemble a sample of 13 nearby 1991bg-like SNe Ia from the literature, all of which have independent host-galaxy distance moduli and little to no reddening. I use Gaussian process regression to fit the light curves of these SNe in , , , , , and , and measure their peak absolute magnitudes. I find statistically significant ( confidence level) correlations between the peak absolute magnitudes of the underluminous SNe and their values in the range . These correlations are broadly consistent with fits to SNe Ia with preliminary - and -band peak absolute magnitudes from the Carnegie Supernova Project and significantly inconsistent with similar fits to normal and transitional SNe Ia (with ). The underluminous width-luminosity relation shown here needs to be properly calibrated with a homogeneous sample of 1991bg-like SNe Ia, after which it could be used as a rung on a new cosmological distance ladder. With surface-brightness fluctuations (or another non-Cepheid method) used to calibrate distances to nearby 1991bg-like SNe, such a ladder could produce an independent measurement of the Hubble-Lemaître Constant, .
keywords:
methods: distance scale – supernovae: general1 Introduction
Type Ia supernovae (SNe Ia) are famous for their use as standard candles, a use that led to the discovery of the accelerating expansion of the Universe and the existence of dark energy (Riess et al., 1998; Perlmutter et al., 1999). Yet, SNe Ia are not truly standard; they are standardizable. Independently, Rust (1974) and Pskovskii (1977) both showed that more luminous SNe Ia had wider light curves, i.e., they took longer to rise to peak and then decline. This correlation was corroborated and modernized by Phillips (1993) and has been in use ever since (for a historical review of the width-luminosity relation, see Phillips & Burns 2017; for a general review of the history and physics of SNe, see Graur 2022).
Phillips (1993) found a tight correlation between the peak absolute luminosities of ten SNe Ia and the widths of their light curves, parameterized by , the number of magnitudes by which a SN fades 15 days after it peaks in the band. Variations on this parameter are now routinely used to fit SN Ia light curves and standardize them for use in cosmology. Examples include , used in MLCS2k2 (Jha et al., 2007); , which is used in SALT and SiFTO (Guy et al., 2005; Conley et al., 2008); and , used in SALT2 (Guy et al., 2007).
SNe are divided into several classes, each with its own subclasses. The same is true for SNe Ia. The majority of SNe Ia fall into the so-called ‘normal’ subclass, but there are also overluminous 1991T-like SNe (Filippenko et al., 1992b), transitional 1986G-like SNe (Phillips et al., 1987), underluminous 1991bg-like SNe (Filippenko et al., 1992a), peculiar SNe Iax (Jha et al., 2006b; Foley et al., 2013), and more. The width-luminosity relation works exceptionally well for normal SNe Ia and extends to overluminous SNe Ia as well. However, this relation breaks down in underluminous, fast-evolving 1991bg-like SNe (Burns et al., 2014). Consequently, these SNe Ia are routinely excised from cosmology samples, and the belief that ‘1991bg-like SNe are not standard candles’ has become dogma.
| SN | Host | Classa | |||||
|---|---|---|---|---|---|---|---|
| (mag) | (mag) | (mag) | (mag) | ||||
| Calibration sample | |||||||
| 1991bg | NGC 4374 | E | 1.88(0.10) | 0.321(0.061) | 31.23(0.02) | 0.037 | 0.05(0.02) |
| 1998de | NGC 0252 | S0 | 1.95(0.09) | 0.351(0.120) | 33.98(0.20) | 0.052 | 0.00(0.00) |
| 1999by | NGC 2841 | Sab | 1.90(0.05) | 0.381(0.063) | 30.84(0.05) | 0.010 | 0.020(0.030) |
| 2005bl | NGC 4059 | E | 2.00(0.06) | 0.387(0.061) | 35.21(0.11) | 0.025 | 0.17(0.08) |
| 2006mr | NGC 1316 | Sab | 1.82(0.02) | 0.239(0.060) | 31.42(0.02) | 0.018 | 0.089(0.039) |
| 2007ax | NGC 2577 | S0 | 1.87(0.06) | 0.355(0.061) | 33.20(0.14) | 0.045 | |
| 2008R | NGC 1200 | S0 | 1.82(0.02) | 0.591(0.060) | 33.66(0.08) | 0.062 | 0.009(0.013) |
| 2015bo | NGC 5490 | E | 1.91(0.01) | 0.480(0.010) | 34.27(0.08) | 0.023 | 0.00(0.00) |
| 2017ejb | NGC 4696 | E | 2.04(0.04) | 0.470(0.010) | 32.88(0.06) | 0.097 | 0.05(0.02) |
| 2019so | NGC 4622 | Sa | 1.96(0.04) | 0.410(0.010) | 34.27(0.48) | 0.128 | -0.01(0.02) |
| 2021qvv | NGC 4442 | S0 | 2.05(0.03) | 0.280(0.050) | 30.85(0.07) | 0.019 | 0.00(0.00) |
| Test sample | |||||||
| 1997cn | NGC 5490 | E | 1.90(0.05) | 0.350(0.060) | 34.27(0.08) | 0.023 | 0.00(0.00) |
| 1999da | NGC 6411 | E | 1.94(0.10) | 0.442(0.160) | 33.12(0.27) | 0.046 | 0.00(0.00) |
| aGalaxy classifications sourced from de Vaucouleurs et al. (1991). | |||||||
Burns et al. (2014) introduced a different stretch parameter, , defined as the time at which the colour curve reaches peak, relative to the time of -band peak, divided by 30 days. When used as the basis for their own light-curve fitter, SNooPy (Burns et al., 2011), this parameter made it possible to standardize not just the light curves of normal and overluminous SNe Ia, but also underluminous SNe Ia as well. And yet, underluminous 1991bg-like SNe Ia are still not treated as standardizable candles. Some of this has to do with the continued use of light-curve fitters such as SALT2 and MLCS2k2, which are optimized for normal SNe Ia, and some of it has to do with the now deeply-ingrained belief that 1991bg-like SNe fall off the width-luminosity relation. To wit, even Burns et al. (2018), who used SNooPy to measure the Hubble-Lemaître Constant, , still imposed an cut that excluded most of the 1991bg-like SNe in their sample.
There are hints that the bias against 1991bg-like SNe may be starting to fade. Burns et al. (2018) and Hoogendam et al. (2022) noted that distances derived from the light curves of the 1991bg-like SNe 2006mr and 2015bo were consistent with independent distance measurements of their host galaxies. Hoogendam et al. (2022) also included a figure of SNooPy-derived -band peak absolute magnitudes vs. that extended all the way down to 1991bg-like SNe (). The apparent correlation between the peak -band luminosities and values of the 1991bg-like SNe is striking but not elaborated on.
In this paper, I set out to test whether there truly is a correlation between the luminosities of 1991bg-like SNe and the widths of their light curves, as parameterized by . In Section 2, I assemble a sample of 13 1991bg-like SNe that suffered little to no dust extinction and that exploded in galaxies with independent distance measurements. Since all SN Ia light-curve fitters are optimized towards normal SNe Ia, in Section 3 I fit the light curves of the SNe myself with Gaussian process regression (GPR). The results, shown in Section 4, are clear: there are statistically significant correlations between the peak absolute magnitudes of 1991bg-like SNe and in multiple filters (, , , , and ). This leads to Section 5, in which I discuss the potential use of 1991bg-like SNe in a new distance ladder, independent from the one currently dominating SN Ia cosmology.
2 Sample
A review of the literature on 1991bg-like SNe revealed that only such objects had been methodically observed and published. Of these, only 13 had well-sampled multiwavelength light curves, exploded in galaxies with independent distance measurements, and suffered relatively little host-galaxy dust extinction ( mag). The latter is important because most estimates of host-galaxy extinction are a byproduct of light-curve fitting, which I avoid in this paper. The SN sample used in this work is shown in Table 1. Of the 13 SNe, 11 are used to test for the presence of a width-luminosity relation, while the other two SNe are held back as test cases (Section 4.3). Below, I describe the sources of the light curves used in this work. Basic parameters of the SNe in the sample, including the names and types of galaxies in which they exploded, are summarized in Table 1.
The eponymous SN 1991bg was extensively studied by Filippenko et al. (1992a), Leibundgut et al. (1993), and Turatto et al. (1996). Here, I use the peak magnitudes reported by Turatto et al. (1996), based on a combined analysis of their data and those of Filippenko et al. (1992a) and Leibundgut et al. (1993). observations of SN 1997cn were published by Turatto et al. (1998) and Jha et al. (2006a). Modjaz et al. (2001) and Jha et al. (2006a) published light curves of SN 1998de, obtained as part of the Lick Observatory Supernova Search (LOSS; Filippenko et al. 2001). observations of SN 1999by were published by Garnavich et al. (2004), who presented an in-depth study of this object. Additional observations, obtained by LOSS, were published by Ganeshalingam et al. (2010). and observations of SN 1999da were published by Krisciunas et al. (2001) and Ganeshalingam et al. (2010), respectively. Here, I use the latter as they contain the additional filter.
The Carnegie Supernova Project (CSP; Contreras et al. 2010; Stritzinger et al. 2011; Krisciunas et al. 2017) have published observations of 16 underluminous, 1991bg-like SNe. Of these, only the host galaxies of SNe 2005bl, 2006mr, 2007ax, and 2008R had independent distance measurements and host-galaxy reddening mag (Burns et al., 2014). An independent analysis of SN 2005bl (Taubenberger et al., 2008) estimated a host-galaxy reddening of mag and an value of 3.1, which I use here. Additional observations of SN 2007ax were published by Kasliwal et al. (2008), who also estimated a negligible host-galaxy reddening of mag.
SN 2015bo was discovered by Howerton (2016) and studied by Hoogendam et al. (2022). Here, I use the light curves reported by the latter. observations of SNe 2017ejb and 2019so were obtained with the Las Cumbres Observatory’s network of 1-m telescopes (Brown et al., 2013) and reported by Chen et al. (2022). SN 2017ejb was discovered by the Mpc survey (Tartaglia et al., 2017) and spectroscopically classified as a 1991bg-like SN by Pan et al. (2017) and Valenti et al. (2017). SN 2019so was discovered by the Asteroid Terrestrial-impact Last Alert System (ATLAS; Tonry et al. 2018) and reported by Smith et al. (2019). Although a spectroscopic classification of this SN has not yet been published, its light curves are consistent with those of other 1991bg-like SNe.
3 Analysis
Here, I describe the steps taken to measure the peak absolute magnitudes of the SNe in my sample: measuring (Section 3.1), obtaining the distance moduli of the SN host galaxies (Section 3.2) and the reddening suffered by the SNe (Section 3.3), and measuring peak apparent and absolute magnitudes (Section 3.4).
3.1 Colour stretch
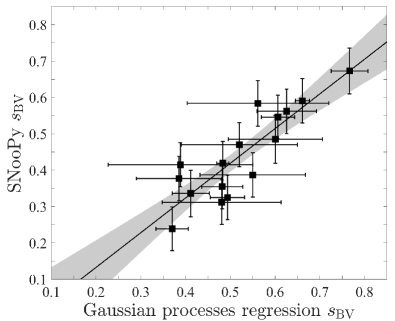
SNe 1997cn, 2005bl, 2006mr, 2007ax, 2008R, 2015bo, 2017ejb, and 2019so have been fit with SNooPy by other authors (Burns et al., 2014; Krisciunas et al., 2017; Hoogendam et al., 2022; Chen et al., 2022). For these SNe, I use the published values. For the rest of the sample (namely, SNe 1991bg, 1998de, 1999by, 1999da, and 2021qvv), I have derived by fitting their light curves with GPR fits, as done by Graur et al. (2023). To ensure that the GPR-derived values are not systematically offset from the SNooPy-derived values, I use GPR to fit the light curves of 16 1991bg-like SNe observed by CSP (SNe 2005bl, 2005ke, 2006gt, 2006mr, 2007N, 2007ax, 2007ba, 2008R, 2009F, 2006bd, 2006hb, 2007al, 2007jh, 2008bd, 2008bi, and 2008bt) and compare my values to those published by Krisciunas et al. (2017). As Fig. 1 shows, there is a tight correlation between the two techniques, with and a reduced value of . The GPR-derived values of the pre-2000 SNe have been corrected accordingly. The resultant values, along with measurements from the literature, are presented in Table 1.
3.2 Distance moduli
No single work on nearby distance moduli encompasses all of the host galaxies in my sample. Instead of picking and choosing between the various measurements available for each galaxy, I take a weighted mean of all measurements conducted from the year 2000 onwards. For some host galaxies, which have measurements, this results in an underestimated uncertainty on the distance modulus. I do not include distance modulus measurements derived from fitting the light curves of the SNe in the sample, for two reasons. First, this would be cyclical reasoning, as the goal of this paper is to ascertain whether 1991bg-like SNe can be used as standardizable candles. Second, as Graur et al. (2023) noted, because current light-curve fitters are not optimized for 1991bg-like SNe, the distance moduli derived in this manner often span a range of mag. The sources of the measurements used for each host galaxy are gathered in Appendix A, and the resultant distance moduli and their uncertainties are collected in Table 1.
3.3 Reddening
Galactic line-of-sight reddening towards the SNe in the sample, , were extracted from the reddening maps produced by Schlafly & Finkbeiner (2011), while host-galaxy reddening values, , were extracted from the literature (see Section 2). Unlike Galactic reddening, host-galaxy reddening is derived from light-curve fits. Since most light-curve fitters are not optimized towards fitting 1991bg-like light curves, these values are suspect. Thus, I chose to include only SNe whose literature values were mag. The sole exception is SN 2005bl, with mag (Taubenberger et al., 2008). As it exploded in an elliptical galaxy, I chose to keep it in the sample. To avoid any systematic uncertainties that have to do with how host-galaxy reddening and values are derived, and since, by design, the host-galaxy reddenings are low, I chose not take them into account in the following analysis. A test in which these values were included in the derivation of the peak absolute magnitudes showed that including them did not impact the results in a significant manner.
3.4 Peak magnitudes
Here, I follow Graur et al. (2023) and fit the light curves of the SNe in my sample using the Matlab 2023a GPR-fitting routine fitrgp with the default parameters. These fits provide the date and magnitude of maximum light in each of six filters: , , , , , and . To estimate the uncertainties on the derived parameters, I repeat the fit in each filter 100 times, each time varying the photometry of the SN randomly according to the measurement uncertainties. The mean and standard deviation of the results are then taken as the estimated peak date and its uncertainty. The same method is applied to estimating the peak apparent magnitude in each filter. Magnitude uncertainties smaller than mag are rounded up. The resultant peak apparent magnitudes are presented in Table 2.
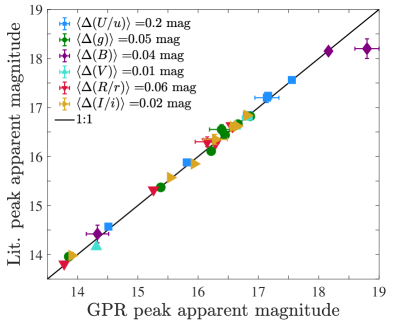
In Fig. 2, I compare the peak apparent magnitudes derived using this method with published values from the literature, derived using various fitting techniques. In all filters except , the mean difference between the GPR and literature values is mag. In , this value rises to mag, but this is due to a single outlier, SN 2005bl.
With the fitted peak apparent magnitudes, Galactic reddening values, and distance moduli described above, the peak absolute magnitude of the -th SN in my sample in filter is simply:
| (1) |
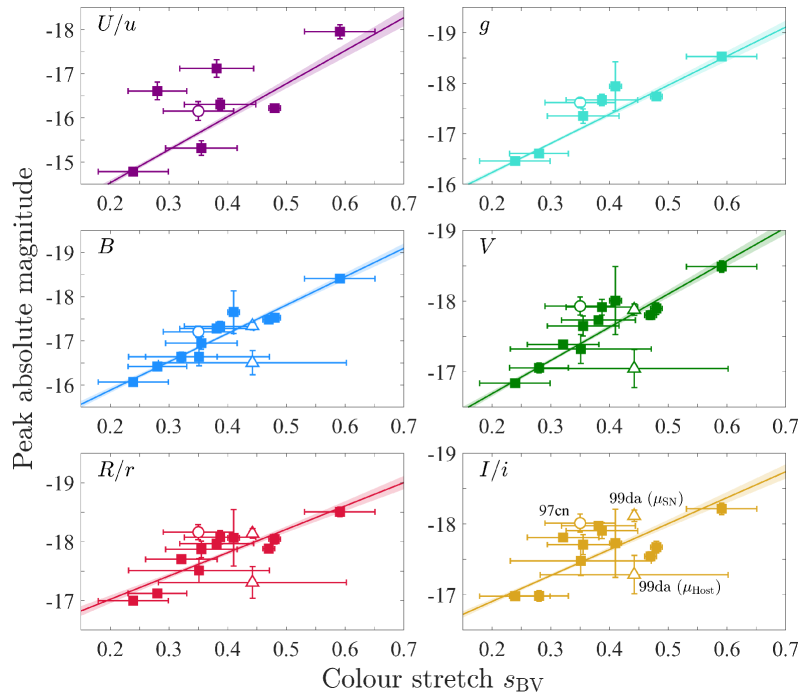
where is the distance modulus of the -th SN, and is derived from the Galactic line-of-sight reddening, , the Galaxy’s , and the Cardelli et al. (1989) extinction law. Due to the nature of the SN sample, which includes SNe observed by different surveys in different filters (e.g., , , and ), I do not attempt to perform or corrections. The resultant peak absolute magnitudes are presented in Table 3 and Fig. 3.
4 Results
Here, I fit the peak absolute magnitudes measured in the previous section and show that correlations between them and the colour stretch of the SNe are statistically significant in all filters except (Section 4.1); compare these correlations to fits applied to independent CSP data (Section 4.2); and demonstrate the effect of these correlations on our understanding of SNe 1997cn and 1999da (Section 4.3).
4.1 Width-luminosity relations
I perform two independent tests to determine whether the peak absolute magnitudes in a specific filter are correlated with colour stretch, , the results of which are collected in Table 4. First, all filters display a strong, negative Pearson correlation coefficient, , with in , , , and , and in and . The same test shows that these correlations have statistically significant -values of in all filters except (and a more stringent in all filters except and ). Second, A likelihood-ratio test (see, e.g., Graur et al. 2017a) prefers a 1st-order polynomial over a 0th-order polynomial fit to the data in every filter with a statistical significance of . The same test shows that a 2nd-order polynomial is not preferred over a 1st-order polynomial.
Based on the likelihood-ratio test, I fit 1st-order polynomials to the peak absolute magnitudes in each filter, the results of which are presented in Table 4 and Fig. 3. An analysis of the residuals produced by subtracting the best-fitting polynomials from the data reveals a scatter, , of mag in all filters except , and mag in and . I attribute the high scatter in to the difficulty in estimating the time of peak from photometry that, only in this band, did not always cover the rise and peak of the light curves (SNe 1999by, 2007ax, 2008R, and 2021qvv). Note that, even without and corrections, and with distance moduli derived using a variety of techniques, the scatter found here is on par with, or better than, the scatter found in the initial width-luminosity relations measured by Phillips (1993) for normal SNe Ia.
| SN | ||||||
| (mag) | (mag) | (mag) | (mag) | (mag) | (mag) | |
| Calibration sample | ||||||
| 1991bg | 14.75(0.10) | 13.96(0.05) | 13.63(0.05) | 13.50(0.05) | ||
| 1998de | 17.56(0.04) | 16.82(0.04) | 16.61(0.04) | 16.61(0.05) | ||
| 1999by | 13.77(0.19) | 13.60(0.01) | 13.14(0.01) | 12.90(0.01) | 12.89(0.01) | |
| 2005bl | 19.85(0.07) | 18.28(0.02) | 18.70(0.02) | 17.90(0.02) | 17.66(0.03) | 17.71(0.03) |
| 2006mr | 16.72(0.03) | 15.03(0.01) | 15.43(0.04) | 14.64(0.01) | 14.47(0.05) | 14.48(0.01) |
| 2007ax | 18.10(0.09) | 16.02(0.03) | 16.44(0.02) | 15.69(0.02) | 15.45(0.01) | 15.59(0.01) |
| 2008R | 16.01(0.13) | 15.37(0.01) | 15.51(0.01) | 15.37(0.01) | 15.32(0.01) | 15.58(0.02) |
| 2015bo | 18.16(0.04) | 16.62(0.01) | 16.85(0.01) | 16.45(0.01) | 16.29(0.01) | 16.65(0.02) |
| 2017ejb | 15.81(0.02) | 15.38(0.02) | 15.26(0.02) | 15.54(0.02) | ||
| 2019so | 16.81(0.08) | 17.16(0.03) | 16.66(0.02) | 16.55(0.02) | 16.81(0.04) | |
| 2021qvv | 14.33(0.19) | 14.31(0.03) | 14.51(0.01) | 13.85(0.01) | 13.78(0.01) | 13.91(0.02) |
| Test sample | ||||||
| 1997cn (GPR) | 18.20(0.20) | 17.20(0.10) | 16.55(0.10) | 16.30(0.10) | 16.35(0.10) | |
| 1997cn (2007ax) | 18.23(0.20) | 16.74(0.03) | 17.16(0.10) | 16.41(0.10) | 16.17(0.10) | 16.31(0.10) |
| 1999da () | 16.81(0.03) | 16.22(0.01) | 15.94(0.02) | 15.93(0.02) | ||
| 1999da () | 15.98(0.03) | 15.39(0.01) | 15.11(0.02) | 15.10(0.02) | ||
| SN | ||||||
| (mag) | (mag) | (mag) | (mag) | (mag) | (mag) | |
| Calibration sample | ||||||
| 1991bg | -16.64(0.10) | -17.38(0.05) | -17.70(0.05) | -17.81(0.05) | ||
| 1998de | -16.64(0.20) | -17.32(0.20) | -17.51(0.20) | -17.48(0.21) | ||
| 1999by | -17.12(0.20) | -17.28(0.05) | -17.73(0.05) | -17.97(0.05) | -17.97(0.05) | |
| 2005bl | -16.31(0.13) | -17.67(0.11) | -17.33(0.11) | -17.91(0.11) | -18.07(0.11) | -17.91(0.11) |
| 2006mr | -14.79(0.04) | -16.46(0.02) | -16.07(0.04) | -16.84(0.02) | -17.00(0.06) | -16.98(0.02) |
| 2007ax | -15.32(0.17) | -17.35(0.14) | -16.95(0.14) | -17.65(0.14) | -17.87(0.14) | -17.71(0.14) |
| 2008R | -17.95(0.13) | -18.53(0.08) | -18.41(0.08) | -18.49(0.08) | -18.51(0.08) | -18.21(0.08) |
| 2015bo | -17.52(0.08) | -17.89(0.08) | -16.22(0.09) | -17.74(0.08) | -18.04(0.08) | -17.67(0.08) |
| 2017ejb | -17.48(0.06) | -17.80(0.06) | -17.88(0.06) | -17.54(0.06) | ||
| 2019so | -17.94(0.49) | -17.65(0.48) | -18.01(0.48) | -18.07(0.48) | -17.73(0.48) | |
| 2021qvv | -16.61(0.20) | -16.61(0.07) | -16.42(0.07) | -17.05(0.07) | -17.12(0.07) | -16.98(0.07) |
| Test sample | ||||||
| 1997cn (GPR) | -16.18(0.22) | -17.17(0.13) | -17.79(0.13) | -18.03(0.13) | -17.97(0.13) | |
| 1997cn (2007ax) | -16.16(0.22) | -17.62(0.09) | -17.21(0.13) | -17.93(0.13) | -18.16(0.13) | -18.01(0.13) |
| 1999da () | -16.51(0.27) | -17.05(0.27) | -17.31(0.27) | -17.28(0.27) | ||
| 1999da () | -17.34(0.08) | -17.88(0.08) | -18.14(0.08) | -18.12(0.08) | ||
| Filter | |||||||
| (mag) | (mag) | () | (mag) | ||||
| -7.5(0.3) | -13.0(0.1) | 26 | 5 | -0.72 | 0.74 | ||
| -5.8(0.2) | -15.1(0.1) | 1.6 | 5 | -0.95 | 0.23 | ||
| -6.4(0.2) | -14.6(0.1) | 3.9 | 5 | -0.96 | 0.19 | ||
| -4.7(0.2) | -15.8(0.1) | 3.6 | 5 | -0.93 | 0.18 | ||
| -4.0(0.2) | -16.2(0.1) | 7.9 | 5 | -0.88 | 0.21 | ||
| -3.7(0.2) | -16.2(0.1) | 23 | 5 | -0.72 | 0.28 | ||
| Columns are: (1) filter; () best-fitting parameters for a first-order polynomial | |||||||
| (uncertainties appear in parentheses); (4) reduced of fit; | |||||||
| (5) significance of likelihood-ratio test; () Pearson coefficient and its -value; | |||||||
| and (8) scatter after subtracting the best-fitting polynomial from the data. | |||||||
 |
 |
4.2 Comparison with CSP
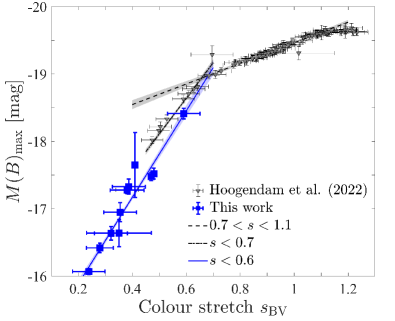
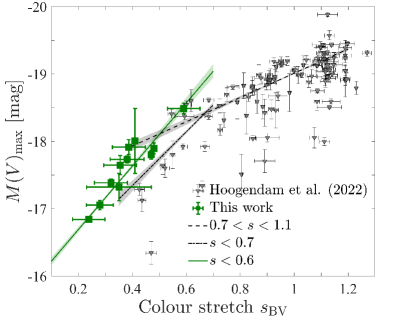
In Fig. 4, I compare my - and -band measurements to similar CSP peak absolute magnitudes from Hoogendam et al. (2022). These measurements are preliminary (the finalized CSP measurements will appear in the published version of Uddin et al. 2023; W. B. Hoogendam, private communication) but provide a good sanity test and the option to compare the correlations found above with the well-established width-luminosity relation of normal SNe Ia.
The -band CSP data were obtained by fitting the light curves with SNooPy using the EBV2 model, while the -band peak absolute magnitudes were obtained via GPR fits, which explains the larger scatter in this filter (Hoogendam et al., 2022). To recreate figure 9 from Hoogendam et al. (2022), I have removed all -band measurements with uncertainties mag and (Hoogendam et al. 2022 used a stricter , but my sample has an average ). No cuts were applied to the -band data.
A likelihood-ratio test applied to the entire range of data in the band prefers a 2nd-order polynomial over a 1st-order polynomial at a confidence level, indicating that the underluminous SNe Ia follow a different trend than the normal ones. The scatter in this filter is small enough that this preference can be seen by eye as well. The same likelihood-ratio test conducted on the -band CSP measurements finds no statistically significant preference for a 2nd-order polynomial over a 1st-order polynomial, or even for a 1st-order polynomial over a 0th-order polynomial.
Based on the results of the likelihood-ratio test on the -band CSP data, I fit the CSP measurements in both filters with 1st-order polynomials in two ranges: to capture all normal SNe Ia (as well as transitional SNe Ia), and to include only underluminous SNe Ia. In the band, I find that the normal SNe Ia follow and underluminous SNe Ia follow . In the band, the correlations are and , respectively. The higher values, divided by the number of degrees of freedom, are due to the larger scatter of the measurements in this filter.
Overplotting the - and -band peak absolute magnitudes from Fig. 3 shows that the width-luminosity relations from my sample are in broadly good agreement with the fits to the CSP data. This is somewhat surprising, given the heterogeneity of my sample, the variety of methods used to derive distance moduli to the SN host galaxies, and the lack of corrections. It is too much to assume that all of these factors would conspire to produce correlations that coincidentally agreed with the homogeneous, well-calibrated CSP data. Instead, we must conclude that there are, indeed, clear correlations between the peak absolute magnitudes of underluminous SNe Ia and the widths of their light curves, as parameterized by .
4.3 Two test cases
When constructing the SN sample in Section 2, the underluminous SNe 1997cn and 1999da were set aside. Below, I describe the circumstances that led me to isolate each of these SNe and how they help validate the width-luminosity relations from Section 4.1.
4.3.1 SN 1997cn
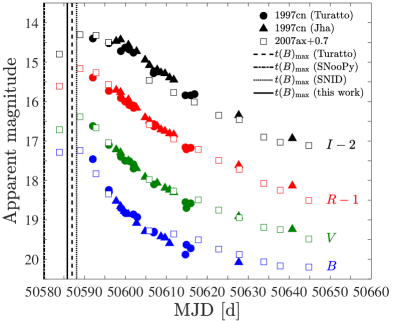
SN 1997cn was discovered by Li et al. (1997) and observed by both Turatto et al. (1998) and Jha et al. (2006a), but only after it had already peaked and begun to decline. Turatto et al. (1998) estimated that the SN reached -band maximum light on JD 2450587.5, while Hoogendam et al. (2022) used SNooPy to fit the Jha et al. (2006a) light curves and derive a peak date of , 6.8 d earlier than the Turatto et al. (1998) date and d prior to its discovery. A spectroscopic fit with SNID (Blondin & Tonry, 2007) yielded a third date: 2450588.3, 0.8 d after the Turatto et al. (1998) estimate. As the light curves of this SN did not cover the date of maximum light, I did not include it in my sample.
The SNooPy fit conducted by Hoogendam et al. (2022) provided an value of . As this value is consistent with the value of SN 2007ax, (Krisciunas et al., 2017), the light curves of the two SNe can be compared to each other directly. In Fig. 5, I fit the -band measurements of SN 2007ax to those of SN 1997cn taken by both Turatto et al. (1998) and Jha et al. (2006a) by varying the date of maximum light and the offset between the light curves. I find d, with SN 1997cn mag fainter than SN 2007ax, with a reduced .
Fig. 3 includes peak absolute magnitudes of SN 1997cn estimated by adding an offset of mag to the peak apparent magnitudes of SN 2007ax. The resultant values are consistent with peak apparent magnitudes estimated by GPR fits to the data from Jha et al. (2006a), with the exception of the band, in which there were no previous measurements. In all filters, the resultant peak absolute magnitudes of SN 1997cn are consistent with the width-luminosity relations within the scatter of the calibration sample. This indicates that the width-luminosity relations measured in Section 4.1 can be used to estimate the peak absolute magnitudes of individual underluminous SNe Ia.
4.3.2 SN 1999da
The host galaxy of SN 1999da only had two independent, post-2000 distance measurements (both from Blakeslee et al. 2001), which averaged to mag. However, distance moduli derived by fitting the light curves of this SN by various groups (Riess et al., 2004; Wang et al., 2006; Jha et al., 2007; Kowalski et al., 2008; Hicken et al., 2009), using different light-curve fitters, produced an average value of , mag fainter. Fig. 3 shows SN 1999da twice, using each of the distance moduli above. In all four filters in which this SN was observed, the peak absolute magnitudes derived using the host-based distance modulus are systematically dimmer than the width-luminosity relations. The peak absolute magnitudes derived with the light-curve-based distance modulus, on the other hand, are consistent with the correlations. This indicates that, at least for this SN, existing light-curve fitters already did a good job of deriving its luminosity distance.
5 Conclusions
In this work, I have assembled a sample of 13 underluminous, 1991bg-like SNe Ia from the literature to test whether this type of SN Ia can be used as a standardizable candle. To minimize systematic uncertainties, I have chosen SNe that exploded in host galaxies with low to no reddening and well-sampled light curves. Even so, the sample still suffers from systematic uncertainties that stem from the variety of filters in which the SNe were observed as well as a lack of and corrections. This sample still exhibits statistically significant () correlations between the peak absolute magnitudes of the underluminous SNe and the widths of their light curves, as parameterized by the colour stretch, .
The underluminous width-luminosity relations measured here are similar in nature to those of normal SNe Ia but with significantly steeper slopes. The - and -band width-luminosity relations are consistent with preliminary CSP data, which both strengthens the existence of the correlations and shows that SNooPy, the light-curve fitter used by CSP, is able to standardize underluminous as well as normal SNe Ia. The correlations shown here are further strengthened by two test cases, SNe 1997cn and 1999da, which were not included in the calibration sample.
The work done here shows that underluminous, 1991bg-like SNe Ia can be standardized and hence used to measure extragalactic distances. However, these width-luminosity relations must first be properly calibrated by compiling a homogeneous sample of 1991bg-like SNe Ia observed by a single survey in a single set of filters. Even then, because 1991bg-like SNe are rarer than normal SNe Ia (15 vs. 70 per cent of all SNe Ia, respectively; Graur et al. 2017b), their inclusion in SN Ia cosmology samples will not make much of a difference. Moreover, their inherent dimness makes them more susceptible to Malmquist bias, which limits their use as probes of dark energy.
Instead, I suggest using 1991bg-like SNe Ia as a rung on a new cosmological distance ladder, one that would provide an independent check on the distance ladder based on Cepheids and normal SNe Ia. While extremely successful (e.g., Riess et al. 2022), the latter ladder is biased towards star-forming galaxies, which host young Cepheid variables. Underluminous SNe Ia, on the other hand, are mostly found in massive, passive galaxies (Graur et al., 2017b). This makes them less prone to host-galaxy reddening and removes the systematic uncertainty produced by the mass step found in Hubble residuals (e.g., Kelly et al. 2010; Brout & Scolnic 2021; Kelsey et al. 2021, 2023; Meldorf et al. 2023).
Bereft of Cepheids, the galaxies that host underluminous SNe Ia will have to be calibrated by other means, such as surface-brightness fluctuations. Several groups have already attempted to use this method to either measure directly or to calibrate the host galaxies of normal SNe Ia (e.g., Blakeslee et al. 2021; Jensen et al. 2021; Khetan et al. 2021; Garnavich et al. 2023; Uddin et al. 2023; Wood et al. 2023). A new distance ladder, based on surface-brightness fluctuations (or some other non-Cepheid method) and 1991bg-like SNe Ia could provide an independent measurement of , a necessary step towards resolving the current ‘Hubble tension’ (e.g., Di Valentino et al. 2021; Kamionkowski & Riess 2023).
Acknowledgments
I thank Chris R. Burns and Saurabh W. Jha for helpful discussions, and Willem B. Hoogendam and the CSP for sharing their data with me. This research has made use of NASA’s Astrophysics Data System and the NASA/IPAC Extragalactic Database (NED), which are funded by the National Aeronautics and Space Administration and operated by the California Institute of Technology.
Data availability
All data used in this work, except for the CSP data shown in Fig. 4, are public and have been published elsewhere. The measurements and fits produced by this work are included in the tables throughout this paper. Any remaining data or measurements will be shared on request to the corresponding author.
References
- Ajhar et al. (2001) Ajhar E. A., Tonry J. L., Blakeslee J. P., Riess A. G., Schmidt B. P., 2001, ApJ, 559, 584
- Bernardi et al. (2002) Bernardi M., Alonso M. V., da Costa L. N., Willmer C. N. A., Wegner G., Pellegrini P. S., Rité C., Maia M. A. G., 2002, AJ, 123, 2159
- Blakeslee et al. (2001) Blakeslee J. P., Lucey J. R., Barris B. J., Hudson M. J., Tonry J. L., 2001, MNRAS, 327, 1004
- Blakeslee et al. (2009) Blakeslee J. P., et al., 2009, ApJ, 694, 556
- Blakeslee et al. (2010) Blakeslee J. P., et al., 2010, ApJ, 724, 657
- Blakeslee et al. (2021) Blakeslee J. P., Jensen J. B., Ma C.-P., Milne P. A., Greene J. E., 2021, ApJ, 911, 65
- Blondin & Tonry (2007) Blondin S., Tonry J. L., 2007, ApJ, 666, 1024
- Brout & Scolnic (2021) Brout D., Scolnic D., 2021, ApJ, 909, 26
- Brown et al. (2013) Brown T. M., et al., 2013, PASP, 125, 1031
- Burns et al. (2011) Burns C. R., et al., 2011, AJ, 141, 19
- Burns et al. (2014) Burns C. R., et al., 2014, ApJ, 789, 32
- Burns et al. (2018) Burns C. R., et al., 2018, ApJ, 869, 56
- Cantiello et al. (2005) Cantiello M., Blakeslee J. P., Raimondo G., Mei S., Brocato E., Capaccioli M., 2005, ApJ, 634, 239
- Cantiello et al. (2007) Cantiello M., Blakeslee J., Raimondo G., Brocato E., Capaccioli M., 2007, ApJ, 668, 130
- Cantiello et al. (2011) Cantiello M., Biscardi I., Brocato E., Raimondo G., 2011, A&A, 532, A154
- Cantiello et al. (2013) Cantiello M., et al., 2013, A&A, 552, A106
- Cardelli et al. (1989) Cardelli J. A., Clayton G. C., Mathis J. S., 1989, ApJ, 345, 245
- Chen et al. (2022) Chen P., et al., 2022, ApJS, 259, 53
- Ciardullo et al. (2002) Ciardullo R., Feldmeier J. J., Jacoby G. H., Kuzio de Naray R., Laychak M. B., Durrell P. R., 2002, ApJ, 577, 31
- Conley et al. (2008) Conley A., et al., 2008, ApJ, 681, 482
- Contreras et al. (2010) Contreras C., et al., 2010, AJ, 139, 519
- Courtois & Tully (2012) Courtois H. M., Tully R. B., 2012, ApJ, 749, 174
- Di Valentino et al. (2021) Di Valentino E., et al., 2021, Classical and Quantum Gravity, 38, 153001
- Feldmeier et al. (2007) Feldmeier J. J., Jacoby G. H., Phillips M. M., 2007, ApJ, 657, 76
- Ferrarese et al. (2000) Ferrarese L., et al., 2000, ApJ, 529, 745
- Filippenko et al. (1992a) Filippenko A. V., et al., 1992a, AJ, 104, 1543
- Filippenko et al. (1992b) Filippenko A. V., et al., 1992b, ApJ, 384, L15
- Filippenko et al. (2001) Filippenko A. V., Li W. D., Treffers R. R., Modjaz M., 2001, in Paczynski B., Chen W.-P., Lemme C., eds, Astronomical Society of the Pacific Conference Series Vol. 246, IAU Colloq. 183: Small Telescope Astronomy on Global Scales. p. 121
- Foley et al. (2013) Foley R. J., et al., 2013, ApJ, 767, 57
- Ganeshalingam et al. (2010) Ganeshalingam M., et al., 2010, ApJS, 190, 418
- Garnavich et al. (2004) Garnavich P. M., et al., 2004, ApJ, 613, 1120
- Garnavich et al. (2023) Garnavich P., et al., 2023, ApJ, 953, 35
- Gómez & Richtler (2004) Gómez M., Richtler T., 2004, A&A, 415, 499
- Graham (2002) Graham A. W., 2002, MNRAS, 334, 859
- Graur (2022) Graur O., 2022, Supernova. The MIT Press, Cambridge, MA
- Graur et al. (2017a) Graur O., Bianco F. B., Huang S., Modjaz M., Shivvers I., Filippenko A. V., Li W., Eldridge J. J., 2017a, ApJ, 837, 120
- Graur et al. (2017b) Graur O., Bianco F. B., Modjaz M., Shivvers I., Filippenko A. V., Li W., Smith N., 2017b, ApJ, 837, 121
- Graur et al. (2023) Graur O., et al., 2023, MNRAS, 526, 2977
- Guy et al. (2005) Guy J., Astier P., Nobili S., Regnault N., Pain R., 2005, A&A, 443, 781
- Guy et al. (2007) Guy J., et al., 2007, A&A, 466, 11
- Hicken et al. (2009) Hicken M., Wood-Vasey W. M., Blondin S., Challis P., Jha S., Kelly P. L., Rest A., Kirshner R. P., 2009, ApJ, 700, 1097
- Hoogendam et al. (2022) Hoogendam W. B., et al., 2022, ApJ, 928, 103
- Howerton (2016) Howerton S., 2016, Transient Name Server Discovery Report, 2016-157, 1
- Jensen et al. (2003) Jensen J. B., Tonry J. L., Barris B. J., Thompson R. I., Liu M. C., Rieke M. J., Ajhar E. A., Blakeslee J. P., 2003, ApJ, 583, 712
- Jensen et al. (2021) Jensen J. B., et al., 2021, ApJS, 255, 21
- Jha et al. (2006a) Jha S., et al., 2006a, AJ, 131, 527
- Jha et al. (2006b) Jha S., Branch D., Chornock R., Foley R. J., Li W., Swift B. J., Casebeer D., Filippenko A. V., 2006b, AJ, 132, 189
- Jha et al. (2007) Jha S., Riess A. G., Kirshner R. P., 2007, ApJ, 659, 122
- Jordán et al. (2005) Jordán A., et al., 2005, ApJ, 634, 1002
- Jordán et al. (2007) Jordán A., et al., 2007, ApJS, 171, 101
- Kamionkowski & Riess (2023) Kamionkowski M., Riess A. G., 2023, Annual Review of Nuclear and Particle Science, 73, 153
- Kasliwal et al. (2008) Kasliwal M. M., et al., 2008, ApJ, 683, L29
- Kelly et al. (2010) Kelly P. L., Hicken M., Burke D. L., Mandel K. S., Kirshner R. P., 2010, ApJ, 715, 743
- Kelsey et al. (2021) Kelsey L., et al., 2021, MNRAS, 501, 4861
- Kelsey et al. (2023) Kelsey L., et al., 2023, MNRAS, 519, 3046
- Khetan et al. (2021) Khetan N., et al., 2021, A&A, 647, A72
- Kowalski et al. (2008) Kowalski M., et al., 2008, ApJ, 686, 749
- Krisciunas et al. (2001) Krisciunas K., et al., 2001, AJ, 122, 1616
- Krisciunas et al. (2017) Krisciunas K., et al., 2017, AJ, 154, 211
- Leibundgut et al. (1993) Leibundgut B., et al., 1993, AJ, 105, 301
- Li et al. (1997) Li W. D., Qiu Y. L., Qiao Q. Y., Zhang Y., Zhou W., Hu J. Y., 1997, IAU Circ., 6661, 1
- Macri et al. (2001) Macri L. M., Stetson P. B., Bothun G. D., Freedman W. L., Garnavich P. M., Jha S., Madore B. F., Richmond M. W., 2001, ApJ, 559, 243
- Masters et al. (2010) Masters K. L., et al., 2010, ApJ, 715, 1419
- Mei et al. (2007) Mei S., et al., 2007, ApJ, 655, 144
- Meldorf et al. (2023) Meldorf C., et al., 2023, MNRAS, 518, 1985
- Mieske & Hilker (2003) Mieske S., Hilker M., 2003, A&A, 410, 445
- Mieske et al. (2005) Mieske S., Hilker M., Infante L., 2005, A&A, 438, 103
- Misgeld & Hilker (2011) Misgeld I., Hilker M., 2011, MNRAS, 414, 3699
- Modjaz et al. (2001) Modjaz M., Li W., Filippenko A. V., King J. Y., Leonard D. C., Matheson T., Treffers R. R., Riess A. G., 2001, PASP, 113, 308
- Neill et al. (2014) Neill J. D., Seibert M., Tully R. B., Courtois H., Sorce J. G., Jarrett T. H., Scowcroft V., Masci F. J., 2014, ApJ, 792, 129
- Pan et al. (2017) Pan Y. C., Reed D. K., Medallon M. S., Foley R. J., Jha S. W., Rest A., Scolnic D., 2017, The Astronomer’s Telegram, 10437, 1
- Perlmutter et al. (1999) Perlmutter S., et al., 1999, ApJ, 517, 565
- Phillips (1993) Phillips M. M., 1993, ApJ, 413, L105
- Phillips & Burns (2017) Phillips M. M., Burns C. R., 2017, in Alsabti A. W., Murdin P., eds, , Handbook of Supernovae. p. 2543, doi:10.1007/978-3-319-21846-5_100
- Phillips et al. (1987) Phillips M. M., et al., 1987, PASP, 99, 592
- Pskovskii (1977) Pskovskii I. P., 1977, Soviet Ast., 21, 675
- Riess et al. (1998) Riess A. G., et al., 1998, AJ, 116, 1009
- Riess et al. (2004) Riess A. G., et al., 2004, ApJ, 607, 665
- Riess et al. (2022) Riess A. G., et al., 2022, ApJ, 934, L7
- Russell (2002) Russell D. G., 2002, ApJ, 565, 681
- Rust (1974) Rust B. W., 1974, PhD thesis, Oak Ridge National Laboratory, Tennessee
- Saha et al. (2006) Saha A., Thim F., Tammann G. A., Reindl B., Sandage A., 2006, ApJS, 165, 108
- Sakai et al. (2000) Sakai S., et al., 2000, ApJ, 529, 698
- Saulder et al. (2016) Saulder C., van Kampen E., Chilingarian I. V., Mieske S., Zeilinger W. W., 2016, A&A, 596, A14
- Schlafly & Finkbeiner (2011) Schlafly E. F., Finkbeiner D. P., 2011, ApJ, 737, 103
- Smith et al. (2019) Smith K. W., et al., 2019, The Astronomer’s Telegram, 12389, 1
- Sorce et al. (2012) Sorce J. G., Tully R. B., Courtois H. M., 2012, ApJ, 758, L12
- Sorce et al. (2013) Sorce J. G., et al., 2013, ApJ, 765, 94
- Sorce et al. (2014) Sorce J. G., Tully R. B., Courtois H. M., Jarrett T. H., Neill J. D., Shaya E. J., 2014, MNRAS, 444, 527
- Springob et al. (2009) Springob C. M., Masters K. L., Haynes M. P., Giovanelli R., Marinoni C., 2009, ApJS, 182, 474
- Springob et al. (2014) Springob C. M., et al., 2014, MNRAS, 445, 2677
- Stritzinger et al. (2011) Stritzinger M. D., et al., 2011, AJ, 142, 156
- Tartaglia et al. (2017) Tartaglia L., Sand D., Wyatt S., Valenti S., Bostroem K. A., Reichart D. E., Haislip J. B., Kouprianov V., 2017, The Astronomer’s Telegram, 10439, 1
- Taubenberger et al. (2008) Taubenberger S., et al., 2008, MNRAS, 385, 75
- Theureau et al. (2007) Theureau G., Hanski M. O., Coudreau N., Hallet N., Martin J. M., 2007, A&A, 465, 71
- Tonry et al. (2001) Tonry J. L., Dressler A., Blakeslee J. P., Ajhar E. A., Fletcher A. B., Luppino G. A., Metzger M. R., Moore C. B., 2001, ApJ, 546, 681
- Tonry et al. (2018) Tonry J. L., et al., 2018, PASP, 130, 064505
- Tonry et al. (2021) Tonry J., et al., 2021, Transient Name Server Discovery Report, 2021-2173, 1
- Tully & Courtois (2012) Tully R. B., Courtois H. M., 2012, ApJ, 749, 78
- Tully & Pierce (2000) Tully R. B., Pierce M. J., 2000, ApJ, 533, 744
- Tully et al. (2009) Tully R. B., Rizzi L., Shaya E. J., Courtois H. M., Makarov D. I., Jacobs B. A., 2009, AJ, 138, 323
- Tully et al. (2013) Tully R. B., et al., 2013, AJ, 146, 86
- Tully et al. (2016) Tully R. B., Courtois H. M., Sorce J. G., 2016, AJ, 152, 50
- Turatto et al. (1996) Turatto M., Benetti S., Cappellaro E., Danziger I. J., Della Valle M., Gouiffes C., Mazzali P. A., Patat F., 1996, MNRAS, 283, 1
- Turatto et al. (1998) Turatto M., Piemonte A., Benetti S., Cappellaro E., Mazzali P. A., Danziger I. J., Patat F., 1998, AJ, 116, 2431
- Uddin et al. (2023) Uddin S. A., et al., 2023, arXiv e-prints, p. arXiv:2308.01875
- Valenti et al. (2017) Valenti S., Sand D., Tartaglia L., Hosseinzadeh G., Arcavi I., Howell D. A., Mccully C., 2017, Transient Name Server Classification Report, 2017-613, 1
- Villegas et al. (2010) Villegas D., et al., 2010, ApJ, 717, 603
- Wang et al. (2006) Wang X., Wang L., Pain R., Zhou X., Li Z., 2006, ApJ, 645, 488
- Wood et al. (2023) Wood C., et al., 2023, in American Astronomical Society Meeting Abstracts. p. 424.10
- de Vaucouleurs et al. (1991) de Vaucouleurs G., de Vaucouleurs A., Corwin Herold G. J., Buta R. J., Paturel G., Fouque P., 1991, Third Reference Catalogue of Bright Galaxies
Appendix A Distance modulus references
In this section, I summarize the sources of the various distance moduli measurements used to calculate the weighted means shown in Table 1. The acronyms used in Table 5, below, are: Cepheids (Cep), cosmic microwave background (CMB), dwarf galaxy diameter (DGD), fundamental plane (FP), globular cluster luminosity function (GCLF), globular cluster radius (GCR), planetary nebula luminosity function (PNLF), surface brightness fluctuations (SBF), and the Tully-Fisher relation (TF).
| SN | Host | Method | References |
| 1991bg | NGC 4374 | FP | Blakeslee et al. (2001) |
| GCLF | Gómez & Richtler (2004); Jordán et al. (2007); Villegas et al. (2010) | ||
| GCR | Jordán et al. (2005) | ||
| PNLF | Ferrarese et al. (2000); Ciardullo et al. (2002) | ||
| SBF | Ferrarese et al. (2000); Blakeslee et al. (2001); Blakeslee et al. (2009); Mei et al. (2007); Cantiello et al. (2011) | ||
| TF | Courtois & Tully (2012) | ||
| 1998de | NGC 0252 | CMB | Modjaz et al. (2001) |
| 1999by | NGC 2841 | Cep | Macri et al. (2001); Saha et al. (2006) |
| TF | Russell (2002); Tully et al. (2009); Springob et al. (2009); Courtois & Tully (2012); Sorce et al. (2012); Sorce et al. (2014) | ||
| 1999da | NGC 6411 | FP | Blakeslee et al. (2001) |
| SBF | Blakeslee et al. (2001) | ||
| 2005bl | NGC 4059 | FP | Saulder et al. (2016) |
| TF | Theureau et al. (2007) | ||
| 2006mr | NGC 1316 | – | Bernardi et al. (2002) |
| DGD | Misgeld & Hilker (2011) | ||
| FP | Graham (2002) | ||
| GCLF | Villegas et al. (2010) | ||
| GCR | Masters et al. (2010) | ||
| PNLF | Ciardullo et al. (2002); Feldmeier et al. (2007) | ||
| TF | Sakai et al. (2000); Tully & Pierce (2000); Theureau et al. (2007); Tully & Courtois (2012) | ||
| Courtois & Tully (2012); Sorce et al. (2013); Sorce et al. (2014); Neill et al. (2014); Tully et al. (2016) | |||
| SBF | Tonry et al. (2001); Ajhar et al. (2001); Jensen et al. (2003); Cantiello et al. (2007) | ||
| Blakeslee et al. (2009, 2010); Cantiello et al. (2013) | |||
| 2007ax | NGC 2577 | TF | Theureau et al. (2007) |
| 2008R | NGC 1200 | FP | Springob et al. (2014) |
| 2015bo | NGC 5490 | TF | Theureau et al. (2007) |
| SBF | Jensen et al. (2021) | ||
| 2017ejb | NGC 4696 | DGD | Misgeld & Hilker (2011) |
| FP | Blakeslee et al. (2001) | ||
| FP+SBF | Tully et al. (2013) | ||
| GCLF | Mieske et al. (2005) | ||
| TF | Theureau et al. (2007); Tully et al. (2016) | ||
| SBF | Tonry et al. (2001); Blakeslee et al. (2001); Mieske & Hilker (2003); Cantiello et al. (2005) | ||
| 2019so | NGC 4622 | FP | Springob et al. (2014) |
| 2021qvv | NGC 4442 | GCLF | Jordán et al. (2007); Villegas et al. (2010) |
| GCR | Jordán et al. (2005) | ||
| TF | Theureau et al. (2007) | ||
| SBF | Mei et al. (2007); Blakeslee et al. (2009) | ||
| Note. SN 1997cn exploded in the same host galaxy as SN 2015bo, NGC 5490. | |||