Euclid preparation. XXXVII.
Abstract
Aims. We derived galaxy colour selections from Euclid and ground-based photometry, aiming to accurately define background galaxy samples in cluster weak-lensing analyses. These selections have been implemented in the Euclid data analysis pipelines for galaxy clusters.
Methods. Given any set of photometric bands, we developed a method for the calibration of optimal galaxy colour selections that maximises the selection completeness, given a threshold on purity. Such colour selections are expressed as a function of the lens redshift.
Results. We calibrated galaxy selections using simulated ground-based and Euclid photometry. Both selections produce a purity higher than . The selection completeness ranges from 30% to in the lens redshift range . With the full selection, the completeness improves by up to percentage points, and the range extends up to . The calibrated colour selections are stable to changes in the sample limiting magnitudes and redshift, and the selection based on bands provides excellent results on real external datasets. Furthermore, the calibrated selections provide stable results using alternative photometric aperture definitions obtained from different ground-based telescopes. The selection is also purer at high redshift and more complete at low redshift compared to colour selections found in the literature. We find excellent agreement in terms of purity and completeness between the analysis of an independent, simulated Euclid galaxy catalogue and our calibration sample, except for galaxies at high redshifts, for which we obtain up to 50 percent points higher completeness. The combination of colour and photo- selections applied to simulated Euclid data yields up to 95% completeness, while the purity decreases down to 92% at high . We show that the calibrated colour selections provide robust results even when observations from a single band are missing from the ground-based data. Finally, we show that colour selections do not disrupt the shear calibration for stage III surveys. The first Euclid data releases will provide further insights into the impact of background selections on the shear calibration.
Key Words.:
Galaxies: statistics – Galaxies: photometry – Galaxies: distances and redshifts – Galaxies: clusters: general – Cosmology: observations – large-scale structure of Universe1 Introduction
In the last decade, galaxy clusters have proven to be excellent probes for cosmological analyses (see, e.g. Mantz et al. 2015; Sereno et al. 2015; Planck Collaboration XXIV 2016; Costanzi et al. 2019; Marulli et al. 2021; Lesci et al. 2022), also allowing for the investigation of dark matter interaction models (Peter et al. 2013; Robertson et al. 2017; Eckert et al. 2022) and gas astrophysics (Vazza et al. 2017; CHEX-MATE Collaboration 2021; Zhu et al. 2021; Sereno et al. 2021). As galaxy clusters are dominated by dark matter, the functional form of their matter density profiles can be derived from -body dark-matter-only simulations (Navarro et al. 1997; Baltz et al. 2009; Diemer & Kravtsov 2014). This allows one to estimate the mass of observed clusters, which is essential for both astrophysical and cosmological studies (Teyssier et al. 2011; Pratt et al. 2019). Currently, weak gravitational lensing is one of the most reliable methods to accurately and precisely measure cluster masses (Okabe et al. 2010; Hoekstra et al. 2012; Melchior et al. 2015; Sereno et al. 2017; Stern et al. 2019; Schrabback et al. 2021; Zohren et al. 2022). Consequently, weak-lensing cluster mass estimates are widely used in current photometric galaxy surveys, such as the Kilo Degree Survey (KiDS; Kuijken et al. 2019; Bellagamba et al. 2019), the Dark Energy Survey (DES; Abbott et al. 2020; Sevilla-Noarbe et al. 2021), and the Hyper Suprime-Cam survey (HSC; Medezinski et al. 2018; Li et al. 2022).
An accurate selection of lensed background galaxies is crucial to derive a reliable cluster weak-lensing signal. Including the contribution from foreground and cluster member galaxies may significantly dilute the weak-lensing signal (Broadhurst et al. 2005; Medezinski et al. 2007; Sifón et al. 2015; McClintock et al. 2019). For example, background selections with 90% purity dilute the cluster reduced shear measurements by 10% (see, e.g. Dietrich et al. 2019), in the absence of intrinsic alignments (Heymans & Heavens 2003). Highly pure background selections are required to properly account for this effect in weak-lensing measurements, in order to minimise the variance in the selection purity. Selection incompleteness, instead, impacts the weak-lensing noise and, in turn, the signal-to-noise ratio (S/N), which depends on the density of background sources along with the intrinsic ellipticity dispersion and measurement noise (see, e.g. Schrabback et al. 2018; Umetsu 2020). The effect of low background densities can be partially mitigated by increasing the size of the cluster-centric radial bins used in the analysis, or through the stacking of the weak-lensing signal of cluster ensembles.
Background selections based on the galaxy photometric redshift (photo-) posteriors are commonly used in the literature (Gruen et al. 2014; Applegate et al. 2014; Melchior et al. 2017; Sereno et al. 2017; Bellagamba et al. 2019), as well as galaxy colour selections (Medezinski et al. 2010; Oguri et al. 2012; Medezinski et al. 2018; Klein et al. 2019). These selections can also be combined to significantly improve the background sample completeness and, in turn, the weak-lensing S/N. In fact, colour selections have been demonstrated to help identify galaxies with poorly defined photometric redshifts that would not have been classified as background sources through photo- selection alone (Covone et al. 2014; Sereno et al. 2017; Bellagamba et al. 2019).
The aim of this paper is to develop a method to obtain optimal colour selections, namely with a maximal completeness given a threshold on purity, given any set of photometric filters. We provide, for the first time, colour selections expressed as a continuous function of the lens limiting redshift. This allows for a finer background definition compared to colour selections found in the literature (Medezinski et al. 2010; Oguri et al. 2012; Medezinski et al. 2018), implying a significant improvement in the weak-lensing source statistics. In view of Euclid and stage IV surveys, we derived colour selections on simulated data. We exploited the galaxy catalogue developed by Bisigello et al. (2020), hereafter referred to as B20, and extended by Euclid Collaboration: Bisigello et al. (2023), which includes simulated Sloan Digital Sky Survey (SDSS; Gunn et al. 1998) magnitudes and simulated Euclid observations in the bands. In addition, we tested the efficiency of these colour selections on real public external data and on simulations, combining them with photo- selections.
This paper is part of a series presenting and discussing mass measurements of galaxy clusters using the Euclid combined clusters and
weak-lensing pipeline COMB-CL. COMB-CL forms part of the
global Euclid data processing pipeline and is responsible for measuring weak-lensing shear profiles and masses for photometrically detected clusters. A comprehensive description of the code structure and methods employed by COMB-CL will be presented in a forthcoming paper, but a brief overview of the pipeline can be found in the appendix of Euclid Collaboration: Sereno et al. (2023). The galaxy colour selections presented in this paper are already implemented in COMB-CL.
The paper is organised as follows. In Sect. 2, we describe the dataset used for the calibration of galaxy colour selections, and in Sect. 3 we detail a general method to derive optimal colour selections. In Sect. 4, we show the selections obtained for and filter sets, validating them on external datasets. In Sect. 5 we compare the selection calibrated in this work with selections from the literature. Finally, in Sect. 6, we draw our conclusions.
2 Calibration sample
We based our analysis on the photometric catalogue developed by B20 and extended by Euclid Collaboration: Bisigello et al. (2023). This catalogue contains simulated Euclid aperture magnitudes111 band observations are supplied by the Euclid Visible Imager (VIS; Cropper et al. 2016), while photometry is provided by the Near-Infrared Spectrometer and Photometer (NISP; Euclid Collaboration: Schirmer et al. 2022)., covering the spectral range 5500–20 000 Å, along with the Canada-France Imaging Survey (CFIS; Ibata et al. 2017) band, for the galaxies contained in the COSMOS catalogue by Laigle et al. (2016, COSMOS15). Specifically, such photometry is based on fixed-aperture magnitudes. Despite the band already being present in COSMOS15, B20 derived it using the same approach adopted for the other filters in order to avoid colour biases. B20 verified that this provides results that are consistent with the observed fluxes. Simulated SDSS magnitudes, spanning the wavelength range 4000–11 000 Å, are also provided in the catalogue, since observations in similar filters, such as those in Vera C. Rubin Observatory (Rubin/LSST; Ivezic et al. 2008) and DES, will be available to complement Euclid observations (Euclid Collaboration: Pocino et al. 2021; Euclid Collaboration: Scaramella et al. 2022). Corrections for photometric offsets due to flux outside the fixed-aperture, systematic offsets, and Galactic extinction, as suggested in Laigle et al. (2016), have been applied. B20 derive simulated magnitudes through two alternative approaches. The first is a linear interpolation of the 30 medium-band and broad-band filters available in the COSMOS15 catalogue, based on the effective wavelength of the filters. The second approach is based on the best theoretical template that describes the spectral energy distribution (SED) of each galaxy, assuming the COSMOS15 redshifts as the ground truth. The SED fitting is performed based on COSMOS15 bands and the template resulting in the minimum is used to predict the expected fluxes. We refer to B20 for the details of the SED templates used, based on the model by Bruzual & Charlot (2003). The expected fluxes are then randomised 10 times considering a Gaussian distribution centred on the true flux and with standard deviation equal to the expected photometric uncertainities, scaled considering the depths listed in Table 1 of Euclid Collaboration: Bisigello et al. (2023). In this process, the magnitude errors expected for the Euclid Wide Survey are considered. Despite the fact that the photometry is based on SDSS filter transmissions, the corresponding uncertainties are based on depths that are consistent with those of DES and the Ultraviolet Near-Infrared Optical Northern Survey (UNIONS).222UNIONS is carried out with the Subaru Telescope (Iye et al. 2004), the Canada-France-Hawaii Telescope (CFHT; Gwyn 2012), and the Panoramic Survey Telescope and Rapid Response System (Pan-STARRS; Chambers et al. 2016). More information at https://www.skysurvey.cc/news/. The photometry provided by LSST is expected to go from 1 to 2.5 magnitudes deeper at the end of the Euclid mission, depending on the photometric filter. Throughout this paper, we focus on the magnitudes derived from the best theoretical SED templates, as these estimates better reproduce absorption and emission lines that are not covered by COSMOS15 bands. We neglect magnitudes since, due to the low -band throughput, a 5 depth of 25.6 mag will only be reached after 10 years of LSST observations333https://www.lsst.org/scientists/keynumbers. In addition, the band is not available in DES wide fields. We emphasise that the B20 catalogue contains all the galaxies present in the COSMOS15 sample, which is deeper than the shear samples derived from current surveys (see, e.g. Giblin et al. 2021; Gatti et al. 2021) and expected from the Euclid Wide Survey (Euclid Collaboration: Scaramella et al. 2022). As we discuss in the following, the colour selections calibrated in this study yield robust results against alternative magnitude cuts, including those that reproduce the selections adopted in current and Euclid cosmic shear analyses.
3 Method
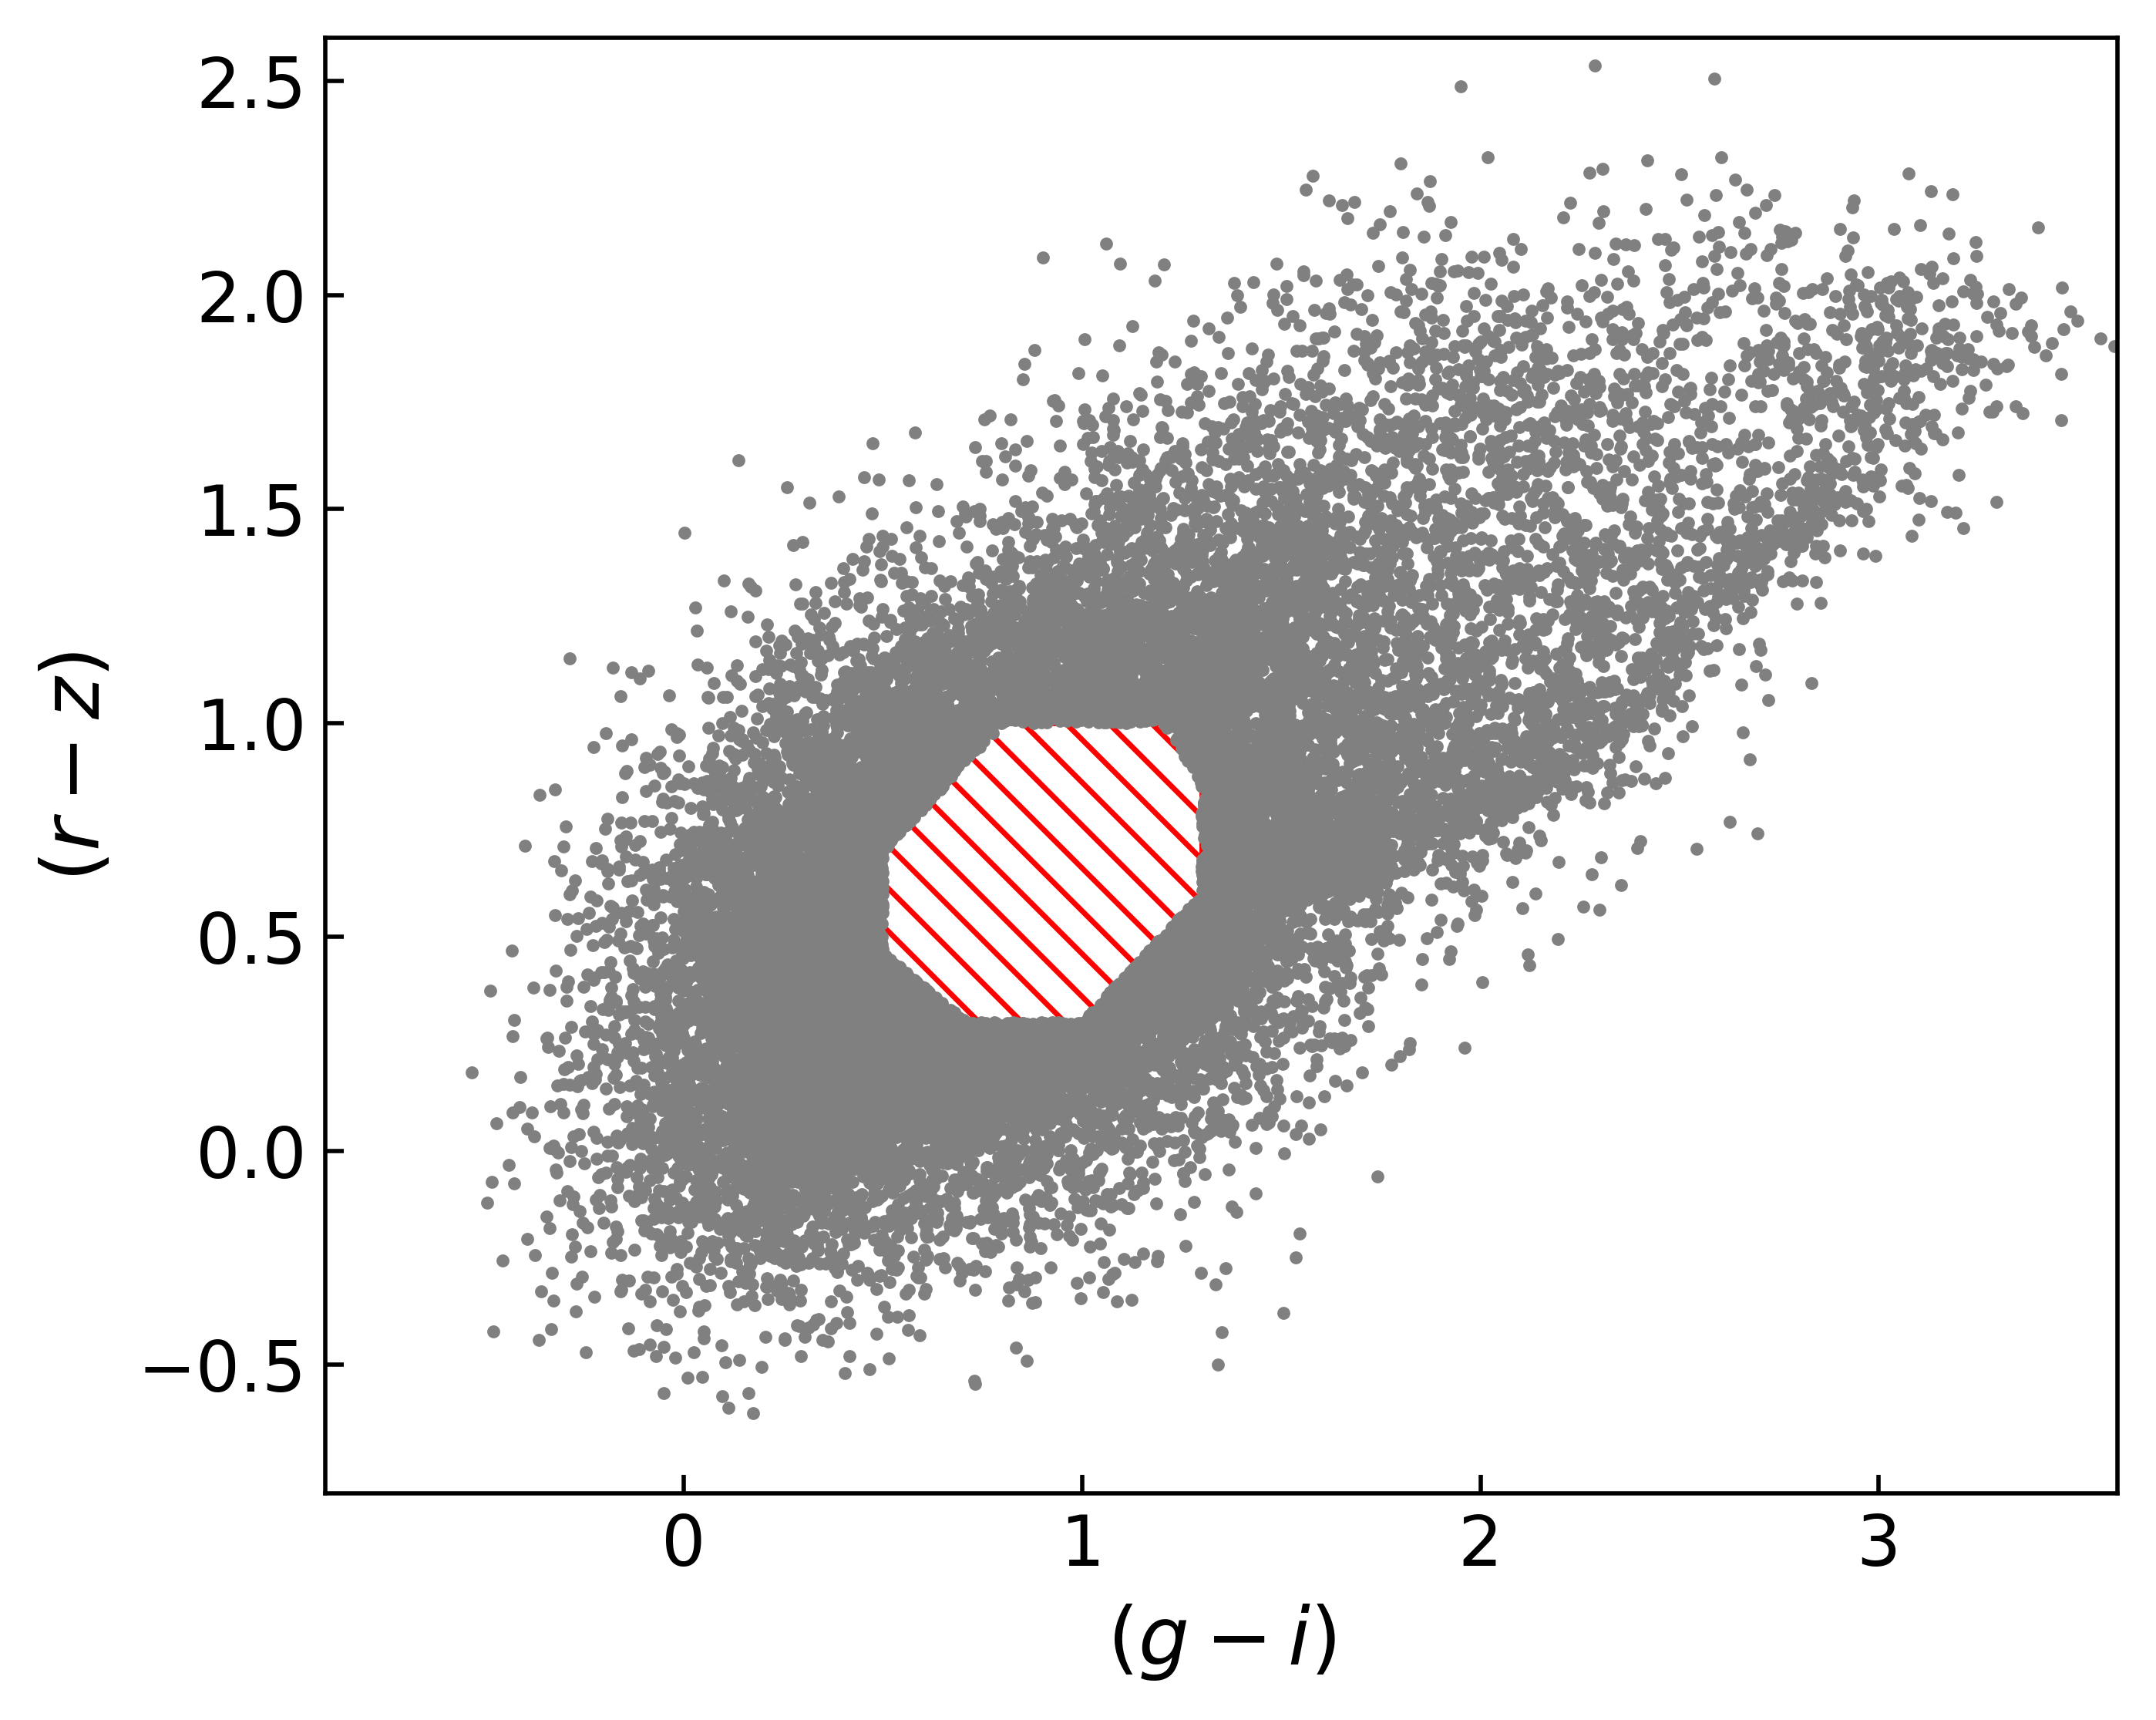
In order to find a set of optimal galaxy colour-redshift relations that maximises the selection completeness given a threshold on the foreground contamination, we considered the colours given by any combination of photometric bands. This includes bands that are not adjacent in wavelength. Thus, for each colour-colour space, given a redshift lower limit, , corresponding to the lens redshift, we considered the following set of conditions,
| (1) |
where is the logical ‘or’ operator, and are two different colours, and and are colour selection parameters. Specifically, , and , while and . The edges of the aforementioned parameter ranges are excluded, and Eq. (3) defines an irregular octagon that contains the foreground galaxies, as we show in Fig. 1. As we shall see, since we only select the colour conditions that satisfy given requirements, not all the sides of the irregular octagon may be considered. In addition, since we considered the conditions in Eq. (3) as independent, the and parameters are not related to each other. In particular, for each condition in Eq. (3), we derived the completeness,
| (2) |
and the purity,
| (3) |
where is the th colour condition index, is the galaxy redshift, is the set of colour condition parameters, is the number of galaxies selected with the th colour condition, is the total number of galaxies in the calibration sample, while the superscript represents quantities derived from colour conditions not fitted as a function of . As we shall see, we do not adopt any superscripts for the quantities derived from fitted colour conditions. In Eqs. (2) and (3), we have , where is the number of all possible colour conditions, given Eq. (3), expressed as
| (4) |
where is the number of colours, given by
| (5) |
where is the number of photometric bands.
We set requirements on completeness and purity to be satisfied by each colour condition in Eq. (3). Specifically, for a given , we selected the colour conditions having at least one set providing and larger than their corresponding thresholds. We remark that does not explicitly depend on at this stage, and that values are arbitrarily sampled. Setting a threshold on is important for excluding colour conditions that do not significantly contribute to the total completeness, and that may appear as optimal only due to statistical fluctuations. Thus, the threshold on is meant to be low compared to that on . Indeed, as we shall detail in Sect. 4.6, impurities in the background selection imply systematic uncertainties in galaxy cluster reduced shear measurements. Highly pure selections are required to properly account for this effect, in order to minimise the scatter in purity. We discuss the choice of the thresholds on and in greater detail in Sect. 4.1. For each colour condition in Eq. (3), with parameter values for which the conditions on and are satisfied, we selected the set providing the highest completeness at a given . In this way, we derived the set of optimal colour conditions maximising the selection completeness, given the chosen threshold on purity.
We note that the maximum of the calibrated colour selections depends on the and limits, while the minimum is derived by excluding the points for which . Here, and are the completeness and the foreground failure rate given by the full set of optimal colour conditions, respectively. For simplicity, we drop the dependence on in the text. The foreground failure rate is defined as follows:
| (6) |
where is the number of galaxies selected with all the optimal colour conditions, given a condition on , and is the purity given by the full set of optimal conditions. On the right-hand side of Eq. (6), derived from Eqs. (2) and (3), we can see that diminishes with increasing if high lower limits on purity are chosen. We stress that by definition.
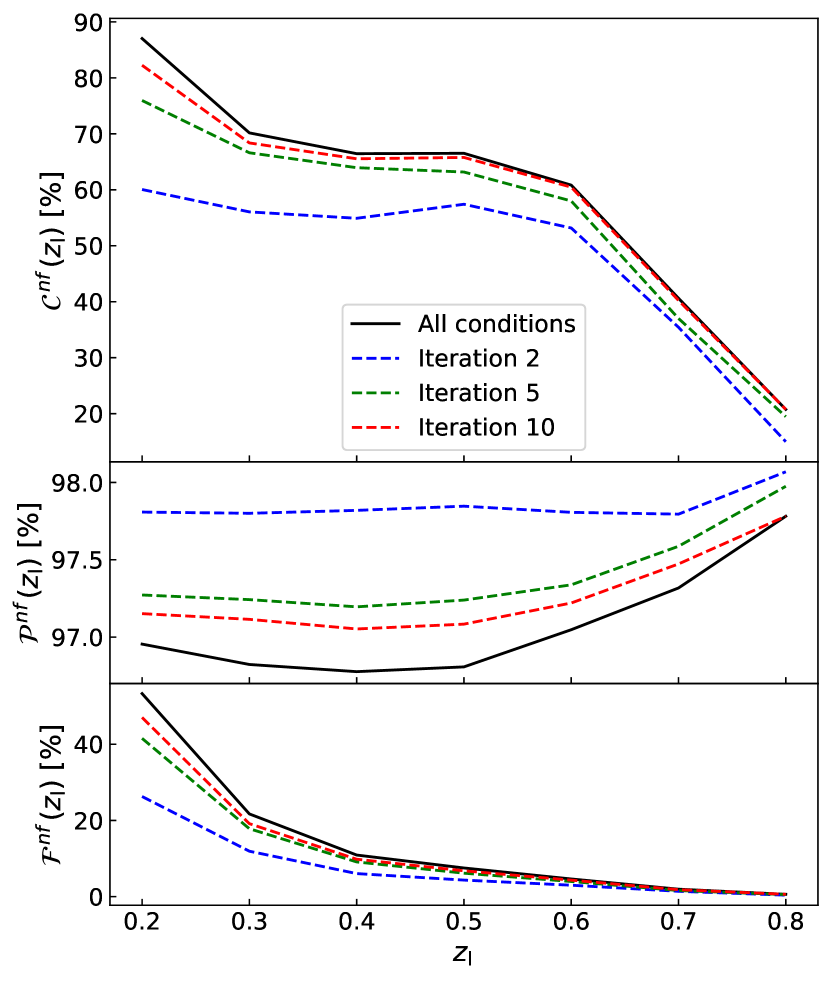
In the selection process described above, some colour conditions may be redundant. Thus, we iteratively searched for an optimal subset of colour conditions to find the minimum number of conditions sufficient to approximately reproduce the required completeness. Specifically, at each step of this iterative process, we computed the following quantity:
| (7) |
where is the number of points, is the completeness given by all optimal conditions, while is the completeness given by a subset of optimal conditions, computed at the th value. As the first step of this iterative process, we found the optimal colour condition minimising . Then, at each iteration, we added the colour condition that, combined with the conditions selected in the previous steps, minimises . We repeated this process until was lower than a given tolerance. We remark that the logical operator between colour conditions is .
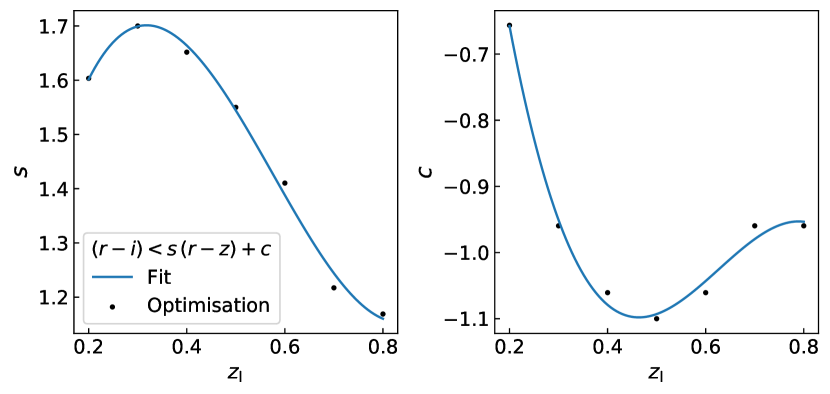
Lastly, we applied a nonlinear least squares analysis to find the best fit to the parameters as a function of for the subset of optimal colour conditions. We chose the fitting formulae which best reproduce the dependence, namely polynomials, while aiming at minimising the number of free parameters in the fit.
In Fig. 2 we show a flowchart summarising the calibration process described in this section. In Fig. 4 we show an example of the iterative process detailed above, while Fig. 4 displays an example of parameter dependence on . Hereafter, we refer to the completeness, purity, and foreground failure rate, derived from sets of fitted colour conditions, as , , and , respectively. For better clarity, in Table 1 we summarise the symbols referring to the completeness functions introduced in this section.
4 Results
| Symbol | Description |
| Completeness of the th colour condition, given a set of sampled parameters. | |
| Completeness derived through the combination of all the optimal colour conditions. | |
| Completeness given by the combination of a subset of optimal colour conditions. | |
| Completeness obtained from a subset of optimal colour conditions fitted as a function of . |
4.1 Calibration of colour selections
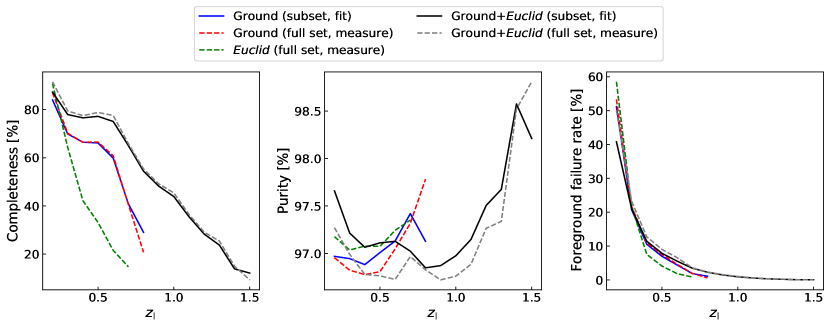
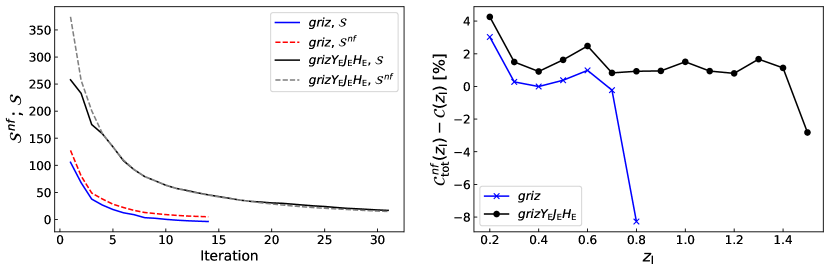
By applying the methods detailed in Sect. 3 and adopting the B20 calibration sample described in Sect. 2, we calibrated galaxy colour selections using ground-based and Euclid photometry, namely SDSS and Euclid filters, respectively. These selections are implemented in COMB-CL, and will be available for weak-lensing analyses of galaxy clusters. We considered the following cases: ground-only, Euclid-only, and the combination of ground-based and Euclid photometry. For the cases including Euclid photometry, we adopted an threshold for Euclid near-infrared observations of , which corresponds to , , and (Euclid Collaboration: Scaramella et al. 2022). In addition, we considered points in the range , assuming a precision of for the sampling. To derive the full set of optimal colour conditions, we imposed for the th colour condition. For the ground-only and Euclid-only cases, we imposed that the purity of each colour condition is . We adopted a more restrictive threshold on purity for the combination of ground-based and Euclid photometry, corresponding to . This threshold is chosen as the larger number of colour combinations leads to a higher summation of impurities. We obtained for any , when combining all the optimal colour conditions, as shown in Fig. 5. As we shall discuss in Sect. 4.3, the purity derived from different real datasets is stable, showing sub-percent changes, on average.
The decrease with increasing , shown in Fig. 5, is expected, as discussed in Sect. 3. In addition, for any combination of photometric bands, we found for . Consequently, we set as the minimum lens redshift for the calibrated colour selections. As shown in Fig. 5, from photometry we derived a selection within , with 84% completeness at , decreasing to 29% at . In the Euclid-only case, namely and bands, results are not competitive with those derived from photometry. On the other hand, by combining ground-based and Euclid photometry, the completeness significantly increases in the range covered by the selection, by up to 25 percent points. Also the range of the selection is significantly extended compared to the case, corresponding to . Specifically, in this case we exclude the Euclid band, as it covers a large wavelength interval, namely 5000–10 000 , corresponding to the wavelength range already covered by photometry. Furthermore, the use of very broad photometric bands is not the most optimal choice for calibrating galaxy colour selections, which share similarities with photo- estimates.
We excluded any possible redundant colour condition, as detailed in Sect. 3. In Table 2 we show the subset of optimal colour conditions for the ground-only case, namely photometry, along with the corresponding parameter fits. The first condition quoted in Table 2 corresponds to the one derived in the first step of the iterative process described in Sect. 3. This is analogous for the subsequent conditions. We remark that the quoted conditions have different ranges of validity in . Analogous information is listed in Table 3 for the combination of ground-based and Euclid photometry, corresponding to filters. We neglected the optimisation and parameter fitting for the Euclid-only case, as we have already shown that it does not provide competitive completeness values.
In Fig. 5 we show the results for the selections obtained from the subsets of optimal conditions, with parameters fitted as a function of . For both and photometry, such fitted selections well reproduce those given by the full sets of optimal conditions. To quantify the goodness of the colour condition parameter fits, we defined a parameter analogous to in Eq. (7), namely . This parameter quantifies the difference between , that is the completeness given by the full set of optimal conditions not fitted as a function of , and , which is the completeness given by the subset of optimal colour conditions fitted as a function of . As shown in Fig. 5, does not perfectly match , for both and selections. This is due to the fact that the , parameters in Eq. (3) do not always show a simple dependence on . Despite the fact that better parameter fits could be achieved by adopting an arbitrarily high order polynomial as the model, we set a 4th order polynomial as the highest-degree functional form for describing these parameters (see Tables 2 and 3). As shown in Fig. 5, is underestimated by at most 4 percent points. We verified that adding further conditions to these selections, that is, lowering the threshold down to , provides sub-percent level improvements in the selection completeness, on average. We remark that, in order to derive colour selections not defined in bins, the final selection completeness is slightly degraded compared to for some values. In realistic cluster weak-lensing analyses, however, we expect this to statistically increase the galaxy background completeness. When colour selections are defined on finite sets of points, the background galaxies are excluded based on the precision adopted in the colour selection calibration.
4.2 Dependence on magnitude and redshift selections
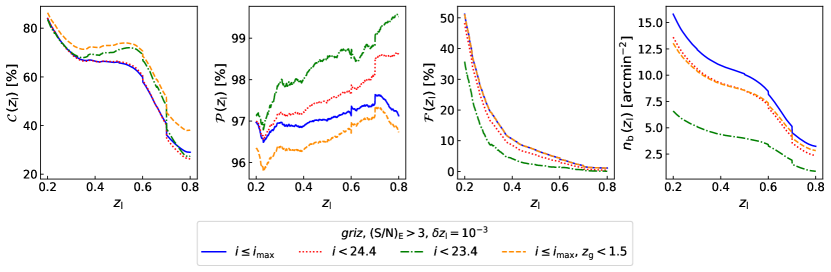
To verify the robustness of the selection with respect to alternative magnitude cuts, we applied the selection , corresponding to the peak value of the magnitude distribution in the B20 catalogue. We also investigate the selection for the subsample with , which is a threshold similar to the DES band limit (Sevilla-Noarbe et al. 2021). In both cases, we derived higher and lower , compared to what we found from the calibration sample used in Sect. 4.1, namely the one with and , where is the maximum magnitude in the sample (see Fig. 6). In the case with , is close to that from the calibration sample, while for we derived higher completeness, on average. In addition, as the bulk of the redshift distribution in the calibration sample, described in Sect. 2, extends up to , we applied the selection to the galaxy sample with redshift , , and . In Fig. 6, we can see that this redshift limit provides values that are identical to those derived from the calibration sample, which is expected since does not depend on the maximum redshift of the sample, while the completeness increases by up to percent points and the purity is at most 1 percent point lower. We note that the computation of and is made relative to the sample under consideration. In other words, they refer to galaxy populations defined by given magnitude and redshift limits. We measured the aforementioned colour selections by assuming a precision of . This value is one order of magnitude lower (i.e. one order of magnitude higher precision) than the typical galaxy cluster photometric redshift uncertainty in current surveys (see, e.g. Rykoff et al. 2016; Maturi et al. 2019) and Euclid (Euclid Collaboration: Adam et al. 2019). Consequently, the precision ensures the reliability of the colour condition fits for galaxy cluster background selections. We remark that we assumed for the sampling in the calibration process.
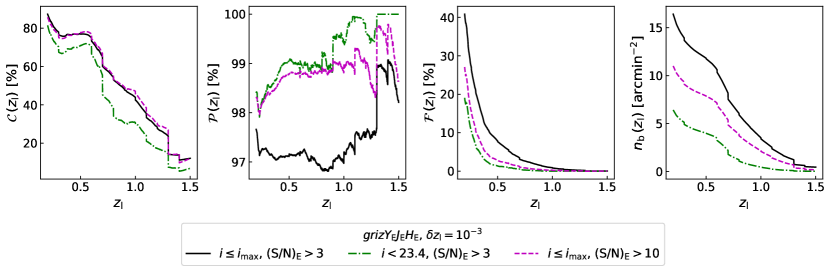
In Fig. 6 we show the efficiency of the selection, computed by adopting , applied to the B20 calibration sample, with and . We found analogous selections from the subsample with and from the one with . Specifically, in both cases, we derived higher and lower , in agreement with what we found from the selection. In addition, the increase in the minimum Euclid does not significantly change the completeness, while the limit decreases by at most percent points. As we obtained excellent and estimates from these tests, we conclude that both and selections are stable and reliable with respect to changes in the sample limiting magnitude and redshift. In addition, we note that brighter galaxy samples provide lower foreground contamination. This is expected, as faint galaxies have more scattered colour-redshift relations.
In Fig. 6 we show the density of background galaxies, , defined as the number of selected galaxies with per square arcmin. For both and selections, arcmin-2 at for and , decreasing with increasing . In both colour selections, the limit implies the largest decrease in , providing arcmin-2. In addition, for the selection, the and limits provide consistent results on , showing a difference of at most 3 arcmin-2 compared to that derived from the calibration sample. With regard to the selection, the limit implies a decrease in of up to 5 arcmin-2 at low , while becomes compatible with that derived from the calibration sample for .
4.3 selection validation on real data
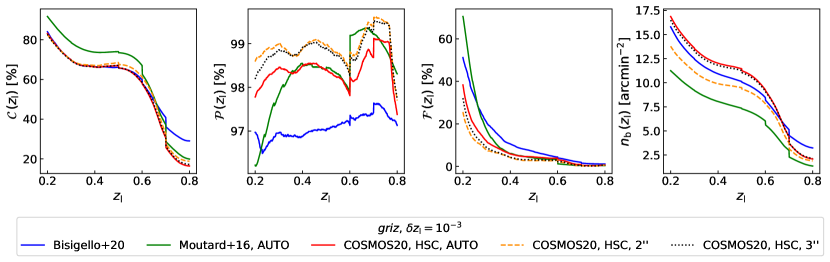
To further assess the reliability of the colour selection detailed in Sect. 4.1, we applied it to external datasets obtained from real observations. In particular, we considered the VIMOS Public Extragalactic Redshift Survey (VIPERS; Guzzo et al. 2014) Multi-Lambda Survey (VMLS) photometric catalogue by Moutard et al. (2016), including Canada-France-Hawaii Telescope Legacy Survey (CFHTLS; Hudelot et al. 2012) Kron aperture magnitudes (Kron 1980). This catalogue covers deg2 and provides reliable photometric redshifts for more than one million galaxies with a typical accuracy of , and a fraction of catastrophic failures lower than down to . These statistics are based on VIPERS data, complemented with the most secure redshifts selected from other spectroscopic surveys. We remind that in VIPERS a colour-colour pre-selection was employed to enhance the effective sampling of the VIMOS spectrograph. Nevertheless, the VIPERS selection does not introduce any significant colour bias above z (Guzzo et al. 2014). In addition, as we shall see in the following, the selection completeness and purity obtained from the VMLS dataset do not exhibit remarkable deviations from those obtained from other galaxy samples. In Fig. 7 we can see that, by applying the selection to the VMLS sample, we derived higher and lower compared to what we found from the B20 catalogue, on average. This agrees with what we found in Sect. 4.2, as the Moutard et al. (2016) catalogue is shallower than the B20 sample. For the same reason, is arcmin-2 lower, on average. In addition, the completeness is up to percent points higher for , becoming lower for higher values.
We also applied the selection to the COSMOS CLASSIC catalogue by Weaver et al. (2022, COSMOS20), which reaches the same photometric redshift precision as COSMOS15, namely , at almost one magnitude deeper. We considered Kron, and aperture magnitudes from HSC. In addition, we selected galaxies with a photometric redshift derived from at least 30 bands, and with , in order to consider a sample with highly reliable redshift estimates. By adopting more complex selection criteria, which may involve galaxies with photometric redshifts derived from a shared set of photometric bands, we do not expect remarkable differences in the results. Similar results for the cases with Kron, and aperture magnitudes are shown in Fig. 7. Compared to what we derived from the B20 sample, the completeness is similar, with the largest differences at . In addition, is lower and is higher for any . For Kron and aperture magnitudes, is slightly higher compared to that obtained from the B20 sample, on average. Lower values show up for the aperture magnitudes, which is expected as we applied the same magnitude limit for each photometric aperture definition. Indeed, for these tests we did not include aperture correction terms. Lastly, comparing the purity derived from the COSMOS20 and VMLS samples, we note that for the differences are below 1 percent point, on average. Thus, we conclude that the selection provides robust and reliable results on real data.
4.4 Validation on Flagship v2.1
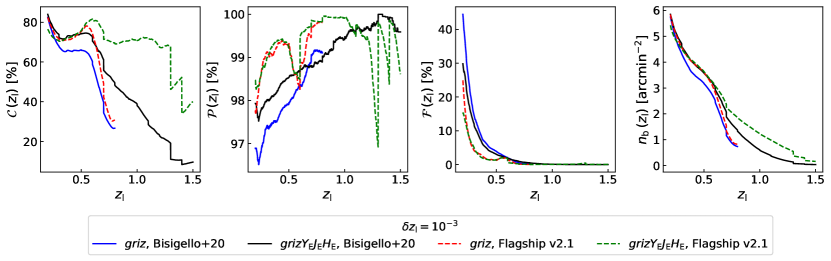
We tested the colour selections calibrated in Sect. 4.1 on the Euclid Flagship galaxy catalogue v2.1.10 (Euclid Collaboration in prep.), which is currently the best simulated Euclid galaxy catalogue available. This catalogue is based on an -body simulation with around 4 trillion particles with mass M⊙.
A flat cold dark matter (CDM) cosmological model was assumed, with matter density parameter , baryon density parameter , dark energy density parameter , scalar spectral index , Hubble parameter , and standard deviation of linear density fluctuations on 8 Mpc scales . The haloes were identified using Rockstar (Behroozi et al. 2013), and then populated with a halo occupation distribution model which was calibrated to reproduce observables such as clustering statistics as a function of galaxy luminosity. The galaxy SED templates used are the COSMOS templates from Ilbert et al. (2009), based on the models by Bruzual & Charlot (2003) and Polletta et al. (2007). In addition, galaxy photo- probability distribution functions, namely , are included in Flagship, derived through a Nearest Neighbours Photometric Redshifts (NNPZ) pipeline (Euclid Collaboration: Desprez et al. 2020).
From the Flagship catalogue, we extracted a lightcone within and , considering the galaxies in the whole redshift range covered by the simulation, namely . Specifically, is the galaxy true redshift, and we verified that the contribution of peculiar velocities does not significantly change the results. We focused on aperture LSST and Euclid photometry, as the simulated fluxes estimated for other ground-based surveys do not account for observational noise. Specifically, the photometric noise takes into account the depth expected in the southern hemisphere at the time of the third data release (DR3) for the Euclid Wide Survey. The LSST and Euclid magnitude limits, which are proxies for extended sources, correspond to , , , , , , , , , and . The fluxes we considered are not reddened due to Milky Way extinction, consistent with the analyses performed in the previous sections.
In Fig. 8, we show the application of and selections to Flagship. For this test, we assumed 5 magnitude cuts for LSST and Euclid bands. In addition, we show results from the B20 sample in Fig. 8, for which we assumed 5 magnitude cuts rescaled from the 10 limits listed in Euclid Collaboration: Bisigello et al. (2023, Table 1). We found that derived from Flagship agrees with that obtained from the B20 sample. The largest differences, of about 1 arcmin-2, arise when the selection is applied. We note that for , implying that lenses at these values of may not exhibit significant weak-lensing signals. Nevertheless, we verified that is enhanced at any when the selection defined for Euclid weak-lensing analyses (Laureijs et al. 2011; Euclid Collaboration: Scaramella et al. 2022) is assumed. This selection consists in a 10 cut in the band, corresponding to for a aperture, yielding a galaxy density of around 39 arcmin-2 when applied to the Flagship dataset. In fact, in this case ranges from 30 arcmin-2 at low to 3 arcmin-2 at .
As shown in Fig. 8, on average we obtained higher and lower for from Flagship, compared to what we derived from the B20 sample. For the selection case, agrees with that derived from the B20 sample, with the largest differences, of up to 16 percent points, at . Larger differences in are obtained from the selection. From Flagship we obtained up to percent points larger for , and up to percent points larger for higher . We verified that this discrepancy in the completeness, in the case of the selection, is not significantly attenuated through the assumption of 3 and 10 magnitude limits on both B20 and Flagship catalogues. Analogous results were obtained by assuming limits corresponding to the magnitude distribution peaks derived from the B20 catalogue, namely , , , , , , and . Moreover, we verified that the selection completeness does not remarkably vary by assuming the Euclid weak-lensing selection defined above, namely . Similar results are obtained by considering the photometric errors expected for the DR2 of the Euclid Wide Survey, assuming the corresponding 3, 5, and 10 magnitude cuts. For each of the alternative magnitude cuts discussed in this section, we found that the selection yields a purity up to 3 percent points higher at when it is applied to the B20 catalogue, compared to what is derived from Flagship. At , instead, the purity obtained from B20 is 1 percent point lower, on average. Furthermore, the alternative magnitude cuts do not remarkably impact the selection purity at any .
We additionally adopted SDSS fluxes, which do not include photometric noise, in place of LSST fluxes in Flagship. In this case, the completeness is up to 35 percent points larger than that derived from the B20 sample, and the purity approaches 100% for , which is similar to what we derived from the B20 sample (see Fig. 8). Thus, the selection based on SDSS photometry is less complete and purer compared to that obtained from LSST magnitudes.
Differences in the completeness derived from the Flagship and B20 samples may originate from distinct assumptions on the physical properties of the galaxies, such as dust extinction, stellar age, nebular emission lines, or on the assumed intrinsic spectral energy distributions. This could be indicated by a different fraction of star forming galaxies in the two samples. Following B20, galaxies are classified as star forming if the following condition is satisfied,
| (8) |
where sSFR is the specific star formation rate, derived from the best SED template in the catalogue by B20. We verified that, for , the fraction of star forming galaxies in Flagship is consistent within 1 percent point with that derived from the catalogue by B20. Thus, we conclude that the completeness differences between the Flagship and B20 samples are not due to different star forming galaxy populations. We also verified that the distributions derived from the two datasets are compatible, having peaks at and in B20 and Flagship, respectively. The agreement of these peak values is well within 1 of the distributions. We will be able to further investigate such completeness differences through the analysis of the first data release of the Euclid Deep Survey.
4.5 Comparison with photo- selections
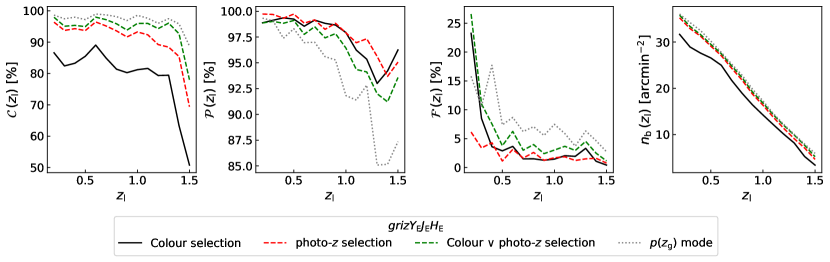
To compare the colour selections derived in this work to selections based on the galaxy , commonly referred to as photo- selections, we analysed the Flagship sample described in Sect. 4.4. We considered only the galaxies with a estimate obtained with the NNPZ pipeline (Euclid Collaboration: Desprez et al. 2020). The NNPZ photo-s are designed to work well for galaxies that are expected to be used in core Euclid weak-lensing science, namely with 5 limits on the band. Thus we imposed , along with 5 limits on the bands, namely , , . Specifically, we adopted the following photo- selection,
| (9) |
where is the minimum of the interval containing 95% of the probability around the first mode of , namely . We chose in order to derive values which are compatible with those obtained from colour selections. We verified that adding a condition on the width of in Eq. (9) does not impact the results. Specifically, for the latter test, we considered the additional condition , where is the integrated probability around , computed within the redshift points, which are the closest to , having an associated probability of . We verified that imposing or leads to compatible purity values with sub-percent differences on average. However, lowers the photo- selection completeness by around 20 percent points at all . Consequently, we assumed .
To perform a fair comparison of colour and photo- selections, we considered only the colour selection in this section. This is because photo-s in Flagship were derived from the combination of ground-based and Euclid photometry. In Fig. 9, we show that the selection provides, on average, a completeness 15 percent points lower than that of the photo- selection, with similar contamination. By combining and photo- selections, through the logical operator , the completeness increases by up to 10 percent points with respect to the case of photo- selection alone, amounting to for . These preliminary tests confirm the importance of the combination of colour and photo- selections, as it leads to significantly more complete background galaxy samples. We also remark that increasing the selection completeness is key to reduce biases in the shear calibration parameters due to background selections, as we shall detail in Sect. 4.6. The analysis of Euclid data will allow for a detailed investigation of the optimal photo- selections for galaxy cluster weak-lensing analyses, outlining the synergies with colour selections. For example, colour selections applied to Euclid data could provide more robust background samples for massive or nearby galaxy clusters, as derived by Medezinski et al. (2018). Leveraging colour selections also serves as a valuable cross-validation method for addressing the effect of unknown systematic uncertainties in photo- estimates. Lastly, Fig. 9 shows the selection based only on the first mode of . Specifically, in this case we selected the galaxies with . Despite at all , the purity is up to percent points lower than that obtained from the selection.
4.6 Impact on shear measurements
In cluster weak-lensing analyses, the inclusion of foreground sources in the shear measurements may significantly dilute the signal (Broadhurst et al. 2005; Medezinski et al. 2007; Sifón et al. 2015; McClintock et al. 2019). As discussed in the previous sections, the calibrated colour selections provide . To assess the impact of impurities on shear measurements, we can express the cluster reduced tangential shear unaffected by contamination as follows (Dietrich et al. 2019):
| (10) |
where is the measured cluster reduced tangential shear at redshift . As the calibrated colour selections yield , we expect at most a 3% bias on the reduced tangential shear. In addition, as discussed in Sect. 4.3, derived from different observed datasets with only ground-based photometry shows a scatter below 1 percent point. This scatter in is lower than the systematic uncertainty on galaxy shape measurements for stage III surveys, as we shall discuss in the following. We remark that is derived from reference fields, while galaxy clusters are overdense compared to the cosmic mean. Thus, contamination from cluster galaxies must be properly accounted for in Eq. (10) (see, e.g. Gruen et al. 2014; Dietrich et al. 2019). Nevertheless, such contamination is consistent with zero in the typical cluster-centric radial range adopted for mass calibration, namely at radii larger than 300 kpc (see, e.g. Medezinski et al. 2018; Bellagamba et al. 2019).
Furthermore, galaxy shear calibration is usually statistically derived, based on observed and simulated galaxy samples. Nevertheless, through galaxy cluster background selections, some galaxy populations may be systematically excluded. This may invalidate the statistical estimate of the shape multiplicative bias, namely , depending on the shear measurement technique and on the actual properties of the data (Heymans et al. 2012; Miller et al. 2013; Hildebrandt et al. 2016).
The typical uncertainty on found for stage III surveys ranges in the interval (see, e.g. Jarvis et al. 2016; Melchior et al. 2017; Giblin et al. 2021). To assess the impact of colour selections on , we considered the shape catalogues of Heymans et al. (2012), based on CFHTLS, and of Mandelbaum et al. (2018), based on the HSC Subaru Strategic Program (HSC-SSP; Miyazaki et al. 2018; Aihara et al. 2018). Throughout this section, we adopted a lens redshift of . By applying the selection calibrated in this work, we derived a shift in the mean shear multiplicative bias of in CFHTLS and of in HSC-SSP. In addition, the Oguri et al. (2012) and Medezinski et al. (2018) colour selections provide and from CFHTLS, respectively, while from HSC-SSP we obtained and , respectively. Thus, galaxy population differences due to colour cuts provide systematic effects that are within the typical uncertainty in stage III surveys. By combining colour and photo- selections, we expect to become closer to zero. In Euclid-like surveys, shear has to be calibrated within an accuracy of (Cropper et al. 2013). As we discussed in Sect. 4.5, the combination of and photo- selections leads to 90% background completeness in the Euclid Wide Survey, on average; thus, we may expect the bias on to be subdominant with respect to the required shear accuracy. Indeed, let us assume that 90% of galaxies, selected through the combination of and photo- selections, have an average similar to that derived from stage III surveys, namely . We assume that the remaining 10% of galaxies have a very biased , namely , compared to the selected population. This would imply a systematic error of in the average of the selected population. We will delve deeper into these variations in by examining the first data releases of the Euclid surveys.
4.7 Selection efficiency with missing bands
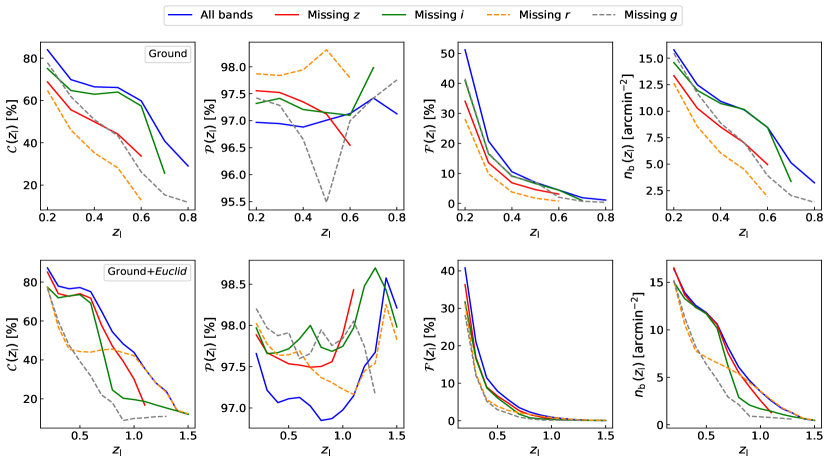
In this work, we derived colour selections based on and photometry. In some cases, however, the full ground-based photometry may be not available. For example, the DES Year 3 galaxy shape catalogue was not based on band (Gatti et al. 2021), due to issues in the point spread function estimation (Jarvis et al. 2021). Thus, we investigated the efficiency of and selections in the case of a missing band, based on the B20 calibration sample described in Sect. 2. In performing this test, we excluded the colour conditions in Tables 2 and 3 containing the chosen missing bands. In Fig. 10 we show that, in the case of ground-only observations, the absence of the band implies the largest completeness decrease, providing . In addition, the range is substantially reduced, corresponding to . Also the absence of and bands implies a reduction of the maximum for the ground-based selection, corresponding to and , respectively, and a completeness decrease of up to 10 and 20 percent points, respectively. On average, a 20 percent point drop in completeness is found in absence of band photometry. Nevertheless, in the latter case the range is not reduced. We remark that the considered samples differ from case to case, as they contain only galaxies with photometry available in the required bands.
In Fig. 10 we show the effect of missing photometric bands on the combination of ground-based and Euclid observations. In this case, the lack of band does not imply changes in for . In the absence of band, significantly decreases for , being below , while the range is not reduced. A range reduction is obtained in the case of missing or bands, as we derived and , respectively. On average, in the case of the combination of ground-based and Euclid observations, the largest completeness decrease is caused by the lack of the band.
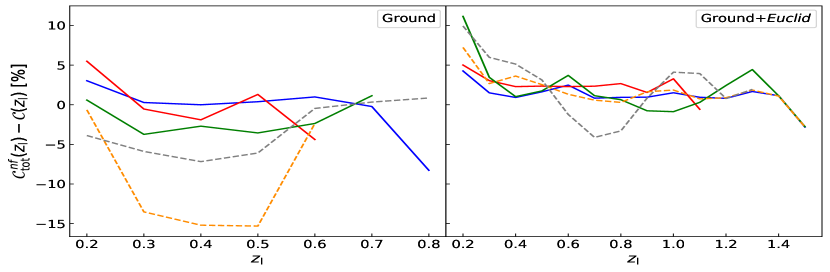
In this section, we defined colour selections with missing , , , or band, as subsets of the colour conditions defining the and selections. In order to assess the difference between the selections defined by such subsets and those that would be derived from the colour selection calibration described in Sect. 3, we compute for each case. In Fig. 10, we show the difference between and , the latter being derived by subsets of the colour conditions defining and selections. In the ground-only case, the lack of band provides the largest underestimation, as percent points for . Nevertheless, in case of other missing bands, the average is close to 0. The same holds for the combination of ground-based and Euclid photometry. We conclude that and selections provide robust results in the case of a missing band, except for ground-only observations without the band, for which a dedicated calibration might be needed.
5 Comparison with literature ground-based selections
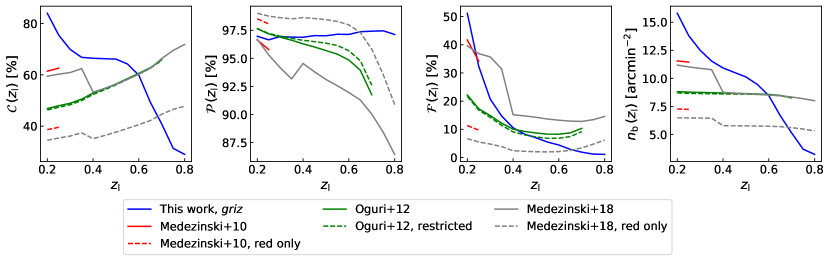
Based on the B20 sample considered in Sect. 4.1, we compared our colour selection to those derived by Medezinski et al. (2010), Oguri et al. (2012), and Medezinski et al. (2018), which are also implemented in COMB-CL. As detailed below, for each of these selections, we considered two versions. One includes all the colour conditions provided by the corresponding authors, while the other comprises only a subsample of such conditions, providing lower foreground contamination. COMB-CL includes both versions of each colour selection.
Medezinski et al. (2010) derived colour selections for three massive clusters, identified through deep Subaru imaging, by maximising their weak-lensing signal. COMB-CL provides the selection calibrated for the A1703 cluster at redshift , as this is the one based on photometry. This selection is expressed as follows,
| (11) |
| (12) |
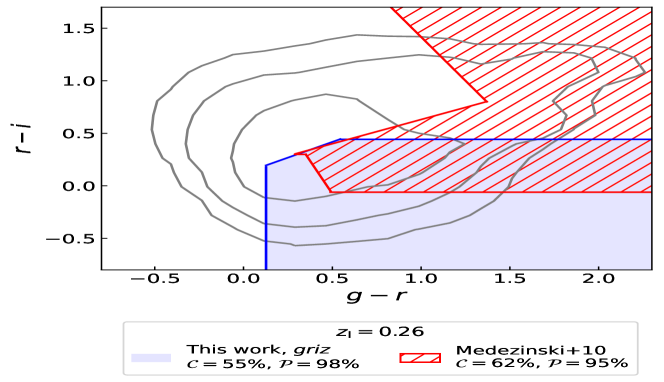
where is the logical ‘and’ operator. Notably, Eq. (5) defines the red background sample, namely the galaxies redder than cluster galaxies, while Eq. (5) defines the blue background sample. In Fig. 11, we can see that this selection provides , which is percent points lower than that provided by the selection calibrated in this work. In addition, from the Medezinski et al. (2010) selection we derived , which is slightly lower than that obtained from the selection discussed in Sect. 4.1. Foreground contamination can be attenuated by considering the red sample selection only, namely Eq. (5), as shown in Fig. 11. In this case, however, the completeness is lowered by 20 percent points. In Fig. 12 (upper panel), we show a comparison between the selection by Medezinski et al. (2010), namely Eqs. (5) and (5), and our selection in the - colour-colour space, by assuming . Within this colour-colour space, we obtained and from the selection, while through the Medezinski et al. (2010) selection we found and . We remark that the full set of colour conditions defining the selection yields 80% completeness for , and that a calibration based on bands only would yield larger completeness values in the - space (see Sect. 4.7). In addition, Fig. 12 shows that the selection extends the selected region defined by Eq. (5), thus enhancing the red background sample compared to Medezinski et al. (2010). On the other hand, the selection shows a more conservative definition of the blue background sample, compared to Eq. (5).
Oguri et al. (2012) calibrated a selection based on photometry from the COSMOS catalogue by Ilbert et al. (2009), providing reliable results for lenses at redshift . This selection is expressed as
| (13) |
| (14) |
| (15) |
| (16) |
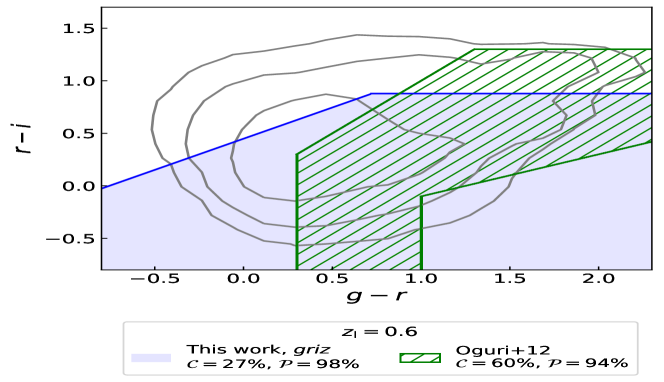
The inclusion of Eq. (16) does not provide significant improvement in the completeness, causing a lower selection purity (Covone et al. 2014). In fact, Fig. 11 shows that the selection including Eqs. (13) – (16) provides sub-percent improvements in , compared to the selection including Eqs. (13) – (15) only, while and are up to 1 percent point lower and higher, respectively. With respect to the selection calibrated in this work, the Oguri et al. (2012) selection provides a purity which is up to percent points lower. This explains the higher completeness values for . For lower , the Oguri et al. (2012) selection provides a completeness up to 35 percent points lower, which is expected as the selection by Oguri et al. (2012) was calibrated for clusters at . Similarly to the comparison with the Medezinski et al. (2010) selection discussed above, in Fig. 12 (lower panel) we compare the and Oguri et al. (2012) selections in the - colour-colour space, assuming . We obtained and from the selection, while with the Oguri et al. (2012) selection we found and . With respect to what we found by comparing and Medezinski et al. (2010) selections at , the decrease in completeness due to a purity enhancement is much larger at . This depends on the overlap of the foreground and background galaxy distributions in the - space. In addition, we remark that the calibration process presented in Sect. 3 excludes redundant colour conditions. This may partially explain the 27% completeness found in the case of the selection.
Medezinski et al. (2018) calibrated a colour selection based on HSC observations, including bands, following an approach similar to Medezinski et al. (2010). This colour selection is expressed as
| (17) |
| (18) |
where
| (19) |
| (20) |
| (21) |
| (22) |
Similarly to Medezinski et al. (2010), Eqs. (5) and (5) define the red and blue background samples, respectively. This selection provides a much larger amount of contamination compared to that derived in this work, reaching for , as shown in Fig. 11. However, by considering the red sample selection only, the purity improves by up to percent points. In the latter case, compared to the selection detailed in Table 2, is up to percent points lower for . For higher , the lower purity from the Medezinski et al. (2018) selection allows for higher completeness values.
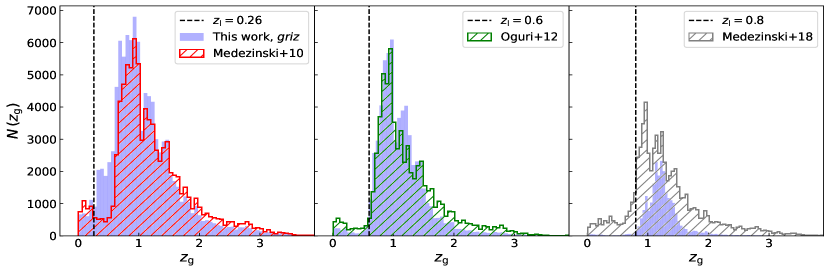
In Fig. 13 we show the redshift distributions of the galaxies selected through the , Medezinski et al. (2010), Oguri et al. (2012), and Medezinski et al. (2018) selections, assuming different values. At , the selection shows a larger number of galaxies, of the order of 103, which are correctly identified as background objects with , compared to Medezinski et al. (2010). This results in the larger completeness of the selection shown in Fig. 11. At , where the and Oguri et al. (2012) selections have the same completeness (see Fig. 11), the selection is less complete at and more complete at lower redshifts, compared to Oguri et al. (2012). At , where the selection is remarkably purer than that by Medezinski et al. (2018), a notable incompleteness of the selection is evident at any , compared to Medezinski et al. (2018). In fact, for the case of the selection, Fig. 13 shows that the number of rejected galaxies at high redshift increases with the number of excluded foreground galaxies. This reflects the overlapping of foreground and background galaxy distributions in the considered colour-colour spaces.
6 Discussion and conclusions
We developed a method to derive optimal galaxy colour selections for cluster weak-lensing analyses, given any set of photometric bands. To this aim, we considered all the available colour-colour combinations. Based on the galaxy catalogue by B20, we calibrated selections based on ground-based and Euclid bands, with purity higher than . Specifically, we showed that the selection provides a completeness between 30% and 84%, in the lens limiting redshift range . The inclusion of Euclid bands, leading to a selection, improves the completeness by up to percent points in this range, allowing for a galaxy selection up to . In addition, for the first time in the literature, we expressed such selections as a continuous function of . In the following, we summarise the main results obtained from the tests presented in Sects. 4 and 5.
-
•
The calibrated colour selections, described in Sect. 4.1, are stable with respect to changes in the sample limiting magnitudes and redshift.
-
•
By applying the selection to the VMLS catalogue by Moutard et al. (2016) and to the COSMOS20 catalogue by Weaver et al. (2022), we derived completeness and purity estimates that are consistent with those obtained from the calibration sample by B20. Consequently, the calibrated selections provide stable results by assuming alternative photometric aperture definitions, obtained from different ground-based telescopes.
-
•
The application of and selections to the simulated Euclid Flagship galaxy catalogue v2.1.10 (Euclid Collaboration in prep.) provided a purity of around , on average, which is higher than that obtained from the B20 catalogue. The completeness from the Flagship and B20 samples is compatible in the selection case, while the selection provides up to percent points higher completeness from Flagship. We verified that this discrepancy does not depend on magnitude limits. In addition, we found no significant differences in the star forming galaxy fraction from the Flagship and B20 samples. A calibration of the selection based on the Euclid Deep Survey will allow for a more thorough investigation of these completeness differences.
-
•
Based on the Flagship sample, we combined the calibrated colour selections with photo- selections based on the shape. We showed that in this case the completeness is up to .
-
•
We found no significant systematic effects on the multiplicative shear bias due to colour selections for stage III surveys. The first Euclid data releases will provide further insights into the influence of background selections on this bias.
-
•
The calibrated colour selections provide robust results in the case of a missing band from ground-based observations, except for those without the band, for which a dedicated calibration might be needed.
- •
One potential enhancement to the calibration presented in this work could entail the inclusion of a magnitude dependence in the colour cuts. This might mitigate the impact of large photometric scatter at faint magnitudes (see, e.g. Schrabback et al. 2021). In addition, enhancing the set of photometric bands in the calibration sample, for example by including the LSST band, could remarkably improve the effectiveness of the colour selections. The performance of colour selections could further improve through dedicated calibration samples. Ongoing spectroscopic programmes are specifically designed to calibrate the relationship between galaxy colours and redshifts to match the depth of the Euclid survey (Euclid Collaboration: Saglia et al. 2022).
Furthermore, the colour selections presented in this work could improve the shear calibration in cluster weak-lensing analyses. The lensing signal from galaxy clusters differs from that of large scale structure in ways that affect both shear and photometric measurements. The dense cluster environment causes increased blending among light sources, due to both galaxy blends (Simet & Mandelbaum 2015; Everett et al. 2022) and the presence of diffuse intra-cluster light (Gruen et al. 2019; Kluge et al. 2020; Sampaio-Santos et al. 2021). In addition, cluster lines of sight exhibit characteristically stronger shear, especially at small scales (McClintock et al. 2019; Ingoglia et al. 2022). These effects can lead to distinct biases in shear measurements compared to those obtained from calibrations primarily designed for cosmic shear analyses. Through the combination of colour and photo- selections, cluster shear calibration and mass bias can be assessed based on dedicated, multi-band cluster image simulations (see, e.g. Hernández-Martín
et al. 2020).
Acknowledgements.
The Euclid Consortium acknowledges the European Space Agency and a number of agencies and institutes that have supported the development of Euclid, in particular the Academy of Finland, the Agenzia Spaziale Italiana, the Belgian Science Policy, the Canadian Euclid Consortium, the French Centre National d’Etudes Spatiales, the Deutsches Zentrum für Luft- und Raumfahrt, the Danish Space Research Institute, the Fundação para a Ciência e a Tecnologia, the Ministerio de Ciencia e Innovación, the National Aeronautics and Space Administration, the National Astronomical Observatory of Japan, the Netherlandse Onderzoekschool Voor Astronomie, the Norwegian Space Agency, the Romanian Space Agency, the State Secretariat for Education, Research and Innovation (SERI) at the Swiss Space Office (SSO), and the United Kingdom Space Agency. A complete and detailed list is available on the Euclid web site (http://www.euclid-ec.org)We thank W. Hartley for his valuable advice, which remarkably enhanced the quality of this work. GC and LM acknowledge the support from the grant ASI n.2018-23-HH.0. LM and FM acknowledge the financial contribution from the grant PRIN-MUR 2022 20227RNLY3 “The concordance cosmological model: stress-tests with galaxy clusters” supported by Next Generation EU. LB acknowledges financial support from PRIN-MIUR ML3WW_001. MS acknowledges financial contributions from contract ASI-INAF n.2017-14-H.0, contract INAF mainstream project 1.05.01.86.10, and INAF Theory Grant 2023: Gravitational lensing detection of matter distribution at galaxy cluster boundaries and beyond (1.05.23.06.17). GC thanks the support from INAF Theory Grant 2022: Illuminating Dark Matter using Weak Lensing by Cluster Satellites, PI: Carlo Giocoli.
This work has made use of CosmoHub (Carretero et al. 2017; Tallada et al. 2020). CosmoHub has been developed by the Port d’Informació Científica (PIC), maintained through a collaboration of the Institut de Física d’Altes Energies (IFAE) and the Centro de Investigaciones Energéticas, Medioambientales y Tecnológicas (CIEMAT) and the Institute of Space Sciences (CSIC & IEEC), and was partially funded by the ”Plan Estatal de Investigación Científica y Técnica y de Innovación” program of the Spanish government.
References
- Abbott et al. (2020) Abbott, T. M. C., Aguena, M., Alarcon, A., et al. 2020, Phys. Rev. D, 102, 023509
- Aihara et al. (2018) Aihara, H., Armstrong, R., Bickerton, S., et al. 2018, Publ. Astron. Soc. Japan, 70, S8
- Applegate et al. (2014) Applegate, D. E., von der Linden, A., Kelly, P. L., et al. 2014, MNRAS, 439, 48
- Baltz et al. (2009) Baltz, E. A., Marshall, P., & Oguri, M. 2009, J. Cosm. Astro-Particle Phys., 2009, 015
- Behroozi et al. (2013) Behroozi, P. S., Wechsler, R. H., & Wu, H.-Y. 2013, ApJ, 762, 109
- Bellagamba et al. (2019) Bellagamba, F., Sereno, M., Roncarelli, M., et al. 2019, MNRAS, 484, 1598
- Bisigello et al. (2020) Bisigello, L., Kuchner, U., Conselice, C. J., et al. 2020, MNRAS, 494, 2337
- Broadhurst et al. (2005) Broadhurst, T., Takada, M., Umetsu, K., et al. 2005, ApJ Lett., 619, L143
- Bruzual & Charlot (2003) Bruzual, G. & Charlot, S. 2003, MNRAS, 344, 1000
- Carretero et al. (2017) Carretero, J., Tallada, P., Casals, J., et al. 2017, in Proceedings of the European Physical Society Conference on High Energy Physics. 5-12 July, 488
- Chambers et al. (2016) Chambers, K. C., Magnier, E. A., Metcalfe, N., et al. 2016, arXiv e-prints, arXiv:1612.05560
- CHEX-MATE Collaboration (2021) CHEX-MATE Collaboration. 2021, A&A, 650, A104
- Costanzi et al. (2019) Costanzi, M., Rozo, E., Simet, M., et al. 2019, MNRAS, 488, 4779
- Covone et al. (2014) Covone, G., Sereno, M., Kilbinger, M., & Cardone, V. F. 2014, ApJ Lett., 784, L25
- Cropper et al. (2013) Cropper, M., Hoekstra, H., Kitching, T., et al. 2013, MNRAS, 431, 3103
- Cropper et al. (2016) Cropper, M., Pottinger, S., Niemi, S., et al. 2016, in Society of Photo-Optical Instrumentation Engineers (SPIE) Conference Series, Vol. 9904, Space Telescopes and Instrumentation 2016: Optical, Infrared, and Millimeter Wave, ed. H. A. MacEwen, G. G. Fazio, M. Lystrup, N. Batalha, N. Siegler, & E. C. Tong, 99040Q
- Diemer & Kravtsov (2014) Diemer, B. & Kravtsov, A. V. 2014, ApJ, 789, 1
- Dietrich et al. (2019) Dietrich, J. P., Bocquet, S., Schrabback, T., et al. 2019, MNRAS, 483, 2871
- Eckert et al. (2022) Eckert, D., Ettori, S., Robertson, A., et al. 2022, A&A, 666, A41
- Euclid Collaboration: Adam et al. (2019) Euclid Collaboration: Adam, R., Vannier, M., Maurogordato, S., et al. 2019, A&A, 627, A23
- Euclid Collaboration: Bisigello et al. (2023) Euclid Collaboration: Bisigello, L., Conselice, C. J., Baes, M., et al. 2023, MNRAS, 520, 3529
- Euclid Collaboration: Desprez et al. (2020) Euclid Collaboration: Desprez, G., Paltani, S., Coupon, J., et al. 2020, A&A, 644, A31
- Euclid Collaboration: Pocino et al. (2021) Euclid Collaboration: Pocino, A., Tutusaus, I., Castander, F. J., et al. 2021, A&A, 655, A44
- Euclid Collaboration: Saglia et al. (2022) Euclid Collaboration: Saglia, R., De Nicola, S., Fabricius, M., et al. 2022, A&A, 664, A196
- Euclid Collaboration: Scaramella et al. (2022) Euclid Collaboration: Scaramella, R., Amiaux, J., Mellier, Y., et al. 2022, A&A, 662, A112
- Euclid Collaboration: Schirmer et al. (2022) Euclid Collaboration: Schirmer, M., Jahnke, K., Seidel, G., et al. 2022, A&A, 662, A92
- Euclid Collaboration: Sereno et al. (2023) Euclid Collaboration: Sereno, M., Farrens, S., Ingoglia, L., et al. 2023, Submitted to A&A
- Everett et al. (2022) Everett, S., Yanny, B., Kuropatkin, N., et al. 2022, ApJ Suppl., 258, 15
- Gatti et al. (2021) Gatti, M., Sheldon, E., Amon, A., et al. 2021, MNRAS, 504, 4312
- Giblin et al. (2021) Giblin, B., Heymans, C., Asgari, M., et al. 2021, A&A, 645, A105
- Gruen et al. (2014) Gruen, D., Seitz, S., Brimioulle, F., et al. 2014, MNRAS, 442, 1507
- Gruen et al. (2019) Gruen, D., Zhang, Y., Palmese, A., et al. 2019, MNRAS, 488, 4389
- Gunn et al. (1998) Gunn, J. E., Carr, M., Rockosi, C., et al. 1998, Astron. J., 116, 3040
- Guzzo et al. (2014) Guzzo, L., Scodeggio, M., Garilli, B., et al. 2014, A&A, 566, A108
- Gwyn (2012) Gwyn, S. D. J. 2012, Astron. J., 143, 38
- Hernández-Martín et al. (2020) Hernández-Martín, B., Schrabback, T., Hoekstra, H., et al. 2020, A&A, 640, A117
- Heymans & Heavens (2003) Heymans, C. & Heavens, A. 2003, MNRAS, 339, 711
- Heymans et al. (2012) Heymans, C., Van Waerbeke, L., Miller, L., et al. 2012, MNRAS, 427, 146
- Hildebrandt et al. (2016) Hildebrandt, H., Choi, A., Heymans, C., et al. 2016, MNRAS, 463, 635
- Hoekstra et al. (2012) Hoekstra, H., Mahdavi, A., Babul, A., & Bildfell, C. 2012, MNRAS, 427, 1298
- Hudelot et al. (2012) Hudelot, P., Cuillandre, J. C., Withington, K., et al. 2012, VizieR Online Data Catalog, II/317
- Ibata et al. (2017) Ibata, R. A., McConnachie, A., Cuillandre, J.-C., et al. 2017, ApJ, 848, 128
- Ilbert et al. (2009) Ilbert, O., Capak, P., Salvato, M., et al. 2009, ApJ, 690, 1236
- Ingoglia et al. (2022) Ingoglia, L., Covone, G., Sereno, M., et al. 2022, MNRAS, 511, 1484
- Ivezic et al. (2008) Ivezic, Z., Axelrod, T., Brandt, W. N., et al. 2008, Serbian Astronomical Journal, 176, 1
- Iye et al. (2004) Iye, M., Karoji, H., Ando, H., et al. 2004, Publ. Astron. Soc. Japan, 56, 381
- Jarvis et al. (2021) Jarvis, M., Bernstein, G. M., Amon, A., et al. 2021, MNRAS, 501, 1282
- Jarvis et al. (2016) Jarvis, M., Sheldon, E., Zuntz, J., et al. 2016, MNRAS, 460, 2245
- Klein et al. (2019) Klein, M., Israel, H., Nagarajan, A., et al. 2019, MNRAS, 488, 1704
- Kluge et al. (2020) Kluge, M., Neureiter, B., Riffeser, A., et al. 2020, ApJ Suppl., 247, 43
- Kron (1980) Kron, R. G. 1980, ApJ Suppl., 43, 305
- Kuijken et al. (2019) Kuijken, K., Heymans, C., Dvornik, A., et al. 2019, A&A, 625, A2
- Laigle et al. (2016) Laigle, C., McCracken, H. J., Ilbert, O., et al. 2016, ApJ Suppl., 224, 24
- Laureijs et al. (2011) Laureijs, R., Amiaux, J., Arduini, S., et al. 2011, arXiv e-prints, arXiv:1110.3193
- Lesci et al. (2022) Lesci, G. F., Marulli, F., Moscardini, L., et al. 2022, A&A, 659, A88
- Li et al. (2022) Li, X., Miyatake, H., Luo, W., et al. 2022, Publ. Astron. Soc. Japan, 74, 421
- Mandelbaum et al. (2018) Mandelbaum, R., Miyatake, H., Hamana, T., et al. 2018, Publ. Astron. Soc. Japan, 70, S25
- Mantz et al. (2015) Mantz, A. B., von der Linden, A., Allen, S. W., et al. 2015, MNRAS, 446, 2205
- Marulli et al. (2021) Marulli, F., Veropalumbo, A., García-Farieta, J. E., et al. 2021, ApJ, 920, 13
- Maturi et al. (2019) Maturi, M., Bellagamba, F., Radovich, M., et al. 2019, MNRAS, 485, 498
- McClintock et al. (2019) McClintock, T., Varga, T. N., Gruen, D., et al. 2019, MNRAS, 482, 1352
- Medezinski et al. (2007) Medezinski, E., Broadhurst, T., Umetsu, K., et al. 2007, ApJ, 663, 717
- Medezinski et al. (2010) Medezinski, E., Broadhurst, T., Umetsu, K., et al. 2010, MNRAS, 405, 257
- Medezinski et al. (2018) Medezinski, E., Oguri, M., Nishizawa, A. J., et al. 2018, Publ. Astron. Soc. Japan, 70, 30
- Melchior et al. (2017) Melchior, P., Gruen, D., McClintock, T., et al. 2017, MNRAS, 469, 4899
- Melchior et al. (2015) Melchior, P., Suchyta, E., Huff, E., et al. 2015, MNRAS, 449, 2219
- Miller et al. (2013) Miller, L., Heymans, C., Kitching, T. D., et al. 2013, MNRAS, 429, 2858
- Miyazaki et al. (2018) Miyazaki, S., Komiyama, Y., Kawanomoto, S., et al. 2018, Publ. Astron. Soc. Japan, 70, S1
- Moutard et al. (2016) Moutard, T., Arnouts, S., Ilbert, O., et al. 2016, A&A, 590, A102
- Navarro et al. (1997) Navarro, J. F., Frenk, C. S., & White, S. D. M. 1997, ApJ, 490, 493
- Oguri et al. (2012) Oguri, M., Bayliss, M. B., Dahle, H., et al. 2012, MNRAS, 420, 3213
- Okabe et al. (2010) Okabe, N., Zhang, Y. Y., Finoguenov, A., et al. 2010, ApJ, 721, 875
- Peter et al. (2013) Peter, A. H. G., Rocha, M., Bullock, J. S., & Kaplinghat, M. 2013, MNRAS, 430, 105
- Planck Collaboration XXIV (2016) Planck Collaboration XXIV. 2016, A&A, 594, A24
- Polletta et al. (2007) Polletta, M., Tajer, M., Maraschi, L., et al. 2007, ApJ, 663, 81
- Pratt et al. (2019) Pratt, G. W., Arnaud, M., Biviano, A., et al. 2019, Space Sci. Rev., 215, 25
- Robertson et al. (2017) Robertson, A., Massey, R., & Eke, V. 2017, MNRAS, 465, 569
- Rykoff et al. (2016) Rykoff, E. S., Rozo, E., Hollowood, D., et al. 2016, ApJ Suppl., 224, 1
- Sampaio-Santos et al. (2021) Sampaio-Santos, H., Zhang, Y., Ogando, R. L. C., et al. 2021, MNRAS, 501, 1300
- Schrabback et al. (2021) Schrabback, T., Bocquet, S., Sommer, M., et al. 2021, MNRAS, 505, 3923
- Schrabback et al. (2018) Schrabback, T., Schirmer, M., van der Burg, R. F. J., et al. 2018, A&A, 610, A85
- Sereno et al. (2017) Sereno, M., Covone, G., Izzo, L., et al. 2017, MNRAS, 472, 1946
- Sereno et al. (2021) Sereno, M., Lovisari, L., Cui, W., & Schellenberger, G. 2021, MNRAS, 507, 5214
- Sereno et al. (2015) Sereno, M., Veropalumbo, A., Marulli, F., et al. 2015, MNRAS, 449, 4147
- Sevilla-Noarbe et al. (2021) Sevilla-Noarbe, I., Bechtol, K., Carrasco Kind, M., et al. 2021, ApJ Suppl., 254, 24
- Sifón et al. (2015) Sifón, C., Hoekstra, H., Cacciato, M., et al. 2015, A&A, 575, A48
- Simet & Mandelbaum (2015) Simet, M. & Mandelbaum, R. 2015, MNRAS, 449, 1259
- Stern et al. (2019) Stern, C., Dietrich, J. P., Bocquet, S., et al. 2019, MNRAS, 485, 69
- Tallada et al. (2020) Tallada, P., Carretero, J., Casals, J., et al. 2020, Astronomy and Computing, 32, 32
- Teyssier et al. (2011) Teyssier, R., Moore, B., Martizzi, D., Dubois, Y., & Mayer, L. 2011, MNRAS, 414, 195
- Umetsu (2020) Umetsu, K. 2020, A&A Rev., 28, 7
- Vazza et al. (2017) Vazza, F., Jones, T. W., Brüggen, M., et al. 2017, MNRAS, 464, 210
- Weaver et al. (2022) Weaver, J. R., Kauffmann, O. B., Ilbert, O., et al. 2022, ApJ Suppl., 258, 11
- Zhu et al. (2021) Zhu, Z., Xu, H., Hu, D., et al. 2021, ApJ, 908, 17
- Zohren et al. (2022) Zohren, H., Schrabback, T., Bocquet, S., et al. 2022, A&A, 668, A18
Appendix A Colour selection parameterisation
In Tables 2 and 3 we report the parameterisation of and selections, respectively, described in Sect. 4.1.
| Colour condition | Parameters | range |
| ; | ||
| ; | ||
| ; | ||
| ; | ||
| ; | ||
| ; | ||
| ; | ||
| ; | ||
| ; | ||
| ; | ||
| ; |
| Colour condition | Parameters | range |
| ; | ||
| ; | ||
| ; | ||
| ; | ||
| ; | ||
| ; | ||
| ; | ||
| ; | ||
| ; | ||
| ; | ||
| ; | ||
| ; | ||
| ; | ||
| ; | ||
| ; | ||
| ; | ||
| ; | ||
| ; | ||
| ; | ||
| ; | ||
| ; | ||
| ; | ||
| ; | ||
| ; | ||
| ; | ||
| ; | ||
| ; | ||
| ; | ||
| ; | ||
| ; | ||
| ; |