(cvpr) Package cvpr Warning: Single column document - CVPR requires papers to have two-column layout. Please load document class ‘article’ with ‘twocolumn’ option
Sanity checks for patch visualisation in prototype-based image classification
- Supplementary material -
1 Training prototype-based classifiers
In this work, we use the code provided by the authors of ProtoPNet [7] and ProtoTree [18] in order to train classifiers on the CUB-200-2011 dataset [33] (CUB) and the StanfordCars dataset [15]. For ProtoPNet, we use the default training parameters provided by the authors and trained the models during 50 epochs. For ProtoTree, we also use the default parameters and trained the models during 100 epochs. Table 1 presents the final accuracy of the models used in our experiments.
| Model | Backbone | Dataset | Accuracy |
| ProtoPNet | VGG19 | CUB-c | 75.1% |
| ResNet50 | CUB-c | 72.5% | |
| CARS | 71.4% | ||
| ProtoTree | ResNet50 | CUB | 83.1% |
| CARS | 83.2% |
2 More prototype visualisation with Smoothgrads and PRP
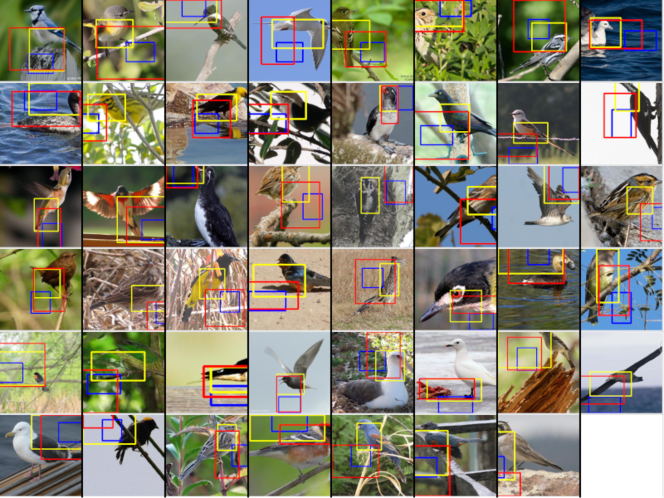
Fig. 1 illustrates how using more faithful visualisation methods, such as PRP or Smoothgrads, rather than upsampling can improve the trust that the user can have in the model. In these examples, the upsampling strategy shows image patches focused on the background and gives a false sense of bias in the model, while PRP and Smoothgrads - which provide more faithful saliency maps - are focusing on elements of the bird.
3 Area under the Deletion Curve
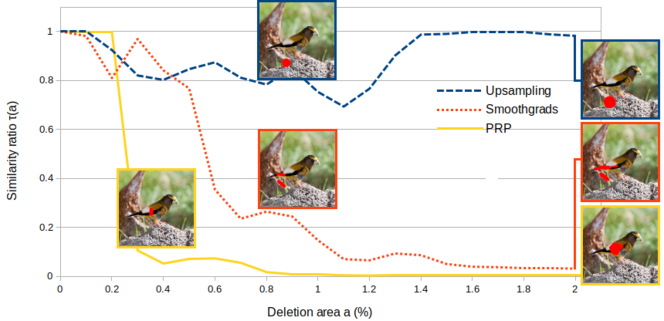
In this section, we illustrate the evolution of the similarity ratio when incrementally removing the most important pixels of the image according to the saliency maps proposed by the different visualisation methods under study. As shown in the example of Fig. 2, removing pixels according to upsampling has little to no effect on the similarity score, suggesting that the explanation is incorrect. On the contrary, when removing only 1% of the image according to Smoothgrads, the similarity score drops to roughly 15% of its original value, suggesting that the explanation focuses on actual regions of interest for the model. The same result is achieved when removing only 0.3% of the image according PRP, indicating an even more precise explanation. Moreover, reaching a similarity ratio lower than 10% indicates that the explanation method has successfully identified the most relevant pixels of the image patch and gives an indication on the effective size of the image patch.
4 Distribution of similarity ratio v. deletion area on ProtoTree visualisation
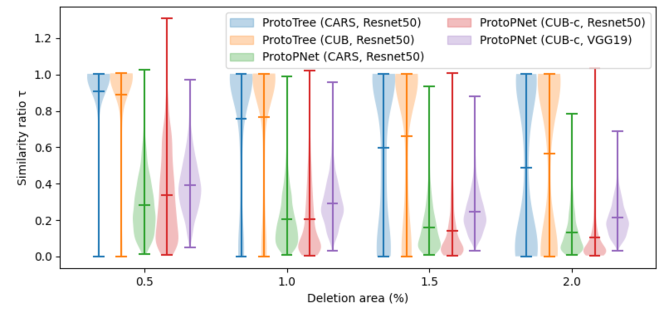
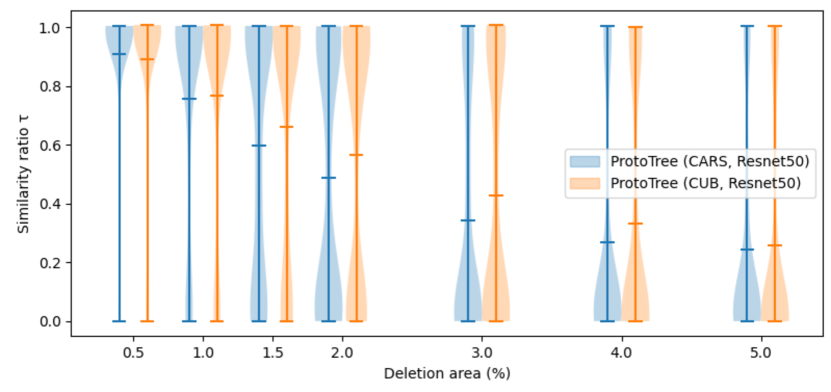
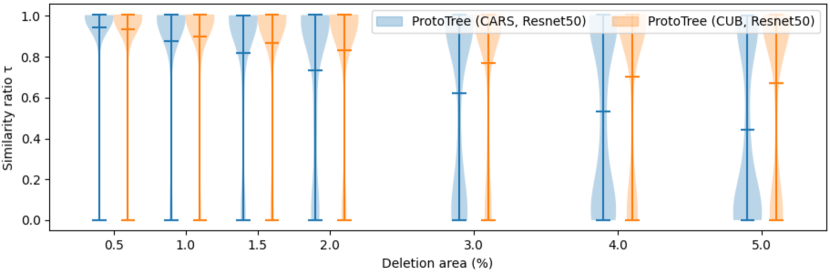
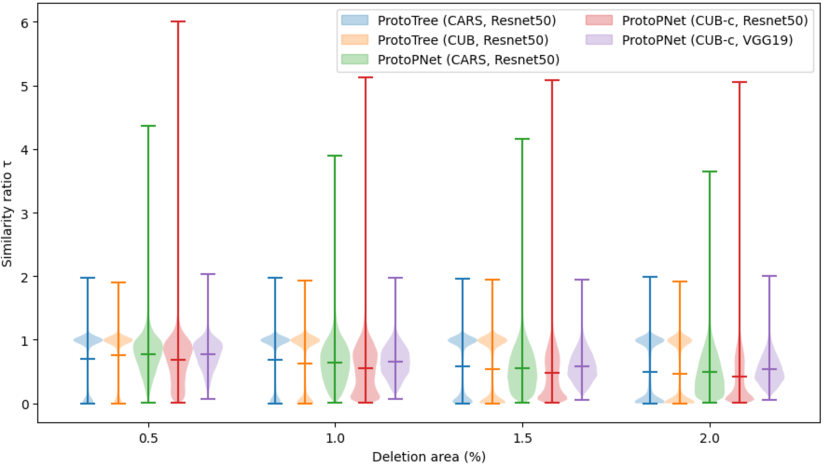
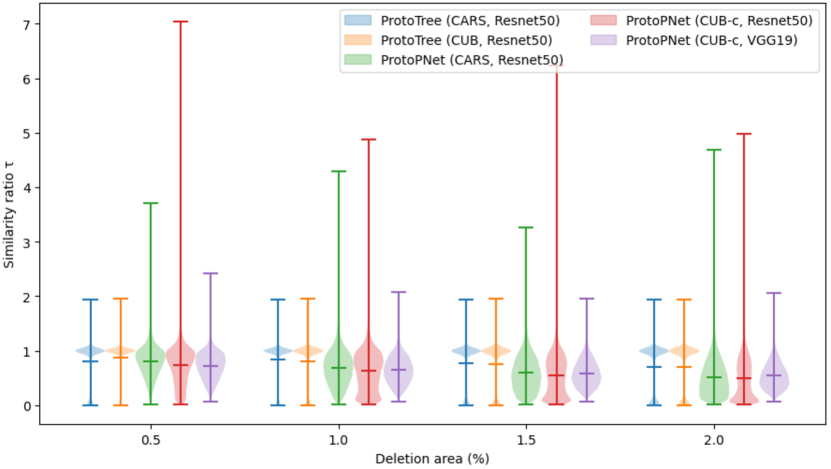
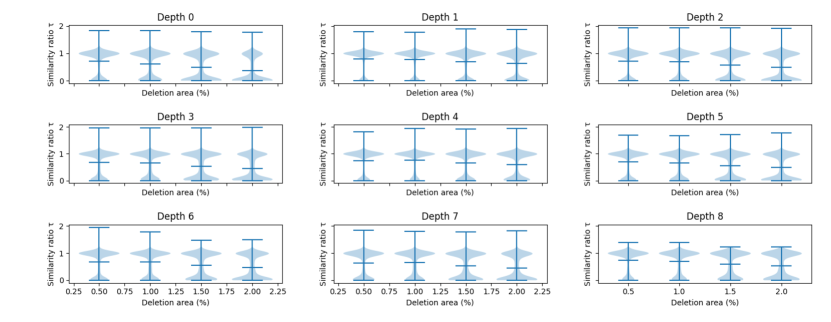
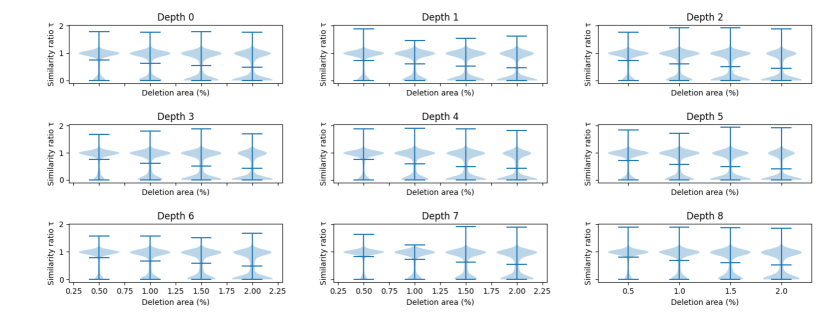
In addition to the results presented in the paper focusing on the average similarity ratio v. deletion area, in this section we study the distribution of similarity ratios for a given deletion area (here 0.5%, 1%, 1.5% and 2%). As shown in Fig. 3, we notice a ”sandglass” effect on the distribution of similarity ratios for ProtoTree prototypes: for low deletion areas (), the similarity ratio for all prototypes is close to 1. Then, from 1.5% up to 4-5% (Fig.4(a)), the distribution of similarity ratios slowly shifts towards 0. This suggests that the drop in similarity does occurs uniformly for all prototypes, but rather in a ”continuous” manner, i.e. that ProtoTree prototypes have a wider range of size for their corresponding effective receptive fields than ProtoPNet prototypes. Moreover, as shown in Fig. 4(b), the sandglass effect is also present when using Smoothgrads and when visualising image patches during inference (Fig. 5). Moreover, as shown in Fig. 6, this effect is seemingly uncorrelated to the depth of the prototype inside of the decision tree. This suggests that ProtoTree does not necessarily focus on finer - and smaller - details in the last stages of the decision process.
References
- [1] Julius Adebayo, Justin Gilmer, Michael Muelly, Ian Goodfellow, Moritz Hardt, and Been Kim. Sanity Checks for Saliency Maps. In Advances in Neural Information Processing Systems 32, page 11, 2018.
- [2] David Alvarez-Melis and Tommi S. Jaakkola. Towards robust interpretability with self-explaining neural networks. In Proceedings of the 32nd International Conference on Neural Information Processing Systems, NIPS’18, page 7786–7795, Red Hook, NY, USA, 2018. Curran Associates Inc.
- [3] M. Ancona, E. Ceolini, A. C. Öztireli, and M. Gross. A unified view of gradient-based attribution methods for deep neural networks. In NIPS Workshop on Interpreting, Explaining and Visualizing Deep Learning, 2017.
- [4] André Araujo, Wade Norris, and Jack Sim. Computing receptive fields of convolutional neural networks. Distill, 2019. https://distill.pub/2019/computing-receptive-fields.
- [5] Alexander Binder, Sebastian Bach, Gregoire Montavon, Klaus-Robert Müller, and Wojciech Samek. Layer-wise relevance propagation for deep neural network architectures. In Kuinam J. Kim and Nikolai Joukov, editors, Information Science and Applications (ICISA) 2016, pages 913–922, Singapore, 2016. Springer Singapore.
- [6] Francesco Bodria, Fosca Giannotti, Riccardo Guidotti, Francesca Naretto, Dino Pedreschi, and Salvatore Rinzivillo. Benchmarking and survey of explanation methods for black box models. ArXiv, abs/2102.13076, 2021.
- [7] Chaofan Chen, Oscar Li, Chaofan Tao, Alina Jade Barnett, Jonathan Su, and Cynthia Rudin. This looks like That: Deep learning for interpretable image recognition. Proceedings of the 33rd International Conference on Neural Information Processing Systems, page 8930–8941, 2019.
- [8] Jia Deng, Wei Dong, Richard Socher, Li-Jia Li, Kai Li, and Li Fei-Fei. Imagenet: A large-scale hierarchical image database. In 2009 IEEE conference on computer vision and pattern recognition, pages 248–255. Ieee, 2009.
- [9] Jonathan Donnelly, Alina Jade Barnett, and Chaofan Chen. Deformable protopnet: An interpretable image classifier using deformable prototypes. 2022 IEEE/CVF Conference on Computer Vision and Pattern Recognition (CVPR), pages 10255–10265, 2021.
- [10] Srishti Gautam, Marina M.-C. Höhne, Stine Hansen, Robert Jenssen, and Michael Kampffmeyer. This looks more like that: Enhancing self-explaining models by prototypical relevance propagation. Pattern Recognition, page 109172, 2022.
- [11] Tristan Gomez, Thomas Fréour, and Harold Mouchère. Metrics for saliency map evaluation of deep learning explanation methods. In International Conferences on Pattern Recognition and Artificial Intelligence, 2022.
- [12] Kaiming He, Xiangyu Zhang, Shaoqing Ren, and Jian Sun. Deep Residual Learning for Image Recognition. In 2016 IEEE Conference on Computer Vision and Pattern Recognition (CVPR), pages 770–778, 2016.
- [13] Adrian Hoffmann, Claudio Fanconi, Rahul Rade, and Jonas Kohler. This looks like that… does it? shortcomings of latent space prototype interpretability in deep networks. ICML 2021 Workshop on Theoretic Foundation, Criticism, and Application Trend of Explainable AI, 2021.
- [14] Grant Van Horn, Oisin Mac Aodha, Yang Song, Yin Cui, Chen Sun, Alexander Shepard, Hartwig Adam, Pietro Perona, and Serge J. Belongie. The inaturalist species classification and detection dataset. 2018 IEEE/CVF Conference on Computer Vision and Pattern Recognition, pages 8769–8778, 2017.
- [15] Jonathan Krause, Michael Stark, Jia Deng and Li Fei-Fei. 3D Object Representations for Fine-Grained Categorization 2013 IEEE International Conference on Computer Vision Workshops, pages 554–561, 2013.
- [16] Meike Nauta, Annemarie Jutte, Jesper C. Provoost, and Christin Seifert. This looks like that, because … explaining prototypes for interpretable image recognition. In PKDD/ECML Workshops, 2020.
- [17] Meike Nauta, Jan Trienes, Shreyasi Pathak, Elisa Nguyen, Michelle Peters, Yasmin Schmitt, Jörg Schlötterer, Maurice van Keulen, and Christin Seifert. From anecdotal evidence to quantitative evaluation methods: A systematic review on evaluating explainable ai. ACM Comput. Surv., feb 2023. Just Accepted.
- [18] Meike Nauta, Ron van Bree, and Christin Seifert. Neural prototype trees for interpretable fine-grained image recognition. 2021 IEEE/CVF Conference on Computer Vision and Pattern Recognition (CVPR), pages 14928–14938, 2021.
- [19] Vitali Petsiuk, Abir Das, and Kate Saenko. Rise: Randomized input sampling for explanation of black-box models. In BMVC, 2018.
- [20] Dawid Rymarczyk, Lukasz Struski, Michal G’orszczak, Koryna Lewandowska, Jacek Tabor, and Bartosz Zieli’nski. Interpretable image classification with differentiable prototypes assignment. In European Conference on Computer Vision, 2021.
- [21] Dawid Rymarczyk, Lukasz Struski, Jacek Tabor, and Bartosz Zieliński. Protopshare: Prototypical parts sharing for similarity discovery in interpretable image classification. Proceedings of the 27th ACM SIGKDD Conference on Knowledge Discovery & Data Mining, 2021.
- [22] Ramprasaath R. Selvaraju, Abhishek Das, Ramakrishna Vedantam, Michael Cogswell, Devi Parikh, and Dhruv Batra. Grad-cam: Why did you say that? ArXiv, abs/1611.07450, 2016.
- [23] Avanti Shrikumar, Peyton Greenside, and Anshul Kundaje. Learning important features through propagating activation differences. In International Conference on Machine Learning, 2017.
- [24] Avanti Shrikumar, Peyton Greenside, Anna Shcherbina, and Anshul Kundaje. Not just a black box: Learning important features through propagating activation differences. ArXiv, abs/1605.01713, 2016.
- [25] Karen Simonyan, Andrea Vedaldi, and Andrew Zisserman. Deep inside convolutional networks: Visualising image classification models and saliency maps. CoRR, abs/1312.6034, 2013.
- [26] Karen Simonyan and Andrew Zisserman. Very deep convolutional networks for large-scale image recognition. CoRR, abs/1409.1556, 2015.
- [27] Daniel Smilkov, Nikhil Thorat, Been Kim, Fernanda B. Viégas, and Martin Wattenberg. Smoothgrad: removing noise by adding noise. ArXiv, abs/1706.03825, 2017.
- [28] Jost Tobias Springenberg, Alexey Dosovitskiy, Thomas Brox, and Martin A. Riedmiller. Striving for simplicity: The all convolutional net. CoRR, abs/1412.6806, 2014.
- [29] Mukund Sundararajan, Ankur Taly, and Qiqi Yan. Axiomatic attribution for deep networks. In Doina Precup and Yee Whye Teh, editors, Proceedings of the 34th International Conference on Machine Learning, volume 70 of Proceedings of Machine Learning Research, pages 3319–3328. PMLR, 06–11 Aug 2017.
- [30] Richard J. Tomsett, Daniel Harborne, Supriyo Chakraborty, Prudhvi K. Gurram, and Alun David Preece. Sanity checks for saliency metrics. ArXiv, abs/1912.01451, 2019.
- [31] Jiaqi Wang, Huafeng Liu, Xinyue Wang, and Liping Jing. Interpretable image recognition by constructing transparent embedding space. 2021 IEEE/CVF International Conference on Computer Vision (ICCV), pages 875–884, 2021.
- [32] Zhou Wang, Alan Conrad Bovik, Hamid R. Sheikh, and Eero P. Simoncelli. Image quality assessment: from error visibility to structural similarity. IEEE Transactions on Image Processing, 13:600–612, 2004.
- [33] P. Welinder, S. Branson, T. Mita, C. Wah, F. Schroff, S. Belongie, and P. Perona. Caltech-UCSD Birds 200. Technical Report CNS-TR-2010-001, 2010.