FRETCalc: A Free Software and Web Server for Förster Resonance Energy Transfer Calculation
Abstract
Förster Resonance Energy Transfer Calculator (FRETCalc) is a program and web server that analyzes molar extinction coefficient of the acceptor, emission spectrum of the donor, and the refractive index spectrum of the donor/acceptor blend. Its main function is to obtain important parameters of the FRET process from experimental data, such as: (i) effective refractive index, (ii) overlap integral, (iii) Förster radius, (iii) FRET efficiency and (iv) FRET rate. FRETCalc is license free software that can be run via dedicated web server (nanocalc.org) or downloading the program executables (for Unix, Windows, and macOS) from the FRETCalc repository on GitHub. The program features a userfriendly interface, making it suitable for materials research and teaching purposes. In addition, the program is optimized to run on normal computers and is lightweight. An example will be given with the step by step of its use and results obtained.
keywords:
Software, Fluorescence, FRET, Energy Transfer, Förster Radius, Organic Semiconductor.1 Introduction
Fluorescence (or Förster) resonance energy transfer is physical process based on the long range dipoledipole interactions between molecules that are fluorescent [1]. In the FRET process, upon photofexcitation, the excited donor (D) molecule can transfers its excess energy to a nearby acceptor (A) molecule. Once the process is completed, the donor returns to the ground state and the acceptor reaches the excited state. In the FRET model, the FRET rate () between donor and acceptor depends on the Förster radius, the DA distance, and the exciton lifetime of the donor in the absence of the acceptor [2]. FRET usually occurs for DA distances between 10 to 100 Å, a range that is comparable to the dimensions of most biological macromolecules [3]. For lower distances, known as contact zone, the ideal dipole approximation of Förster theory breaks down and the energy transfer process occurs predominantly from Dexter mechanism [4].
The FRET phenomena plays a significant role in many technological applications such as organic photovoltaics[5, 6, 7] organic lightemitting diodes[8, 9] and biosensing[10, 11] among others [12, 13, 14]. For example, the optimization of FRET parameters is important to increase the exciton diffusion length of organic materials [15, 16]. Additionally, measuring the competition between FRET rate and charge transfer rate is critical to understanding charge dynamics in different devices [17, 18]. Considering FRETbased biosensors, the high sensitivity, specificity, fast responsibility, and simplicity enables its application in medical diagnosis, food safety, and environmental monitoring [19, 20]. Therefore, software that calculates FRET parameters can be useful in different areas and will allow obtaining relevant information at the molecular level, increasing the understanding of the photophysical process in materials with strong potential for technological applications.
Despite the procedure to calculate Förster radius is well known in the literature, it is not so simple to be implemented [5, 21, 22]. Currently there are some softwares which calculate the FRET parameters. However, these softwares are commonly implemented to obtain the parameters from theoretical quantum chemical calculation [23, 24], single molecule [25] or from the analysis of molecular structure of biomolecules, such nucleic acid (RNA and DNA) [26]. Thus, softwares that obtain the FRET parameters directly from experimental data and that can be applied to study organic materials such as polymers, fullerenes, non-fullerenes and dyes are lacking. Motivated by this deficiency in the literature, we developed a free software and web server, Förster Resonance Energy Transfer Calculator (FRETCalc), that is easy to handle with a simple and intuitive graphic interface for the FRET rate acquisition. In addition to applicability in materials research, the intuitive platform of the software and web server enable them to be used for didactic purposes.
FRETCalc was developed in Python programming language and the main features are to analyze spectral data of the acceptor (molar extinction coefficient), donor (emission), and donor/acceptor blend (refractive index). After processing the data, the main parameters of the FRET process are obtained, such as: effective refractive index, overlap integral, Förster radius, FRET efficiency and FRET rate.
2 Theoretical Background
The excitation energy from a D molecule is transferred to the A by resonance coupling of the donor dipole and acceptor dipole. Thus, in FRET model, the rate of energy transferred, , between donor and acceptor is given by Ref. [4]
| (1) |
where is the exciton lifetime of the donor in the absence of the acceptor, is the Förster radius, and is the donoracceptor distance. The FRET efficiency is traditionally described as
| (2) |
In the case of multiple donors and acceptors, changes for
| (3) |
where is the number of acceptors per donor [10, 27]. This simple equation was derived considering equal distances between all donors and acceptors and assuming that all FRET rates are equal for any DA FRET pair [2]. As the number of acceptors per donor increases, the FRET probability becomes higher.
In nanometer, can be expressed as
| (4) |
where kappasquared is the dipoledipole orientation factor, is the refractive index of the medium, is the quantum yield of the donor fluorescence in the absence of the acceptor, and is the spectral overlap integral between the acceptor absorption spectrum and the areanormalized emission spectrum of the donor. Through Eq. 4 it is possible to conclude that a higher donor quantum yield and larger overlap of donor emission and acceptorexcitation spectra are fundamental keys to achieve greater energy transfer, which will result in a better FRET signal.
The FRET mechanism is based on the coupling of the transition dipoles of the emission donor and the acceptor excitation. Thus, for energy transfer to occur with varying efficiencies, the dipoles must have a favorable orientation relative to each other. The kappasquared can assume values from to , according to the following conditions: 1) , when the electric field produced by the donor’s emission is oriented perpendicularly to the acceptor’s dipole transition. In this configuration there is no energy transfer by the FRET mechanism; 2) , when the D and A dipoles are in parallel position to each other and perpendicular to the bond vector; 3) , when the dipoles are aligned (e.g., their dipole moments are in a parallel position to each other and to the bond vector); 4) when the dipoles have a random orientation, but fixed in time (example, solid state film), the value of is usually assumed; 5) In the case of dipoles having random orientation, but rotating freely in time (example, in solution), the value of is usually assumed. There is an extensive debate in the literature about the general validity of those assumptions. The interested reader is referred to Ref. [28] for further discussions.
In the derivation FRET mechanism, the overlap integral included in transfer rate equation appears to satisfy the dipole energy resonance condition, i.e. ensure energy conservation during transfer [29, 30]. The probability per unit time of the spectroscopic transitions of a molecule depends on the distribution of its electronic energy levels in the ground and excited states. This distribution can be obtained by measuring the emission and/or absorption spectra. Consequently, is proportional to the overlap between the emission spectra of the donor and the absorption spectra of the acceptor.
If the materials’ refractive index is not available, the KramersKronig relation can be used following the procedure described in detail in Ref. [31]. For the procedure, the absorption coefficient of each blend is required. Karuthedath et al. [21] argued that the KramersKronig relation approximates the refractive indexes very well, with a few percentage of deviation in relation to ellipsometry measurements. From the information, the effective refractive index can be computed as a weighted for the amplitude of the overlap between the donor’s emission and the acceptor’s absorption [21].
For calculating , the acceptor absorption spectrum and the emission spectrum of the donor is necessary. Thus, can be calculated in units of mol–1 L cm-1 nm-4 using the formula [21]
| (5) |
where is the molar extinction (attenuation) coefficient of the acceptor and is the wavelength-dependent donor emission spectrum normalized to its area [10]. If the absorption measurements were done in solution, the extinction coefficient spectrum can be obtained using LambertBeer’s law
| (6) |
where is the background-corrected absorbance spectrum, is the concentration of the sample and is the light path length [2]. If the absorption measurements were done in thin films, can be obtained using the films’ absorption coefficients (units cm-1), molecular weight , and the density of materials [21],
| (7) |
For the density, a typical value for polymeric materials is kg/L [32]. The molecular weight of the acceptor in unity of g/mol is a parameter that is generally easy to find or calculate. Therefore, is expressed in units of cm-1 mol-1 L or M-1 cm-1.
3 Software architecture, implementation and requirements
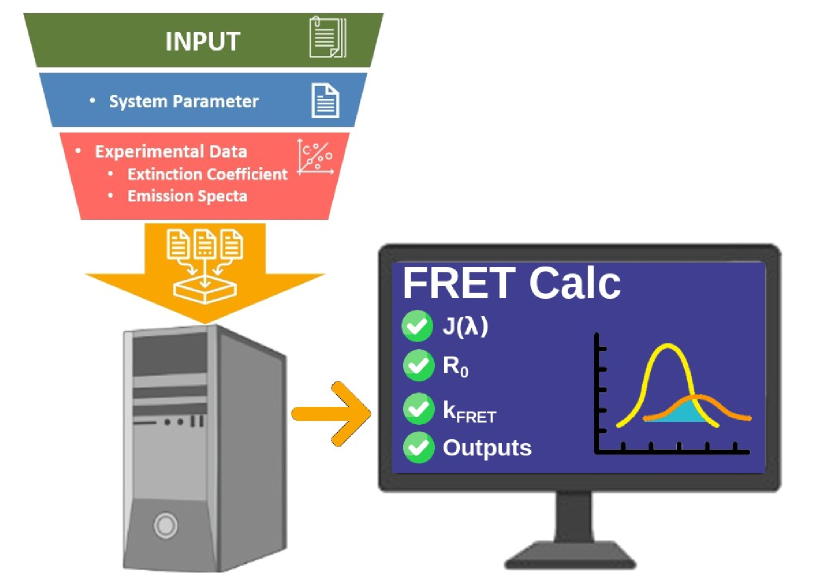
The FRETCalc is a license free code and can be used via a dedicated web server or downloading the binary files. The web server can be accessed in nanocalc.org and it is compatible with the main browsers like Chrome, Firefox, Safari, Opera, Brave, Edge and Internet Explorer. The binary files for Unix, Windows, and macOS operational systems are available for download at FRETCalc repository on GitHub. FRETCalc is composed by four modules that is shown in workflow of Figure 1. In Module 1) system parameters and experimental data for extinction coefficient (acceptor), emission spectra (donor) and refractive index (donoracceptor) are read; 2) calculation of overlap integral (); 3) determination of Förster Radius () and 4) determination of FRET rate (). The program is implemented in Python 3 (v. 3.6) [33] and makes use of four Python libraries, namely Pandas [34], NumPy [35], and SciPy [36] for data manipulation and Matplotlib [37] for data visualization. The software was designed to be very simple to use and take up little disk space, around 85 MB.
4 Program and Application
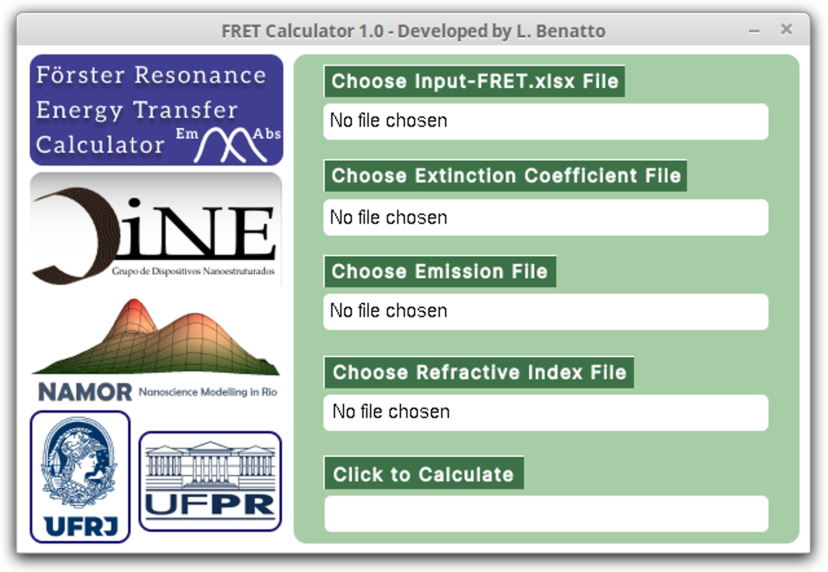
When the program runs (or web server is accessed) a graphical interface is loaded, as shown in Figure 2. It indicates that it is necessary to enter information about the system to be analyzed. The first request is for an excel file with some information about the donor and acceptor materials.
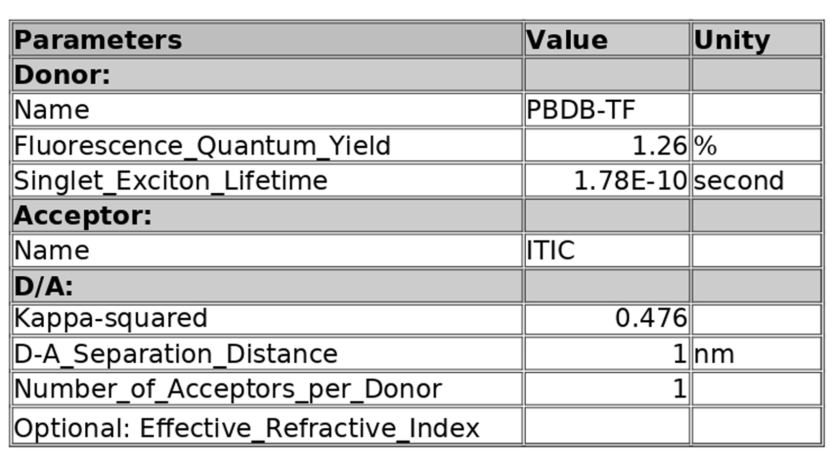
An example of input file is shown in Figure 3 and it is available for the user to fill in at FRETCalc repository. In the example, we use information regarding the PBDBTF [38] (also known as PM6 and PBDBT2F [39]) donor polymer and the ITIC [40] molecular acceptor. For pristine PBDBTF, the exciton lifetime is 178 ps and the quantum yield of fluorescence is 1.26% [21]. The dipoledipole orientation factor was set equal to 0.476, corresponding to a rigid and random relative orientation of the molecular dipoles in a solid-state films (for randomized rotation diffusion of molecules, not being the solid-state, = 2/3) [15, 41]. For the donoracceptor separation distance, the standard value of 1 nm is generally used for organic materials in solidstate. There is also in the input file an option to insert the effective refractive index, , because it is common that the user does not have available the refractive index spectrum of the D/A blend.
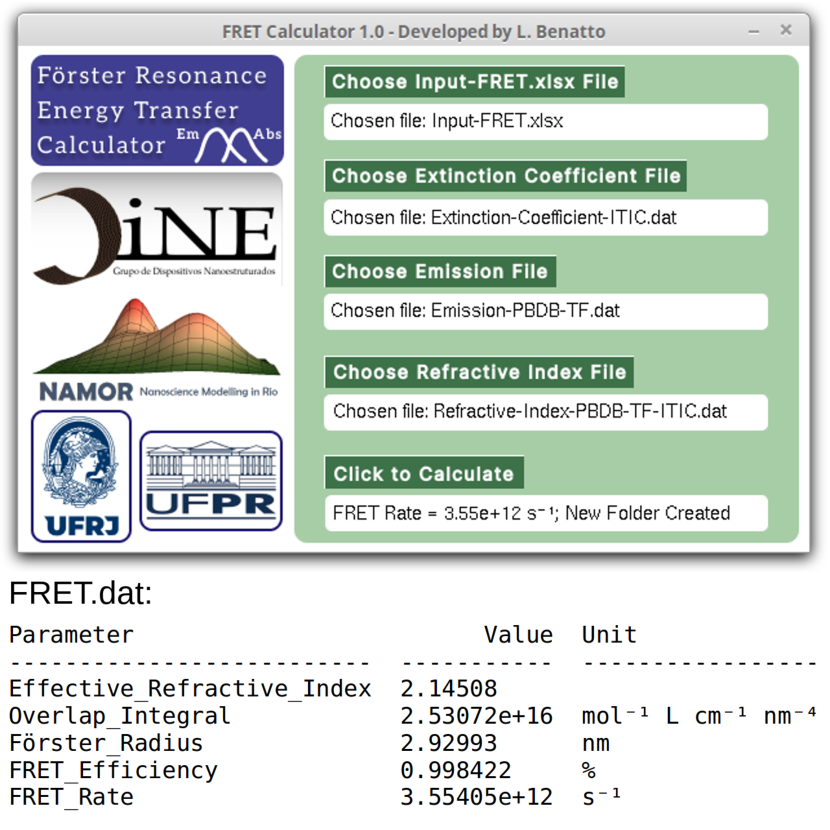
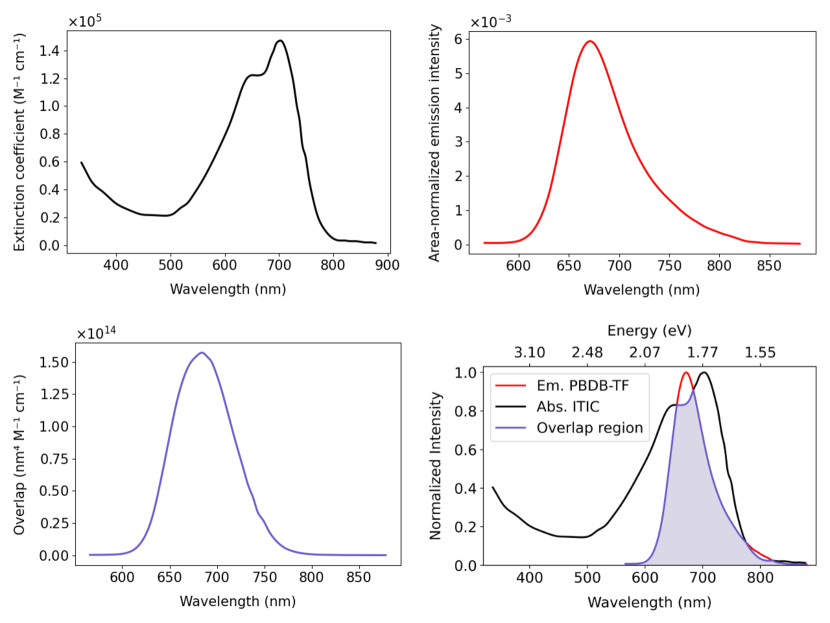
The next files that the program requests are the acceptor’s extinction coefficient spectrum, the donor’s emission (photoluminescence) spectrum and the refractive index of the D/A blend (if available). The donor’s emission does not necessarily have to be normalized, as this procedure is performed by the program. The three input spectra should be provided as a function of wavelength, not energy. It is worth mentioning that the three spectra mentioned above do not necessarily have the same step size for the wavelength, because the program will perform a cubic interpolation of the data and analyze the results using the same interval. The data points also can be non-equidistant. In this way, it is possible to use spectra obtained from different sources. With all the information provided, the program will calculate the effective refractive index, overlap integral, Förster radius, FRET efficiency and the FRET rate. This information is printed in the FRET.dat file, as can be seen in Figure 4. In addition, four graphs will be generated (Figure 5), which are acceptor’s extinction coefficient (top left), area-normalized donor emission spectrum (top right) and overlap function (bottom left). A wellknown graph in the literature that illustrates the overlap region will also be generated, see Figure 5 (bottom right). All output files are saved in a new folder created automatically.
Just to confirm the validity of the method implemented here, the FRET parameters of some DA blends available in the supporting information of Ref. [21] were calculated using the same dataset. The results matched, and no relevant differences were observed.
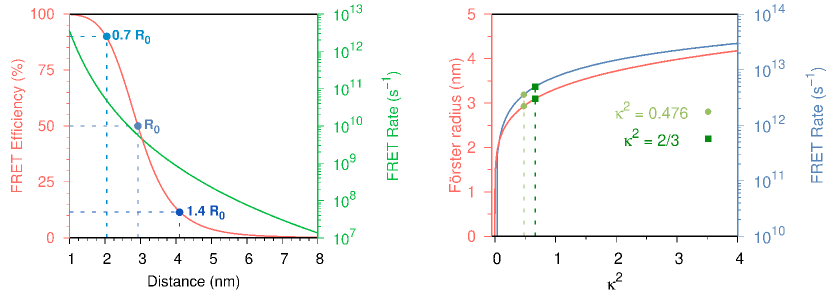
To complement the program demonstration, in the Figure 6 (left) we presented the typical behavior of FRET efficiency with donoracceptor separation distance. Due to dependence on the sixth power of distance, the FRET Efficiency drops off very fast in the range of is 0.71.4, corresponding to 9010% FRET efficiency. In the special case where , FRET efficiency has a value of 50%. Still in the Figure 6 (left), the variation of FRET rate is presented. Note that the dropin rate averages approximately one order of magnitude for each nanometer increased in the studied interval. In short, the donoracceptor separation distance is a important parameter in the energy transfer process.
Remember that kappasquared is a number between 0 and 4 and may have specific values depending on the orientation between the dipole moments of donor and acceptor [28]. As an additional feature, the program also permits to easily access the influence of kappasquared on key FRET quantities. For example, in Figure 6 (right) we presented the dependence of the FRET rate and Förster radius with kappasquared as derived from Eq. 1 and 4, respectively. Note that a semilog plot is used to better visualization of FRET rate. The shows a linear increase with kappasquared whereas has a nonlinear variation with this parameter (see Eq. 4). These figures showed the importance of the orientation factor in the effective energy transfer by the FRET mechanism. The two commonly assumed values for kappasquared are highlighted in the Figure 6 (right).
5 Conclusions
FRET parameters play a fundamental role in the development and optimization of new technological applications. Thus, FRETCalc is a robust tool developed to quickly obtain the effective refractive index, overlap integral, Förster radius, FRET efficiency and FRET rate from experimental data. In this work the theoretical background and applicability of FRETCalc (software and web server) were demonstrated in detail. FRETCalc provides the researcher with parameters of the FRET process through a userfriendly interface, which also makes it suitable for teaching purposes. The FRETCalc software and web server has free license to use and will be updated with new features. Furthermore, FRET-Calc is the first in a series of programs from our group aimed at analyzing experimental data oriented to the field of organic optoelectronics applications.
Declaration of Competing Interest
The authors declare that they have no known competing financial interests or personal relationships that could have appeared to influence the work reported in this paper.
Acknowledgments
The authors acknowledge financial support from CNPq (grant 381113/20213) and LCNano/SisNANO 2.0 (grant 442591/20195). L.B. (grant E26/202.091/2022 process 277806), O.M. (grant E26/200.729/2023 process 285493) and G.C. (grant E26/200.627/2022 and E26/210.391/2022 process 271814) are greatfully for financial support from FAPERJ. The authors also acknowledge the computational support of Núcleo Avançado de Computação de Alto Desempenho (NACAD/COPPE/UFRJ), Sistema Nacional de Processamento de Alto Desempenho (SINAPAD) and Centro Nacional de Processamento de Alto Desempenho em São Paulo (CENAPADSP) and technical support of SMMOLsolutions in functionalyzed materials.
6 Data availability
Data will be made available on request.
References
-
[1]
O. V. Mikhnenko, P. W. M. Blom, T.-Q. Nguyen, Exciton diffusion in organic semiconductors, Energy Environ. Sci. 8 (2015) 1867–1888.
doi:10.1039/C5EE00925A.
URL http://dx.doi.org/10.1039/C5EE00925A -
[2]
N. Hildebrandt, How to apply fret: From experimental design to data analysis (2013) 105–163doi:https://doi.org/10.1002/9783527656028.ch05.
URL https://onlinelibrary.wiley.com/doi/abs/10.1002/9783527656028.ch05 -
[3]
A. Hillisch, M. Lorenz, S. Diekmann, Recent advances in fret: distance determination in protein–dna complexes, Current Opinion in Structural Biology 11 (2) (2001) 201–207.
doi:https://doi.org/10.1016/S0959-440X(00)00190-1.
URL https://www.sciencedirect.com/science/article/pii/S0959440X00001901 -
[4]
B. W. van der Meer, Fret – förster resonance energy transfer (2013) 23–62doi:https://doi.org/10.1002/9783527656028.ch03.
URL https://onlinelibrary.wiley.com/doi/abs/10.1002/9783527656028.ch03 -
[5]
L. Benatto, C. A. M. Moraes, G. Candiotto, K. R. A. Sousa, J. P. A. Souza, L. S. Roman, M. Koehler, Conditions for efficient charge generation preceded by energy transfer process in non-fullerene organic solar cells, J. Mater. Chem. A 9 (2021) 27568–27585.
doi:10.1039/D1TA06698F.
URL http://dx.doi.org/10.1039/D1TA06698F -
[6]
X. Du, Y. Yuan, L. Zhou, H. Lin, C. Zheng, J. Luo, Z. Chen, S. Tao, L.-S. Liao, Delayed fluorescence emitter enables near 17% efficiency ternary organic solar cells with enhanced storage stability and reduced recombination energy loss, Adv. Funct. Mater. 30 (15) (2020) 1909837.
arXiv:https://onlinelibrary.wiley.com/doi/pdf/10.1002/adfm.201909837, doi:https://doi.org/10.1002/adfm.201909837.
URL https://onlinelibrary.wiley.com/doi/abs/10.1002/adfm.201909837 -
[7]
A. Karki, J. Vollbrecht, A. J. Gillett, P. Selter, J. Lee, Z. Peng, N. Schopp, A. L. Dixon, M. Schrock, V. Nádaždy, F. Schauer, H. Ade, B. F. Chmelka, G. C. Bazan, R. H. Friend, T.-Q. Nguyen, Unifying charge generation, recombination, and extraction in low-offset non-fullerene acceptor organic solar cells, Adv. Energy Mater. 10 (29) (2020) 2001203.
doi:https://doi.org/10.1002/aenm.202001203.
URL https://onlinelibrary.wiley.com/doi/abs/10.1002/aenm.202001203 -
[8]
P. Heimel, A. Mondal, F. May, W. Kowalsky, C. Lennartz, D. Andrienko, R. Lovrincic, Unicolored phosphor-sensitized fluorescence for efficient and stable blue oleds, Nat. Commun. 9 (1) (2018) 1–8.
doi:https://doi.org/10.1038/s41467-018-07432-2.
URL https://www.nature.com/articles/s41467-018-07432-2 -
[9]
R. Braveenth, H. Lee, J. D. Park, K. J. Yang, S. J. Hwang, K. R. Naveen, R. Lampande, J. H. Kwon, Achieving narrow fwhm and high eqe over 38% in blue oleds using rigid heteroatom-based deep blue tadf sensitized host, Adv. Funct. Mater. 31 (47) (2021) 2105805.
doi:https://doi.org/10.1002/adfm.202105805.
URL https://onlinelibrary.wiley.com/doi/abs/10.1002/adfm.202105805 -
[10]
K. F. Chou, A. M. Dennis, Förster resonance energy transfer between quantum dot donors and quantum dot acceptors, Sensors 15 (6) (2015) 13288–13325.
doi:10.3390/s150613288.
URL https://www.mdpi.com/1424-8220/15/6/13288 -
[11]
X. Tian, L. C. Murfin, L. Wu, S. E. Lewis, T. D. James, Fluorescent small organic probes for biosensing, Chem. Sci. 12 (2021) 3406–3426.
doi:10.1039/D0SC06928K.
URL http://dx.doi.org/10.1039/D0SC06928K -
[12]
H. A. Alhadrami, A. M. Hassan, R. Chinnappan, H. Al-Hadrami, W. H. Abdulaal, E. I. Azhar, M. Zourob, Peptide substrate screening for the diagnosis of sars-cov-2 using fluorescence resonance energy transfer (fret) assay, Microchimica Acta 188 (4) (2021) 1–10.
doi:10.1007/s00604-021-04766-5.
URL https://doi.org/10.1007/s00604-021-04766-5 -
[13]
A. B. Farias, G. Candiotto, L. Siragusa, L. Goracci, G. Cruciani, E. R. A. Oliveira, B. A. C. Horta, Targeting nsp9 as an anti-sars-cov-2 strategy, New J. Chem. 45 (2021) 522–525.
doi:10.1039/D0NJ04909C.
URL http://dx.doi.org/10.1039/D0NJ04909C -
[14]
S. Sharma, K. S. Ghosh, Recent advances (2017–20) inthe detection of copper ion by using fluorescence sensors working through transfer of photo-induced electron (pet), excited-state intramolecular proton (esipt) and förster resonance energy (fret), Spectrochimica Acta Part A: Molecular and Biomolecular Spectroscopy 254 (2021) 119610.
doi:https://doi.org/10.1016/j.saa.2021.119610.
URL https://www.sciencedirect.com/science/article/pii/S1386142521001864 -
[15]
Y. Firdaus, V. M. Le Corre, S. Karuthedath, W. Liu, A. Markina, W. Huang, S. Chattopadhyay, M. M. Nahid, M. I. Nugraha, Y. Lin, A. Seitkhan, A. Basu, W. Zhang, I. McCulloch, H. Ade, J. Labram, F. Laquai, D. Andrienko, L. J. A. Koster, T. D. Anthopoulos, Long-range exciton diffusion in molecular non-fullerene acceptors, Nat. Commun. 11 (1) (2020) 5220.
doi:10.1038/s41467-020-19029-9.
URL https://europepmc.org/articles/PMC7562871 -
[16]
G. Candiotto, A. Torres, K. T. Mazon, L. G. C. Rego, Charge generation in organic solar cells: Interplay of quantum dynamics, decoherence, and recombination, J. Phys. Chem. C 121 (42) (2017) 23276–23286.
doi:10.1021/acs.jpcc.7b07165.
URL https://doi.org/10.1021/acs.jpcc.7b07165 -
[17]
L. Xu, Y. Ji, W. Wang, L. Wang, K. Gao, Aggregation effect of acceptor molecules on the energy and charge transfer dynamics at an organic donor/acceptor interface, Org. Electron. 100 (2022) 106396.
doi:https://doi.org/10.1016/j.orgel.2021.106396.
URL https://www.sciencedirect.com/science/article/pii/S156611992100330X -
[18]
L. Xu, Y. Ji, X. Shi, L. Wang, K. Gao, Energy and charge transfer dynamics at an organic donor/acceptor interface, Org. Electron. 85 (2020) 105886.
doi:https://doi.org/10.1016/j.orgel.2020.105886.
URL https://www.sciencedirect.com/science/article/pii/S156611992030272X -
[19]
X. Zhang, Y. Hu, X. Yang, Y. Tang, S. Han, A. Kang, H. Deng, Y. Chi, D. Zhu, Y. Lu, Förster resonance energy transfer (fret)-based biosensors for biological applications, Biosens. Bioelectron. 138 (2019) 111314.
doi:https://doi.org/10.1016/j.bios.2019.05.019.
URL https://www.sciencedirect.com/science/article/pii/S0956566319303793 -
[20]
N. Melnychuk, A. S. Klymchenko, Dna-functionalized dye-loaded polymeric nanoparticles: Ultrabright fret platform for amplified detection of nucleic acids, J. Am. Chem. Soc. 140 (34) (2018) 10856–10865, pMID: 30067022.
doi:10.1021/jacs.8b05840.
URL https://doi.org/10.1021/jacs.8b05840 -
[21]
S. Karuthedath, J. Gorenflot, Y. Firdaus, N. Chaturvedi, C. S. P. De Castro, G. T. Harrison, J. I. Khan, A. Markina, A. H. Balawi, T. A. D. Peña, W. Liu, R.-Z. Liang, A. Sharma, S. H. K. Paleti, W. Zhang, Y. Lin, E. Alarousu, S. Lopatin, D. H. Anjum, P. M. Beaujuge, S. De Wolf, I. McCulloch, T. D. Anthopoulos, D. Baran, D. Andrienko, F. Laquai, Intrinsic efficiency limits in low-bandgap non-fullerene acceptor organic solar cells, Nat. Mater. 20 (3) (2021) 378–—384.
doi:10.1038/s41563-020-00835-x.
URL https://doi.org/10.1038/s41563-020-00835-x -
[22]
G. Candiotto, R. Giro, B. A. C. Horta, F. P. Rosselli, M. de Cicco, C. A. Achete, M. Cremona, R. B. Capaz, Emission redshift in dcm2-doped caused by nonlinear stark shifts and förster-mediated exciton diffusion, Phys. Rev. B 102 (2020) 235401.
doi:10.1103/PhysRevB.102.235401.
URL https://link.aps.org/doi/10.1103/PhysRevB.102.235401 -
[23]
D. Kosenkov, Pyfrec: Software for förster electronic coupling evaluation in molecular fragments, J. Comput. Chem. 37 (19) (2016) 1847–1854.
doi:https://doi.org/10.1002/jcc.24401.
URL https://onlinelibrary.wiley.com/doi/abs/10.1002/jcc.24401 -
[24]
D. Kosenkov, Pyfrec 2.0: Software for excitation energy transfer modeling, J. Comput. Chem. 43 (19) (2022) 1320–1328.
doi:https://doi.org/10.1002/jcc.26930.
URL https://onlinelibrary.wiley.com/doi/abs/10.1002/jcc.26930 -
[25]
A. Ingargiola, E. Lerner, S. Chung, S. Weiss, X. Michalet, Fretbursts: an open source toolkit for analysis of freely-diffusing single-molecule fret, PloS one 11 (8) (2016) e0160716.
doi:https://doi.org/10.1371/journal.pone.0160716.
URL https://journals.plos.org/plosone/article?id=10.1371/journal.pone.0160716 -
[26]
S. Preus, K. Kilså, F.-A. Miannay, B. Albinsson, L. M. Wilhelmsson, Fretmatrix: a general methodology for the simulation and analysis of fret in nucleic acids, Nucleic Acids Res. 41 (1) (2012) e18–e18.
doi:10.1093/nar/gks856.
URL https://doi.org/10.1093/nar/gks856 -
[27]
A. R. Clapp, I. L. Medintz, J. M. Mauro, B. R. Fisher, M. G. Bawendi, H. Mattoussi, Fluorescence resonance energy transfer between quantum dot donors and dye-labeled protein acceptors, J. Am. Chem. Soc. 126 (1) (2004) 301–310, pMID: 14709096.
doi:10.1021/ja037088b.
URL https://doi.org/10.1021/ja037088b -
[28]
B. W. van der Meer, Kappaphobia is the elephant in the fret room, Methods Appl. Fluoresc. 8 (3) (2020) 030401.
doi:10.1088/2050-6120/ab8f87.
URL https://doi.org/10.1088/2050-6120/ab8f87 -
[29]
T. Förster, Zwischenmolekulare energiewanderung und fluoreszenz, Ann. Phys. 437 (1-2) (1948) 55–75.
doi:https://doi.org/10.1002/andp.19484370105.
URL https://onlinelibrary.wiley.com/doi/abs/10.1002/andp.19484370105 -
[30]
B. Valeur, M. N. Berberan-Santos, Molecular fluorescence: principles and applications, John Wiley & Sons, 2012.
doi:10.1002/9783527650002.
URL https://onlinelibrary.wiley.com/doi/book/10.1002/9783527650002 -
[31]
A. H. Balawi, Z. Kan, J. Gorenflot, P. Guarracino, N. Chaturvedi, A. Privitera, S. Liu, Y. Gao, L. Franco, P. Beaujuge, F. Laquai, Quantification of photophysical processes in all-polymer bulk heterojunction solar cells, Solar RRL 4 (6) (2020) 2000181.
doi:https://doi.org/10.1002/solr.202000181.
URL https://onlinelibrary.wiley.com/doi/abs/10.1002/solr.202000181 -
[32]
Density of Plastics Material: Technical Properties Table., (Accessed 22th February, 2023).
URL https://omnexus.specialchem.com/Polymer-Properties/Properties/Density#values -
[33]
G. Van Rossum, F. L. Drake, Python 3 Reference Manual, CreateSpace, Scotts Valley, CA, 2009.
doi:10.5555/1593511.
URL https://dl.acm.org/doi/book/10.5555/1593511 -
[34]
W. McKinney, Data Structures for statistical computing in python, in: Proceedings of the 9th Python in Science Conference, Vol. 445, 2010, pp. 56–61.
doi:10.25080/Majora-92bf1922-00a.
URL https://conference.scipy.org/proceedings/scipy2010/mckinney.html -
[35]
C. R. Harris, K. J. Millman, S. J. Van Der Walt, R. Gommers, P. Virtanen, D. Cournapeau, E. Wieser, J. Taylor, S. Berg, N. J. Smith, et al., Array programming with numpy, Nature 585 (7825) (2020) 357–362.
doi:doi.org/10.1038/s41586-020-2649-2.
URL https://www.nature.com/articles/s41586-020-2649-2 -
[36]
P. Virtanen, R. Gommers, T. E. Oliphant, M. Haberland, T. Reddy, D. Cournapeau, E. Burovski, P. Peterson, W. Weckesser, J. Bright, et al., Scipy 1.0: fundamental algorithms for scientific computing in python, Nat. Methods 17 (3) (2020) 261–272.
doi:doi.org/10.1038/s41592-019-0686-2.
URL https://www.nature.com/articles/s41592-019-0686-2 -
[37]
J. D. Hunter, Matplotlib: A 2d graphics environment, Comput. Sci. Eng. 9 (03) (2007) 90–95.
doi:doi.org/10.1109/MCSE.2007.55.
URL https://www.computer.org/csdl/magazine/cs/2007/03/c3090/13rRUwbJD0A -
[38]
M. Zhang, X. Guo, W. Ma, H. Ade, J. Hou, A largebandgap conjugated polymer for versatile photovoltaic applications with high performance, Adv. Mater. 27 (31) (2015) 4655–4660.
doi:https://doi.org/10.1002/adma.201502110.
URL https://onlinelibrary.wiley.com/doi/abs/10.1002/adma.201502110 -
[39]
Z. Zheng, H. Yao, L. Ye, Y. Xu, S. Zhang, J. Hou, Pbdbt and its derivatives: A family of polymer donors enables over 17% efficiency in organic photovoltaics, Mater. Today 35 (2020) 115–130.
doi:https://doi.org/10.1016/j.mattod.2019.10.023.
URL https://www.sciencedirect.com/science/article/pii/S1369702119308363 -
[40]
W. Zhao, D. Qian, S. Zhang, S. Li, O. Inganäs, F. Gao, J. Hou, Fullerene-free polymer solar cells with over 11% efficiency and excellent thermal stability, Adv. Mater. 28 (23) (2016) 4734–4739.
doi:https://doi.org/10.1002/adma.201600281.
URL https://onlinelibrary.wiley.com/doi/abs/10.1002/adma.201600281 -
[41]
J. D. A. Lin, O. V. Mikhnenko, J. Chen, Z. Masri, A. Ruseckas, A. Mikhailovsky, R. P. Raab, J. Liu, P. W. M. Blom, M. A. Loi, C. J. GarcíaCervera, I. D. W. Samuel, T.-Q. Nguyen, Systematic study of exciton diffusion length in organic semiconductors by six experimental methods, Mater. Horiz. 1 (2014) 280–285.
doi:10.1039/C3MH00089C.
URL http://dx.doi.org/10.1039/C3MH00089C -
[42]
C. Yang, J. Zhang, N. Liang, H. Yao, Z. Wei, C. He, X. Yuan, J. Hou, Effects of energy-level offset between a donor and acceptor on the photovoltaic performance of non-fullerene organic solar cells, J. Mater. Chem. A 7 (2019) 18889–18897.
doi:10.1039/C9TA04789A.
URL http://dx.doi.org/10.1039/C9TA04789A