The Belle II Collaboration
Evidence for Decays
Abstract
We search for the rare decay in a sample of electron-positron collisions at the resonance collected with the Belle II detector at the SuperKEKB collider. We use the inclusive properties of the accompanying meson in events to suppress background from other decays of the signal candidate and light-quark pair production. We validate the measurement with an auxiliary analysis based on a conventional hadronic reconstruction of the accompanying meson. For background suppression, we exploit distinct signal features using machine learning methods tuned with simulated data. The signal-reconstruction efficiency and background suppression are validated through various control channels. The branching fraction is extracted in a maximum likelihood fit. Our inclusive and hadronic analyses yield consistent results for the branching fraction of and , respectively. Combining the results, we determine the branching fraction of the decay to be , providing the first evidence for this decay at standard deviations. The combined result is standard deviations above the standard model expectation.
I Introduction
Flavor-changing neutral-current transitions, such as and , where represents a charged lepton, are suppressed in the standard model (SM) of particle physics, because of the Glashow–Iliopoulos–Maiani mechanism [1]. These transitions can only occur at higher orders in SM perturbation theory through weak-interaction amplitudes that involve the exchange of at least two gauge bosons. Rate predictions for have significant theoretical uncertainties from the breakdown of factorization due to photon exchange [2]. This process does not contribute to , so the corresponding rate predictions are relatively precise.
The transition provides the leading amplitudes for the decay in the SM, as shown in Fig. 1. The SM branching fraction of the decay [3] is predicted in Ref. [4] to be
| (1) |
including a contribution of from the long-distance double-charged-current decay.
 |
 |
| a) | b) |
 |
| c) |
The decay rate can be significantly modified in models that predict non-SM particles, such as leptoquarks [5]. In addition, the meson could decay into a kaon and an undetectable particle, such as an axion [6] or a dark-sector mediator [7].
In all analyses reported to date [8, 9, 10, 11, 12, 13], no evidence for a signal has been found, and the current experimental upper limit on the branching fraction is at the 90% confidence level [14]. The study of the decay is experimentally challenging as the final state contains two neutrinos that are not reconstructed. This prevents the full reconstruction of the kinematic properties of the decay, hindering the differentiation of signal distributions from background.
In this study the signal meson is produced in the process. The at-threshold production of pairs helps to mitigate the limitations due to the unconstrained kinematics, as the partner meson can be used to infer the presence and properties of the signal . An inclusive tagging analysis method (ITA) exploiting inclusive properties from the -meson pair-produced along with the signal , is applied to the entire Belle II data set currently available, superseding the results of Ref. [13], where this method was first used. In addition, an auxiliary analysis using the well-established hadronic tagging analysis method (HTA) [9, 10] is presented; this involves explicit reconstruction of the partner meson through a hadronic decay. The HTA method offers an important consistency check of the newer inclusive tagging method and helps validate the ITA results. In addition, the small size of the overlap between the HTA and ITA samples allows for a straightforward combination of the results, achieving a 10% increase in precision over the ITA result alone.
The ITA commences with the reconstruction of charged and neutral particles, followed by the selection of a single signal kaon candidate in events with one or more kaons. Subsequently, relevant quantities are computed using the kaon candidate, along with the remaining particles in the event, to discriminate between signal and background processes. These quantities are used in boosted decision trees (BDTs) [15, 16] that are optimized and trained using simulated data. A signal region is then defined, and a binned profile-likelihood sample-composition fit is carried out on data. This fit uses simulated samples to provide predictions to determine the branching fraction of the decay along with the rates of background processes. The fit incorporates systematic uncertainties arising from detector and physics-modeling imperfections as nuisance parameters. To validate the modeling of signal and background processes in simulation, several control channels are employed. The method is further validated through a closure-test measurement of the branching fraction of the decay.
The HTA follows a similar method, but begins with the reconstruction of the partner meson, and then proceeds to the definition of the signal candidate.
Except for the tagging method, the two analyses are similar in terms of particle reconstruction, event selection, usage of control samples, fit strategy, and treatment of common systematic uncertainties. In what follows, common approaches and details of the ITA are given first, followed by the HTA-specific details.
The paper is organized as follows. The data and simulated samples are presented in Sec. II followed by the Belle II detector description in Sec. III. The initial event selection and reconstruction of the decays are described in Sec. IV. Corrections introduced to the simulated samples are discussed in Sec. V. Section VI details background suppression and final event-selection using machine learning methods. Section VII defines the signal region used to extract the decay branching fraction. The following two sections, Sec. VIII and Sec. IX, are dedicated to the validation of the modeling of the signal-selection efficiency and background contributions, respectively. Section X documents the statistical approach used to extract the signal and Sec. XI describes the systematic uncertainties. The results are discussed in Sec. XII, and consistency checks used for validation are presented in Sec. XIII. The combination of the ITA and HTA results is discussed in Sec. XIV. A discussion of the results is presented in Sec. XV. Section XVI concludes the paper.
II Data and Simulated Samples
This search uses data from collisions produced between the years 2019 and 2022 by the SuperKEKB collider [17]. The on-resonance data, with an integrated luminosity of 362 [18], are recorded at a center-of-mass (c.m.) energy of , which corresponds to the mass of resonance, and contain pairs [19]. An additional 42 off-resonance sample, collected at an energy 60 below the mass of resonance, is used to study background from continuum: events and events, where indicates an , , , or quark.
Simulated samples are exploited for training multivariate classifiers, estimating signal-selection efficiencies, identifying backgrounds, and defining components of the fits to data. Various event generators are used. The production and decays of charged and neutral mesons use PYTHIA8 [20] and EVTGEN [21]. The KKMC generator [22] is used to generate the pairs followed by PYTHIA8 to simulate their hadronization and EVTGEN to model the decays of the resulting hadrons. Similarly, KKMC and TAUOLA [23] are employed to simulate production of events and decays of leptons, respectively. Final-state QED radiation is simulated using PHOTOS [24]. For all samples, the Belle II analysis software [25], interfaced with GEANT4 [26], is used to simulate the detector response and perform event reconstruction.
The simulated signal decays are weighted according to the SM form-factor calculations from Ref. [4]. Similar weighting is applied to background decays (in the following, mesons are indicated with ). The long-distance decays are simulated separately, normalized using the branching fraction from Ref. [4], and added to the background. The simulation of several other background processes receives additional corrections. Nonresonant three-body decays are simulated assuming the threshold-enhancement effect present in the isospin-partner decay [27]. Three-body decays are modeled using Dalitz spectra of decays measured in Ref. [28] and assuming equal probabilities for the and decays. The decay is modeled as a sum of a resonant contribution and nonresonant p-wave contribution with parameters taken from the isospin-related decay , as measured in Ref. [28]. The PHOKHARA event generator [29] is used to simulate events, which are used for additional studies.
The simulated continuum samples are normalized based on the known cross sections and integrated luminosity. Both the simulated background and signal samples are scaled using , where the number of pairs is calculated as , and the number of pairs is calculated as , with and [30].
III Detector
A comprehensive description of the Belle II detector is given in Ref. [31]. The detector consists of several subdetectors arranged in a cylindrical structure around the beam pipe. The innermost subsystem consists of a silicon pixel detector surrounded by a double-sided silicon strip detector, referred to as the silicon vertex detector, and a central drift chamber (CDC). The second layer of the pixel detector covers only one-sixth of the azimuthal angle for the data used in this work. The silicon detectors allow for precise determination of particle-decay vertices while the CDC determines charged-particle momenta and electric charge. A time-of-propagation counter and an aerogel ring-imaging Cherenkov counter cover the barrel and forward endcap regions of the detector, respectively: these subdetectors are important for charged-particle identification (PID). An electromagnetic calorimeter (ECL), used to reconstruct photons and distinguish electrons from other charged particles, occupies the remaining volume inside a superconducting solenoid. This provides a uniform magnetic field, parallel to the detector’s principal axis. A dedicated system to identify mesons and muons is installed in the flux return of the solenoid. The axis of the laboratory frame is collinear with the symmetry axis of the solenoid and almost aligned with the electron-beam direction. The polar angle, as well as the longitudinal and transverse directions, are defined with respect to the axis.
IV Event Selection
The online-event-selection systems (triggers) for this analysis are based either on the number of charged-particle trajectories (tracks) in the CDC or on the energy deposits in the ECL, and have an efficiency close to for signal decays. In the offline analysis, the reconstruction of charged particles follows the algorithm outlined in Ref. [32]. For the ITA, to ensure that efficiency is high and well-measured, and to suppress beam-related background, charged particles are required to have a transverse momentum and to be within the CDC acceptance (). All charged particles except those used to form candidates are required to have minimum longitudinal and transverse distances (impact parameters) from the average interaction point of and , respectively. The candidates are formed by combining pairs of oppositely charged particles in a vertex fit. These candidates are required to have a dipion reconstructed mass between and , vertex -value greater than 0.001, flight time greater than 0.007 ns (corresponding to about 2 mm displacement from the primary vertex), and cosine of the angle between momentum and flight direction greater than 0.98. Photons are identified as energy deposits exceeding detected in the ECL regions within the CDC acceptance, and not matched to tracks. The minimum energy requirement suppresses the beam-related background and energy deposits from charged hadrons that fail the matching to tracks. Each of the charged particles and photons is required to have an energy of less than 5.5 to reject misreconstructed particles and cosmic muons. The kaon candidates are selected using particle-identification likelihoods based on information coming primarily from the PID detectors, complemented with information from the silicon strip detector, CDC, and the and muon identification system. To ensure reliable PID, at least 20 deposited-charge measurements are required in the CDC. The chosen PID requirement has 68% efficiency for signal kaons, while the probability to identify a pion as a kaon is 1.2%. Candidates are also required to have at least one deposit in the pixel detector: this improves the impact parameter resolution, and helps to reject background events.
Events are required to contain no more than ten tracks to suppress background (e.g., high-multiplicity continuum production) with only a 0.5% loss of signal-selection efficiency. Low-track-multiplicity background events, such as those originating from two-photon-collision processes, are suppressed by demanding at least four tracks in the event. This reduces signal-reconstruction efficiency by . The total energy from all reconstructed particles in the event must exceed 4. The polar angle of the missing momentum, computed in the c.m. frame as the complement to the total momentum of all reconstructed particles, must be between and . This range is chosen to remove low-multiplicity events and to ensure that the missing momentum points toward the active detector volume.
To select the signal kaon in an event, the mass squared of the neutrino pair is computed as
| (2) |
assuming the signal meson to be at rest in the c.m. frame. Here is the known mass of mesons and is the reconstructed energy of the kaon in the c.m. system. Uncertainties in the kinematic properties of the colliding beams have negligible impact on the reconstruction. The candidate having the lowest is retained for further analysis. Studies on simulated signal events show that prior to applying the requirement the fraction of events with multiple candidates is 39%. The average number of candidates in such events is 2.2. The lowest- candidate is the signal kaon in 96% of cases. Checks using a random selection of the signal candidate, if several candidates are found, indicate no bias in the procedure. The remaining charged particles are fit to a common vertex and are attributed, together with the photons and candidates, to the rest of the event (ROE). For the signal events, these charged particles and candidates correspond to the decay products of the second meson.
The HTA commences with the full reconstruction of a meson (), decaying into one of 36 hadronic decays, through the Full Event Interpretation (FEI) [33]. The FEI is an algorithm based on a hierarchical multivariate approach in which final-state particles are constructed using the tracks and energy deposits in the ECL, and combined into intermediate particles until the final candidates are formed. The algorithm calculates, for each decay chain, the probability of it correctly describing the true process using gradient-boosted decision trees. Only mesons with a probability exceeding 0.001 are retained. In addition, the beam-constrained mass and are required, where and are the energy and the magnitude of the three-momentum of the in the c.m. frame, respectively. Signal candidates peak at the known mass and zero in and , respectively, while continuum events are distributed more uniformly. The FEI algorithm imposes conditions on the charged particles and energy deposits in the ECL similar to those used by the ITA. The algorithm requires at least three tracks and three energy deposits in the ECL, including those that are associated with the tracks. Furthermore, events with more than 12 tracks having cm and cm are rejected. Such events would have greater multiplicity than the maximum of the reconstructed final states plus the signal-kaon track.
The signal-kaon candidate track is required to have at least 20 measurements in the CDC, and impact parameters cm and cm, and is required to satisfy PID criteria for a kaon. The and signal kaon are required to have opposite charges. The same restrictions on missing momentum are applied as in the ITA. Moreover, the number of tracks with cm, cm and with at least 20 measurements in the CDC, which are neither associated with the nor with the signal kaon, is required to be zero.
The remaining reconstructed objects in the HTA include tracks, which neither meet the CDC nor impact parameter requirements (extra tracks), and energy deposits in the ECL, which are neither associated with the nor the signal kaon (extra photon candidates). Only the energy deposits in the ECL that exceed a -dependent energy threshold ranging from to , have a distance from the nearest track extrapolation larger than 50 , and are reconstructed within the CDC acceptance are considered. The sum of the energies of these deposits, denoted as , and the multiplicity of the extra tracks, denoted as , are utilized in the subsequent steps of the analysis. Events are rejected if a -meson, -meson, or -baryon candidate is reconstructed from the extra tracks and photons.
V Corrections to simulated data
The simulation of the detector response is tested using control samples from data, and correction factors are introduced with corresponding systematic uncertainties. Correction factors are applied as weights to the selected events when appropriate, particularly when the corrections impact the efficiency of the signal-kaon selection. In other cases, when the corrections affect the kinematic properties of the particles, these corrections are applied prior to the event selection and computation of related variables. The correction procedure is carried out for the nominal analysis as well as when computing systematic variations.
V.1 Reconstruction of charged particles
The efficiency for reconstructing charged particles is studied using events, where one lepton decays into a single charged particle while the other decays into three charged particles [34]. Simulation agrees well with the data. A systematic uncertainty of is introduced for each charged particle to account for uncertainties in the detection efficiency and in the knowledge of the detector geometrical acceptance.
The reconstruction of kinematic properties of charged particles is validated by comparing the measured pole masses of known resonances with simulation. The simulation reproduces the data with an accuracy better than , and any residual differences have a negligible impact on the analysis.
V.2 Identification of charged particles
About 10% of background arises from incorrect particle identification of the signal-kaon candidate. The main contribution is from misidentified pions, while misidentified muons, electrons, and protons have a smaller impact. The efficiency of kaon identification and the misidentification (“fake”) rate for pions misidentified as kaons are determined using decays reconstructed in continuum data and simulation. The small mass difference between and mesons enables the isolation of a pure signal. The charge of the low-momentum pion from the flavor-conserving decay allows the precise identification of the products of the Cabibbo-favored decay, providing abundant and low-background and samples.
Correction factors and their uncertainties are applied to the simulation as functions of the particle’s charge, momentum, and polar angle. The correction factors for the pion-to-kaon fake rates are close to a factor of two, indicating that the simulation underestimates the rate at which pions are misidentified as kaons. The uncertainties associated with these corrections, which are around for efficiencies and for fake rates, are treated as systematic uncertainties. Correction factors for the lepton-to-kaon fake rates are also applied, although their impact is negligible.
The correction factors for kaon identification efficiency and the pion-to-kaon fake rate are further validated for the signal region of the ITA, using the decays, where stands for or , following the procedure outlined below.
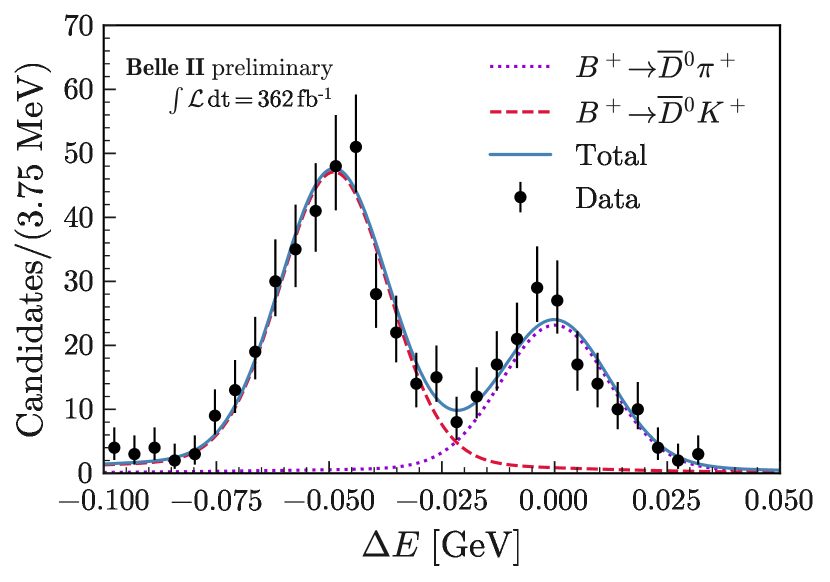
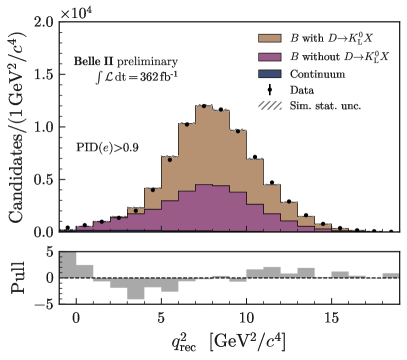
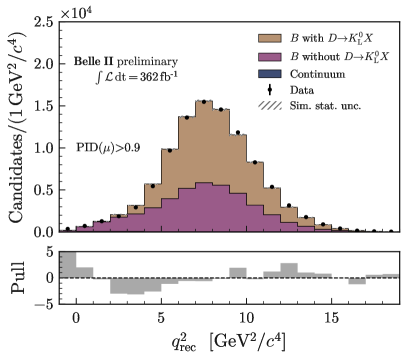
The decays are reconstructed using the pion mass hypothesis and the nominal kaon identification for the candidate. For decays, the distribution of the variable peaks at zero. Since the is produced almost at rest in the c.m. frame, the kaon momentum in the two-body decay is expected to be equal to with a small spread. Combined with the pion mass, this leads to an energy deficit compared to the correct kaon hypothesis, resulting in a shift in of . This characteristic of the distribution is used to distinguish between and decays without relying on PID information. The kaon and pion candidates from the decay are differentiated by kaon identification: the particle with the higher value is assumed to be a kaon. Only candidates with an invariant mass within three standard deviations of the known mass [14] are kept. In addition, the selections and are applied. If several candidates pass the selection, a random one is chosen.
For the selected decays, the information on the variable is kept while the tracks from the decay are removed and each event is reconstructed again as a event. The same procedure is repeated for both data and simulation. The selected events show a distribution peaking between and corresponding to the mass squared. The events have a signal-like signature and for this range are reconstructed with high efficiency. The distribution of the variable for the signal region of the ITA is shown in Fig. 2. Two prominent peaks corresponding to and are observed. The yields of the two components are extracted in a fit using Gaussian shapes. The double ratio of the to decay rates in data to simulation is , showing consistency with unity within the statistical uncertainty.
V.3 Reconstruction of neutral particles
The photon detection efficiency at Belle II, and the calibration of the photon energy reconstruction, are based on studies of events. The efficiency is the fraction of events where a photon is reconstructed with momentum consistent with the expectation from recoil against the system [35]. The resulting uncertainty is negligible for this analysis.
The uncertainty on the photon energy is 0.5%. The effect on signal yield in the fit is estimated by applying this uncertainty to energy deposits from photon candidates matched to simulated photons.
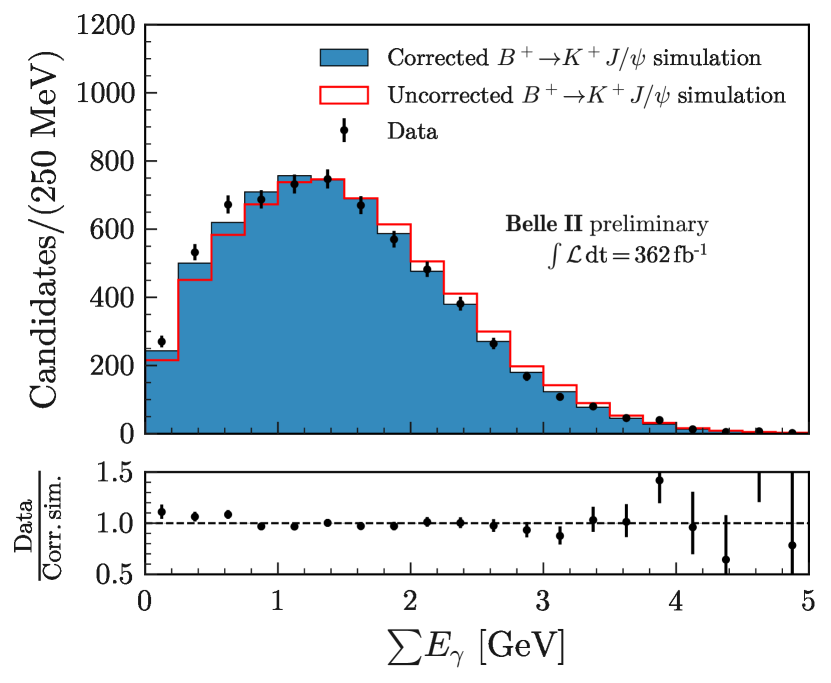
The simulated sample shows that photon candidates have contamination from beam-related background, energy deposits from charged hadrons that are reconstructed away from the particle trajectory, and from neutral hadrons. These deposits are not matched to simulated photons (“unmatched”). The bias in the reconstructed energy for these sources (“hadronic energy correction”) is studied using the summed energy of the photon candidates in the ROE (“summed neutral energy”, ) of events containing a decay (details on decay reconstruction can be found in Sec. VIII). In the simulation, the energy of reconstructed photon candidates is treated differently based on their matching to the generated photons. The energy for matched candidates is not corrected. For unmatched candidates, a multiplicative hadronic energy correction is inferred empirically using data. In the simulation the correction is varied within a range around unity. For the ITA, an improvement is found when the hadronic energy is varied down by . The corresponding correction with uncertainty (relative) is introduced.
Figure 3 shows the comparison of distributions of summed neutral energy for events in which a decay is reconstructed, for collision data and for the corresponding uncorrected and corrected simulation. The correction corresponds to a variation of the hadronic energy by . Better data-simulation agreement is achieved by the corrected simulation.
The correction is validated using various control samples dominated by background, such as off-resonance data and data at early selection steps. An improvement is observed in the description of several variables related to neutral-particle energy deposits, such as the number of photon candidates. The latter is sensitive to the hadronic energy since the hadronic-energy deposits peak at low energy and are affected strongly by the minimal energy requirement of .
For the HTA, a different extra-photon selection is adopted. In the HTA sample, the energy spectrum of extra photon candidates exhibits good data-simulation agreement, but observed discrepancies in the multiplicity () propagate to the distribution. To correct this, a control sample is used where the signal kaon and the have the same charge. A weight is computed for the distribution as follows:
| (3) |
where and correspond to the event yields with candidates in data and simulation, respectively. Subsequently, simulated events where the signal kaon and have opposite charges, are weighted based on their associated value.
This method is validated using an independent pion-enriched control sample where the signal track is identified as a pion instead of a kaon. The pion-enriched sample is further divided into two samples based on whether the signal candidate and have the same or opposite charge. Corrections are derived from the sample where signal and have same charge and are then applied to the opposite-charge sample. The effect of the correction in the pion-enriched sample at the event-selection stage is shown in Fig. 4.

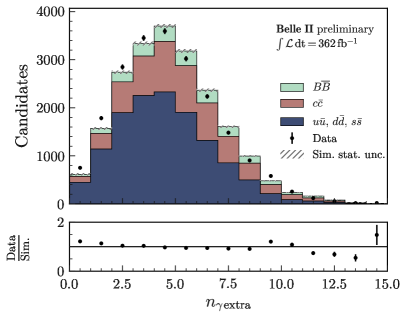
Although an improvement is observed after applying the correction, residual data-simulation discrepancies remain. To account for these, a systematic uncertainty is assigned corresponding to of the residual difference in the data-to-simulation ratio observed in the opposite-charge pion-enriched control sample after the correction.
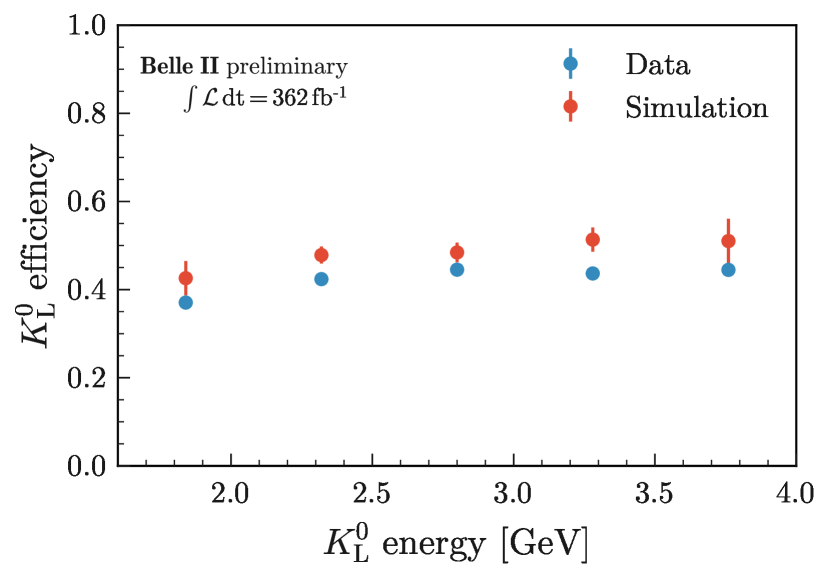
Given the prominence of background contributions containing mesons, a dedicated study is performed to check their modeling. This study focuses on the ECL response only, as the analysis does not use candidates from the dedicated identification system to avoid additional systematic uncertainties due to their modeling. Radiative-return production is used for this purpose for with energy above 1.6 . The events are selected by demanding a photon candidate with energy in the c.m. frame, a well-reconstructed candidate, and no extra tracks. The four-momentum is inferred based on the photon and four-momenta, where the photon energy is computed based on the two-body process. The typical momentum resolution of an inferred is better than 1%. An energy deposit in the ECL reconstructed at a radius is matched to the trajectory of extrapolated to the same if the distance between them is less than 15. The efficiency for finding a matched energy-deposit is studied both in data and simulation, and is tested separately in the ITA and HTA. The ITA selection for the ECL deposits is looser than the HTA selection, therefore a higher efficiency is found. Figure 5 shows the ITA efficiency as a function of momentum; the simulation overestimates the efficiency by 17%. A correction is applied in the ITA sample to account for the overestimated efficiency. A relative uncertainty is assigned to the correction to account for the systematic uncertainties in the estimation of the efficiency.
While the radiative-return production of mesons does not encompass with energies below , approximately half of the mesons in the main background processes populate this lower-energy range. As a consistency check, a inefficiency is incorporated in the ITA for this kinematic region in the simulation. Specifically, all energy deposits in the ECL that fall within a cm radius of the extrapolated trajectory are removed for simulated with energies smaller than . The impact of this additional requirement on the analysis is found to be covered by the hadronic-energy systematic uncertainty, discussed above.
The reconstruction efficiency is smaller for the HTA. Since the effect on is already addressed by the correction and systematic uncertainty derived from the extra-photon-multiplicity spectrum, no direct correction to the efficiency is applied. Instead, a systematic uncertainty is assigned, wherein the yields of final states with a are varied by 17%.
VI Background Suppression
Simulated signal and background events are used to train BDTs that suppress the background. Several inputs are considered, including general event-shape variables described in Ref. [36], as well as variables characterizing the kaon candidate and the kinematic properties of the ROE. Moreover, vertices of two and three charged particles, with one of the tracks being the kaon-candidate track, are reconstructed to identify kaons from and meson decays; variables describing the fit quality and kinematic properties of the resulting candidates are considered as possible BDT inputs. Variables are excluded if either their contribution to the classification’s separation power is negligible or they are poorly described by the simulation.
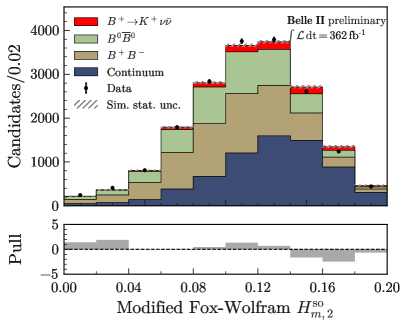
The ITA uses two consecutive BDTs. A first binary classifier, , is designed as a first-level filter after event selection. It is trained on simulated events of each of the seven considered background categories (decays of charged mesons, decays of neutral mesons, and the five continuum categories: with quarks and ), weighted to a common equivalent luminosity such that the sum of weights is balanced to the simulated signal events. The classifier uses 12 input variables. The most discriminating variable is the difference between the ROE energy in the c.m. frame and (), which tends to be negative for signal events due to neutrinos, whereas it is positive for the background with additional reconstructed particles. Significant discrimination comes from variables sensitive to the momentum imbalance of the signal events due to neutrinos, as well as those that correlate the missing momentum with the signal-kaon momentum. Examples of such variables are the reduced first-order Fox-Wolfram moment [37] and the modified Fox-Wolfram moments [38].
The second classifier, , is used for the final event selection. It is trained on events with , which corresponds to a signal (background) selection efficiency of 34% (1.5%), using 35 input variables. A simulated background sample of 200 equivalent luminosity, corresponding to events, and a sample of signal events are used. Tests with larger samples used for training show no additional improvements in performance. For , the most discriminating variables are the cosine of the angle between the momentum of the signal-kaon candidate and the thrust axis of the ROE computed in the c.m. frame, which has a uniform distribution for the signal and a peaking shape for the jet-like continuum background. The thrust axis is defined as the unit vector that maximizes the thrust value , where is the momentum of th final-state particle in the c.m. frame [39, 40]. Also important are variables identifying kaons from and meson decays, and the modified Fox–Wolfram moments. The and parameters are optimized based on a grid search in the parameter space and are described in Sec. A.1. Training of and classifiers is based on simulated samples that are statistically independent of those used in the sample-composition fit.
For the HTA, the remaining background is suppressed using a multivariate classifier BDTh, which uses 12 input variables combining information about the event shape, the signal-kaon candidate, the meson, and any extra tracks and extra photons. Simulated background samples of about events and continuum events, which correspond to an equivalent luminosity of, respectively, 3 and 1 , are used together with a signal sample of events. The BDTh parameters are optimized through a grid search in the parameter space. Given the limited size of the simulated sample, it is beneficial to use information from the whole sample both to train the BDTh and estimate the remaining background in the signal region. The simulated sample is thus split into two subsamples that are used to train two separate BDTh’s. Good agreement between the two outputs is observed. The data sample is then randomly divided into two halves and each BDTh is applied to one half. In the background sample, for each event, the BDTh other than the one the event is used to train is applied. Details regarding the input variables and BDTh parameters are reported in Sec. A.2.
The BDTh input variable providing the highest discriminating power is . For correctly reconstructed signal events, no extra ECL deposits are expected, which results in a distribution peaking at zero; backgrounds leave deposits with energies up to 1 . The second most discriminating variable is the sum of missing energy and magnitude of the missing momentum (), where the missing four-vector is defined as the difference between the beam four-vector and the sum of the signal kaon and four-vectors in the c.m. frame. For correctly reconstructed signal events, is defined by the neutrino kinematic properties, and its distribution peaks around 5 , while for background events the random loss of particles mimicking the neutrinos results in a broader distribution.
VII Signal Region Definition
Using the simulated signal sample, the variable is mapped to the complement of the integrated signal-selection efficiency,
| (4) |
where is the total signal-selection efficiency density for the value . In this way the distribution of for simulated signal events is uniform; a similar mapping is used to define , based on the efficiency of the selection on BDTh.
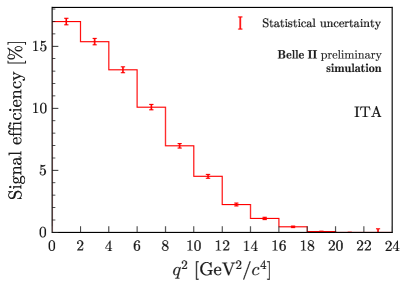
For the ITA, the signal region (SR) is defined to be and , as this criterion maximises the expected signal significance, based on studies in simulation. The SR is further divided into intervals (bins) in the space. The bin boundaries are in and in . The bin provides the main information on the signal while the bin helps to constrain background contributions. The bin boundaries in are chosen to follow those of theoretical predictions [2] while ensuring a sufficient number of expected signal events in each bin. The expected yields of the SM signal and the backgrounds in the SR are 160 and 16793 events, respectively. For the highest-purity region, the expected SM signal yield is reduced to 40 events with a background yield of 977 events. These signal and background yields include corrections to the simulation discussed in the following sections; they correspond to the sample entering the statistical analysis to extract the signal described in Sec. X.
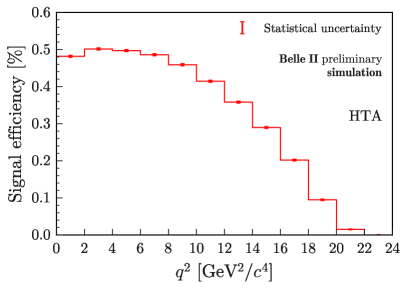
For the HTA, the SR is defined to be and is divided into six bins with bin boundaries at . In events containing multiple - candidates, the candidate formed by the with highest FEI probability is selected. The expected yields of the SM signal and the background in the SR are 8 and 211 events, respectively. For the highest purity region, the expected SM signal yield is reduced to 4 events with background yield of 33 events.
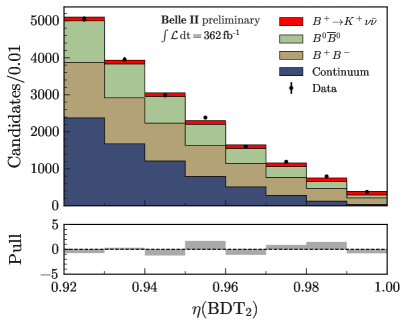
The signal-selection efficiency in the SR is shown in Fig. 6. Much higher efficiency is observed for the ITA; however, the ITA efficiency has a significantly stronger dependence compared to the efficiency for the HTA. The analysis relies on modeling of this variation by simulation, which is checked using a control channel, as discussed in the next section.
VIII Signal selection efficiency validation
The decay is used to validate the BDT performance on signal-like events between data and simulation, exploiting its large branching fraction and distinctive experimental signature. These events are selected in data and simulation by requiring the presence of two oppositely-charged muons with an invariant mass within 50 of the known mass [14]. To suppress background events, the variable is required to be less than 100 and the beam-energy constrained mass is required to exceed 5.27. These criteria result in events being selected in the data sample with an expected background contamination of . Each event is then reconsidered as a event by ignoring the muons from the decay and replacing the kaon candidate with the signal kaon candidate from a simulated event, to reflect the three-body topology of the signal signature. The kinematic properties of the signal kaon are then adjusted such that the four-momentum and decay vertex in the simulated decay match the four-momentum and decay vertex of the corresponding from the decay. This substitution is performed for the reconstructed track, ECL energy deposits, and PID likelihood values associated with the simulated kaon such that the test samples have a format identical to the data and can be analyzed by the same reconstruction software. This signal-embedding method is performed for both data and simulation.
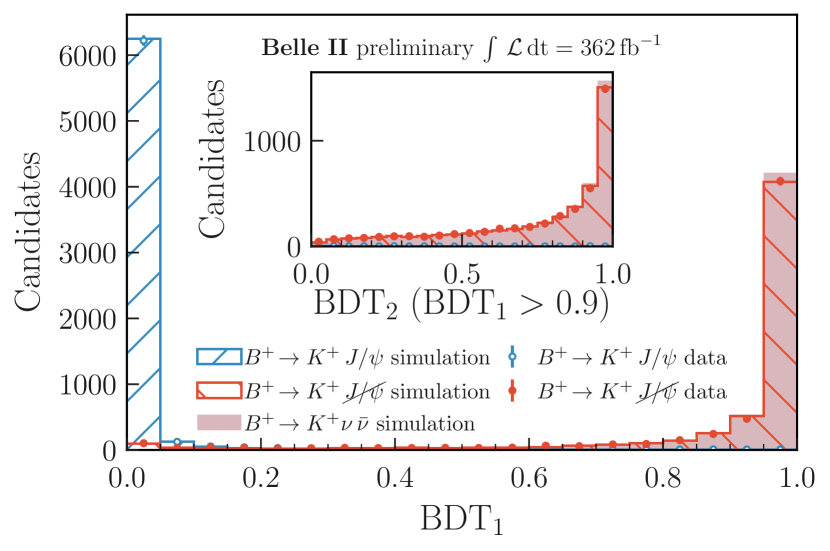
The results obtained by analyzing selected events are summarized for the ITA in Fig. 7, where the distributions of the output values of both BDTs are shown. Good agreement between simulation and data is observed for the selected events before () and after () the signal embedding. The ratio of the selection efficiencies for the SR in data and simulation is , i.e., agreement is observed.
For the HTA, the signal embedding is used to check both the FEI and the combined FEI plus BDTh signal reconstruction efficiency. The ratios of data and simulation efficiencies at the two levels of the selection are found to be and , respectively. The first ratio agrees with an independent FEI calibration derived from FEI-tagged events [41] and is therefore used as a correction for signal efficiencies and normalization. From the relative uncertainty on the efficiency ratio computed after the selection, a 16% systematic uncertainty on the signal-selection efficiency is derived.
IX Background studies
The main background sources for the analysis arise from decays that involve an energetic kaon (or a misidentified pion), missing energy, or particles that leave no or small signatures in the ECL, such as mesons. These processes occur in both continuum and -meson decays. Dedicated studies, using a variety of control samples, are performed in order to validate the background description in simulated events. Where needed, correction factors are derived with corresponding systematic uncertainties. In the following sub-sections the modeling of backgrounds from continuum (Sec. IX.1) and events (Sec. IX.2) are discussed. In Sec. IX.3 the overall background normalisation after all corrections are applied is checked.
IX.1 Continuum background
Continuum represents 40% and 30% of the background in the entire signal region of the ITA and HTA, respectively. This contribution drops to in the highest-sensitivity region of the ITA, and to in the highest-sensitivity region of the HTA. The background modeling is validated using the off-resonance data and shows moderate disagreements in the shape of some of the input features of the various classifiers (locally up to 20%). The modeling of continuum-background simulation is thus improved following Ref. [42]. A binary classifier, BDTc, is trained to separate the off-resonance data and off-resonance simulation. For the ITA, the BDTc input variables consist of all input variables, , and the output of . The BDTc classifier is trained with events that satisfy and in the off-resonance data and a 50 sample of off-resonance simulation. As a check, BDTc is trained using a 200 simulated sample of continuum events produced at a c.m. energy corresponding to the resonance, yielding a similar performance. For the HTA, the BDTc exploits all BDTh input variables and is trained with the off-resonance data and a 1 simulated sample of continuum events produced at a c.m. energy corresponding to the resonance. If , taking values between 0.0 and 1.0, denotes the BDTc classifier output for a given continuum event, the ratio approximates the likelihood ratio , where is the likelihood of the continuum event being from data (simulation), which is used as a weight [42]. The weights range between 0.5 and 2.0 with a standard deviation of 0.3 for the ITA. This weight, for the ITA, is applied to the simulated continuum events after the final selection; for the HTA, it is applied before the BDTh training. Comparison of simulated continuum events with off-resonance data shows that the application of this weight improves the modeling of the input variables.
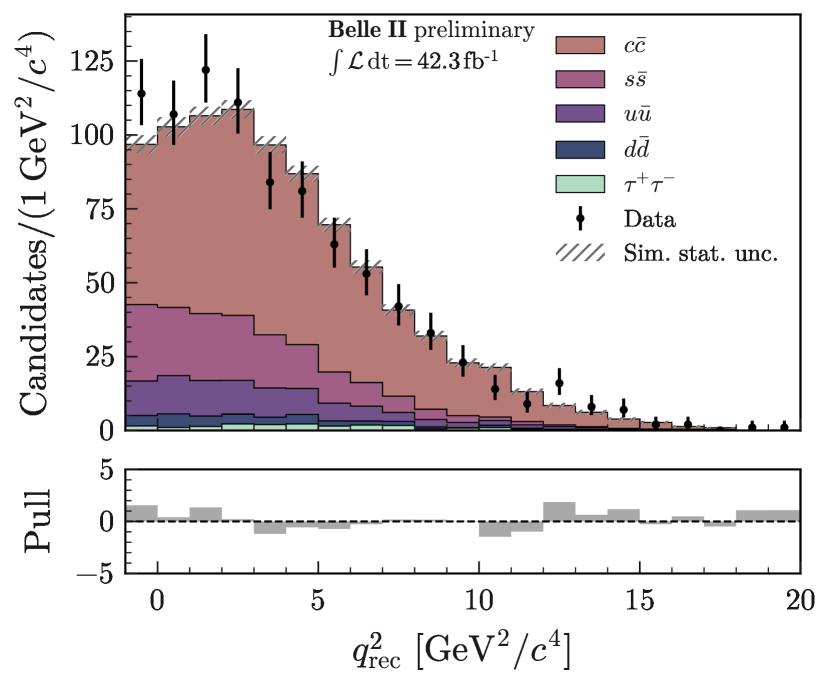
Figure 8 shows a comparison of the distribution in data and corrected simulation for the ITA off-resonance sample. While the shapes of the distributions are similar, there is a normalization excess of the data over the simulation of , which is included as a systematic uncertainty (see Sec. XI). A possible source of the discrepancy is a mismodeling of kaon fragmentation in the PYTHIA8 version used in Belle II.
For the HTA, the relative normalization between off-resonance data and continuum simulation is before the BDTh selection. This factor accounts for mismodeling effects on the FEI performance for continuum events and is used to scale the expected continuum contamination. The relative normalization in the BDTh signal region is consistent with unity with 50% uncertainty, which is included as a systematic uncertainty (see Sec. XI).
IX.2 background
The backgrounds originating from and decays are dominant in the highest-sensitivity regions of the analysis. The composition of the backgrounds is similar for both the ITA and HTA samples. It is also similar for and decays; however, the contribution from decays has a larger impact for both analyses.
In the ITA sample, the main background process consists of semileptonic decays to charm, where the signal-candidate kaons originate from charmed-meson decays. This process is approximately of the total background in the SR. The other major background processes are hadronic decays involving charmed mesons and other hadronic decays, contributing about and to the total background in the SR, respectively. The remaining sources of background are decays and decays.
In the HTA sample, semileptonic decays represent the majority of the background events, accounting for approximately of the total background. The second most abundant contribution comes from hadronic decays with final states including a charmed meson accompanied by multiple pions, representing about of the total background. The remaining contributions are from other hadronic modes.
The lower-particle-multiplicity events involving the direct decay of a meson into a meson contribute more than those containing resonances. The decays involving higher excitations of mesons ( modes), which are less well known, correspond to approximately of the total background for ITA and for HTA, and are modelled according to their PYTHIA8 [20] simulation. In the following, the modeling of the main background categories and of specific background decays requiring special treatment is presented.
IX.2.1 Modeling of -meson decays involving a meson
The dominant background contributions in which the signal-candidate originates from and decays are suppressed using several variables that exploit characteristic features of these decays, such as displaced decay vertex and invariant-mass information, as discussed in Sec. VI. The modeling of this background is checked by comparing the distributions of these variables in data and simulation at various selection stages, and good agreement is observed.
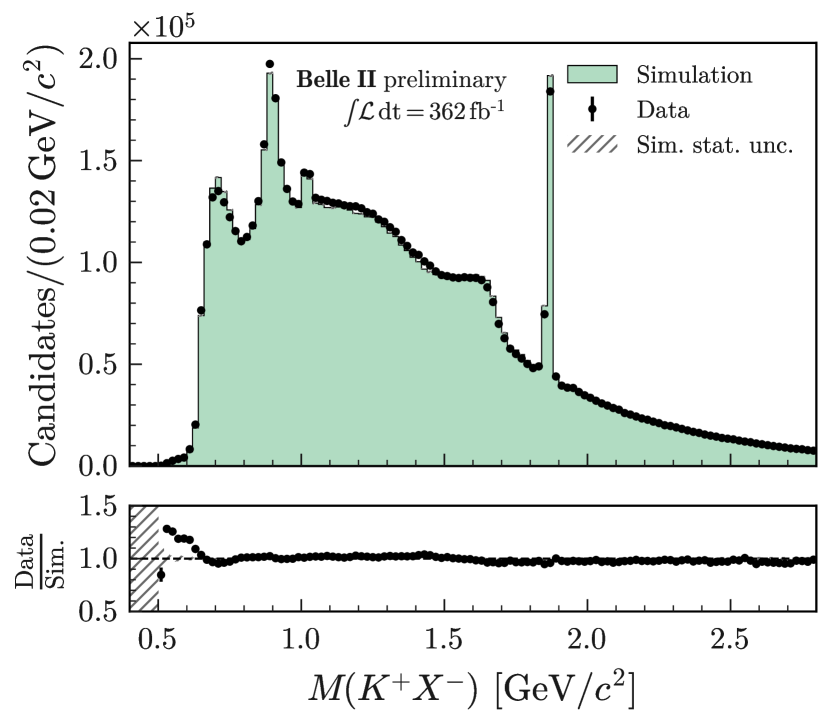
An example is presented in Fig. 9, which shows the invariant mass distribution of the signal-kaon candidate paired with a charged particle from the ROE after the selection. The distinctive shape in data, including the peak from the two-body decay, is well reproduced by the simulation.
IX.2.2 Modeling of -meson decays involving a meson
Backgrounds from prompt production of mesons in decays are important in the highest-sensitivity region. The branching fractions of and decays are relevant due to the sizable and poorly-known fraction of -meson decays involving mesons. The branching fraction of decays which involve transitions is studied using independent control samples based on alternative particle-identification requirements. A pion-enriched control sample is used to determine corrections, while samples with the signal track identified as an electron or a muon are used to validate them.
The pion-enriched sample presents an overall excess of the data over expectations for both ITA and HTA. For the ITA, the excess is studied as a function of and found to appear at the threshold and above (see Fig. 10 left). If attributed to -meson decays involving , the excess is consistent with a increase in rate compared to the expectation from simulation. This is determined in a three-parameter fit to the binned distribution for where the fit parameters are the fractions of summed continuum, summed charged and neutral -meson decays with -meson decays involving , and summed charged and neutral -meson decays without -meson decays involving mesons (see Appendix B for more details). In background simulation the branching fraction for is 40% and for is 58%. When these branching fractions are scaled by , the resulting branching fraction of 52% for is compatible with the known value of [14]; the value for , 75%, is above the known value of [14].
An excess at above the charm-production threshold is also evident in the samples in which the signal track is identified to be a muon or an electron. It is covered by and increases in the rate of charm decays involving in the respective samples.
Consequently, a correction of is applied to the branching fraction of events containing in the simulated background sample, in both ITA and HTA. The correction is based on the excess size determined for the pion-enriched sample, as the rate of pion-to-kaon misidentification is significantly larger than that of lepton-to-kaon misidentification. Due to the discrepancy in the correction factors between the different samples, a systematic uncertainty of 10% is assigned, i.e., the correction is (+30 10)%.
Figure 11 shows the distribution for the pion-enriched sample, after all corrections are applied, including the scaling of the branching fraction of -meson decays involving mesons. The resulting expectations are consistent with the data. The distribution for the sample is also discussed in Sec. XIII. The distribution for the sample in which the signal track is identified as a lepton is shown in Fig. 12.
IX.2.3 Modeling of , , and backgrounds
Another important class of background is charmless hadronic decays with mesons or neutrons in the final state, since these neutral particles can mimic the signal signature. The contributions from , , and decays are estimated separately, as described in Sec. II.
The modeling of the background in the ITA is validated by reconstructing and decays. Details of the reconstruction are given in Appendix C. The Plot method [44] is used to determine the invariant-mass distributions for the and pairs.
The result for the decay is illustrated in Fig. 13. Data and simulation show good shape and normalization agreement, validating the modeling.
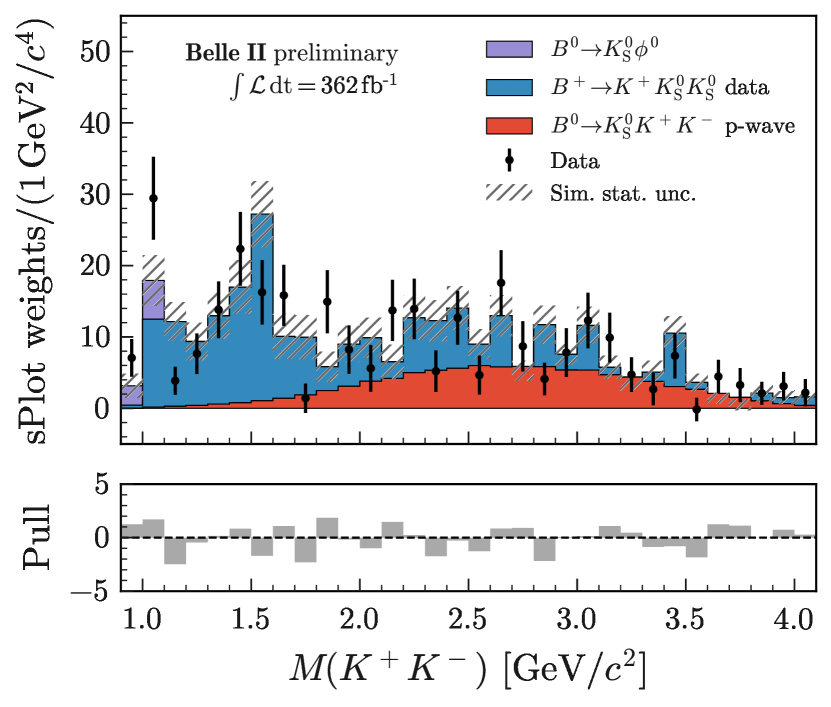
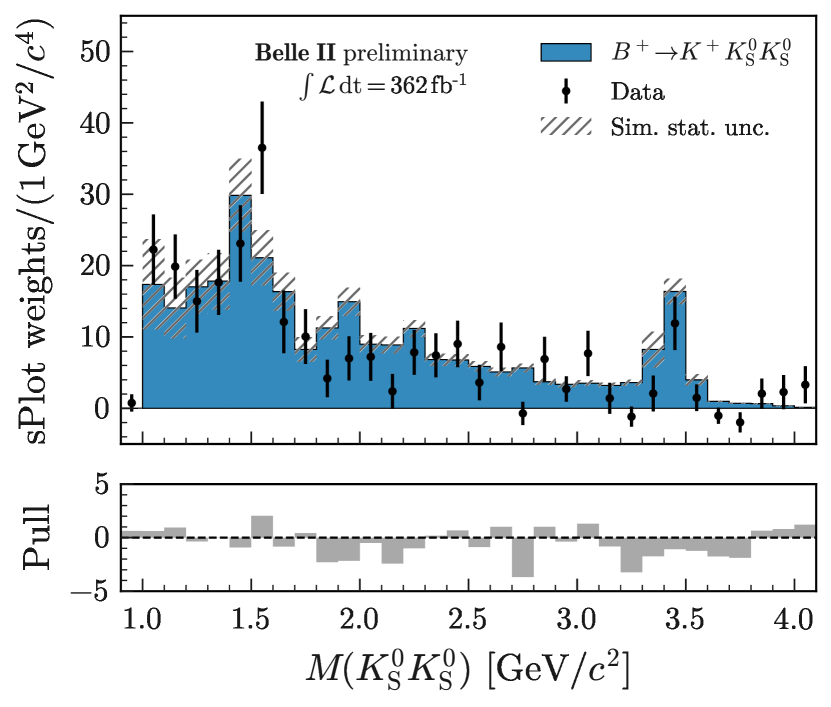
The decay is modeled as a sum of and nonresonant p-wave contributions, as described in Sec. II. This model is validated by reconstructing the isospin-related decay in data. In addition to and contributions, this decay proceeds via scalar resonances and a nonresonant s-wave amplitude. The decays in data are used to model the latter two contributions only, as this decay lacks a p-wave component due to Bose-Einstein statistics of the pair. Figure 14 shows a comparison between the observed invariant mass and a sum of (1) the spectrum obtained in data and corrected for efficiency and the ratio of the and lifetimes, (2) simulated contributions, and (3) simulated contributions. Satisfactory agreement is observed both in shape and normalization.
The background constitutes 0.4% of the total background in the signal region and 1.0% in the most sensitive region for the ITA. This contribution is significant because of the threshold enhancement used in the model: these contributions would be only 0.2% and 0.3% if the decay proceeded according to phase space.
Contaminations from and decays are also included in the background model according to the SM prediction [4]. Their expected yield is approximately five times smaller than the expected signal yield in the entire SR and ten times smaller in the most sensitive region.
IX.3 Validation of background estimation
The modeling of the ITA BDT distributions of background events is tested using events outside the SR with in the interval 0.75 to 0.90.
For the HTA, the background normalization and BDTh input and output distribution are checked in two control samples: one in which the and the signal kaon have the same charge and another one in which the requirement on the PID criteria on the signal-side kaon is reversed.
In both analyses, the distributions obtained in data and simulation agree. The normalization of the background contributions also agrees with the expectation.
X Signal yield determination
The signal yields are estimated via binned maximum likelihood fits to data event counts in the bins of the SRs defined in Sec. VII. The ITA fit is a simultaneous fit to on- and off-resonance data samples; the HTA fit is to on-resonance data only. Templates are used to approximate the distributions, in the relevant observables, of each class of events. The likelihood function is constructed as a product of Poisson probability-density functions that combine the information from the SR bins. The systematic uncertainties are included in the likelihood as nuisance parameters, which are approximated as additive or multiplicative modifiers of the relevant yields and constrained to the available auxiliary information using Gaussian likelihoods. The parameter of interest is , the signal branching fraction relative to its SM expectation (signal strength). The SM expectation for the signal branching fraction used as a reference is , based on Ref. [4] and excluding the contribution from decays. The statistical analysis is performed with the pyhf computer program [45] and the results are checked using a dedicated sghf computer program [18], which is also used for fits to control samples.
XI Systematic Uncertainties
| Source | Correction | Uncertainty | Uncertainty | Impact on |
| type, parameters | size | |||
| Normalization of background | — | Global, 2 | 0.90 | |
| Normalization of continuum background | — | Global, 5 | 0.10 | |
| Leading -decay branching fractions | — | Shape, 5 | 0.22 | |
| Branching fraction for | dependent | Shape, 1 | 0.49 | |
| p-wave component for | dependent | Shape, 1 | 0.02 | |
| Branching fraction for | — | Shape, 1 | 50% | 0.42 |
| Branching fraction for | dependent | Shape, 1 | 0.20 | |
| Branching fraction for | Shape, 1 | 10% | 0.14 | |
| Continuum-background modeling, BDTc | Multivariate | Shape, 1 | 100% of correction | 0.01 |
| Integrated luminosity | — | Global, 1 | ||
| Number of | — | Global, 1 | 0.02 | |
| Off-resonance sample normalization | — | Global, 1 | 5% | 0.05 |
| Track-finding efficiency | — | Shape, 1 | 0.20 | |
| Signal-kaon PID | dependent | Shape, 7 | 0.07 | |
| Photon energy | — | Shape, 1 | 0.08 | |
| Hadronic energy | Shape, 1 | 0.37 | ||
| efficiency in ECL | Shape, 1 | 0.22 | ||
| Signal SM form-factors | dependent | Shape, 3 | 0.02 | |
| Global signal efficiency | — | Global, 1 | 0.03 | |
| Simulated-sample size | — | Shape, 156 | 0.52 |
A number of possible sources of systematic uncertainty are considered, and summarized in Tab. 1 for the ITA and Tab. 2 for the HTA.
For the ITA, the yields of the seven individual background categories are allowed to vary independently in the fit. In each case, a Gaussian constraint is added to the fit, centered at the expectation based on (corrected) simulation and with standard deviation corresponding to 50% of the central value. The 50% value is motivated by a global normalization difference between the off-resonance data and continuum simulation, as mentioned in Sec. IX.1. For the charged--background yield, which has the largest correlation with the signal strength , the post-fit uncertainty is reduced to about half the assigned pre-fit uncertainty. The data also significantly constrain the -background yield, reducing the post-fit uncertainty to approximately half of the pre-fit uncertainty.
The remaining systematic uncertainties may also influence the shape of the templates. Each source is described by several nuisance parameters. Several sources are used to cover background-modeling uncertainties. The branching fractions of decay modes contributing about of decays and of decays in the SR are allowed to vary according to their known uncertainties [14]. These variations are then propagated to the SR bins, and their effects, along with correlations, are incorporated into a covariance matrix. This matrix is subsequently factorized into a canonical form using eigendecomposition and represented using five nuisance parameters. The uncertainty on the branching fraction of the decay is estimated to be to account for potential branching fraction differences between and decays. The uncertainty on the branching fraction of the decay is estimated to be . This accounts for possible isospin-breaking effects () and uncertainties in the p-wave nonresonant contribution (). The uncertainties on the branching fractions of decays, which are poorly known, are assigned to be . Uncertainties in the modeling of baryonic decays involving neutrons are covered by the uncertainty on the branching fraction. The fraction of -meson decays involving mesons is corrected by with a absolute uncertainty, motivated by the differences in the scaling factors determined using different samples, as discussed in Sec. IX.2.2. All of these uncertainties are propagated as correlated shape uncertainties.
Global normalization uncertainties on the luminosity measurement ( assumed) and the number of pairs () are treated with one nuisance parameter each. In addition, a uncertainty is introduced on the difference in normalization between on- and off-resonance data samples.
The following five sources represent uncertainties in detector modeling; they are discussed in detail in Sec. V. The sources are track-finding efficiency, kaon-identification efficiency, modeling of energy for photons and hadrons, and reconstruction efficiency. The final three sources account for signal-modeling uncertainties. These are signal form-factors, which are based on Ref. [4], and global signal-selection efficiency uncertainties as determined in Sec. VIII.
The systematic uncertainty due to the limited size of simulated samples is taken into account by one nuisance parameter per bin per category (156 parameters).
To account for all the systematic sources described above, a total of 192 nuisance parameters, along with the signal strength , are varied in the fit.
The largest impact on the uncertainty of the signal strength arises from the knowledge of the normalization of the background from charged decays. Other important sources are the simulated-sample size, branching fraction for decays, branching fraction for decays, reconstructed energy of hadrons, branching fractions of the leading decays, and reconstruction efficiency. These sources of uncertainty allow for substantial changes in the shape. The shape variations are larger than the data-simulation residuals in in the pion-enriched sample (Fig. 11). This suggests that uncertainties in the shape are adequately covered by the existing systematic contributions.
| Source | Correction | Uncertainty type, | Uncertainty size | Impact on |
| parameters | ||||
| Normalization of background | — | Global, 1 | 30% | 0.91 |
| Normalization of continuum background | — | Global, 2 | 50% | 0.58 |
| Leading -decay branching fractions | — | Shape, 3 | 0.10 | |
| Branching fraction for | dependent | Shape, 1 | 0.20 | |
| Branching fraction for | — | Shape, 1 | 50% | |
| Branching fraction for | dependent | Shape, 1 | 0.05 | |
| Branching fraction for | Shape, 1 | 10% | 0.03 | |
| Continuum-background modeling, BDTc | Multivariate | Shape, 1 | 100% of correction | 0.29 |
| Number of | — | Global, 1 | 0.07 | |
| Track finding efficiency | — | Global, 1 | 0.01 | |
| Signal-kaon PID | dependent | Shape, 3 | ||
| Extra-photon multiplicity | dependent | Shape, 1 | 0.61 | |
| efficiency | — | Shape, 1 | 0.31 | |
| Signal SM form-factors | dependent | Shape, 3 | 0.06 | |
| Signal efficiency | — | Shape, 6 | 0.42 | |
| Simulated-sample size | — | Shape, 18 | 0.60 |
The summary of systematic uncertainties for the HTA is provided in Table 2. Three background components are considered in the HTA: , accounting for both charged and neutral decays; ; and light-quark continuum (, , ). The contribution from -pair decays is negligible. The primary contribution to the systematic uncertainty arises from the determination of the normalization of the background. This determination is based on the comparison of data-to-simulation normalization in the pion-enriched control sample, which shows agreement within the 30% statistical uncertainty. The other important sources are the uncertainty associated with the bin-by-bin correction of the extra-photon-candidate multiplicity, and the uncertainty due to the limited size of the simulated sample. The uncertainty on continuum normalization (50%), determined using off-resonance data, is the fourth most important contribution. The limited size of the HTA sample prevents the substantial reduction of post-fit uncertainties seen in the ITA, compared to pre-fit values, for the background normalization. The other sources of systematic uncertainty are the same in both analyses, except for those related to photon and hadronic-energy corrections, not applied in the HTA, and the p-wave contribution from , whose contribution is negligible.
For both analyses, nuisance-parameter results are investigated in detail. No significant shift is observed for the background yields from charged and neutral -meson decays. For the ITA, the shifts in the continuum background yields are consistent with the difference observed in the normalization of the continuum simulation with respect to the off-resonance data.
XII Results
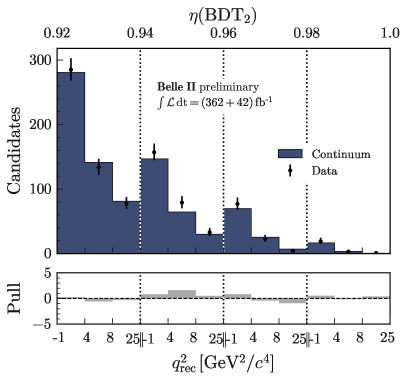
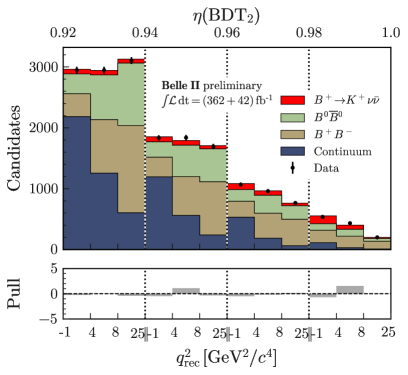
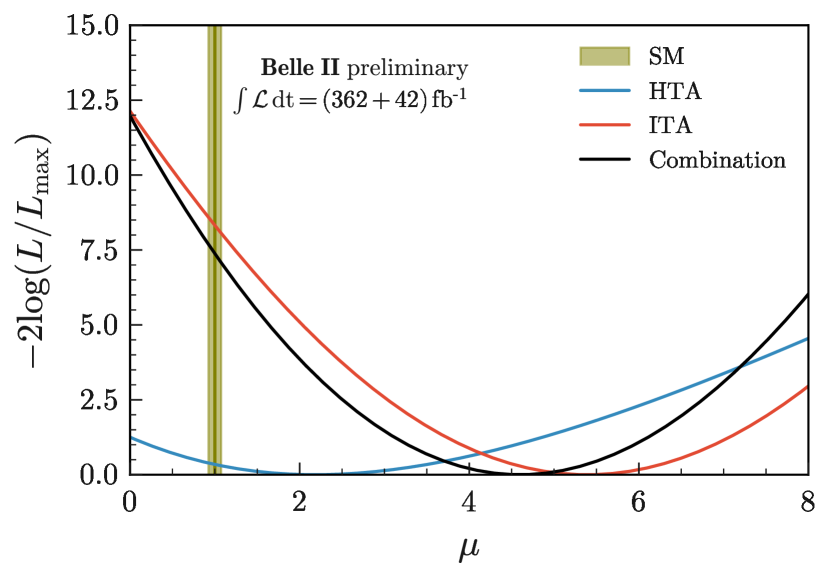
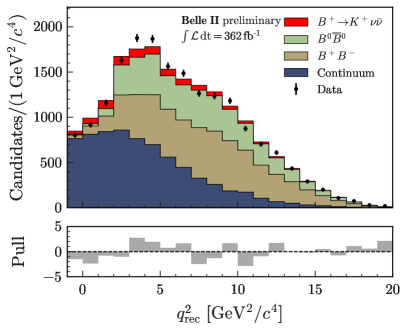
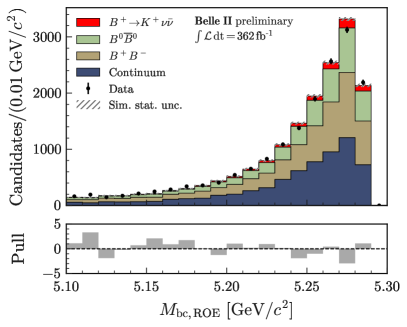
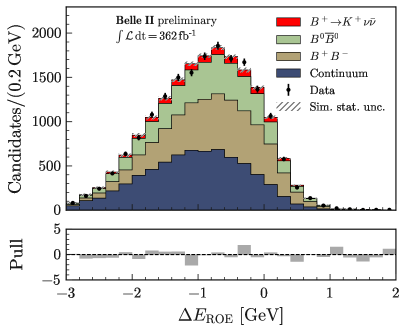
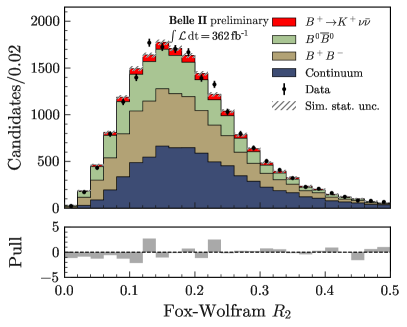
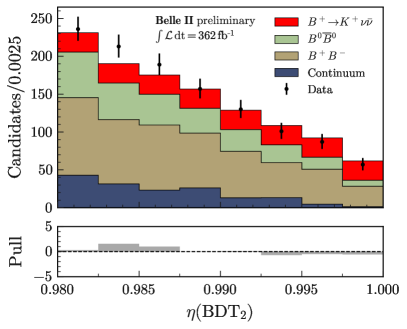
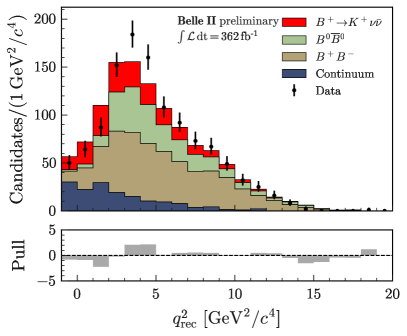
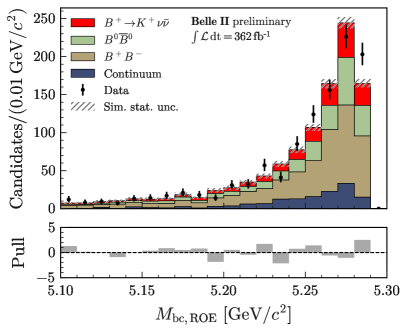
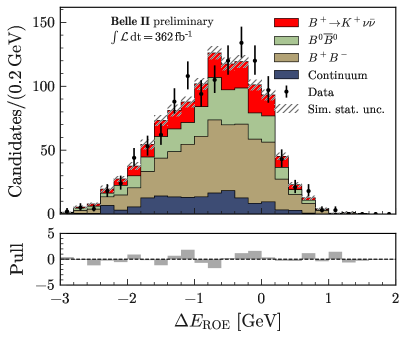
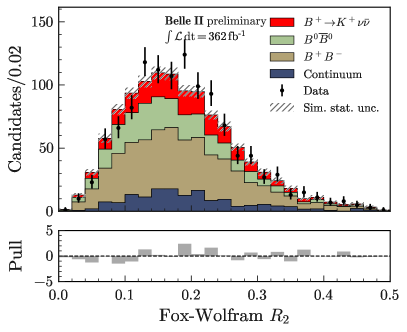
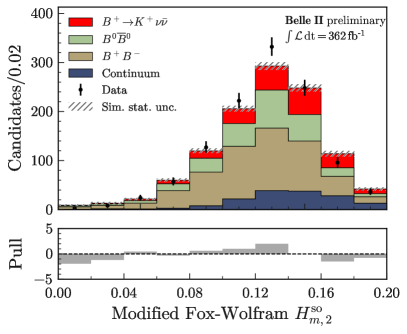
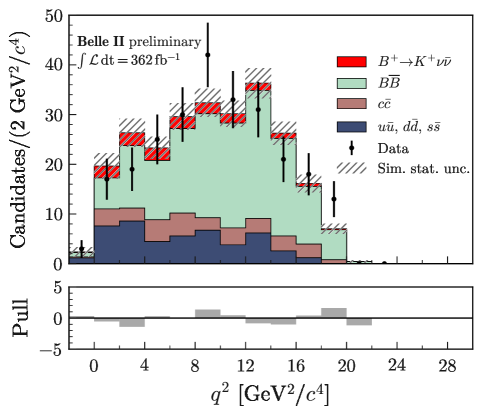
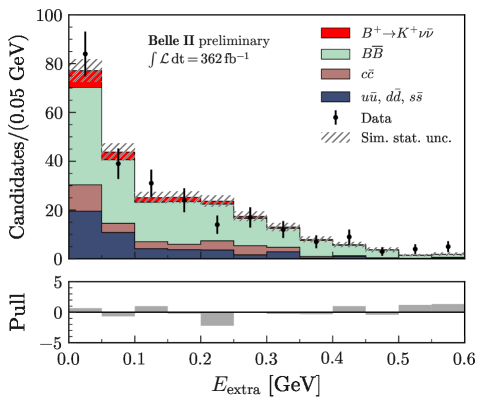
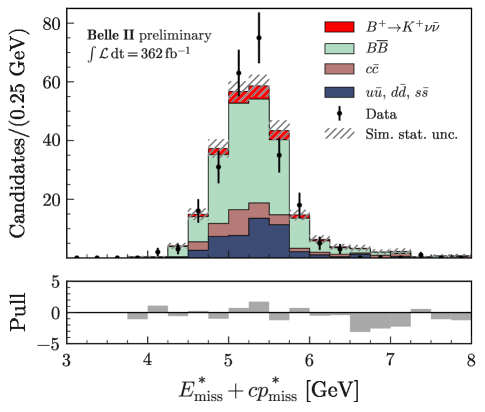
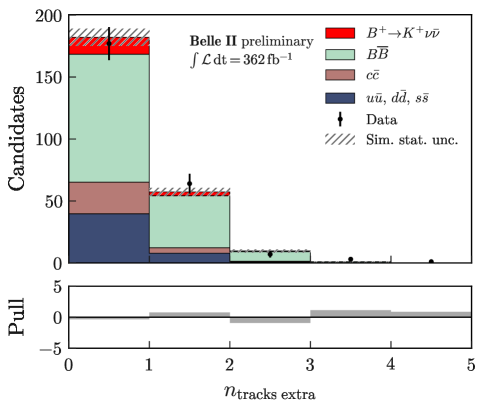
The data in the off-resonance sample and in the SR of the ITA are shown in Fig. 15, with fit results overlaid. Good visual agreement between data and fit is observed in both samples. An excess over background is observed in the SR, consistent with the presence of signal. The observed signal purity, in terms of the fraction of signal events, is 5% in the SR and 19% in the three bins with . The signal strength is determined to be where the statistical uncertainty is estimated using simplified simulated experiments based on Poisson statistics. The total uncertainty is obtained using a profile likelihood ratio, fitting the model with fixed values of around the best-fit value while keeping the other fit parameters free; see Fig. 16. The systematic uncertainty is calculated by subtracting the statistical uncertainty in quadrature from the total uncertainty. An additional 8% theoretical uncertainty, arising from the knowledge of the branching fraction is not included. Compatibility between the data and fit result is assessed using simplified experiments, and a -value of 47% is found. (The test is based on the fraction of simplified experiments with the negative profile log-likelihood ratio of the nominal to the “saturated” model, in which the predictions are set to the observations, above the one observed in data.) Figures 17 and 18 present distributions of several variables for the events within the signal region. Each simulated event is weighted using the ratio of post-to-pre-fit yields for the corresponding SR bin and event category. Good overall agreement is observed. However, certain discrepancies are evident in the distribution, showing a deficit in data-to-predictions for and an excess for .
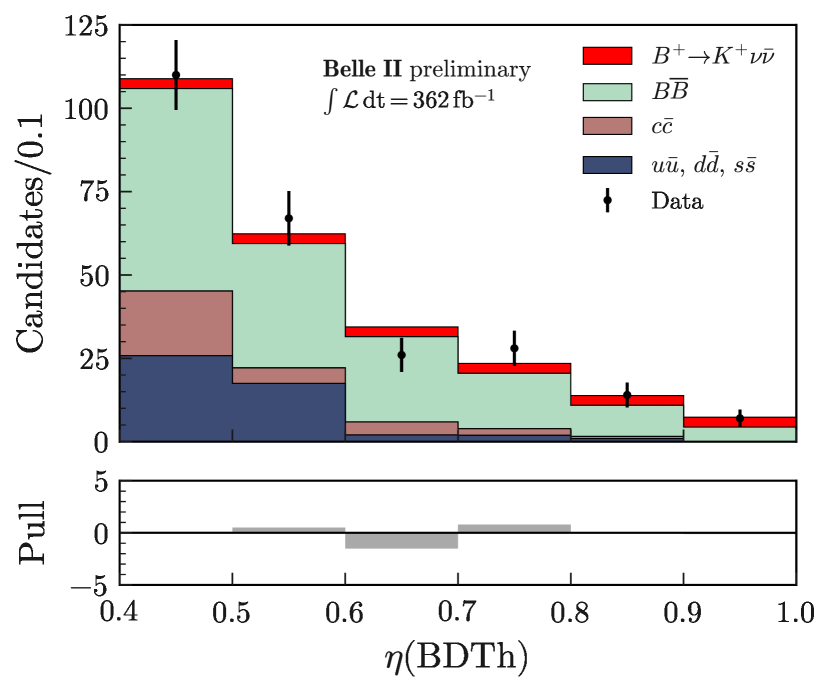
A comparison of data and fit results for the HTA is shown in Fig. 19. The compatibility between the data and fit results is determined to be . The HTA observes a signal strength of , lower than the ITA result. In the whole SR, a signal purity of 7% is measured, which increases to in the three bins with , with the main background contribution from decays. Figure 20 shows distributions of several variables for the events within the signal region. Good agreement is observed.
If interpreted in terms of signal, the results correspond to a branching fraction of the decay of for the ITA and for the HTA.
The significance of the observation is determined by evaluating the profile likelihood for several values. The square root of the difference between the values at and the minimum is used to estimate the significance of the observed excess with respect to the background-only hypothesis, which yields standard deviations for the ITA. For the HTA, the observed signal is consistent with the background-only hypothesis at standard deviations. Similarly, the square root of the difference between the values at and at the minimum is used to estimate the significance of the observed signal with respect to the SM expectation. For the ITA, it is found to be standard deviations, indicating a potential deviation from the SM. For the HTA, the result is in agreement with the SM at standard deviations.
Events from the SR of the HTA represent only 2% of the corresponding events in the ITA; their removal does not alter the ITA result significantly. The ITA sample with removed overlapping events is used for the compatibility checks. The ITA and HTA measurements agree, with a difference in signal strength of standard deviations.
XIII Consistency checks
Several checks are performed to test the validity of the analysis.
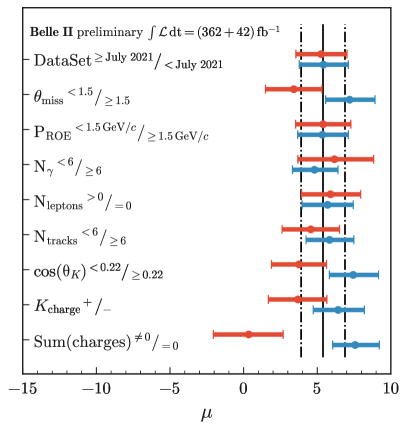
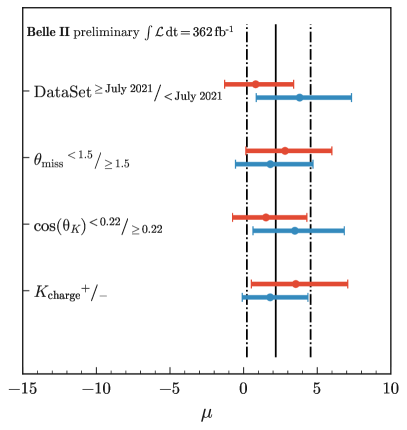
Simulation and data events are divided into approximately same-size statistically independent samples (split samples) according to various criteria: data-taking period; missing-momentum direction; momentum of the rest-of-event particles; number of photons, charged particles, and lepton candidates in the event; kaon direction; kaon charge; and total charge of the reconstructed particles in the event. Fits are performed for each split sample, and the results are presented in Fig. 21.
Good compatibility is observed between the split samples for the HTA. A tension at 2.4 standard deviations is observed for the total charge split sample in the ITA. Several studies are conducted to investigate this tension, but they did not reveal any significant systematic effects. The total value per degrees of freedom for all tests in the ITA is .
An important test involves the subdivision based on the number of leptons in the ITA. Since there are no leptons on the signal side, this test compares events in which a (semi)leptonic decay occurs in the ROE with those in which a hadronic decay occurs. The separation is confirmed by inspecting simulated events. Excellent agreement is observed between the results in the two split samples. This demonstrates the robustness of the ITA procedure with respect to a particular signature in the ROE.
For each common split sample, a comparison is also performed between the ITA and the HTA, showing compatibility between one and two standard deviations.
An ITA fit fixing the normalization of the background to the expectation and the normalization of the continuum to the yield observed in off-resonance data yields a reduction of the uncertainty on by with a downward change in that is consistent with zero at standard deviations. Performing a fit where the 50% constraints on the normalizations of all background sources are released leads to a minimal change of by , with the uncertainty on increasing by only 5%. Another fit in which the leading systematic uncertainties are fixed also gives a consistent result. A fit to the 12 bins of data only, i.e., excluding the off-resonance data, changes by less than , while the uncertainty increases by . Similarly, a fit restricted to the 18 bins with yields a change in of less than , while the uncertainty increases by . Additional fits are conducted to study the stability of the result with respect to . In these fits, the background normalization is fixed to its expected value due to increased uncertainties, and the normalization of the continuum is set based on the yield observed in off-resonance data. The fits are separately performed for the low and high SR bins. The results from these fits are consistent within standard deviations.
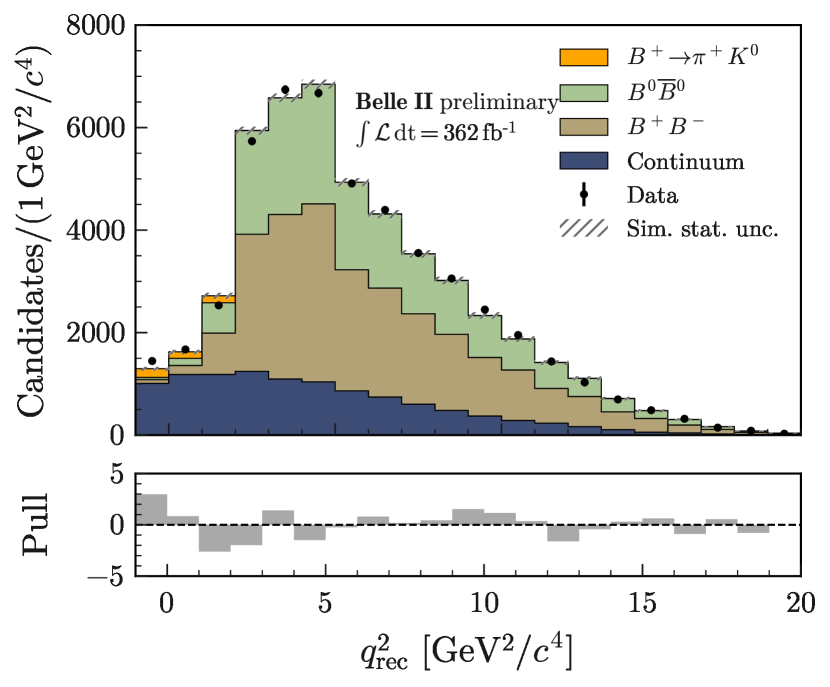
The ITA method is further validated by performing a branching fraction measurement of the decay. This decay has a similar signature to , with comparable selection efficiency and purity. The branching fraction, measured using in the final state, is [14]. With respect to the nominal analysis, the following modifications are implemented for this validation: (i) positive pion identification is used instead of kaon identification; (ii) a bin boundary of the SR in is changed from to to increase sensitivity; (iii) the fit model uses only three sources of background (continuum, neutral decays, charged decays excluding ), and the signal decays; (iv) systematic uncertainties are restricted to those originating from limited sizes of the simulated samples and global normalization uncertainties; (v) the fit is restricted to the data sample collected at the resonance.
Based on the simulation, of within the SR are while the remaining are . The SR corresponds to a signal-selection efficiency of 4.4% with 0.9% purity, which can be compared to the 8% and 0.9% values for the , respectively. However, the yield is almost three times higher, providing a sensitive test of the SR modeling. The fit quality is good, with a -value of . The branching fraction of the decay is found to be , consistent with the known value. The distribution of with the background and signal components normalized using the fit result is shown in Fig. 22.
XIV Combination
The consistency of the two analyses and the small size of the overlap between the HTA and ITA samples allows the combination of the results, which achieves a 10% increase in precision over the ITA result alone. This is done through a profile likelihood fit, incorporating correlations between common systematic uncertainties. In order to eliminate statistical correlation, common data events are excluded from the ITA dataset prior to the combination. Nuisance parameters corresponding to the number of events, signal form-factors, and branching fractions for processes , , , , and other leading -meson decays are treated as fully correlated. To capture full correlations for the systematic uncertainties related to the branching fractions of leading -meson decays between the ITA and HTA, eigendecomposition of the shared covariance matrix between ITA and HTA is performed and represented using ten nuisance parameters.
Conversely, other sources are considered uncorrelated due to their analysis-specific nature, distinct evaluation methods, or minor impact, such as PID uncertainties.
In order to ensure robustness, various scenarios are studied, including variations in which sources, such as global background normalization, are assumed to be fully correlated between the two analyses. These tests yield no substantial deviation from the default combination.
The combined result for the signal strength yields , corresponding to a branching fraction of the decay of =. The significance with respect to the background-only hypothesis is found to be standard deviations. The combined result is standard deviations above the SM expectation.
XV Discussion
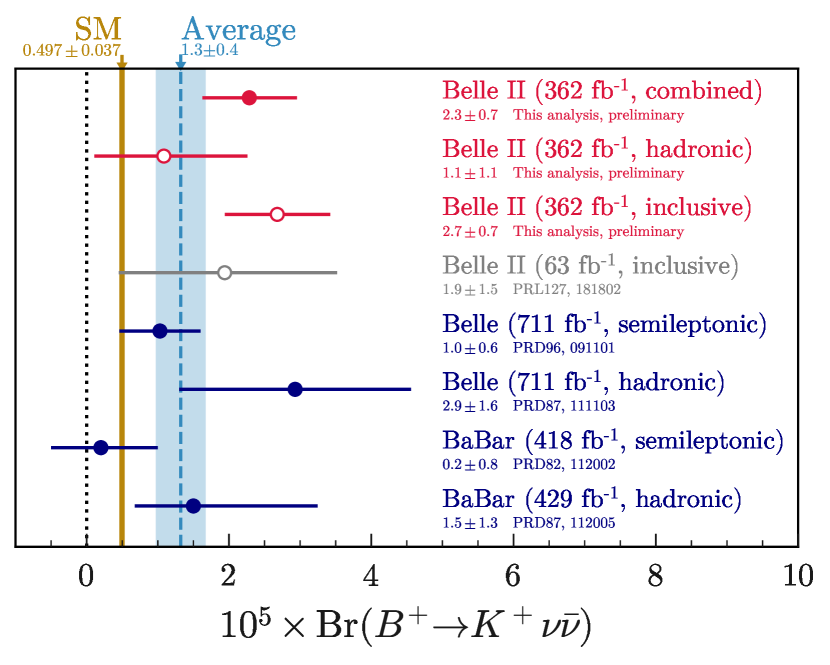
The measured branching fraction is compared with previous measurements in Fig. 23. The comparison is performed using branching fractions from prior measurements to assess both compatibility and relative accuracy. For BaBar, the branching fractions are taken as given in Refs [11, 10]. Since Belle did not report branching fractions in Refs. [9, 12] they are computed for this comparison based on the quoted observed number of events and efficiency taking into account statistical and systematic uncertainties. Note that BaBar uses a different value of compared to the one adopted here. However, due to the large statistical uncertainties, minor differences in the correction factors have a small impact on the comparison of the results.
The ITA result is in agreement with the previous measurements obtained using hadronic and inclusive tagging methods. There are tensions of 2.3 and 1.8 standard deviations with the results obtained using semileptonic tagging by the BaBar [11] and Belle [12] Collaborations, respectively. The HTA result is in agreement with all measurements. The precision of the ITA measurement is comparable with the previous best results, despite being obtained with a smaller data sample. The precision of the HTA result exceeds that achieved by previous analyses using hadronic tagging. The combined Belle II result has comparable accuracy to the best single measurement, reported by Belle using semileptonic tags.
A simplified weighted average of the five independent measurements, obtained using symmetrized uncertainties (see Fig. 23), yields a branching fraction of , and the corresponding per degree of freedom is found to be , corresponding to a -value of .
The analysis was initially performed in a manner designed to reduce experimenter’s bias. The full analysis procedure was developed and finalized before determining the branching fraction from data. However, several checks and corrections were applied after the result was obtained. The original measurement was initially limited to the ITA and optimized through simulation using a partial data set of . In spring 2022, a fit to the data revealed a significant deviation from the expectations of the SM. To validate the findings, the ITA was repeated using a larger data sample while maintaining the selection criteria employed in the original measurement. As an additional consistency check, the HTA was introduced. The new analyses underwent rigorous consistency checks before the signal strength was once again unveiled in spring 2023. The ITA and HTA results were found to be in agreement, confirming the results of the original 2022 analysis. Further comprehensive checks were conducted in PID sidebands, leading to changes in background modeling and an increase in systematic uncertainties.
The post-unveiling changes in the ITA are corrections to the reconstruction efficiency in the ECL and its uncertainty, motivated by the observed excess in the pion-enriched sample (Sec. V.3); correction to the rate of -meson decays involving and its uncertainty (Sec. IX.2.2); and corrections to the decay modeling and corresponding uncertainty (Sec. IX.2.3). In addition, the treatment of the reconstructed hadronic energy in the ECL was adjusted. Instead of keeping the scale at the nominal value, it is now adjusted to the preferred value while keeping the uncertainty (Sec. V.3). These modifications lead to a shift of the signal strength in the ITA of about . A mistake was found in the treatment of the background which was accidentally removed from the simulation. The mistake was corrected yielding a change in . Given updates of the input variables, a new training of the was performed that led to an additional change in with a statistical uncertainty of estimated using simulated experiments. The modifications lead to an increase of the total uncertainty by , driven by the uncertainty on the branching fraction.
The HTA is based on a standard FEI data selection that is widely used within Belle II. During the review of another Belle II analysis [46], it was concluded that it is necessary to remove selection criteria on the total energy in the ECL that is poorly modeled in simulation. The selection was removed and the BDTh was then retrained on new selected samples. This change resulted in a change of signal strength of . Additional HTA changes include systematic uncertainty due to the reconstruction efficiency in the ECL (Sec. V.3); correction to the rate of -meson decays involving and its uncertainty (Sec. IX.2.2); corrections to the decay modeling and corresponding uncertainty (Sec. IX.2.3). Dedicated studies were performed targeting the variable that is correlated with the total energy in the ECL, as described in Sec. V.3, resulting in a data-driven correction and additional systematic uncertainty. These changes resulted in a change in the signal strength of with a statistical uncertainty of , estimated using simulated experiments, which accounts for both data and simulated samples. The previously underestimated contributions from and background reduce the signal strength by . Taking this reduction and the estimate of the statistical uncertainty into account, the significance of the change in is 1.9 standard deviations. The total uncertainty for the HTA is reduced by about . The increase in the systematic uncertainty, also observed in ITA, is compensated by an increase in the data-sample size due to changes in the FEI selection.
XVI Summary
In summary, a search for the rare decay is reported using an inclusive tagging approach with data collected by the Belle II detector at the resonance, corresponding to an integrated luminosity of 362. The search is validated by a well-established approach using hadronic tagging. The background processes are suppressed by exploiting distinct kinematic properties of the decays in a multivariate classifier that is optimized using simulated data. The quality of the simulation is validated using several control channels. A sample-composition fit is used to extract the branching fraction of the decay. The branching fraction obtained using the inclusive tagging is . This measurement has a significance of standard deviation with respect to the background-only hypothesis and shows a standard deviation departure from the standard model expectation. The branching fraction obtained using the hadronic tagging is and is consistent with the inclusive result at 1.2 standard deviations. A combination of the inclusive and hadronic tagging results yields for the decay branching fraction, providing the first evidence of the decay with a significance of standard deviations. The combined result shows a departure of standard deviations from the standard model expectation.
XVII Acknowledgements
This work, based on data collected using the Belle II detector, which was built and commissioned prior to March 2019, was supported by Science Committee of the Republic of Armenia Grant No. 20TTCG-1C010; Australian Research Council and Research Grants No. DP200101792, No. DP210101900, No. DP210102831, No. DE220100462, No. LE210100098, and No. LE230100085; Austrian Federal Ministry of Education, Science and Research, Austrian Science Fund No. P 31361-N36 and No. J4625-N, and Horizon 2020 ERC Starting Grant No. 947006 “InterLeptons”; Natural Sciences and Engineering Research Council of Canada, Compute Canada and CANARIE; National Key R&D Program of China under Contract No. 2022YFA1601903, National Natural Science Foundation of China and Research Grants No. 11575017, No. 11761141009, No. 11705209, No. 11975076, No. 12135005, No. 12150004, No. 12161141008, and No. 12175041, and Shandong Provincial Natural Science Foundation Project ZR2022JQ02; the Czech Science Foundation Grant No. 22-18469S; European Research Council, Seventh Framework PIEF-GA-2013-622527, Horizon 2020 ERC-Advanced Grants No. 267104 and No. 884719, Horizon 2020 ERC-Consolidator Grant No. 819127, Horizon 2020 Marie Sklodowska-Curie Grant Agreement No. 700525 “NIOBE” and No. 101026516, and Horizon 2020 Marie Sklodowska-Curie RISE project JENNIFER2 Grant Agreement No. 822070 (European grants); L’Institut National de Physique Nucléaire et de Physique des Particules (IN2P3) du CNRS and L’Agence Nationale de la Recherche (ANR) under grant ANR-21-CE31-0009 (France); BMBF, DFG, HGF, MPG, and AvH Foundation (Germany); Department of Atomic Energy under Project Identification No. RTI 4002, Department of Science and Technology, and UPES SEED funding programs No. UPES/R&D-SEED-INFRA/17052023/01 and No. UPES/R&D-SOE/20062022/06 (India); Israel Science Foundation Grant No. 2476/17, U.S.-Israel Binational Science Foundation Grant No. 2016113, and Israel Ministry of Science Grant No. 3-16543; Istituto Nazionale di Fisica Nucleare and the Research Grants BELLE2; Japan Society for the Promotion of Science, Grant-in-Aid for Scientific Research Grants No. 16H03968, No. 16H03993, No. 16H06492, No. 16K05323, No. 17H01133, No. 17H05405, No. 18K03621, No. 18H03710, No. 18H05226, No. 19H00682, No. 22H00144, No. 22K14056, No. 23H05433, No. 26220706, and No. 26400255, the National Institute of Informatics, and Science Information NETwork 5 (SINET5), and the Ministry of Education, Culture, Sports, Science, and Technology (MEXT) of Japan; National Research Foundation (NRF) of Korea Grants No. 2016R1D1A1B02012900, No. 2018R1A2B3003643, No. 2018R1A6A1A06024970, No. 2019R1I1A3A01058933, No. 2021R1A6A1A03043957, No. 2021R1F1A1060423, No. 2021R1F1A1064008, No. 2022R1A2C1003993, and No. RS-2022-00197659, Radiation Science Research Institute, Foreign Large-size Research Facility Application Supporting project, the Global Science Experimental Data Hub Center of the Korea Institute of Science and Technology Information and KREONET/GLORIAD; Universiti Malaya RU grant, Akademi Sains Malaysia, and Ministry of Education Malaysia; Frontiers of Science Program Contracts No. FOINS-296, No. CB-221329, No. CB-236394, No. CB-254409, and No. CB-180023, and SEP-CINVESTAV Research Grant No. 237 (Mexico); the Polish Ministry of Science and Higher Education and the National Science Center; the Ministry of Science and Higher Education of the Russian Federation, Agreement No. 14.W03.31.0026, and the HSE University Basic Research Program, Moscow; University of Tabuk Research Grants No. S-0256-1438 and No. S-0280-1439 (Saudi Arabia); Slovenian Research Agency and Research Grants No. J1-9124 and No. P1-0135; Agencia Estatal de Investigacion, Spain Grant No. RYC2020-029875-I and Generalitat Valenciana, Spain Grant No. CIDEGENT/2018/020 Ministry of Science and Technology and Research Grants No. MOST106-2112-M-002-005-MY3 and No. MOST107-2119-M-002-035-MY3, and the Ministry of Education (Taiwan); Thailand Center of Excellence in Physics; TUBITAK ULAKBIM (Turkey); National Research Foundation of Ukraine, Project No. 2020.02/0257, and Ministry of Education and Science of Ukraine; the U.S. National Science Foundation and Research Grants No. PHY-1913789 and No. PHY-2111604, and the U.S. Department of Energy and Research Awards No. DE-AC06-76RLO1830, No. DE-SC0007983, No. DE-SC0009824, No. DE-SC0009973, No. DE-SC0010007, No. DE-SC0010073, No. DE-SC0010118, No. DE-SC0010504, No. DE-SC0011784, No. DE-SC0012704, No. DE-SC0019230, No. DE-SC0021274, No. DE-SC0022350, No. DE-SC0023470; and the Vietnam Academy of Science and Technology (VAST) under Grant No. DL0000.05/21-23.
These acknowledgements are not to be interpreted as an endorsement of any statement made by any of our institutes, funding agencies, governments, or their representatives.
We thank the SuperKEKB team for delivering high-luminosity collisions; the KEK cryogenics group for the efficient operation of the detector solenoid magnet; the KEK computer group and the NII for on-site computing support and SINET6 network support; and the raw-data centers at BNL, DESY, GridKa, IN2P3, INFN, and the University of Victoria for offsite computing support.
References
- Glashow et al. [1970] S. L. Glashow, J. Iliopoulos, and L. Maiani, Weak Interactions with Lepton-Hadron Symmetry, Phys. Rev. D 2, 1285 (1970).
- Buras et al. [2015] A. J. Buras, J. Girrbach-Noe, C. Niehoff, and D. M. Straub, decays in the Standard Model and beyond, J. High Energy Phys. 02, 184, arXiv:1409.4557 [hep-ph] .
- [3] Charge-conjugate channels are implied throughout this letter.
- Parrott et al. [2023] W. G. Parrott, C. Bouchard, and C. T. H. Davies (HPQCD Collaboration), Standard Model predictions for , and using form factors from lattice QCD, Phys. Rev. D 107, 014511 (2023), [Erratum: Phys.Rev.D 107, 119903 (2023)], arXiv:2207.13371 [hep-ph] .
- Bečirević et al. [2018] D. Bečirević, I. Doršner, S. Fajfer, D. A. Faroughy, N. Košnik, and O. Sumensari, Scalar leptoquarks from grand unified theories to accommodate the -physics anomalies, Phys. Rev. D 98, 055003 (2018), arXiv:1806.05689 [hep-ph] .
- Camalich et al. [2020] J. M. Camalich, M. Pospelov, P. N. H. Vuong, R. Ziegler, and J. Zupan, Quark Flavor Phenomenology of the QCD Axion, Phys. Rev. D 102, 015023 (2020), arXiv:2002.04623 [hep-ph] .
- Filimonova et al. [2020] A. Filimonova, R. Schäfer, and S. Westhoff, Probing dark sectors with long-lived particles at Belle II, Phys. Rev. D 101, 095006 (2020), arXiv:1911.03490 [hep-ph] .
- Browder et al. [2001] T. E. Browder et al. (CLEO Collaboration), Search for and , Phys. Rev. Lett. 86, 2950 (2001), arXiv:hep-ex/0007057 .
- Lutz et al. [2013] O. Lutz et al. (Belle Collaboration), Search for with the full Belle data sample, Phys. Rev. D 87, 111103 (2013), arXiv:1303.3719 [hep-ex] .
- Lees et al. [2013] J. P. Lees et al. (BaBar Collaboration), Search for and invisible quarkonium decays, Phys. Rev. D 87, 112005 (2013), arXiv:1303.7465 [hep-ex] .
- del Amo Sanchez et al. [2010] P. del Amo Sanchez et al. (BaBar Collaboration), Search for the rare decay , Phys. Rev. D 82, 112002 (2010), arXiv:1009.1529 [hep-ex] .
- Grygier et al. [2017] J. Grygier et al. (Belle Collaboration), Search for decays with semileptonic tagging at Belle, Phys. Rev. D 96, 091101 (2017), [97, 099902(A) (2018)], arXiv:1702.03224 [hep-ex] .
- Abudinén et al. [2021] F. Abudinén et al. (Belle II Collaboration), Search for Decays Using an Inclusive Tagging Method at Belle II, Phys. Rev. Lett. 127, 181802 (2021), arXiv:2104.12624 [hep-ex] .
- Workman et al. [2022] R. L. Workman et al. (Particle Data Group), Review of Particle Physics, Prog. Theor. Exp. Phys. 2022, 083C01 (2022).
- Keck [2017] T. Keck, FastBDT: A Speed-Optimized Multivariate Classification Algorithm for the Belle II Experiment, Comput. Softw. Big Sci. 1, 2 (2017).
- Chen and Guestrin [2016] T. Chen and C. Guestrin, XGBoost: A scalable tree boosting system, in Proceedings of the 22nd ACM SIGKDD International Conference on Knowledge Discovery and Data Mining, KDD ’16 (ACM, New York, NY, USA, 2016) pp. 785–794.
- Akai et al. [2018] K. Akai, K. Furukawa, and H. Koiso (SuperKEKB), SuperKEKB Collider, Nucl. Instrum. Methods Phys. Res., Sect. A 907, 188 (2018), arXiv:1809.01958 [physics.acc-ph] .
- Abudinén et al. [2020a] F. Abudinén et al. (Belle II Collaboration), Measurement of the integrated luminosity of the Phase 2 data of the Belle II experiment, Chin. Phys. C 44, 021001 (2020a), arXiv:1910.05365 [hep-ex] .
- Aubert et al. [2005] B. Aubert et al. (BaBar Collaboration), A measurement of the total width, the electronic width, and the mass of the resonance, Phys. Rev. D 72, 032005 (2005), arXiv:hep-ex/0405025 .
- Sjöstrand et al. [2015] T. Sjöstrand, S. Ask, J. R. Christiansen, R. Corke, N. Desai, P. Ilten, S. Mrenna, S. Prestel, C. O. Rasmussen, and P. Z. Skands, An Introduction to PYTHIA 8.2, Comput. Phys. Commun. 191, 159 (2015), arXiv:1410.3012 [hep-ph] .
- Lange [2001] D. J. Lange, The EvtGen particle decay simulation package, Nucl. Instrum. Methods Phys. Res., Sect. A 462, 152 (2001).
- Jadach et al. [2000] S. Jadach, B. F. L. Ward, and Z. Was, The Precision Monte Carlo event generator for two fermion final states in collisions, Comput. Phys. Commun. 130, 260 (2000), arXiv:hep-ph/9912214 .
- Jadach et al. [1991] S. Jadach, B. F. L. Ward, and Z. Was, TAUOLA: A Library of Monte Carlo programs to simulate decays of polarized tau leptons, Comput. Phys. Commun. 64, 275 (1991).
- Barberio and Was [1994] E. Barberio and Z. Was, PHOTOS: A Universal Monte Carlo for QED radiative corrections. Version 2.0, Comput. Phys. Commun. 79, 291 (1994).
- Kuhr et al. [2019] T. Kuhr, C. Pulvermacher, M. Ritter, T. Hauth, and N. Braun (Belle II Framework Software Group), The Belle II Core Software, Comput. Software Big Sci. 3, 1 (2019), https://doi.org/10.5281/zenodo.6949513, arXiv:1809.04299 [physics.comp-ph] .
- Agostinelli et al. [2003] S. Agostinelli et al. (GEANT4 Collaboration), GEANT4: A Simulation toolkit, Nucl. Instrum. Methods Phys. Res., Sect. A 506, 250 (2003).
- Aubert et al. [2007] B. Aubert et al. (BaBar Collaboration), Evidence for the and decays and Study of the Decay Dynamics of Meson Decays into final states, Phys. Rev. D 76, 092004 (2007), arXiv:0707.1648 [hep-ex] .
- Lees et al. [2012] J. P. Lees et al. (BaBar Collaboration), Study of violation in Dalitz-plot analyses of , , and , Phys. Rev. D 85, 112010 (2012), arXiv:1201.5897 [hep-ex] .
- Czyż et al. [2013] H. Czyż, M. Gunia, and J. H. Kühn, Simulation of electron-positron annihilation into hadrons with the event generator PHOKHARA, JHEP 08, 110, arXiv:1306.1985 [hep-ph] .
- Choudhury et al. [2023] S. Choudhury et al. (Belle Collaboration), Measurement of the production ratio in collisions at the resonance using decays at Belle, Phys. Rev. D 107, L031102 (2023), arXiv:2207.01194 [hep-ex] .
- Abe [2010] T. Abe (Belle II Collaboration), Belle ii technical design report 10.48550/arXiv.1011.0352 (2010), arXiv:1011.0352 .
- Bertacchi et al. [2021] V. Bertacchi et al. (Belle II Tracking Group), Track finding at Belle II, Comput. Phys. Commun. 259, 107610 (2021), arXiv:2003.12466 [physics.ins-det] .
- Keck et al. [2019] T. Keck et al., The Full Event Interpretation, Comput. Softw. Big Sci. 3, 6 (2019), arXiv:1807.08680 [hep-ex] .
- Abudinén et al. [2020b] F. Abudinén et al. (Belle II Collaboration), Measurement of the tracking efficiency and fake rate with events, BELLE2-NOTE-PL-2020-014 (2020b).
- Svidras [2023] H. Svidras, Measurement of the photon energy spectrum in inclusive radiative B meson decays using the hadronic-tagging method, Ph.D. thesis, Hamburg, University of Hamburg, Hamburg (2023), see pages 125-126 of https://ediss.sub.uni-hamburg.de/handle/ediss/10177.
- Ed. A. J. Bevan, B. Golob, Th. Mannel, S. Prell, and B. D. Yabsley [2014] Ed. A. J. Bevan, B. Golob, Th. Mannel, S. Prell, and B. D. Yabsley, The Physics of the Factories, Eur. Phys. J. C74, 3026 (2014), see Chapter 9 Background suppression for decays, arXiv:1406.6311 [hep-ex] .
- Fox and Wolfram [1979] G. C. Fox and S. Wolfram, Event Shapes in Annihilation, Nucl. Phys. B 149, 413 (1979), [Erratum: Nucl.Phys.B 157, 543 (1979)].
- Lee et al. [2003] S. H. Lee et al. (Belle Collaboration), Evidence for , Phys. Rev. Lett. 91, 261801 (2003), arXiv:hep-ex/0308040 .
- Brandt et al. [1964] S. Brandt, C. Peyrou, R. Sosnowski, and A. Wroblewski, The principal axis of jets — an attempt to analyze high-energy collisions as two-body processes, Phys. Lett. 12, 57 (1964).
- Farhi [1977] E. Farhi, Quantum Chromodynamics Test for Jets, Phys. Rev. Lett. 39, 1587 (1977).
- Abudinén et al. [2020c] F. Abudinén et al. (Belle II Collaboration), A calibration of the Belle II hadronic tag-side reconstruction algorithm with decays, (2020c), arXiv:2008.06096 [hep-ex] .
- Martschei et al. [2012] D. Martschei, M. Feindt, S. Honc, and J. Wagner-Kuhr, Advanced event reweighting using multivariate analysis, J. Phys. Conf. Ser. 368, 012028 (2012).
- Prim [2020] M. Prim, b2-hive/effort v0.1.0 (2020), https://doi.org/10.5281/zenodo.3965699.
- Pivk and Le Diberder [2005] M. Pivk and F. R. Le Diberder, SPlot: A Statistical tool to unfold data distributions, Nucl. Instrum. Meth. A 555, 356 (2005), arXiv:physics/0402083 .
- Heinrich et al. [2022] L. Heinrich, M. Feickert, and G. Stark, scikit-hep/pyhf: v0.7.0 (2022), https://doi.org/10.5281/zenodo.7110486.
- Adachi et al. [2023] I. Adachi et al. (Belle II Collaboration), First measurement of as an inclusive test of the anomaly, (2023), arXiv:2311.07248 [hep-ex] .
- Fawcett [2006] T. Fawcett, An introduction to ROC analysis, Pattern Recognition Letters 27, 861 (2006).
- Skwarnicki [1986] T. Skwarnicki, A study of the radiative CASCADE transitions between the Upsilon-Prime and Upsilon resonances, Ph.D. thesis, Cracow, INP (1986).
Appendix A List of BDT parameters and input variables
A.1 Inclusive Tag Analysis
Table 3 presents the parameters that are used to train the classifiers and of the ITA. Furthermore, all input variables are listed below. Unless otherwise specified, all variables are measured in the laboratory frame. Each variable is used in , , or in both BDTs as specified in parentheses. The variable selection is done by iteratively removing variables from the training and checking the impact of their removal on the binary classification performance, measured with the area under the receiver operating characteristic curve [47].
| Parameter | Value |
|---|---|
| Number of trees | 2000 |
| Tree depth | 2 (BDT1), 3 (BDT2) |
| Shrinkage | 0.2 |
| Sampling rate | 0.5 |
| Number of bins | 256 |
For a given track, the point of closest approach (POCA) is defined as the point on the track that minimizes the distance to a line passing through the average interaction point (IP) and parallel to the axis, defined as the symmetry axis of the solenoid.
The transverse impact parameter is defined as this minimal distance and the longitudinal impact parameter is defined as the coordinate of the POCA with respect to the average interaction point [32].
Variables related to the kaon candidate are as follows:
-
(i)
radial distance between the POCA of the candidate track and the IP (BDT2),
-
(ii)
cosine of the angle between the momentum line of the signal-kaon candidate and the axis (BDT2).
Variables related to the kaon candidate do not include , because the data are binned in this variable and in in the last stage of the analysis.
Variables related to the tracks and energy deposits of
the rest of the event (ROE) are as follows:
-
(i)
two variables corresponding to the and components of the vector from the average interaction point to the ROE vertex (BDT2),
-
(ii)
-value of the ROE vertex fit (BDT2),
-
(iii)
variance of the transverse momentum of the ROE tracks (BDT2),
-
(iv)
polar angle of the ROE momentum (BDT1, BDT2),
-
(v)
magnitude of the ROE momentum (BDT1, BDT2),
-
(vi)
a modified Fox-Wolfram moment of the “oo” type (see Ref. [36]), i.e., ROE-ROE, calculated in the c.m. frame (BDT1, BDT2),
-
(vii)
difference between the ROE energy in the c.m. frame and the energy of one beam in the c.m. frame () (BDT1, BDT2).
Variables related to the entire event are as follows:
-
(i)
number of and candidates (BDT2),
-
(ii)
number of photon candidates, number of charged particle candidates (BDT2),
-
(iii)
square of charged particles in the event (BDT2),
-
(iv)
cosine of the polar angle of the thrust axis in the c.m. frame (BDT1, BDT2),
-
(v)
harmonic moments with respect to the thrust axis in the c.m. frame [37] (BDT1, BDT2),
-
(vi)
modified Fox-Wolfram moments calculated in the c.m. frame [38] (BDT1, BDT2),
-
(vii)
polar angle of the missing three-momentum in the c.m. frame (BDT2),
-
(viii)
square of the missing invariant mass (BDT2),
-
(ix)
event sphericity in the c.m. frame [36] (BDT2),
-
(x)
normalized Fox-Wolfram moments in the c.m. frame [37] (BDT1, BDT2),
-
(xi)
cosine of the angle between the momentum of the signal-kaon and the ROE thrust axis in the c.m. frame (BDT1, BDT2),
-
(xii)
radial and longitudinal distance between the POCA of the candidate track and the tag vertex (BDT2).
Variables related to the suppression
candidates are obtained by fitting the kaon candidate track and each track of opposite charge in the ROE to a common vertex; candidates are obtained by fitting the kaon candidate track and two ROE tracks of appropriate charges. In both cases, we choose the candidate having the best vertex fit quality. The related variables are as follows:
-
(i)
radial distance between the chosen candidate vertex and the IP (BDT2),
-
(ii)
of the chosen candidate vertex fit and the best candidate vertex fit (BDT2),
-
(iii)
mass of the chosen candidate (BDT2),
-
(iv)
median -value of the vertex fits of the candidates (BDT2).
A.2 Hadronic Tag Analysis
BDTh parameters, reported in Tab. 4, are optimized based on a grid search in the parameter space. The following 12 variables are used as input:
-
(i)
sum of extra-photon energy deposits in ECL,
-
(ii)
number of extra tracks,
-
(iii)
sum of the missing energy and absolute missing three-momentum vector,
-
(iv)
azimuthal angle between the signal kaon and the missing-momentum vector,
-
(v)
cosine of the angle between the momentum direction of the signal-kaon candidate, and the thrust axis of the particles comprising the , the extra tracks, and the extra photons,
-
(vi)
modified Fox-Wolfram moments , , ,
-
(vii)
invariant mass of of the four-momentum difference between the two colliding beams and the signal kaon,
-
(viii)
signal probability for the returned by the FEI algorithm,
-
(ix)
-value of the vertex fit of the signal kaon and one or two tracks in the event to reject fake kaons coming from or decays.
| Parameter | Value |
|---|---|
| Number of trees | 1300 |
| Tree depth | 3 |
| Shrinkage | 0.03 |
| Sampling rate | 0.8 |
| Number of equal-frequency bins | 256 |
Appendix B Studies of the pion-enriched sample in the ITA
The pion-enriched sample in the ITA is chosen by applying the selection criteria for the SR of the nominal analysis, with the PID requirement for the signal candidate suitably adjusted. The simulated samples are corrected for known data-to-simulation discrepancies for the pion identification and kaon-to-pion as well as lepton-to-pion fake rates. The modeling of the continuum background is improved using BDTc, which is taken from the nominal analysis without re-training. The normalization of the continuum background is determined using the off-resonance data sample and is found to be compared to the expectations from simulation. Simulated -meson samples are divided into two subsamples based on the presence of a meson in the decay chain associated with the signal pion, where the meson’s decay products include a meson. They are normalized using the number of the pairs collected by Belle II.
Figure 10 shows the distribution in data and simulation.
A discrepancy in the data-to-simulation ratio is observed when the normalization factors described above are used, as can be seen from the left panel of the figure. The variable corresponds to the invariant mass squared of the system recoiling against the candidate pion in the decay.
The data-to-simulation ratio is below unity below the threshold of the -meson mass and above unity beyond the threshold.
For , which is dominated by continuum background, the data is below the simulation, suggesting that the scale factor determined based on the off-resonance sample is overestimated. A binned sample-composition fit is performed to this distribution to determine the normalization of the three components.
In this fit, the sample of -meson decays containing -mesons with in the decay chain is allowed to vary without constraints, while the complementary -meson decay sample is constrained by the uncertainty associated with the number of pairs. The uncertainty on the continuum normalization is taken to be , as in the nominal fit. The result of this fit is shown in the right panel of the figure, and shows a much improved data-to-simulation ratio. The shift in the normalization factor for the sample including decays is found to be : this shift is used in the nominal analysis. The normalization factor for the sample without mesons involving is consistent with the expectations to within standard deviations, while the normalization for the continuum background is reduced by and is therefore closer to the expectation from the simulation.
The difference in the continuum normalization based on the off- and on-resonance data from this fit motivates the systematic uncertainty on the off-resonance sample normalization applied in the nominal analysis.
Appendix C Reconstruction of and control decay channels
Reconstruction of and decay channels utilizes the selection adapted for the main analysis. The candidates are reconstructed using the decay mode, and a multivariate classifier is employed to enhance sample purity. The signal region is defined by requiring and . The average multiplicity of candidates is about 1.5 for this selection. In cases where multiple candidates are found, a single candidate per event is randomly selected. For the less pure decay, the input variables and classifier parameters are set to the same values as those used for in the nominal measurement. For the decay, variables and parameters are utilized. Less stringent criteria on the output of the classifiers are applied and checked using simulated signal samples to ensure approximately constant efficiency as a function of and for each decay, respectively.
The signal is extracted by an unbinned maximum likelihood fit to the distribution. For the decay, a Gaussian distribution is used to model the signal. For the decay, the signal is modeled by a sum of two Crystal Ball functions [48] plus a sum of two Gaussian distributions with the shape of the model fixed by the simulation and the total width allowed to vary in the fit to data. The background is modeled by a second-order Chebyshev polynomial in both cases.