Rotary Excitation of peak-like magnetic field fluctuations: Towards non-invasive direct detection of cardiac conduction
| Address for correspondence: | Petra Albertová, Experimental Physics 5, |
| Faculty of Physics and Astronomy | |
| University of Würzburg | |
| Am Hubland, Würzburg, D-97074 | |
| petra.albertova@uni-wuerzburg.de |
| Author’s ORCID: | Petra Albertova: | orcid.org/0000-0003-3646-7019 |
| Maximilian Gram: | orcid.org/0000-0003-2184-3325 | |
| Martin Blaimer: | orcid.org/0000-0002-6360-9871 | |
| Wolfgang R. Bauer: | orcid.org/0000-0002-4652-7313 | |
| Peter Nordbeck: | orcid.org/0000-0002-2560-4068 |
Abstract
Purpose
In the recent past, spin-locking MRI experiments were successfully applied for the direct detection of sinusoidal magnetic field oscillations in the sub-nT range. In the present study, this detection approach was generalized to non-sinusoidal magnetic peaks based on the Rotary Excitation (REX) mechanism.
Methods
The new detection concept was examined by means of Bloch simulations, evaluating the interaction effect of spin-locked magnetization and low-frequency field variations. The REX detection approach was validated under controlled conditions in phantom experiments at 3 T. Gaussian and Sinc shaped stimuli were investigated. In addition, the detection of artificial fields resembling a cardiac QRS complex, which is the most prominent peak visible on an magnetocardiogram, was tested.
Results
Bloch simulations demonstrated that the REX method has a high sensitivity to magnetic fluctuations in the resonance case, which is met when the spin-lock frequency coincides with a non-zero Fourier component of the stimulus field. In the experiments, we found that magnetic stimuli of different durations and waveforms can be distinguished by their characteristic REX response spectrum. The detected REX amplitude was proportional to the stimulus amplitude (R0.99) and the lowest field detection was 1 nT. Furthermore, QRS-like fields could be distinguished based on their QRS duration in a phantom setup.
Conclusion
REX detection can be generalized to non-sinusoidal, peak-like fields and could provide a noninvasive, quantitative tool for spatially resolved assessment of cardiac conduction. Potential applications include the direct detection and characterization of cardiac fields.
Key words: spin-lock, rotary excitation, REX, biomagnetism, , MCG
Submitted to Magnetic Resonance in Medicine
Introduction
Magnetic field sensing is one of the oldest issues in MRI and is required, for example, for in situ initialization of the passive and active shim setup [1]. For field mapping, Hall sensors, which detect the field amplitude, or highly sensitive NMR magnetometers, which allow the field strength to be calculated from a spatially resolved detection of the Larmor frequency, can be used [2, 3]. Field inhomogeneities originating from susceptibilities are mapped in phantoms or in vivo using gradient echo sequences, in order to calibrate higher spherical harmonics of the active shim or to improve image reconstruction [4]. Here, a static field deviation is attributed to an observation of phase evolution of transverse magnetization. The achieved sensitivity is typically in the sub-ppm range with respect to the main magnetic field, corresponding to a detection accuracy below 1 T [5, 6].
For basic physiological and medical research, varying biomagnetic fields intrinsically occurring in the human body hold great interest [7]. Examples are neuronal and cardiac fields, which are so far measured by Magnetoencephalography (MEG) or Magnetocardiography (MCG) [8, 9, 10, 11]. Although these modalities realize detections in the pT range, a major drawback is the limited spatial resolution compared to MRI. For direct and spatially resolved detection via MRI, the sensitivity as well as the low-frequency nature of biomagnetic activity has been the major challenge so far [12]. Since the sensitivity of clinical MRI scanners is fixed by the strength of the main magnetic field to processes in the MHz range, a mechanism of interaction other than resonant excitation in a quantum mechanical two-level system needs to be employed. Moreover, techniques that detect static fields via gradient echoes are unsuitable because time varying fields might lead to cancellation of the observed phase evolution [13].
In 2008, an innovative approach for MRI based detection of oscillating fields was published by Witzel et al. [14]. The main idea is to establish sensitivity at another frequency besides the Larmor frequency by applying a spin-lock (SL) pulse. A SL pulse is a resonant continuous wave pulse, which is applied parallel to the transverse magnetization [15, 16]. In this condition, spin-locking introduces a second resonance frequency adjustable by the SL field strength. If the frequency of a field oscillation (stimulus) matches the SL frequency, resonant energy absorption induces a torsion of the spin-locked magnetization [17, 18]. This phenomenon is called Rotary Excitation (REX) and was recently trialed for imaging alpha activity [19] and has been proven by our group to yield in vivo sensitivity down to at least 1 nT [20].
To this point, all proposed methods were designed in view of sinusoidal oscillatory magnetic fields [14, 19, 21], since neural fields in activated cortical regions arise from periodic activation at cellular level [22]. Although remarkable sensitivities have been demonstrated in previous studies, so far only pure sinusoidal fields were detected, which severely limits possible applications. In the present study, we describe a generalization of the REX method towards detection of magnetic waveforms of arbitrary shape, including pulsated, peak-like fields. This opens up a wide range of applications of REX detection for other sources of biomagnetism, such as cardiac fields or signals of the peripheral nervous system. In our work, we introduce a novel SL detection concept using Bloch simulations and prove the feasibility in phantom experiments.
Methods
In the following section, we first explain the concept of generalized REX detection. We focus on the detection of magnetic stimuli with non-sinusoidal shape, such as Gaussian and Sinc peaks as well as QRS-like fields, which emulate the most prominent peak visible on both a magnetocardiogram and an electrocardiogram. Subsequently, the performed Bloch simulations and the conducted phantom experiments are described. All measurements were performed on a clinical 3.0 T scanner (MAGNETOM Skyra, Siemens Healthineers, Erlangen, Germany).
Concept of generalized REX detection
The concept of SL based detection of sinusoidal fields has recently been explained in Gram et al. [20]. A magnetic stimulus with frequency induces Rotary Excitation of transverse magnetization if a SL pulse with a field amplitude matching the stimulus frequency according to is present. Here, denotes the gyromagnetic ratio. In this resonant case, the magnetization, previously initialized as pure spin-lock component on the axis of the rotating reference frame, is partially converted to spin-tip components in the plane. A detection is performed by imaging the projection. If the timing of the stimulus varies relative to the SL pulse, a detection can be attributed to an observation of a varying component.
For the generalization of REX detection for non-sinusoidal stimuli, we set up three postulates:
-
I)
Peak-shaped magnetic stimuli act like a punctual Rotary Excitation stimulus in the SL state.
-
II)
Rotary Excitation arises if a magnetic peak has a significant component in Fourier space which matches the SL frequency.
-
III)
The resulting REX prepared magnetization depends on the relative timing of the interaction between SL and stimulus.
Similar to the conventional REX experiment employing a sinusoidal stimulus, the fact that the prepared REX magnetization depends on the relative phase is utilized for detection [17, 18, 19]. For peak-like stimuli, the timing of the stimulus must be varied relative to the SL pulse. In this case, we expect variation of the measured projection and a dependence of the effect on the adjusted SL amplitude. Accordingly, a detection experiment requires observation of several interactions of a magnetic fluctuation in the SL state. In order to obtain reasonable interaction timings for detection of peak-like stimuli with durations , we employ the following SL preparation times (Fig. 1):
| (1) |
The SL pulse has to be at least as long as the stimulus to be detected. The interval is used for varying the timing of field interaction relative to the SL pulse and provides possible interaction timings causing a full 2 relative phase variation. In analogy to a sinusoidal stimulus, the interaction time can be expressed by a phase shift.
| (2) |
Bloch simulations
The proposed magnetic peak detection concept was investigated by means of Bloch simulations. For the simulation of the interaction in the SL state, the following model was considered, assuming a SL pulse in the direction of the rotating reference frame and neglecting the influence of the SL field on the thermal equilibrium state [23]:
| (3) |
Here, and are the rotating frame relaxation times, the gyromagnetic ratio and is the time-dependent stimulus amplitude. The solution to the system of nonlinear differential equations for the magnetization trajectory was determined numerically by Runge-Kutta integration (4th order, RK4, time steps s) in Matlab (R2022a, The MathWorks Inc., Natick, Massachusetts, USA). For simulating REX detection, the magnetization was calculated for ten different interaction timings. Analogous to conventional SL based field detection for oscillating magnetic fields, the standard deviation of the REX signal was used as the measure of detection and is referred to as the REX amplitude .
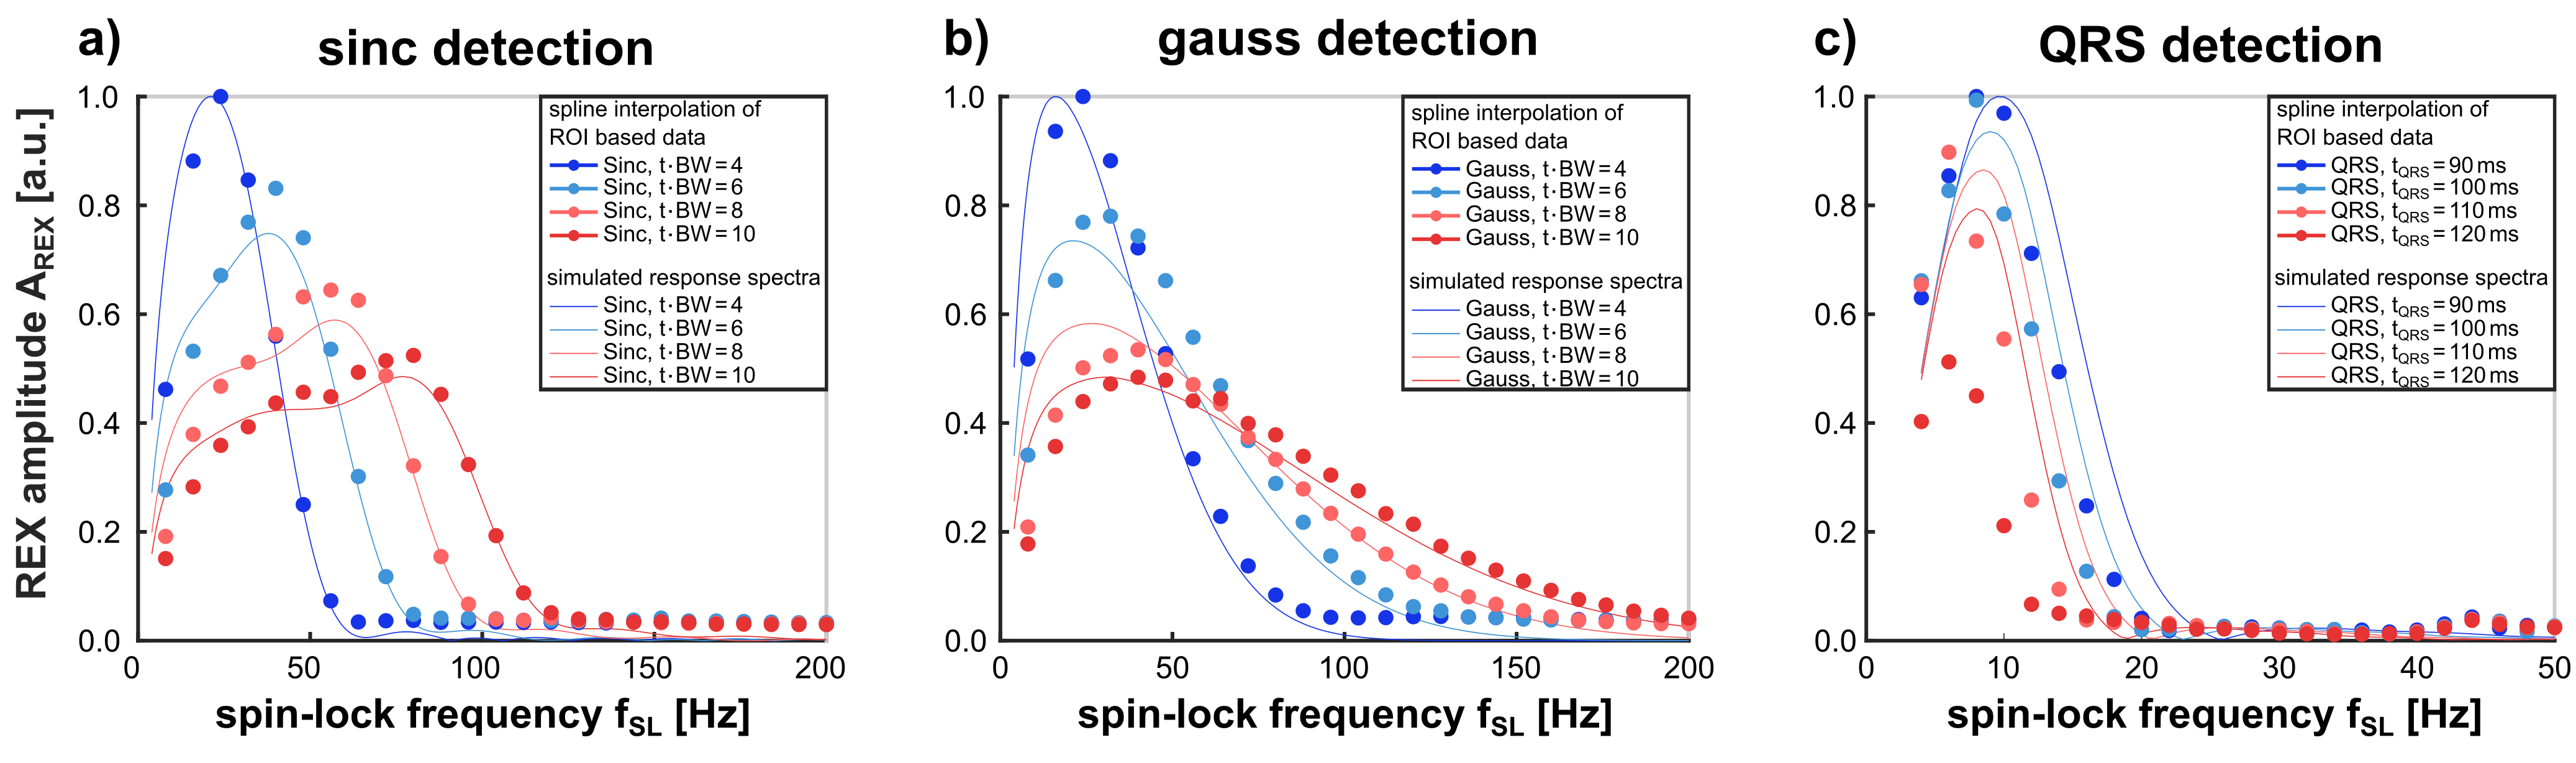
Three different magnetic stimuli were investigated (Fig. 2a). Gaussian and Sinc fluctuations rely on simple mathematical modeling and were calculated analogously to the envelope of RF waveforms [24, 25]. Here, a duration of ms was used. To vary shape and spectral characteristics, Gauss and Sinc shaped fields with different time-bandwidth products (t BW = 4…10) were considered. Furthermore, QRS-like fields were modeled from Magnetocardiography data sets [26]. The QRS complex corresponds to the left and right ventricular depolarization of the heart and is the most pronounced shape visible in an Electrocardiogram, consisting of a negative deflection (Q) and a central peak (R) followed by a dip (S). It indicates the propagation of an electrical impulse through the conducting Purkinje fibers and ventricular contraction [27]. Here, considerably longer durations were investigated compared to the other stimuli. Shape or spectral characteristics were varied by adjusting the QRS duration ( ms) of the modeled QRS complex. An analysis of the spectral characteristics was performed for all examined stimuli by determining the power spectral density of their Fourier transforms. Generalized REX detection was simulated for each stimulus for different SL amplitudes in order to investigate the response and specificity of the REX effect. For this purpose, was varied in the range 4…200 Hz with a step size of 0.5 Hz (QRS: 4…100 Hz, step size 0.5 Hz). To consider the impact of relaxation, simulations were performed with and without consideration of relaxation effects (Eq. 3). Relaxation times ms and ms were assumed based on experimental data from the phantom in use.
Phantom experiments
For experimental validation, a spherical phantom (diameter 17.5 cm) of demineralized water doped with 1.25 g/L NiSO4 was used. A SL preparation module followed by interleaved spiral readouts for image acquisition (4 interleaves, TR = 1 s, Nx = Ny = 128, FOV = 240 x 240 mm2) was implemented in Pulseq [24] and a corresponding repository will be made available on GitHub. The sequence diagram is illustrated in Fig. 1. The magnetization is initialised by an adiabatic-half-passage 90° excitation pulse (AHP, hyperbolic secant shape, duration 3 ms). Adiabatic pulses are used for this purpose in order to ensure uniform excitation unaffected by inhomogeneities [28]. The magnetic stimulus fields (t) were generated as proposed in [20] using the concept of transmission of Rotary EXcitation (tREX) by the built-in gradient system (max. gradient 45 mT/m, max. slew rate 200 T/m/s) in an offcenter slice (|z| = 15 mm). Subsequently, crusher gradients were applied after tREX interaction to dephase remaining transverse magnetization and to achieve imaging of the magnetization. Signal acquisition was carried out with a 20-channel receive head-neck array (Siemens Healthineers, Erlangen, Germany).
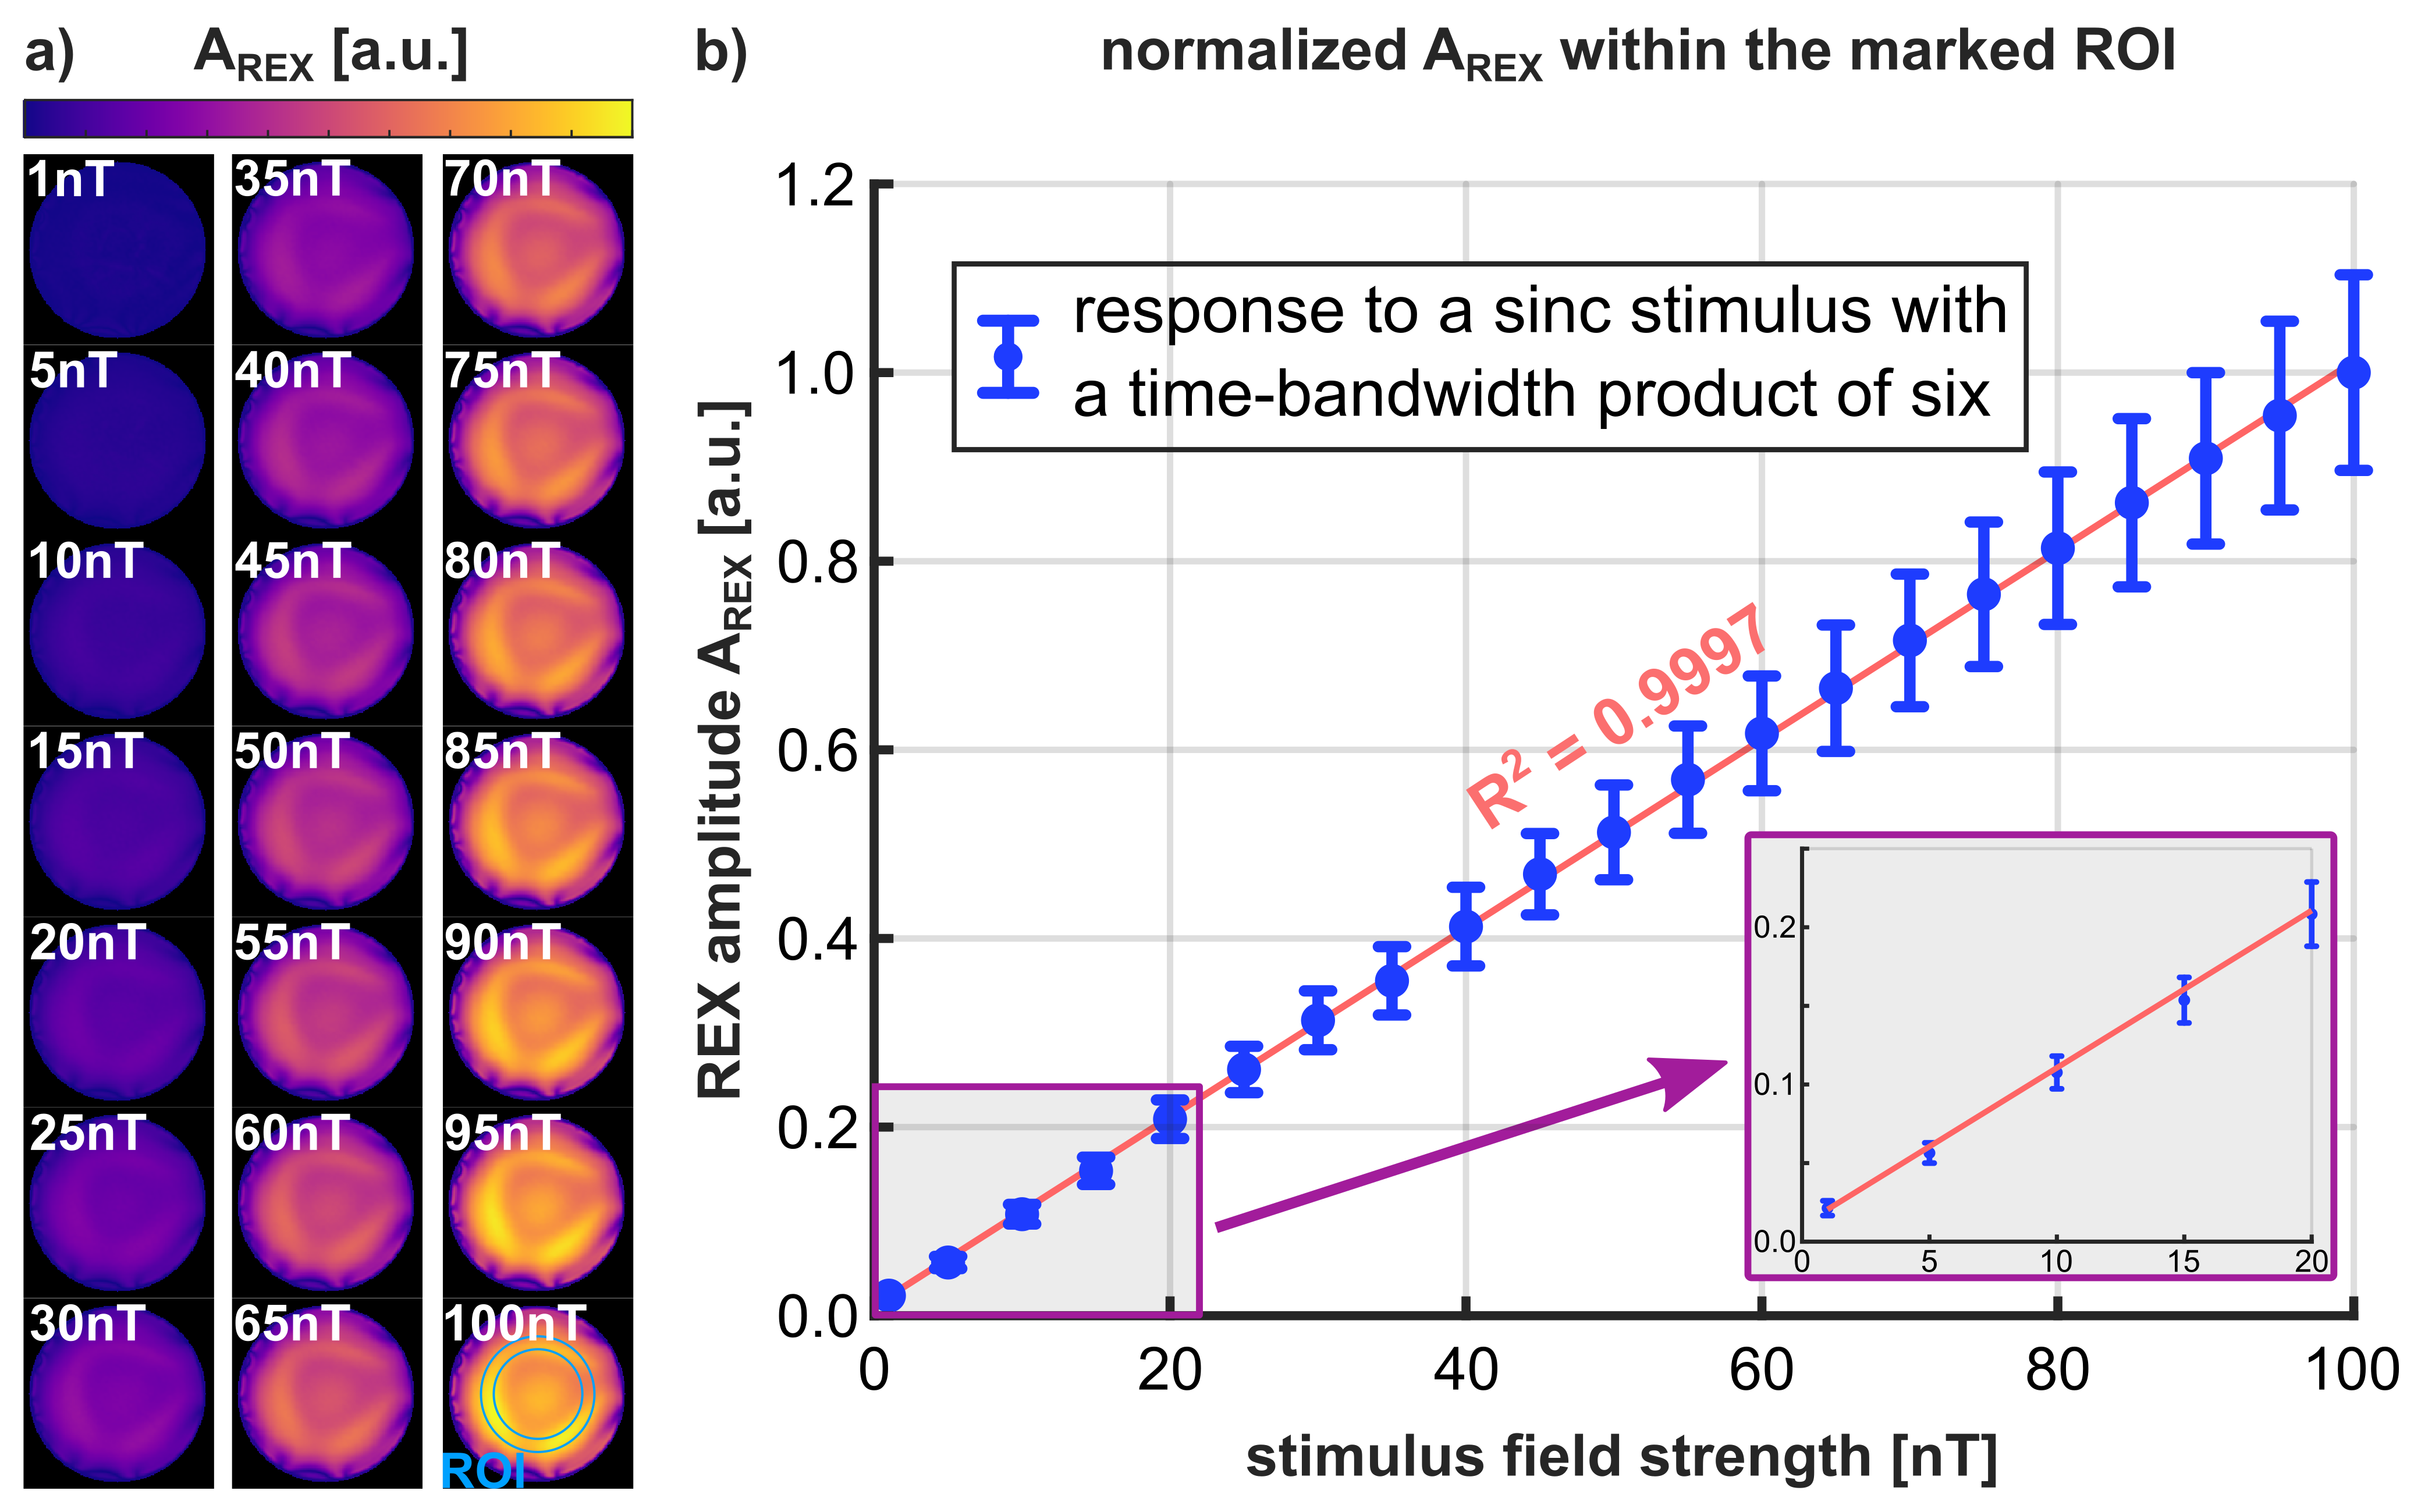
In order to verify the occurrence of the REX effect in case of an interaction with a magnetic peak, first experiments with a Sinc shaped stimulus with duration ms, tBW = 6 and peak amplitude 100 nT were performed. The SL pulse duration was ms. The SL pulse amplitude was set to Hz. This choice was based on the analysis of the power spectral density of the stimulus, which shows maximum values for 40 Hz (Fig. 2b). Consequently, we expect to observe the largest REX effect for this parameter choice fulfilling resonance condition. For detection, 10 different interaction timings in the range 25…50 ms were investigated and was determined from the standard deviation of the measured signals (Fig. 1). Furthermore, in analogy to the simulations, the REX response spectrum was measured by performing an additional variation of the SL amplitude for each stimulus type. For this purpose, REX scans with in the range 8…200 Hz (step size 8 Hz) (QRS: 4…50 Hz, step size 2 Hz) were conducted. In order to obtain a result that is as unaffected as possible by static and deviations, field maps were acquired using the WASABI method [29]. Based on these field maps, a region with low field deviations (Hz, ) was selected for evaluation of the REX signal. The measured REX spectra were compared with the power spectral density of the respective Fourier transforms, as well as with the simulation results. Finally, the influence of the magnitude of the magnetic peak on the REX detection was investigated in the phantom experiment. For this purpose, the Sinc stimulus with tBW = 6 was scaled to obtain peak field strength values of 1…100 nT and measurements were performed in the REX resonance condition.
Results
Bloch Simulations
Figure 1b illustrates an exemplary simulated magnetization component for the interaction with a Sinc stimulus. It can be clearly recognized that the magnetic peak causes a twist of the magnetization. The timing of the interaction during spin-locking significantly determines the final prepared magnetization. It was further visualized what effect the identical stimulus produces at a significantly higher SL amplitude. Here, approximately zero components are obtained, indicating that REX resonance condition was not met.
In Figures 2a and 2b, the signal waveforms and their corresponding power spectral densities are depicted for all stimulus types. In addition, an oscillating stimulus was compared. The sinusoidal waveform has mainly a single Fourier component, however, several sidelobes are present in the power spectral density. Gauss, Sinc and QRS types, on the other hand, have more complex spectral characteristics. While Gauss peaks produce Gauss peaks in Fourier space, a Sinc is approximated by a rectangle. The FWHM values, indicating the frequency range in which the resonance condition can be met, are Hz (Gauss) and Hz (Sinc) for ms at tBW = 6. The global maximum of Sinc is Hz. The QRS fields tend to lower frequency components due to their longer durations. A maximum occurs at Hz for ms and Hz for ms.
Figure 2c displays the results of the simulated REX response. The REX effect arises if a magnetic stimulus has a significant component in Fourier space matching the SL frequency. It can be noticed that there is a high correlation between REX response and the power spectral density. If relaxation effects are additionally considered in the Bloch simulation (Fig. 3), the linear correlation does not hold for all . Since higher preparation times are required at low , relaxation is particularly relevant. Consequently, lower REX amplitudes are detected.
Phantom experiments
The acquired REX based contrast images of Sinc peak detection are depicted in Figure 4. Just as in the conventional oscillation detection experiment, a sinusoidal variation of the REX contrast can be observed, but here the interaction timing dictates the contrast. If the interaction time varies by , which corresponds to a relative phase shift (Eq. 2), the REX signal traverses a full period (Fig. 4b). In the phantom experiment, the time of the interaction is precisely known and adjustable. Hence, it is possible to use a sinusoidal function to perform regression analysis of the contrast images.
| (4) |
Before calculating the pixel wise fit, an offset correction was performed by subtracting the complex mean of the REX signal in each pixel. The resulting map has a high structural similarity with the standard deviation map scaled by the factor . Yet, the amplitude values are slightly higher than for the detection map obtained via the fit function in a global region of interest (ROI). The values are in general high and amount to averaged over the entire phantom, which proves that the REX effect could be significantly detected.
Figure 5 shows the results of the measured REX response spectra. In addition, corresponding simulation results with inclusion of relaxation effects were compared. For all stimulus types, the measured data agree well with the simulated courses. It must be taken into account that simulation and measurement data were normalized to their global maximum value. Clear deviations from the simulation result occur for high spin-lock amplitudes. Here, higher REX amplitudes were detected than predicted by the simulation. Nevertheless, it becomes apparent that different stimuli can be significantly distinguished via the acquisition of the REX response. Different types of stimuli (Gauss, Sinc, QRS) as well as their variations in time bandwidth or QRS duration can be identified. The experimentally determined REX amplitude is lower than the simulated amplitude for a QRS duration of 120 ms.
The detection experiments with different stimulus field strengths are presented in Figure 6. A variation of the peak amplitude between 1…100 nT shows a linear increase of with an exceeding 0.99. For the evaluation, data within the marked ROI were used, which yielded a small deviation in the map of less than 5 Hz and a deviation of the field of maximum 5 %. The standard deviation within this ROI increases with the REX amplitude.
Discussion
In this work, a new detection concept has been introduced that employs spin-locking to realize MRI-based imaging of ultra-small and low-frequency peak-like magnetic field variations. The approach for the detection of sinusoidal oscillations originally published by Witzel et al. was combined with the concept of Rotary Excitation and extended as well as generalized to non-sinusoidal fluctuations [14, 20].
We introduced basic postulates for generalized REX detection. We were able to validate these to a large extent by Bloch simulations and phantom experiments and found similarities as well as differences to the interaction with sinusoidal fields. Whereas a field oscillation in the resonance condition permanently interacts with the magnetization and continuously leads to the REX effect, a magnetic peak acts like a punctual force. A resonance condition can also be formulated for absorption of peaks, but the condition is less sharply defined since the spectral characteristics of peak-like fluctuations are more complex and are described in Fourier space by a broad spectrum of frequencies. Nevertheless, we could prove that REX detection is possible if the SL pulse is adjusted with a frequency given a substantial component of the Fourier transform of the investigated peak is met. The major difference from the detection of oscillations is that the relative phase between SL and stimulus is replaced by the relative timing of the interaction with the peak center. For this reason, we carried out our simulations and experiments with SL preparation times customized to the interaction timings.
The results of the Bloch simulations demonstrated that the expected REX amplitude depends on the power spectral density of the stimulus at the frequency set by the SL pulse. By comparing REX response spectra simulated with and without relaxation, the impact of relaxation was assessed in isolation. The deviation is most obvious at low SL amplitudes, since experiments with lower SL frequencies are performed with higher SL pulse durations. Due to the increased influence of relaxation processes during longer SL durations, the REX effect is attenuated leading to reduced detection amplitudes. This disturbs the linear correlation between spectral power and REX response. Accordingly, the effective optimum for successful detection can be shifted to higher SL amplitudes. The loss of REX signal due to relaxation thus leads to an overall problem for detection experiments with small SL amplitudes. Nevertheless, the simulation results were able to proof that the acquisition of REX response spectra enable a characterization of magnetic stimuli.
Experimental validation was performed in this work in a phantom setup under controlled conditions. In accordance with the simulated magnetization trajectories, a highly significant variation of the measured REX contrast was observed, which primarily depends on the interaction timing. The pixel wise signal fit produced a high level of agreement with the data. The observed overestimation of the REX amplitude in comparison to the fit result is due to the calculation of the standard deviation over only 10 interaction times. For the specific experimental parameters, this results in an expected overestimation of by 5.4 %, which fits closely to the overestimation of 6.2 % measured experimentally. Despite the fact that the individual pixels showed the expected sinusoidal signal variations with regard to interaction timing, strong banding artifacts could be identified in the individual REX contrast images and the phase (see Eq. 4) also exhibited structural inhomogenieties. Furthermore, spatially dependent REX amplitudes were observed (37 % relative standard deviation), and a radially symmetric distribution was found. The high quality of the fit adjustment over the entire phantom indicates that this variance is not related to data evaluation. The radially symmetrical distribution of values suggests an effect of central brightening typical for field inhomogeneities at 3 T [30]. The susceptibility of SL based field detection to static field inhomogeneities has already been discussed in the literature [20, 31]. For this reason, further evaluations were performed in ROIs with small static field deviations. This issue needs to be addressed in future studies to enable applications involving in vivo peak detection. In the present work, only a simple SL preparation consisting of a single continuous wave pulse was used, which is known to be highly susceptible to static field inhomogeneities [32]. In order to achieve sufficient robustness for in vivo application, adopting compensation ideas developed for quantification might be feasible. Future studies will need to investigate the detection capability of self-compensated SL preparations such as rotary-echo, composite, or balanced spin locking [33, 34, 35].
Examining the REX response spectra, there was a high degree of agreement between the measured values and theoretical predictions. Due to statistical processes and the noise floor of the sequence, a non-zero REX amplitude was measured even without a REX effect taking place (i.e. if no stimulus is present or the resonance condition is not met). In particular, this explains the discrepancy between measured values and simulations for frequencies with a vanishing power spectral density of the stimulus. Nevertheless, clear distinction of different peak shapes such as Gaussian, Sinc and QRS could be achieved based on the measured response spectra. It is particularly noteworthy that not only the different stimulus types, but even their variations could be distinguished. Thus, Gauss and Sinc peaks with time bandwidths 4…10 as well as QRS peaks with QRS durations of 90…120 ms could be characterized and identified by means of acquired REX response. The measured data of the REX response for a QRS-like stimulus, which has a long duration since it is based on a physiological process, are lower im comparison to the simulation. This may be due to a potential field drift occurring during the measurement time which interferes with the SL condition. The amplitude of is largely affected by relaxation, as can be seen by comparing the curves in Figure 3. Accordingly, especially for long SL durations, a deviation of the actual relaxation times from those assumed in the simulation may cause a discrepancy in between the simulation and the measured data.
Another feature of the generalized REX technique for detecting magnetic peaks derives from the linear dependence of the REX amplitude on the stimulus field strength. This linearity was experimentally confirmed for the range between 1…100 nT. In our previous work, we already demonstrated that this circumstance can be exploited, since a linear calibration of the REX effect can be performed using calibrated tREX waveforms, allowing for a quantification of stimulus field strengths [36]. During the calibration process, tREX is applied for emulating the REX effect with two calibrated field strength. A tissue-specific slope of the linear calibration function can then be determined and used to interpret the REX data from subsequent measurements of physiological stimuli. However, for peak quantification, the concept might need extension, since so far only calibrations of oscillations with previously known shape have been performed.
A key finding of the present work was that our new detection concept is also able to detect magnetic peaks similar in pattern to cardiac biomagnetic fields. By means of MCG it is possible to detect fields resulting from cardiac conduction. For this purpose, highly sensitive SQUIDs (superconducting quantum interference devices) or OPMs (optically pumped magnetometers) are typically used [11, 37, 38]. The detected fields are only within the pT range and for investigations magnetically shielded labs are required. However, the specific MCG hardware is rarely available in clinical environments and in addition, there are two other crucial disadvantages associated with MCG. Due to the inverse problem, spatial resolution is strongly limited and the magnetometers perform field detection from a certain distance [7]. In a study on an isolated guinea pig heart, a field of pT was observed from a distance of 15 mm and a field of pT was observed at 5 mm [38]. The major benefit of REX-based field detection is that, on the one hand, the spatial resolution of MRI can be utilized and, on the other hand, the magnetic fields can be sensed at the origin of their source. Therefore, achieving the high sensitivity of magnetometers is not necessary since the decay with distance (inverse square-law) does not apply. Cardiac magnetic fields are estimated to be nT at the origin [39]. In our work, we demonstrated that fields down to 1 nT can be detected, thus the required sensitivity can be achieved. Determination of QRS waveforms might have the potential to provide a tool for direct imaging and characterization of cardiac conduction. Just to give a basic example, QRS durations longer than 110 ms have been shown to be associated with an increased risk of sudden cardiac death in men [40]. According to the measurement of a wide range of QRS durations, REX experiments in the range of 10…25 Hz are particularly suitable for distinguishing QRS fields of different temporal extent. Such field detection experiments could potentially facilitate the non-invasive identification of areas within the myocardium, where pathological changes impair physiological conduction, causing conduction delay and ultimately rhythm disorders.
REX-based detection of biomagnetic fields thus potentially offers fascinating opportunities for clinical applications or basic medical research. A significant advantage compared to electrophysiological examinations using an electrode catheter would be that the properties of the entire mycardium can be examined with a high spatial resolution. In contrast, the spatial resolution of a catheter examination is limited since the point-by-point scanning of the endocardium causes lengthy screenings. In addition, detection is limited to potentials that are tapped at the surface of the heart muscle. Limited conclusions can currently be drawn about processes in the myocardium. In the future, detection of biomagnetic fields using MRI technology may allow for more comprehensive analysis.
However, significant optimizations are still needed to transfer the concept to the demanding in vivo setup. Static field inhomogeneities have to be compensated similar as described previously [20] and in the case of cardiac conduction, a sequence that is triggered prospectively or retrospectively has to be developed and complemented with a suitable cardiac acquisition method. A meaningful intermediate step would be the detection of cardiac fields in the isolated heart as recently shown [38].
Conclusion
In this work, a novel concept of MRI based imaging of ultra-weak and low-frequency peak-like field variations was introduced. The practical feasibility of spatially resolved detection of peak-like magnetic fields with peaktop field strengths in the nT range was demonstrated and high agreement with results from Bloch simulations was found. The acquisition of REX response spectra, performed via variation of the SL amplitude, allows a characterization of magnetic fluctuations regarding their spectral properties. Besides Gauss- and Sinc-shaped fluctuations, QRS-like fields could be detected and distinguished based on their QRS durations. Our work indicates that REX potentially enables direct imaging of cardiac fields and thus may provide a useful tool for noninvasive assessment of cardiac conduction and, ultimately, rhythm disorders.
Acknowledgements
We would like to thank the developers of the open source Pulseq framework, which enabled efficient prototyping in this project. We would further like to thank the EZRT/MRB team of the Fraunhofer Institute Würzburg for the technical support on the MRI system.
Data availability statement
The datasets used and/or analyzed during the current study are available from the corresponding author on reasonable request. An exemplary Pulseq source code for the detection of magnetic peak-like fields will be provided in an open-access Github repository at the time of acceptance of this manuscript (submitted to Magnetic Resonance in Medicine).
Conflict of Interest
The authors declare that they have no competing interests to disclose.
Authors’ contributions
P. Albertova and M. Gram contributed equally to this work; guarantors of integrity of entire study: P. Nordbeck, PM. Jakob; study concepts and study design: all authors; data acquisition: M. Gram, P. Albertova; data analysis: M. Gram, P. Albertova; manuscript drafting and manuscript editing: all authors.
References
[1] Roméo F, Hoult DI. Magnet field profiling: analysis and correcting coil design. Magn Reson Med. 1984 Mar;1(1):44-65. doi: 10.1002/mrm.1910010107
[2] Wang Y, Wang Q, Chen Z, Liu Y, Liu F. A novel passive shimming scheme using explicit control of magnetic field qualities with minimal use of ferromagnetic materials. Magn Reson Med. 2022 Dec;88(6):2732-2744. doi: 10.1002/mrm.29419
[3] Jezzard P. Shim coil design, limitations and implications. In Proceedings of the 14th Annual Meeting of ISMRM, Seattle, WA, 2006
[4] Haskell MW, Nielsen JF, Noll DC. Off-resonance artifact correction for MRI: A review. NMR Biomed. 2023 May;36(5):e4867. doi: 10.1002/nbm.4867
[5] Kanayama S, Kuhara S, Satoh K. In vivo rapid magnetic field measurement and shimming using single scan differential phase mapping. Magn Reson Med. 1996;36(4):637-642.
doi:10.1002/mrm.1910360421
[6] Morrell G, Spielman D. Dynamic shimming for multi-slice magnetic resonance imaging. Magn Reson Med. 1997;38(3):477-483. doi:10.1002/mrm.1910380316
[7] Williamson SJ, KaufmanL, Biomagnetism. J Magn Magn Mater. 1981;22(2):129-201.
doi:10.1016/0304-8853(81)90078-0
[8] Wheless JW, Castillo E, Maggio V, et al. Magnetoencephalography (MEG) and magnetic source imaging (MSI). Neurologist. 2004;10(3):138-153. doi: 10.1097/01.nrl.0000126589.21840.a1
[9] Hämäläinen M, Hari R, Ilmoniemi RJ, Knuutila J, Lounasmaa OV. Magnetoencephalography—theory, instrumentation, and applications to noninvasive studies of the working human brain. Rev Mod Phys. 1993;65(2):413-497. doi: 10.1103/RevModPhys.65.413
[10] Baule G, McFee R. Detection of the magnetic field of the heart. Am Heart J. 1963;66:95-96. doi:10.1016/0002-8703(63)90075-9
[11] Nakaya Y, Mori H. Magnetocardiography. Cli. Phys Physiol Meas. 1992;13(3):191. doi: 10.1088/0143-0815/13/3/001
[12] Bandettini PA, Petridou N, Bodurka J. Direct detection of neuronal activity with MRI: Fantasy, possibility, or reality?. Appl Magn Reson. 2005. 29, 65–88. doi: 10.1007/BF03166956
[13] Kraus RH Jr, Volegov P, Matlachov A, Espy M. Toward direct neural current imaging by resonant mechanisms at ultra-low field. Neuroimage. 2008 Jan 1;39(1):310-317.
doi: 10.1016/j.neuroimage.2007.07.058
[14] Witzel T, Lin FH, Rosen BR, Wald LL. Stimulus-induced Rotary Saturation (SIRS): a potential method for the detection of neuronal currents with MRI. Neuroimage. 2008 Oct 1;42(4):1357-65. doi: 10.1016/j.neuroimage.2008.05.010
[15] Redfield AG. Nuclear magnetic resonance saturation and rotary saturation in solids. Physical Review. 1955. 98:1787-1809. https://doi.org/10.1103/PhysRev.98.1787
[16] Gilani IA, Sepponen R. Quantitative rotating frame relaxometry methods in MRI. NMR Biomed. 2016 Jun;29(6):841-61. doi: 10.1002/nbm.3518
[17] Jiang X, Sheng J, Li H, et al. Detection of subnanotesla oscillatory magnetic fields using MRI. Magn Reson Med. 2016;75(2):519-526. doi:10.1002/mrm.25553
[18] Chai Y, Bi G, Wang L, et al. Direct detection of optogenetically evoked oscillatory neuronal electrical activity in rats using SLOE sequence. Neuroimage. 2016;125:533-543.
doi:10.1016/j.neuroimage.2015.10.058
[19] Truong TK, Roberts KC, Woldorff MG, Song AW. Toward direct MRI of neuro-electro-magnetic oscillations in the human brain. Magn Reson Med. 2019;81(6):3462-3475. doi:10.1002/mrm.27654
[20] Gram M, Albertova P, Schirmer V, et al. Towards robust in vivo quantification of oscillating biomagnetic fields using Rotary Excitation based MRI. Sci Rep. 2022;12(1):15375. Published 2022 Sep 13. doi:10.1038/s41598-022-19275-5
[21] Ueda H, Ito Y, Oida T, Taniguchi Y, Kobayashi T. Detection of tiny oscillatory magnetic fields using low-field MRI: A combined phantom and simulation study. J Magn Reson. 2020;319:106828. doi:10.1016/j.jmr.2020.106828
[22] Lopes da Silva F. Neural mechanisms underlying brain waves: from neural membranes to networks. Electroencephalogr Clin Neurophysiol. 1991;79(2):81-93. doi:10.1016/0013-4694(91)90044-5
[23] Ueda H, Seki H, Ito Y, Oida T, Taniguchi Y, Kobayashi T. Dynamics of magnetization under stimulus-induced rotary saturation sequence. J Magn Reson. 2018;295:38-44.
doi:10.1016/j.jmr.2018.07.004
[24] Layton KJ, Kroboth S, Jia F, et al. Pulseq: A rapid and hardware-independent pulse sequence prototyping framework. Magn Reson Med. 2017;77(4):1544-1552. doi:10.1002/mrm.26235
[25] Pauly J, Le Roux P, Nishimura D, Macovski A. Parameter relations for the Shinnar-Le Roux selective excitation pulse design algorithm [NMR imaging]. IEEE Trans Med Imaging. 1991;10(1):53-65. doi: 10.1109/42.75611
[26] Morales S, Corsi MC, Fourcault W, et al. Magnetocardiography measurements with 4He vector optically pumped magnetometers at room temperature. Phys Med Biol. 2017;62(18):7267-7279. Published 2017 Aug 21. doi:10.1088/1361-6560/aa6459
[27] Sniderman A. Atherosclerosis Risk Factors. James J. Maciejko. Clin Chem. 2004; 51(8): 1568-1568. doi: 10.1373/clinchem.2004.040527
[28] Schuenke P, Koehler C, Korzowski A, et al. Adiabatically prepared spin-lock approach for T1-based dynamic glucose enhanced MRI at ultrahigh fields. Magn Reson Med. 2017;78(1):215-225. doi:10.1002/mrm.26370
[29] Schuenke P, Windschuh J, Roeloffs V, Ladd ME, Bachert P, Zaiss M. Simultaneous mapping of water shift and B1 (WASABI)-Application to field-Inhomogeneity correction of CEST MRI data. Magn Reson Med. 2017 Feb;77(2):571-580. doi: 10.1002/mrm.26133
[30] Bernstein MA, Huston J 3rd, Ward HA. Imaging artifacts at 3.0T. J Magn Reson Imaging. 2006 Oct;24(4):735-46. doi: 10.1002/jmri.20698
[31] Coletti C, Domsch S, Vos F, Weingärtner S. Functional MRI of neuro-electro-magnetic oscillations: Statistical processing in the presence of system imperfections. IEEE-EMBS Conf Biomed Eng Sci. 2021. 172–177. doi: 10.1109/IECBES48179.2021.9398751
[32] Chen W. Errors in quantitative T1rho imaging and the correction methods. Quant Imaging Med Surg. 2015 Aug;5(4):583-91. doi: 10.3978/j.issn.2223-4292.2015.08.05
[33] Charagundla SR, Borthakur A, Leigh JS, Reddy R. Artifacts in T(1rho)-weighted imaging: correction with a self-compensating spin-locking pulse. J Magn Reson. 2003 May;162(1):113-21. doi: 10.1016/s1090-7807(02)00197-0
[34] Witschey WR, Borthakur A, Elliott MA, et al. Compensation for spin-lock artifacts using an off-resonance rotary echo in T1rhooff-weighted imaging. Magn Reson Med. 2007;57(1):2-7.
doi:10.1002/mrm.21134
[35] Gram M, Seethaler M, Gensler D, Oberberger J, Jakob PM, Nordbeck P. Balanced spin-lock preparation for B1 -insensitive and B0 -insensitive quantification of the rotating frame relaxation time T1. Magn Reson Med. 2021 May;85(5):2771-2780.
doi: 10.1002/mrm.28585
[36] Albertova P, Gram M, Schirmer V, et al. Transmission of Rotary Excitation enables Quantification of Oscillating nT-Fields using a Linear Calibration Model. In Proc of ISMRM Annual Meeting. 2023. Toronto. 0758
[37] Alem O, Sander TH, Mhaskar R, et al. Fetal magnetocardiography measurements with an array of microfabricated optically pumped magnetometers. Phys Med Biol. 2015;60(12):4797-4811. doi:10.1088/0031-9155/60/12/4797
[38] Jensen K, Skarsfeldt MA, Stærkind H, et al. Magnetocardiography on an isolated animal heart with a room-temperature optically pumped magnetometer. Sci Rep. 2018;8(1):16218. Published 2018 Nov 1. doi:10.1038/s41598-018-34535-z
[39] Xu D, Roth BJ. The Magnetic Field Produced by the Heart and Its Influence on MRI. Mathematical Problems in Engineering. 2017; 2017:1–9. doi: 10.1155/2017/3035479
[40] Kurl S, Mäkikallio TH, Rautaharju P, Kiviniemi V, Laukkanen JA. Duration of QRS complex in resting electrocardiogram is a predictor of sudden cardiac death in men. Circulation. 2012;125(21):2588-2594. doi:10.1161/CIRCULATIONAHA.111.025577