Compact Radio Sources in the Field of Tycho’s Supernova Remnant
Abstract
We present sensitive, high angular resolution Jansky Very Large Array observations made in 2014 at 1.50 GHz toward the field of Tycho’s supernova remnant. We detect a total of 36 compact sources in a field with radius of 13 arcmin. This number is consistent with the expected number of background sources. We use older observations made with the classic Very Large Array to compare with the 2014 observations and search for sources showing large proper motions that could be related to the donor companion of the exploding white dwarf that produced the supernova in 1572. The comparison of the positions for the two sets of observations does not show sources with large proper motions and supports the conclusion that all sources detected are extragalactic and unrelated to the supernova field.
Presentamos observaciones sensitivas de alta resolución angular hechas en 2014 con el Jansky Very Large Array a 1.50 GHz hacia el campo de la remanente de supernova de Tycho. Detectamos un total de 36 fuentes compactas en un campo con radio de 13 minutos de arco. Usamos observaciones mas antiguas hechas con el VLA clásico para comparar con los datos de 2014 buscando fuentes con movimientos propios grandes que pudieran estar relacionadas con la compañera donante de la enana blanca que explotó y produjo la supernova en 1572. La comparación de posiciones entre los dos conjuntos de observaciones no revela fuentes con grandes movimientos propios y apoya la conclusión de que todas las fuentes detectadas son fuentes extragalácticas de fondo sin relación con el campo de la supernova.
ISM: supernova remnants \addkeywordstars: general \addkeywordastrometry \addkeywordradio continuum: general
0.1 Introduction
Tycho’s 1572 supernova (SN 1572, 3C 10, B Cas) has been classified as a standard type Ia on the basis of its light-echo spectrum (Krause et al. 2008). This supernova type is very important since it is a cosmological standard candle that has allowed to determine the accelerated expansion history of the Universe (Riess et al. 1998; Perlmutter et al. 1999). It is produced by the thermonuclear explosion of a white dwarf accreting from a companion in a close binary system. In the most favored model the white dwarf is fully disrupted when it reaches the Chandrasekhar limit, leaving no collapsed object. The companion then leaves the original position of the binary with the orbital velocity it had at the moment of the explosion, that can be as large as 1,000 km s-1 (Geier et al. 2015). The nature of the companion is poorly understood and it can be a main sequence, subgiant, red giant, AGB, He star or even another white dwarf (Iben 1997; Ruiz-Lapuente 2019).
The determination of the nature of the progenitor (the exploding star) of type Ia supernovae has been the subject of many studies (e.g. Maoz et al. 2014). Less effort has gone into understanding the surviving donor companion (e.g. Ruiz-Lapuente 2019). Only a handful of nearby type Ia supernova remnants (SNRs) have been inspected in search of the companion star (Pan et al. 2014). Importantly, the search for the binary companion of Tycho’s SN 1572 has yielded a candidate: a G-type subgiant star labelled Tycho-G (Ruiz-Lapuente 2004; González-Hernández 2009). The star is relatively close to the center of the supernova remnant, its distance is compatible with it being inside the SNR, it has significantly higher radial velocity and proper motions than other stars at the same location in the Galaxy, and it shows signs of pollution from the supernova ejecta. However, other studies have questioned Tycho-G as the companion donor star because they do not find the expected large stellar rotation (Kerzendorf et al. 2009), they do not confirm the unusual chemistry (Kerzendorf et al. 2013), or their proposed explosion center does not overlap with the past stellar position at the time of the explosion (Xue & Schaefer 2015; Millard et al. 2022). An additional problem is that the Gaia DR3 (Gaia collaboration et al. 2016; 2022) distance of Tycho-G (Gaia DR3 431160359413315328 in the Gaia designation) is kpc while the distance to the supernova is 2.80.4 kpc (Kozlova & Blinnikov 2018). Then, the 1- error bars fall close but do not overlap. More accurate distances could help solve this problem.
The lack of clearly confirmed donor companion stars in type Ia SNRs (Schaefer & Pagnotta 2012; González Hernández et al. 2012; Di Stefano & Kilic 2012; Pan et al. 2014; Ruiz-Lapuente et al. 2018) has led to a questioning of the favored ’single-degenerate’ path (mass transfer from a normal companion star to a ultimately exploding white dwarf) in favor of the ’double-degenerate’ scenario, in which the merger of two white dwarfs produces an explosion that leaves no stellar remnant.
The field of Tycho’s SNR has been studied in the radio with emphasis in the morphology and proper motions of the extended synchrotron shell (Dickel et al. 1991; Reynoso et al. 1997; Williams et al. 2016). In this paper we present a study of the compact (taken to be ) radio sources in this field to search for a source with large proper motions that could be related to the companion star. Stars of low optical luminosity in the main sequence are very rarely detected in the radio (Kimball et al. 2009). As noted by Gaidos et al. (2000), the radio emission of normal, single solar analogs rapidly declines to undetectable levels after a few hundred million years. On the other hand, it is known that rotation is the main agent responsible for the level of magnetic activity in cool stars (Güdel 2002). Large magnetic fields facilitate the production of radio emission via mechanisms such as gyrosynchrotron. The possible relation between rotation and radio emission is supported by the study of McLean et al. (2012) who find that rapidly rotating ( ultracool dwarfs have a higher radio detection fraction by about a factor of three compared to objects with . Also, Lim & White (1995) detected at 3.6 cm three of the four ultrafast ( rotators in the Pleiades. The justification of our search is that the companion donor stars are expected to have large rotation velocities ( for a donor mass ; Kerzendorf et al. 2009) that could enhance their radio emission. It should be pointed out, however, that there are a variety of mechanisms that can produce detectable radio emission in stars (Güdel 2002; Dzib et al. 2013). In section 2 we present the observations, while in section 3 we discuss some individual sources. Finally, in section 4 we present our conclusions.
0.2 Observations
0.2.1 1.50 GHz Observations for Epoch 2014 February 20
The main set of data used in this paper corresponds to observations made with the Karl G. Jansky Very Large Array (VLA) of NRAO111The National Radio Astronomy Observatory is a facility of the National Science Foundation operated under cooperative agreement by Associated Universities, Inc. in the A configuration on 2014 February 20 (2014.140). The observations were taken under project 13A-426 in L-band (0.96-1.97 GHz) using 16 spectral windows, each 64 MHz wide. The amplitude calibrator was J0137+3309 (3C48) and the gain calibrator was J0217+7349. The phase center of the observations was at ; . The data were edited and calibrated following the standard procedures inside the CASA (Common Astronomy Software Applications; McMullin et al. 2007) package of NRAO and the pipeline provided for VLA222https://science.nrao.edu/facilities/vla/data-processing/pipeline observations.
We made images using a robust weighting (Briggs 1995) of 0 and visibilities with baselines larger than 6 k, to suppress structures larger than 30 arcsec. The final image had an rms noise of 28 Jy beam-1 at the phase center and a synthesized beam of ; PA = . The images were corrected for the primary beam response. The images were also corrected for wide-field effects using the gridding option widefield with 1010 subregions in the task TCLEAN. A region with radius of 13 arcmin was inspected for sources with peak emission above 6- (168 Jy beam-1). We detected a total of 36 sources. Their positions, flux densities, spectral indices, angular sizes and counterparts, when found, are given in Table 1. The positions and flux densities were determined using the task IMFIT of CASA. The spectral indices were determined by splitting the total bandwidth in four bandwidths of 256 MHz each, making images and fitting the four flux densities obtained for each source as a function of frequency with a linear regression in the log-log plane.
-2cm-2cm
7 Position\tabnotemarka Flux Spectral Angular Dimensions\tabnotemarkb No. RA(J2000) DEC(J2000) Density(Jy) Index () Counterpart 1 00 23 16.8000.007 64 20 25.460.03 1808200 +0.000.52 \nodata 2 00 23 24.2200.010 63 59 07.430.02 84095 –1.350.45 \nodata 3 00 23 30.7740.013 64 08 04.340.05 52875 –1.140.48 \nodata 4 00 23 40.8260.011 64 10 52.870.03 41646 –1.450.47 \nodata 5 00 24 11.2640.007 64 09 50.020.01 52131 –0.040.30 \nodata 6 00 24 18.1770.012 63 58 58.030.12 42962 +0.020.54 \nodata 7 00 24 30.7490.009 64 02 00.330.03 34844 –0.590.54 \nodata 8 00 24 39.8390.013 64 01 05.930.05 38151 –1.310.53 \nodata 9 00 24 41.0710.006 64 03 56.910.01 59637 +0.030.30 \nodata 10 00 24 44.6950.006 64 04 53.400.05 56151 –1.630.42 \nodata 11 00 24 46.0840.006 64 12 36.460.02 52837 –1.270.34 \nodata 12 00 24 51.7490.006 63 59 08.330.02 60155 –0.890.42 \nodata 13 00 24 56.7420.007 64 17 50.660.03 60744 –1.690.34 \nodata 14 00 24 58.6310.009 64 10 56.820.03 48653 –1.030.37 \nodata 15 00 25 01.6370.005 64 07 47.750.01 84346 –1.490.20 \nodata 16 00 25 10.1660.003 64 16 28.060.01 125853 –0.640.20 \nodata 17 00 25 14.1310.027 64 00 15.080.12 1652288 –1.980.61 \nodata 18 00 25 16.0870.016 63 59 40.960.14 796108 –0.990.63 \nodata 19 00 25 19.2700.001 64 08 53.280.01 515068 –1.300.06 [RMG97] 002231.23+635216.9 20 00 25 26.0370.002 64 04 40.890.01 357590 –1.110.08 [RMG97] 002237.96+634804.7 21 00 25 34.9810.004 64 08 43.060.01 74133 –0.700.27 \nodata 22 00 25 36.0240.007 64 10 39.810.01 33033 –1.310.52 \nodata 23 00 25 40.2040.005 64 13 05.950.01 53740 –0.100.35 \nodata 24 00 25 40.6010.006 64 11 33.720.02 60753 –0.920.33 \nodata 25 00 25 50.7140.022 64 09 28.820.17 1058115 –0.950.49 Nucleus of radio galaxy 26 00 26 05.1120.002 64 17 13.890.01 230681 –0.930.14 \nodata 27 00 26 08.9670.006 64 16 33.890.02 59051 –0.980.36 \nodata 28 00 26 16.2790.014 64 21 33.460.14 3476209 –1.600.40 Disk galaxy 2MFGC 305 29 00 26 23.1020.007 64 12 32.060.01 58135 –1.610.35 \nodata 30 00 26 23.6560.010 64 04 42.340.04 25346 –1.330.55 \nodata 31 00 26 24.0590.003 63 56 24.030.01 1725123 –0.300.32 \nodata 32 00 26 28.1330.012 63 58 36.780.08 50862 +1.050.39 \nodata 33 00 26 30.6510.017 64 14 36.130.06 35257 +0.490.62 \nodata 34 00 26 50.7290.002 64 10 25.520.01 3324112 –1.010.14 \nodata 35 00 26 51.3890.002 64 02 20.160.01 20284682 –0.990.11 Radio source EQ 0024+638 36 00 27 11.5990.017 64 12 44.780.02 46273 +0.250.55 \nodata \tabnotetextaRight ascension (RA) is given in hours, minutes, and seconds. Declination (DEC) is given in degrees, arcminutes, and arcseconds. \tabnotetextbThe deconvolved major () and minor () axes are given in arcsec. The position angle () is given in degrees.
Following the procedure of Anglada et al. (1998) we determine that 376 background sources were expected. This estimate suggests that most, and probably all, of the sources detected are background objects unrelated to the remnant region. Nevertheless, within the uncertainty, it cannot be ruled out that a few sources could be associated with the remnant.
0.2.2 Observations with the Classic VLA
To gain information on the time variability and possible proper motions of the sources found in the 2014 image, we analyzed classic VLA observations made in the A configuration on the three epochs listed in Table 2. As in the 2014 data, the amplitude calibrator was J0137+3309 (3C48) and the gain calibrator was J0217+7349 for the three epochs. The data was concatenated to gain signal to noise ratio and assigned an average epoch of 1993.468 and an average frequency of 1.43 GHz. The data were edited and calibrated using the software package Astronomical Image Processing System (AIPS) of NRAO. We made images using a robust weighting (Briggs 1995) of 0 and visibilities with baselines larger than 6 k, to suppress structures larger than 30 arcsec.
-2cm-1cm
6 Amplitude Gain Frequency Bandwidth Project Epoch Calibrator Calibrator (GHz) (MHz) AV84 1983 Nov 13 (1983.868) J0137+3309 J0217+7349 1.38 6.25 AM437 1994 Mar 18 (1994.211) J0137+3309 J0217+7349 1.51 6.25 AR464 2002 Apr 29 (2002.326) J0137+3309 J0217+7349 1.41 6.25
The final image had an rms noise of 75 Jy beam-1 at the phase center and a synthesized beam of ; PA = . As for the 2014 image, a region with radius of 13 arcmin was inspected for sources with peak emission above 6- (450 Jy beam-1). We detected a total of 17 sources. Again, following the procedure of Anglada et al. (1998) we determine that 184 background sources were expected. As in the more sensitive 2014 data, this estimate suggests that most, and probably all, of the sources detected are background objects unrelated to the remnant region. Their positions and flux densities are given in Table 3. In this Table we also list the difference in RA and DEC between the 2014 positions and those obtained from the classic VLA data.
-2cm-1cm
7 Position\tabnotemarka Flux RA\tabnotemarkb DEC\tabnotemarkb Flux Ratio No. RA(J2000) DEC(J2000) Density(Jy) (seconds) (arcseconds) (2014/1983) 6 00 24 18.0520.099 63 58 58.731.02 1903414 0.1250.099 -0.701.03 0.230.06 9 00 24 41.0710.014 64 03 56.990.09 663163 0.0000.015 -0.080.09 0.900.23 10 00 24 44.7010.013 64 04 53.390.15 692182 -0.006 0.010 0.010.16 0.870.24 12 00 24 51.7490.016 63 59 07.990.17 815107 0.0000.017 0.340.17 0.770.12 13 00 24 56.7180.023 64 17 50.480.16 582193 0.0240.024 0.180.16 1.130.38 15 00 25 01.6480.009 64 07 47.890.07 1130179 -0.0110.010 -0.140.07 0.80 0.13 16 00 25 10.1610.008 64 16 27.850.06 1735197 0.0050.009 0.210.06 0.750.09 17 00 25 14.0760.097 64 00 13.840.69 3782530 0.055 0.101 1.240.70 0.480.11 19 00 25 19.2820.001 64 08 53.400.01 6657166 -0.0120.001 -0.120.01 0.820.02 20 00 25 26.0460.002 64 04 40.970.02 3831168 -0.0100.003 -0.080.02 0.98 0.05 21 00 25 34.9870.011 64 08 43.230.07 974173 -0.0060.012 -0.17 0.07 0.790.14 24 00 25 40.6050.017 64 11 34.000.11 675176 -0.0040.018 -0.280.11 0.94 0.26 26 00 26 05.1100.009 64 17 13.620.05 2229216 0.0020.009 0.270.06 1.080.11 28 00 26 16.2780.053 64 21 32.730.35 61571010 0.0120.055 0.570.37 0.610.11 31 00 26 24.0540.014 63 56 23.450.07 1338214 0.005 0.014 0.58 0.07 1.310.23 34 00 26 50.7240.005 64 10 25.280.03 3564222 0.0050.005 0.240.03 0.980.08 35 00 26 51.3640.002 64 02 19.780.01 20092263 0.0250.003 0.380.01 1.060.04 \tabnotetextaRight ascension (RA) is given in hours, minutes, and seconds. Declination (DEC) is given in degrees, arcminutes, and arcseconds. \tabnotetextbPosition differences given by 2014 positions minus classic VLA positions.
All 17 sources detected in the image from the classic VLA data were detected in the more sensitive (by a factor of 2.7) 2014 observations. To compare the flux densities at the two epochs we corrected the 2014 flux densities from 1.50 to 1.43 GHz using the spectral indices listed in Table 1. This correction is small, of order 5-10%. In the last column of Table 3 we list the ratio of the flux densities. Eight of the 17 sources have a ratio consistent within noise with 1 and thus no variability. Only source 6 shows a variability larger than a factor of 2, decreasing by a factor of 4 between databases.
0.2.3 Upper Limits to the Proper Motions
Analyzing Table 3 we find that the position differences between the 2014 image and the classic VLA image (columns 5 and 6) are above a conservative 5- value only for sources 19, 31, 34 and 35. Should these possible small proper motions be considered as real? Sources 31, 34 and 35 are resolved angularly (see Table 1) and this characteristic could well account for the small difference in position between epochs due to differences in the beam shape. The position differences for the remaining source 19 are of order of only . Taking this displacement as an upper limit to the true proper motions, we can crudely set an upper limit to the velocity of the sources in the plane of the sky. Given the time interval of 20.672 yr between the two datasets and a distance of 2.8 kpc to the supernova (Kozlova & Blinnikov 2018) this results in an upper limit of 65 km s-1 for the velocity of the radio sources in the plane of the sky, if they were located at the distance of the supernova. As noted before, it is most probable that all sources are extragalactic and that the small position differences measured are the result of noise and not true displacements. Supporting the extragalactic interpretation is that none of the 36 radio sources has a counterpart in the Gaia DR3 catalog (Gaia collaboration et al. 2016; 2022). Tycho’s SNR is almost in the plane of the Galaxy (it has a galactic latitude of ). Then, extragalactic objects in this direction will be heavily obscured in the optical and very difficult to detect in the observations of the Gaia project.
0.2.4 The Non Detection of Tycho-B
The star Tycho-G was not detected in our observations. Perhaps more interestingly, the star Tycho-B was not detected either. Tycho-B is a fast-rotator A-type star that has been proposed as a candidate to be the donor companion of the exploding white dwarf that produced SN 1572 (Kerzendorf et al. 2013), although this proposal has been questioned later (Kerzendorf et al. 2018).
The best studied case of radio emission from a rapidly rotating A-type star is that of Altair ( Aql; White et al. 2021). From the model of these authors we estimate that Altair is expected to have a flux density of at the frequency of 1.5 GHz. Tycho-B, with position , is located at a distance of 2.7 kpc (Gaia Collaboration 2020). On the other hand, Altair is located at a distance of only 5.1 pc (van Leeuwen 2007). We then conclude that if Tycho-B has a similar radio emission to that of Altair, its flux density would be weaker and undetectable with present instrumentation.
0.3 Individual Sources
To gain information on the sources detected we used the SIMBAD database to search for counterparts within a few arcsec of the radio position.
0.3.1 Sources 19 and 20
These sources are reported by Reynoso et al. (1997) in their study of the expansion of the supernova remnant. They used them to align their images at different epochs. Their compact size and negative spectral index (see Table 1) suggest they are background active galactic nuclei.
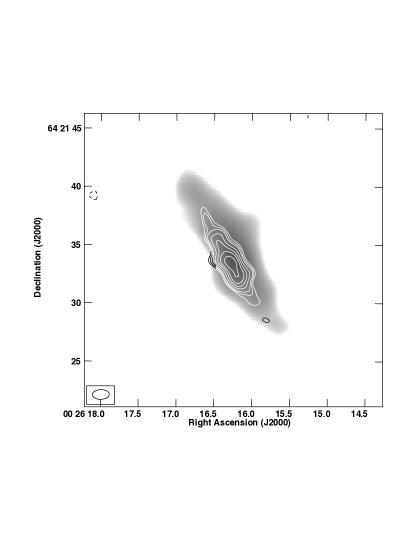
0.3.2 Source 25
This source seems to be the nucleus of a radio galaxy (see Figure 1). The lobes of the radio galaxy extend over in the north-south direction. Since they are clearly extended, the lobes are not reported in our list of compact sources. The nucleus is elongated along the axis defined by the radio lobes and probably traces more recent ejections.

0.3.3 Source 28
This source was initially catalogued in the 2MASS-selected Flat Galaxy Catalog (2MFGC; Mitronova et al. 2006). The sources in this catalog are expected to be disk galaxies selected from the Extended Source Catalog of the Two Micron All-Sky Survey (XSC 2MASS; Jarrett et al. 2000) on the basis of their 2MASS axial ratio being a/b3. We find that the infrared and radio images approximately coincide and show similar elongated morphology (Figure 2).
0.3.4 Source 32
This source is interesting because it shows a clearly positive spectral index (+1.050.39; Table 1). All other sources in Table 1 have spectral indices that are consistent within noise with a negative spectral index. Background radio sources usually show clearly negative spectral indices, taken to be indicative of optically-thin synchrotron emission. For example, Smolčić et al. (2016) obtained accurate spectral indices for 159 sources by combining Australia Telescope Compact Array (ATCA) 2.1 GHz observations with Sydney University Molonglo Sky Survey (SUMSS) 843 MHz data. Only three of the sources show positive spectral indices ().
Source 32 could be a high frequency peaker (HFP). These are compact, sometimes powerful extragalactic radio sources with well-defined peaks in their radio spectra above a few GHz, with most of them being high redshift quasars (Dallacasa et al. 2000). A possible explanation for the HFP radio sources is that we are observing synchrotron emission produced by blazars caught during a flare, when a highly self-absorbed (optically-thick) component dominated the emission (Tinti et al. 2005)
0.3.5 Source 35
This is the brightest compact source in the region considered. It was reported previously by Schwarz et al. (1995) from HI VLA observations made in 1993 in the C configuration. These authors proposed that it is a background source. It is an elongated source (see Table 1) and it could be a disk galaxy seen edge-on or an unresolved radio galaxy.
0.4 Conclusions
Our main conclusions are the following:
1) We compared observations made in L-band toward the Tycho supernova remnant in 2014 with the Jansky VLA and previously with the classic VLA. The purpose of this comparison was to search for radio sources showing large proper motions that could be related to the donor companion of the exploding white dwarf that produced the supernova in 1572. We failed to find radio sources with large proper motions ( 65 km s-1) and conclude that most, and probably all, of the sources detected are background extragalactic objects. However, we argue that these donor companions could be radio sources and believe that its search in other type Ia supernova remnants is worthwhile.
2) We discussed several sources individually and concluded that their characteristics are compatible with them being most likely background extragalactic sources. Source 28 is most probably a disk galaxy seen edge-on. Source 32 could be a high frequency peaker, possibly a blazar caught during a flare.
0.5 Acknowledgments
This publication makes use of data products from the Two Micron All Sky Survey, which is a joint project of the University of Massachusetts and the Infrared Processing and Analysis Center, funded by the National Aeronautics and Space Administration and the National Science Foundation. This research has made use of the SIMBAD database, operated at CDS, Strasbourg, France.
References
- Anglada et al. (1998) Anglada, G., Villuendas, E., Estalella, R., et al. 1998, AJ, 116, 2953. doi:10.1086/300637
- Bridle & Schwab (1999) Bridle, A. H. & Schwab, F. R. 1999, Synthesis Imaging in Radio Astronomy II, 180, 371
- Briggs (1995) Briggs, D. S. 1995, American Astronomical Society Meeting Abstracts, 187, 112.02
- Dallacasa et al. (2000) Dallacasa, D., Stanghellini, C., Centonza, M., et al. 2000, A&A, 363, 887. doi:10.48550/arXiv.astro-ph/0012428
- Dickel et al. (1991) Dickel, J. R., van Breugel, W. J. M., & Strom, R. G. 1991, AJ, 101, 2151
- Di Stefano & Kilic (2012) Di Stefano, R. & Kilic, M. 2012, ApJ, 759, 56
- Dzib et al. (2013) Dzib, S. A., Rodríguez, L. F., Loinard, L., et al. 2013, ApJ, 763, 139. doi:10.1088/0004-637X/763/2/139
- Gaia Collaboration et al. (2016) Gaia Collaboration, Prusti, T., de Bruijne, J. H. J., et al. 2016, A&A, 595, A1. doi:10.1051/0004-6361/201629272
- Gaia Collaboration (2020) Gaia Collaboration 2020, VizieR Online Data Catalog, I/350. doi:10.26093/cds/vizier.1350
- Gaia Collaboration et al. (2022) Gaia Collaboration, Vallenari, A., Brown, A. G. A., et al. 2022, arXiv:2208.00211. doi:10.48550/arXiv.2208.00211
- Gaidos et al. (2000) Gaidos, E. J., Güdel, M., & Blake, G. A. 2000, Geophys. Res. Lett., 27, 501. doi:10.1029/1999GL010740
- Geier et al. (2015) Geier, S., Fürst, F., Ziegerer, E., et al. 2015, Science, 347, 1126
- González Hernández et al. (2009) González Hernández, J. I., Ruiz-Lapuente, P., Filippenko, A. V., et al. 2009, ApJ, 691, 1
- González Hernández et al. (2012) González Hernández, J. I., Ruiz-Lapuente, P., Tabernero, H. M., et al. 2012, Nature, 489, 533
- Güdel (2002) Güdel, M. 2002, ARA&A, 40, 217. doi:10.1146/annurev.astro.40.060401.093806
- Iben (1997) Iben, I. 1997, Thermonuclear Supernovae, 486, 111. doi:10.1007/978-94-011-5710-0_8
- Jarrett et al. (2000) Jarrett, T. H., Chester, T., Cutri, R., et al. 2000, AJ, 119, 2498. doi:10.1086/301330
- Kerzendorf et al. (2009) Kerzendorf, W. E., Schmidt, B. P., Asplund, M., et al. 2009, ApJ, 701, 1665
- Kerzendorf et al. (2013) Kerzendorf, W. E., Yong, D., Schmidt, B. P., et al. 2013, ApJ, 774, 99
- Kerzendorf et al. (2018) Kerzendorf, W. E., Long, K. S., Winkler, P. F., et al. 2018, MNRAS, 479, 5696. doi:10.1093/mnras/sty1863
- Kimball et al. (2009) Kimball, A. E., Knapp, G. R., Ivezić, Ž., et al. 2009, ApJ, 701, 535. doi:10.1088/0004-637X/701/1/535
- Kozlova & Blinnikov (2018) Kozlova, A. V. & Blinnikov, S. I. 2018, Journal of Physics Conference Series, 1038, 012006. doi:10.1088/1742-6596/1038/1/012006
- Krause et al. (2008) Krause, O., Tanaka, M., Usuda, T., et al. 2008, Nature, 456, 617
- Lim & White (1995) Lim, J. & White, S. M. 1995, ApJ, 453, 207. doi:10.1086/176380
- Maoz et al. (2014) Maoz, D., Mannucci, F., & Nelemans, G. 2014, ARA&A, 52, 107
- McLean et al. (2012) McLean, M., Berger, E., & Reiners, A. 2012, ApJ, 746, 23. doi:10.1088/0004-637X/746/1/23
- McMullin et al. (2007) McMullin, J. P., Waters, B., Schiebel, D., et al. 2007, Astronomical Data Analysis Software and Systems XVI, 376, 127
- Millard et al. (2022) Millard, M. J., Park, S., Sato, T., et al. 2022, ApJ, 937, 121. doi:10.3847/1538-4357/ac8f30
- Mitronova et al. (2006) Mitronova, S. N., Karachentsev, I. D., Karachentseva, V. E., et al. 2006, VizieR Online Data Catalog (other), 0110, J/other/BSAO/57
- Pan et al. (2014) Pan, K.-C., Ricker, P. M., & Taam, R. E. 2014, ApJ, 792, 71
- Perlmutter et al. (1999) Perlmutter, S., Aldering, G., Goldhaber, G., et al. 1999, ApJ, 517, 565
- Reynoso et al. (1997) Reynoso, E. M., Moffett, D. A., Goss, W. M., et al. 1997, ApJ, 491, 816
- Riess et al. (1998) Riess, A. G., Filippenko, A. V., Challis, P., et al. 1998, AJ, 116, 1009
- Ruiz-Lapuente et al. (2004) Ruiz-Lapuente, P., Comeron, F., Méndez, J., et al. 2004, Nature, 431, 1069
- Ruiz-Lapuente et al. (2018) Ruiz-Lapuente, P., Damiani, F., Bedin, L., et al. 2018, ApJ, 862, 124
- Ruiz-Lapuente (2019) Ruiz-Lapuente, P. 2019, NewAR, 85, 101523
- Schwarz et al. (1995) Schwarz, U. J., Goss, W. M., Kalberla, P. M., et al. 1995, A&A, 299, 193
- Schaefer & Pagnotta (2012) Schaefer, B. E. & Pagnotta, A. 2012, Nature, 481, 164
- Smolčić et al. (2016) Smolčić, V., Delhaize, J., Huynh, M., et al. 2016, A&A, 592, A10. doi:10.1051/0004-6361/201526818
- Tinti et al. (2005) Tinti, S., Dallacasa, D., de Zotti, G., et al. 2005, A&A, 432, 31. doi:10.1051/0004-6361:20041620
- van Leeuwen (2007) van Leeuwen, F. 2007, A&A, 474, 653. doi:10.1051/0004-6361:20078357
- White et al. (2021) White, J. A., Tapia-Vázquez, F., Hughes, A. G., et al. 2021, ApJ, 912, L5. doi:10.3847/2041-8213/abf6da
- Williams et al. (2016) Williams, B. J., Chomiuk, L., Hewitt, J. W., et al. 2016, ApJ, 823, L32
- Xue & Schaefer (2015) Xue, Z. & Schaefer, B. E. 2015, ApJ, 809, 183