GBT/Argus Observations of Molecular Gas in the Inner Regions of IC 342
Abstract
We report observations of the ground state transitions of 12CO, 13CO, C18O, HCN, and HCO+ at 88–115 GHz in the inner region of the nearby galaxy IC 342. These data were obtained with the 16-pixel spectroscopic focal plane array Argus on the 100-m Robert C. Byrd Green Bank Telescope (GBT) at 6–9′′ resolution. In the nuclear bar region, the intensity distributions of 12CO(1–0) and 13CO(1–0) emission trace moderate densities, and differ from the dense gas distributions sampled in C18O(1–0), HCN(1–0), and HCO+(1–0). We observe a constant HCN(1–0)-to-HCO+(1–0) ratio of 1.20.1 across the whole 1 kpc bar. This indicates that HCN(1–0) and HCO+(1–0) lines have intermediate optical depth, and that the corresponding of the gas producing the emission is of 104.5-6 cm-3. We show that HCO+(1–0) is thermalized and HCN(1–0) is close to thermalization. The very tight correlation between HCN(1–0) and HCO+(1–0) intensities across the 1 kpc bar suggests that this ratio is more sensitive to the relative abundance of the two species than to the gas density. We confirm the angular offset (10′′) between the spatial distribution of molecular gas and the star formation sites. Finally, we find a breakdown of the - correlation at high spatial resolution due to the effect of incomplete sampling of star-forming regions by HCN emission in IC 342. The scatter of the - relation decreases as the spatial scale increases from 10′′ to 30′′ (170–510 pc), and is comparable to the scatter of the global relation at the scale of 340 pc.
1 Introduction
Understanding the distribution, physical conditions, and dynamics of molecular gas is essential to understanding star formation. Studies of individual regions in our galaxy have shown that stars form in dense molecular clouds (e.g., see Lada & Lada, 2003; Heiderman et al., 2010; Lada et al., 2010), while resolved observations of external galaxies provide global information related to star formation efficiencies within nuclei, spiral arms, and other regions (e.g., see Silk, 1997; Kennicutt, 1998; Elmegreen, 2002; Bigiel et al., 2008). In all cases, probing the complexity and scale of star formation regions requires a large spatial dynamic range to follow core formation and collapse to circumstellar scales.
Rotational transitions of molecules such as 12CO, HCN, HCO+, and their isotopologues are common tools for probing cold molecular clouds in external galaxies because of their relatively high abundance and the excitation energy levels from a few to several tens of kelvins. Specifically, =1–0 lines of 12CO, 13CO, and C18O trace gas with densities above –103 cm-2, capturing the bulk of the molecular gas. HCN and HCO+ have higher dipole moments (2.98 and 3.92 D versus 0.11 D for 12CO), and their ground state transitions trace denser gas (–105 cm-2). Because of the different critical densities, this set of molecular lines can establish the quantitative link between gas density and star formation across a variety of environments (e.g., the PHANGS/CO survey, Leroy et al. 2021; the EMPIRE/HCN survey, Jiménez-Donaire et al. 2019; the DEGAS survey, Kep ley et al., in prep)
Single transitions cannot be easily used to quantify the exact gas density or temperature, however. The interpretation of the line intensity involves a high degree of degeneracy, including the observational spatial resolution, the optical depth effects, and/or the actual excitation condition, etc. As spatially resolved observations become more accessible, multi-transition ratios, on the other hand, may further break such a degeneracy by comparing the observations and theoretical predictions within specific parameter space due to the different excitation properties among different species (e.g., Meijerink et al., 2007; Viti, 2017; Leroy et al., 2017).
| 12CO(1–0) | 13CO(1–0) C18O(1–0) | HCN(1–0) HCO+(1–0) | |
|---|---|---|---|
| Observation date | 17-Sep-29 | 17-Oct-18/19, 17-Nov-21 | 17-Oct-25/27, 17-Nov-14 |
| Observation ID | GBT17B-412-01/02 | GBT17B-151-01/08 | GBT17B-151-02/03/05 |
| Mapping area | 3.5′ | 2.5′ | 2.5′ |
| On-source integration (hrs) | 6.17 | 1.33 | 11.52 |
| Total integration (hrs) | 10.08 | 2.38 | 20.67 |
| Frequency Setup (GHz) | 115.271 | 109.982 | 88.903 |
| Beam Size (′′) | 6.33 | 6.63 | 8.21 |
| Beam Size (pc beam-1) | 101 | 106 | 131 |
| Velocity resolution (km s-1) | 3.8 | 4.0 | 4.9 |
| Main beam efficiency | 28.3 | 44.5 | 52.5 |
| Calibration erroraaBased on GBT memo #302 (Frayer et al., 2019). | 25% | 23% | 15% |
| Scan Rate (′′ s-1) | 1.71 | 1.67 | 1.67 |
| Noise in (K)bbThe spectral noise level varies at different positions on the map, depending on the integration time within each beam area. | 0.090.02 | 0.0180.004 | 0.00350.0005 |
Among the ratios of transition of different species, the intensity ratio of HCN(1–0)-to-HCO+(1–0), here denoted as (HCN)/(HCO+), is of specific interest in this paper. The critical density of HCO+(1–0) is lower by 5–20 times than that of HCN(1–0) at temperatures of 20–100 K because of their different collisional de-excitation rate coefficients. The intensity ratio is a potentially valuable probe of the physical conditions of molecular gas in external galaxies because the correlation between the infrared luminosity and was established by single beam observations (Graciá-Carpio et al., 2006). This correlation was further expected to suggest the importance of AGN (active galactic nucleus) in galaxies with higher infrared luminosities (Imanishi et al., 2006, 2007), although recent studies with the 30-m IRAM survey (Privon et al., 2015, 2020) conclude that globally enhanced HCN emission relative to HCO+ is not correlated with the presence of an AGN.
The DEGAS (Dense Extragalactic GBT111The Green Bank Observatory is a facility of the National Science Foundation operated under cooperative agreement by Associated Universities, Inc.+ARGUS Gas Density Survey; Kepley et al., in prep; proposal ID: GBT17B-151, GBT17A-304, GBT17A-212) survey conducts efficient multi-line spectral mapping on the ground transitions of 13CO, C18O, HCN, and HCO+ of 17 external galaxies (Kepley et al., in prep). Specifically, DEGAS uses the Argus focal plane array spectroscopic imager (Sieth et al., 2014) and the spatial resolution (6–8′′) provided by the 100-m aperture of the GBT from 86–115 GHz. For each galaxy, the central 2 region was covered.
In this paper, we choose IC 342, the nearest galaxy in the DEGAS sample, as the ideal target for a detailed spatially resolved multi-line study. IC 342 is a nearly face-on, spiral galaxy at 3.3 Mpc (Saha et al., 2002) harboring starburst activity in its center. Its large angular size (20′ in optical and 80′ in HI, Crosthwaite et al., 2000) is well suited to detailed imaging with the GBT’s beam sizes, while the concentration of molecular gas in the galactic center gives rich line emission (e.g., Downes et al., 1992; Turner & Hurt, 1992; Meier et al., 2000). In addition to the ground transitions of 13CO, C18O, HCN, and HCO+ observed by DEGAS, we obtained observations of 12CO from a DDT (Director’s Discretionary Time) proposal toward the inner disk region (3.5) of IC 342 (proposal ID: GBT17B-412). These single-dish observations provide high spatial resolution without resolving out extended emission, as an interferometer would.
The structure of this paper is as follows. We summarize our observations and data reduction in Section 2. In Section 3, we describe the distribution of molecular material across the nucleus and inner spiral arms in 12CO, and along the nuclear bar of IC 342 in all five molecular species. In Section 4, we discuss the implication of the constant HCN-to-HCO+ intensity ratio observed across the entire 1 kpc bar of IC 342, and specifically analyze the breakdown of the - correlation of IC 342 at high spatial resolution. Section 5 is a summary overview, and in the Appendix, we provide some detailed information connected with our analysis.
2 Observations and Data Reduction
We used the Argus 16-pixel spectroscopic focal plane array on the 100-m diameter Robert C. Byrd Telescope of the Green Bank Observatory to conduct observations of IC 342 from 2017 September to 2017 November. A summary of observational parameters is in Table 1 for the five molecular species we imaged. The on-source time for all species in total was 19 hrs out of the total observing time (including overhead) of 33 hrs (see Table 1). The telescope slewed across a region of the sky in a raster pattern to make OTF (On-The-Fly) maps (Haslam et al., 1970; Mangum et al., 2007), with the data and the antenna position recorded every 0.5 s. Pointing and focus were calibrated every 30–40 minutes with the source 0359+5057. The backend, VEGAS, was configured in mode 1 with a single spectral window with a bandwidth of 1500 MHz (1250 MHz effective) and a spectral resolution of 1465 kHz. 13CO(1–0) and C18O(1–0) were observed simultaneously in a spectral window centered at 109.99176 GHz, and HCN(1–0) and HCO+(1–0) were observed simultaneously in a spectral window centered at 88.91123 GHz. Observations were mostly conducted under windless conditions ( 1 m s-1). For 12CO, however, for half of the observing time, was greater than 5 m s-1, which caused pointing deviations as high as 1 beam ( 6′′ at 115 GHz). We established pointing corrections by cross-correlating each 40 min individual observing session with 12CO maps observed under low wind speed.
We calibrated and post-processed data with the Python packages gbtpipe and degas. Initially, Argus data are on scale after chopper wheel calibration (Kutner, & Ulich, 1981). We obtained atmospheric temperature and opacity information from the GBT weather database and then corrected for atmospheric attenuation, resistive losses, rearward spillover, and scattering. Our final brightness temperature scales are in to better represent the intensity in the main beam. We used conversion factors between and of of 28.3 for 12CO, 44.5 for 13CO and C18O, and 52.5 for HCN and HCO+ (GBT Memo #302, Frayer et al., 2019). Next, problematic spectra were automatically detected and dropped. The reduction pipeline flagged and dropped spectra with spikes or an RMS noise level higher than 1.1 times expected from the radiometer equation. We then removed low-order polynomial baselines and interpolated them to a regular grid in data cubes. We used the 12CO map as a spatial and velocity space mask to constrain the emission regions for the other molecules. We integrated the data cubes from to km s-1 to make moment maps using functions from the SpectralCube package.
3 Results
3.1 Spatial Distribution of the Molecular Gas
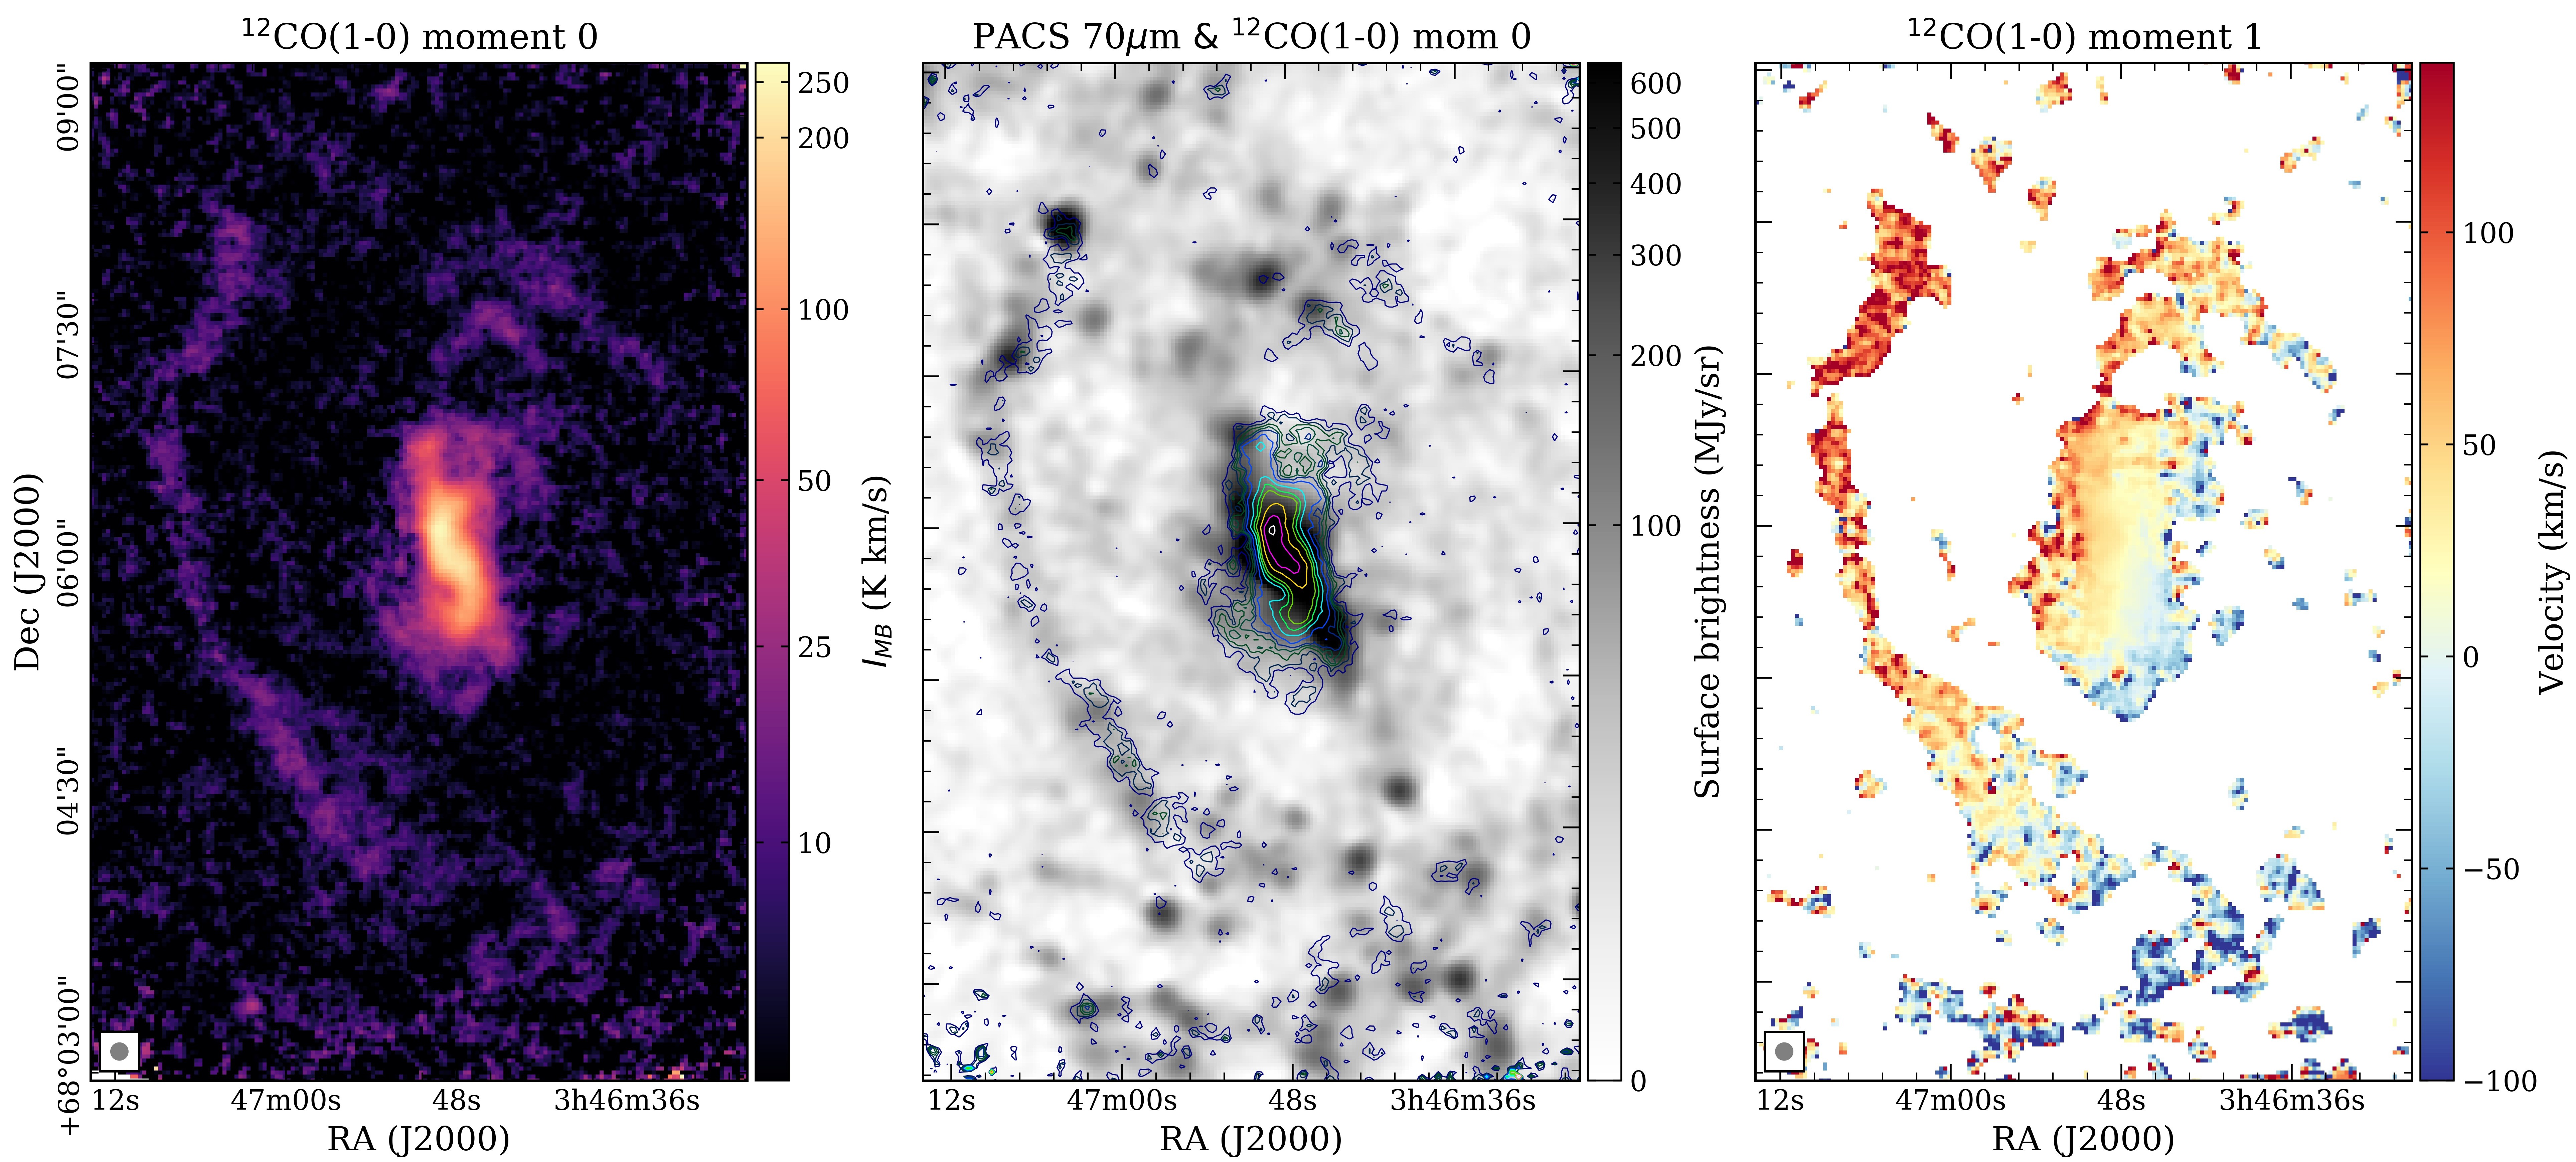

We present the moment 0 (integrated intensity) and the moment 1 (intensity-weighted mean velocity) maps of 12CO(1–0) from the inner disk region of IC 342 in Figure 1. The size of the maps is 3.5′5′. In the middle panel of Figure 1, the 12CO moment 0 map is overlaid in contours on the Herschel PACS 70 m map for a comparison with the distribution of dust heated by young stars.
Ground transitions of 13CO, C18O, HCN, and HCO+ were observed in a smaller region in size of 2.5′2.5′ and only probe the bar region of IC 342. The calibration error is 25 for 12CO, 23 for 13CO and C18O, and 15 for HCN and HCO+ (GBT Memo #302, Frayer et al., 2019). Comparing against 12CO, the relative calibration error uncertainty in ratios is 30% between nights. The integrated-intensity images of the 1.4′ (1.3 kpc) long bar region in all five molecular species, including 12CO, are presented in Figure 2. For a better signal-to-noise ratio, all images other than that of 12CO are spatially smoothed to an output resolution 1.3 times larger than the input resolution following the procedure of the DEGAS survey (Kepley et al., in prep).
Figures 1 and 2 show that the spatial distributions of these molecular gas species closely match past observations (Downes et al., 1992; Turner & Hurt, 1992; Meier et al., 2000; Meier & Turner, 2001; Kuno et al., 2007; Hirota et al., 2010). The large scale 12CO(1–0) image reveals a morphology with two asymmetrical arms extending from the ends of a nuclear bar oriented roughly from north to south. 12CO emission peaks at 0.2′ (191 pc) north of the nuclear center, while the peak brightness and the integrated intensities of the other four species all peak at the nuclear center and decrease towards the bar ends (see Figures 2 and 3). Among these species, the morphology of 13CO most resembles 12CO, with a rather elongated structure and two tentacle-like substructures to the north. However, unlike 12CO, the intensity peak of 13CO is located at the nuclear center. C18O, HCN, and HCO+ have more concentrated structures and illustrate the “S-shape” shown in the central region of 12CO and 13CO. The morphology of HCN and HCO+ emission is essentially identical (Figure 2).
We compare the integrated intensities measured by GBT/Argus to those observed by other single-dish observations. For 12CO, the peak values of the integrated intensities on the image observed by the 45-m telescope (15′′, Kuno et al., 2007) and the GBT/Argus are 180 and 257 K km s-1. Convolving the Argus map to a 15′′ beam results in a peak 12CO intensity of 162 K km s-1. For 13CO, the values are 22 (20.4′′, Hirota et al., 2010) and 24 K km s-1. The peak 13CO value from the convolved Argus map is 14 K km s-1. For HCN and HCO+, we compare the results from the 30-m telescope (26′′, Nguyen-Q-Rieu et al., 1992), for which the two lines were observed separately. Values of HCN are 19.1 (30-m telescope), 21 (data from this paper, before convolution), and 8.5 (data from this paper, after convolution) K km s-1, separately. Values of HCO+ are 9.8, 17, and 7.0 K km s-1. While the HCN intensity measured by the 30-m telescope is about twice the HCO+ intensity (19.1 vs. 9.8 K km s-1), the two are similar (21 vs. 17 K km s-1) in observations of Argus. The HCN and HCO+ observations presented in this paper have excellent relative calibration because the two species were observed simultaneously in the same sideband and were reduced with the same procedure. Both lines, therefore, share pointing and focus errors and changes in atmospheric transmission, permitting accurate comparisons of relative intensities and spatial distributions.
To compare the distribution of molecular gas to dust-reprocessed UV radiation from young stars, we overlaid the contours of the integrated intensity of CO on a Herschel 70 m image (Kennicutt et al., 2011) in the middle panel of Figure 1. Overall, within the inner disk region of IC 342, the brightest 12CO emission follows the infrared emission. In the southern and the northern arms, however, peaks of 12CO intensity do not coincide with peaks of the infrared emission. A similar spatial offset is also shown in the nuclear bar region, as most 12CO emission is located at the concave side of the “S-shape” infrared bar.
The spatial offset seen between 12CO (and/or 13CO) and 70 m emission in the bar region is consistent with the spatial offset seen between 13CO and H emission (5–10′′, Turner & Hurt, 1992) in either the size and the direction. While H emission traces young stars, it suffers from extinction. The consistency between IR and H emission, therefore, implies that young stars emitting in H are not entirely hidden in the dust. archival images (PID 5446, 6367, see the lower left panel in Figure 2) also confirm that in the bar region, young stars emit through the mixed filamentary dusty structures. Therefore, the angular offset between the 12CO (and/or 13CO) emission region and the star formation sites appears to be a physical separation rather than caused by variable dust extinction.
3.2 Line Intensity Ratios of Different Molecular Species in the Nuclear Bar Region
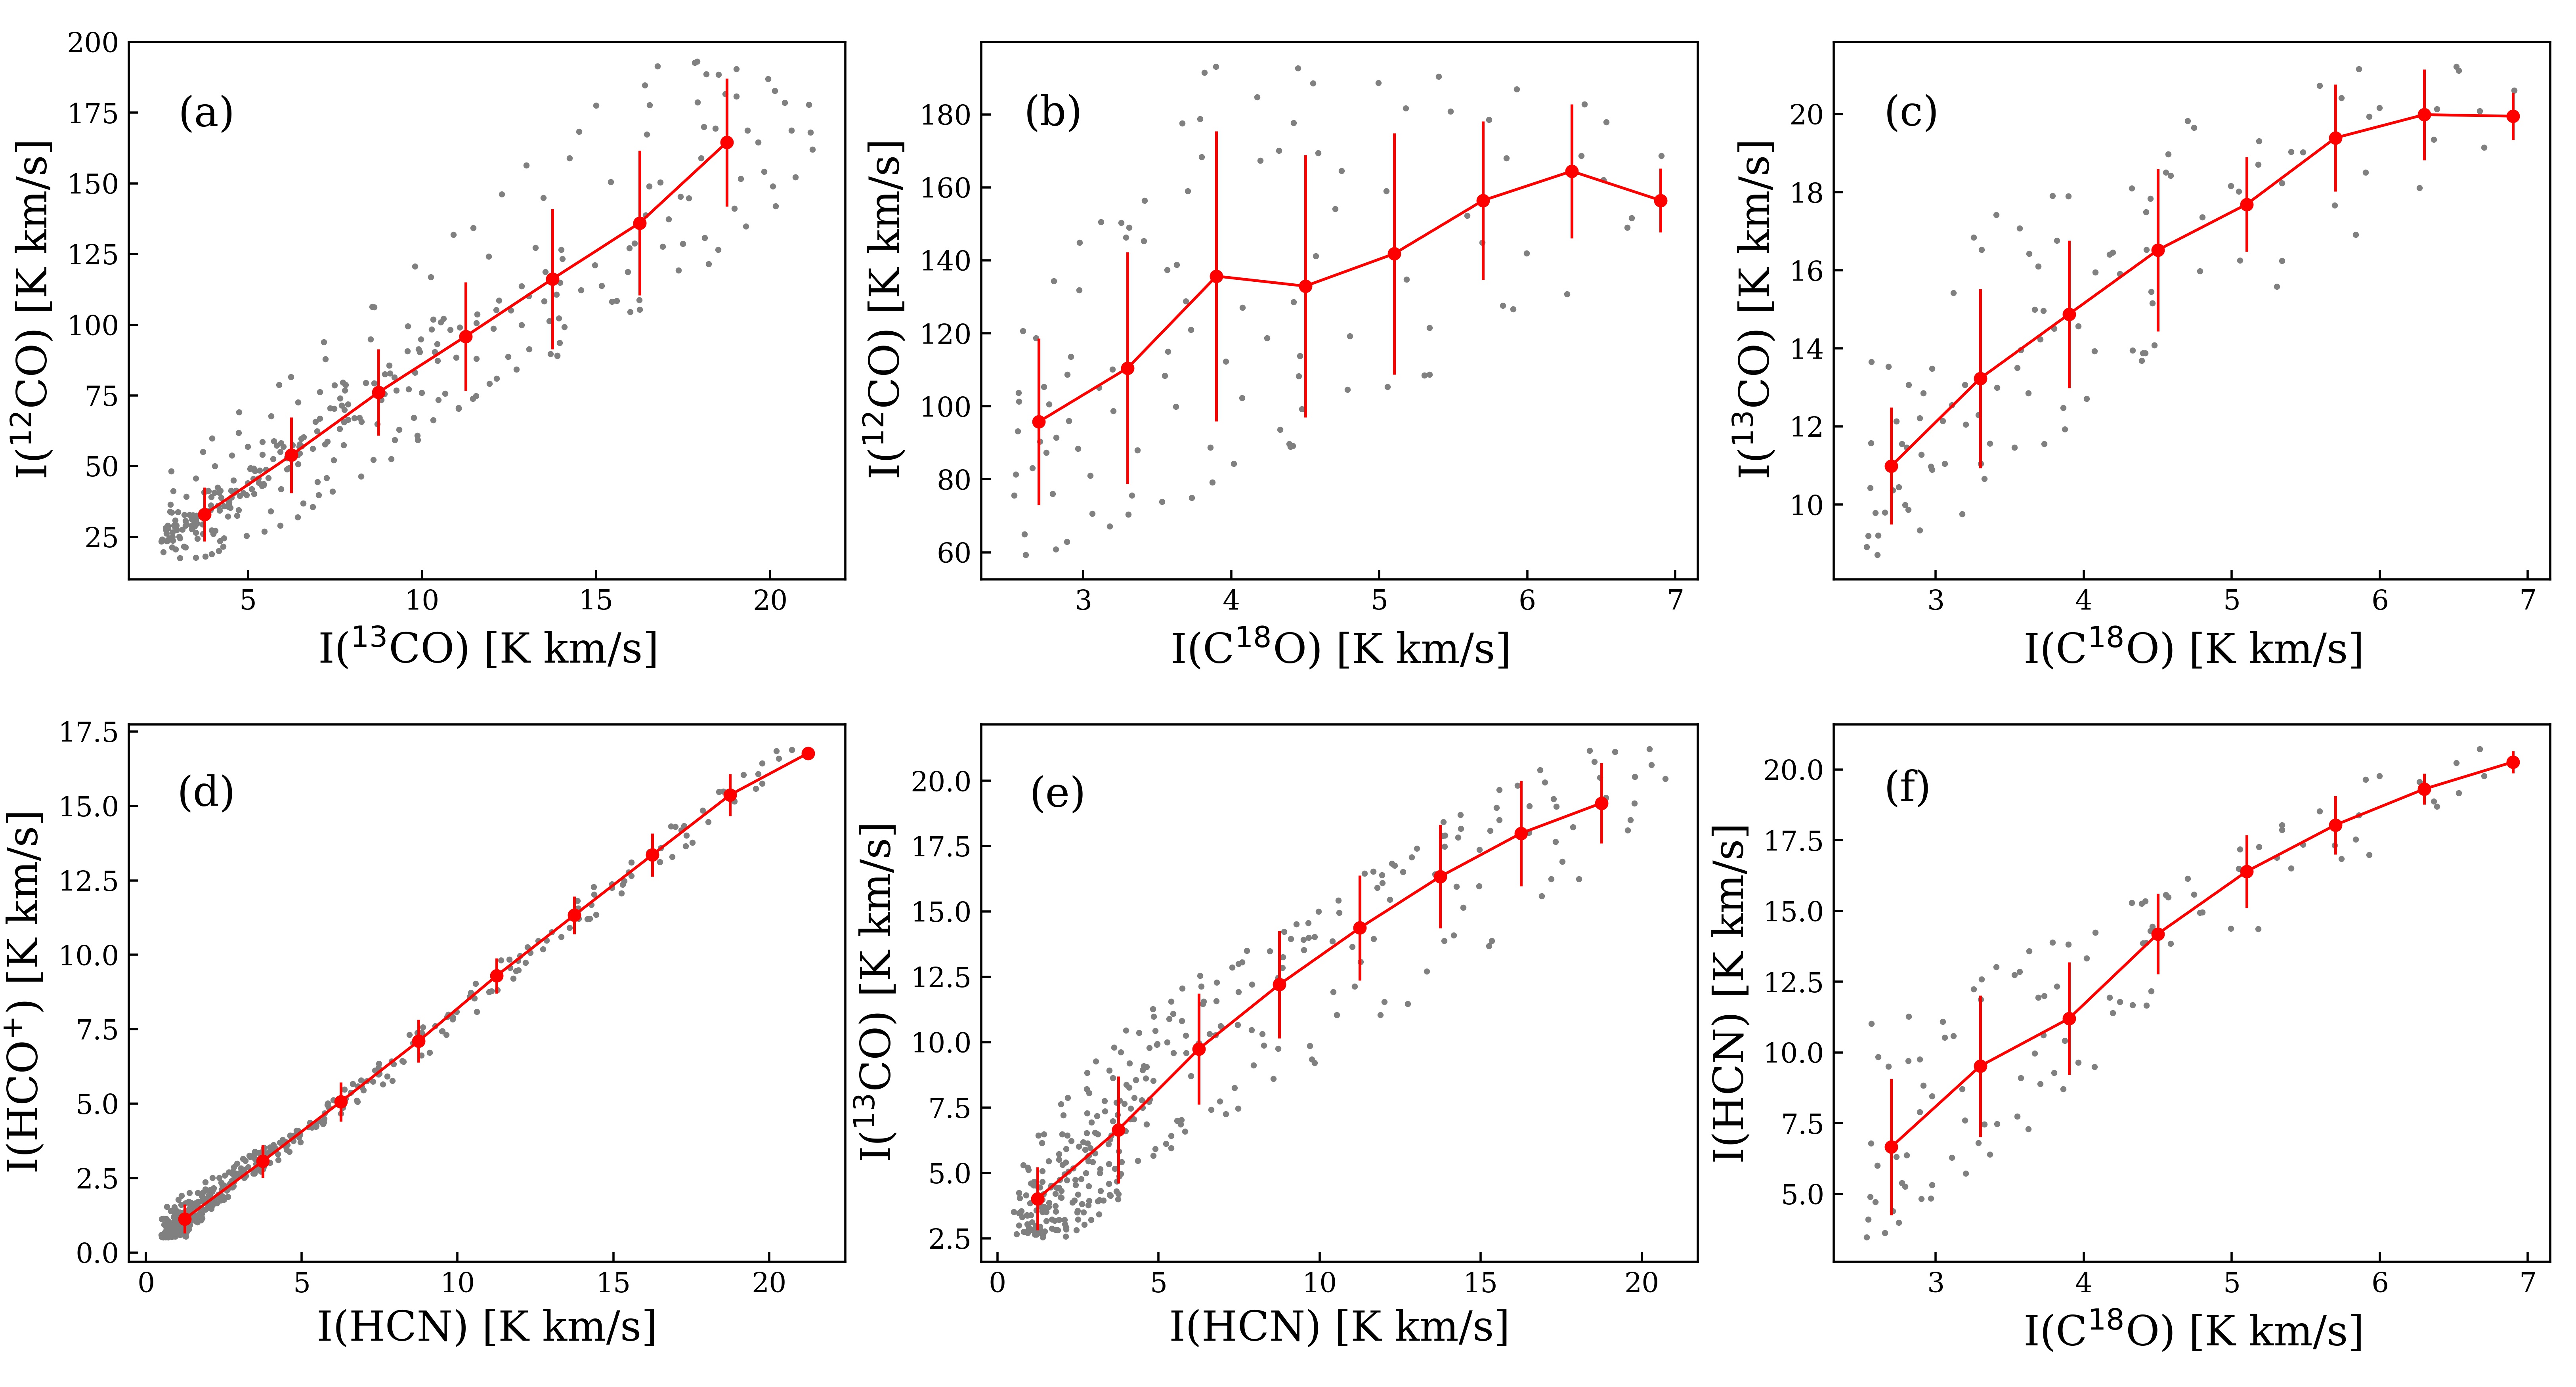
We compare the intensities of the lines of the five molecular species to understand their ability to probe different physical conditions in the nuclear bar region of IC 342. To quantify the differences shown in molecular emission distributions, we convolved all images to 10.7′′ (the resolution of the HCN and HCO+ maps; see § 3.1) resolution. We present the ratio maps in Figure 2, and compared integrated intensities pixel-by-pixel between different species in scatter plots in Figure 4. The ratio maps present how the relative spatial distributions change, while the scatter plots provide information of the overall changing trend as the line intensities change.
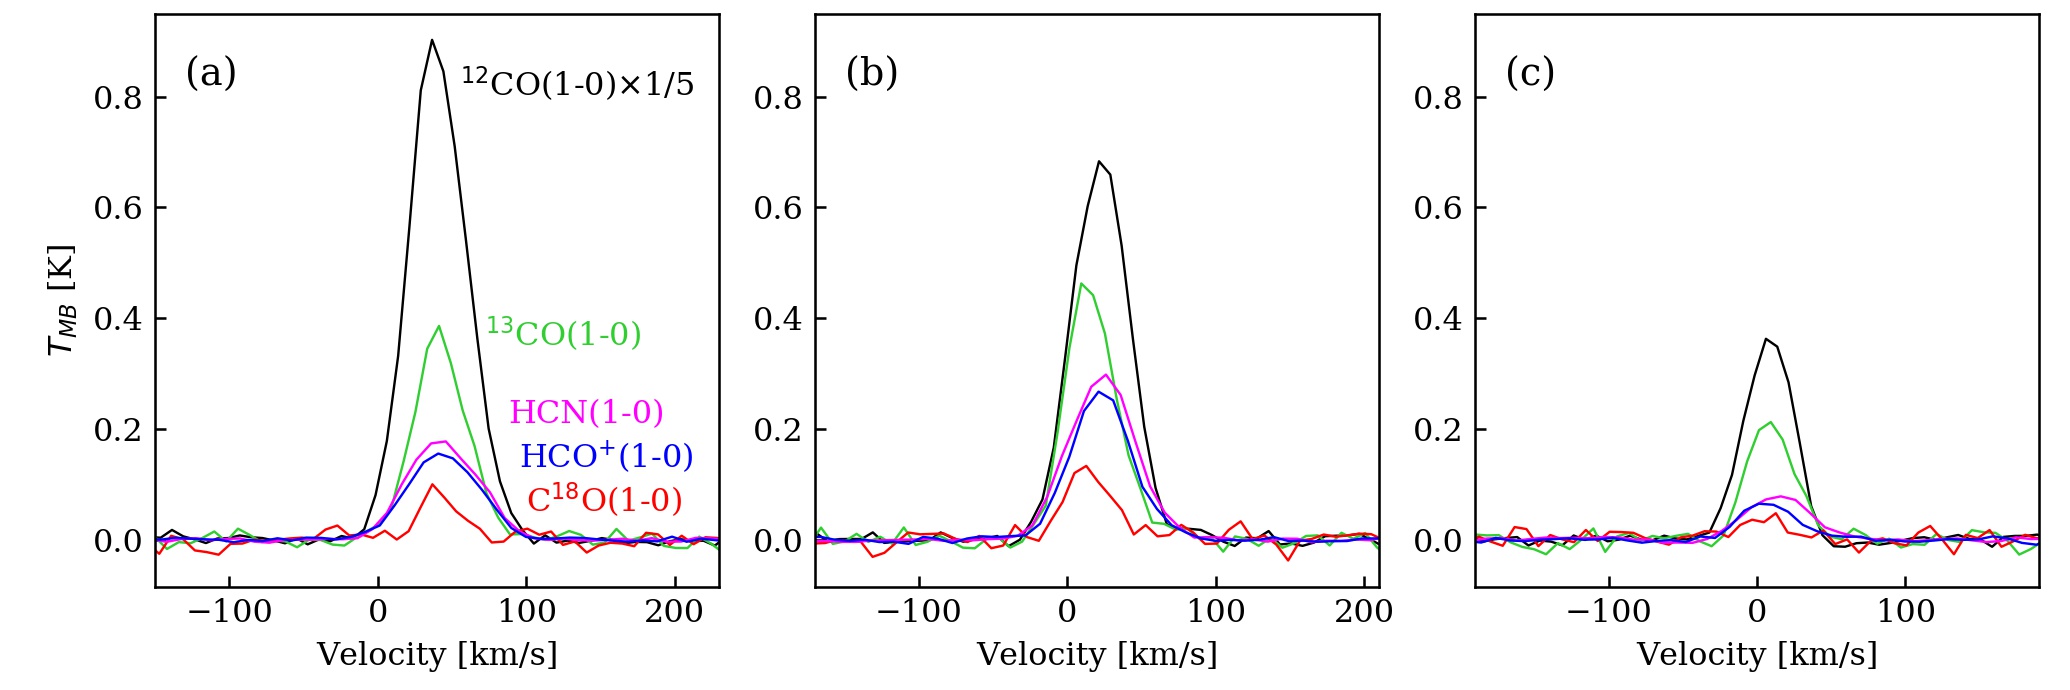
The interpretation of the physical conditions of the line ratios is considered from two aspects: the optical depth and the excitation condition. Because all five species have similar line widths (see Figure 3), the integrated intensity ratio between any two lines, or , is mainly determined by the peak temperatures of the two line spectra. For each individual line, the peak temperature is
| (1) |
where is the excitation temperature, is the line optical depth, and is the filling factor. is the Rayleigh-Jeans corrected excitation temperature defined as follows:
| (2) |
When there is no partial coverage (), approaches the kinematic temperature, , if the lines are fully thermally excited, i.e., the volume density is higher than and the =1–0 transition is collisionally de-excited. Therefore, if both lines are thermalized, the line intensity ratio equals the ratio of . Specifically, if the lines are optically thin (), we can interpret the line intensity ratio as the column density ratio, or equivalently, the abundance ratio. Otherwise, if the lines are optically thick, the line intensity ratio would be the ratio of .
We describe the intensity ratios of different molecular species in IC 342 indicated by Argus (Figure 4) in the following paragraphs, relying on intuition informed by the RADEX (Van der Tak et al., 2007) modeling process described in much more detail in Section 4.1. A summary follows describing the implications for each ratio that we examined, as well as contextual references for the same ratios studied in similar environments:
12CO vs. 13CO
While the ratio map between 12CO and 13CO shows that their intensity peaks do not overlap, Figure 4a shows that (12CO) and (13CO) overall have a linear correlation. (12CO)/(13CO) = 10.4 2.2, and is within the range of the ratio Meier & Turner (2001) found, which is from 4 to 12, measured by ′′ resolution by the Owens Valley Radio Observatory Millimeter Interferometer. The range of (12CO)/(13CO), , is much smaller than the abundance ratio in the Galactic center (247, Halfen et al., 2017). While this may imply that 13CO has optical depth while 12CO is optically thick, another possibility is that 13CO has a smaller areal covering factor relative to 12CO (between 0.1 to 0.2) because of its substantially lower effective critical density than 12CO, once radiative trapping is taken into account. We suggest that 13CO is not optically thin because of the linear intensity relation with optically thick 12CO; this conclusion can be also supported by the fact that 13CO intensity saturates at high C18O intensities (see below).
12CO, 13CO vs. C18O
The spatial distribution of C18O is mostly concentrated on the brightest regions of 12CO and 13CO due to our detection limit on C18O (Figure 2). The saturation effect is therefore important when comparing the intensities of C18O to 12CO and/or 13CO in the brightest region (Figure 4b and 4c). (12CO)/(C18O) and (13CO)/(C18O) range from 26–42 and from 2.5–4. (13CO)/(C18O) is smaller than a typical Galactic center value of 10 (Dahmen et al., 1998). This result suggests that either there is a small filling factor of C18O compared to 13CO, or that 13CO has an intermediate optical depth (see equation 1). The saturation of 13CO at bright C18O suggests that 13CO with an intermediate optical depth is more likely. If we assume C18O is optically thin due to its low abundance, we may derive H2 column densities directly from (C18O) following equation 2 in Meier & Turner (2001). For between 10–30 K, we derive 1.2–3.11022 cm-2.
HCN vs. HCO+
The morphology of HCN and HCO+ emission are almost identical, so the intensity of HCN and HCO+ has a tight relation: the Pearson correlation coefficient is 0.998. The tight relation yields a line intensity ratio , defined as (HCN)/(HCO+), of (Figure 4d) across the entire 1 kpc bar region. The ratio, which is larger than one, also suggests that both lines likely have intermediate optical depths. We note that for HCN and HCO+, the critical densities are similar enough that filling factors will also be similar. Because the interstellar medium and particularly the interstellar medium of a bar region is complex and fractal, it is likely to have gas in a variety of states. Therefore, such a constancy of indicates that in the bar region of IC 342 is insensitive to locally varying physical conditions. HCN(1–0) and HCO+(1–0) lines cannot both be subthermally excited, because emissions from subthermal excitation conditions are strongly influenced by the varying environment across the whole nuclear bar, assuming that the bar is unlikely to be homogeneous for the whole 1 kpc region. We need to look for a parameter space that is insensitive to modest changes of physical conditions over a large region and will discuss the certain set of environmental conditions that the constant constrains further in Sec. 4.1.
13CO and C18O, vs. HCN and HCO+
We present (13CO)-(HCN) and (HCN)-(C18O) correlations in Figure 4e and 4f. Only HCN emission is included in the comparison, because (HCO+) has a tight correlation with (HCN) and nearly identical correlations to intensities of 13CO and C18O. As Figure 4e and 4f show, while (13CO) saturates at high (HCN), (HCN) slightly saturates at high (C18O). We conclude that the saturation of (13CO) in high (HCN) is the result of the optical depth effect on 13CO, although we note that HCN approaches large opacity as well at its high intensity. When 13CO has a high optical depth, it will cover the more extended envelope of the cloud than seen in HCN, which becomes optically thick in the smaller cloud core regions. Compared to 13CO, C18O thus is a better tracer of the true distribution of the molecular gas. Compared to HCN and HCO+, C18O constrains the column density of the dense molecular gas in the center of IC 342 better because its emission is optically thin in that region, but they are comparable at lower intensities.
4 Discussion
4.1 (HCN)/(HCO+) As a Relative Abundance Tracer

As was summarized in § 3.2, our observations have revealed a nearly constant intensity ratio of 1.20.1 across the 1 kpc nuclear bar of IC 342 at a spatial resolution of 8′′ (100 pc). Such an (1.20.1) puts strong constraints on the physical conditions and indicates the inherent degeneracy of different physical parameters. To understand the constraints and the implication, we investigate three questions in this section.
First, what is the relation between the parameter space of the physical conditions and a specific value of (specifically, of 1.2 in IC 342, see § 4.1.1)? Second, when multiple areas in parameter space are permitted theoretically, which ones are physically realistic (§ 4.1.2)? Third, how do we reconcile conclusions from the two questions above with the - relation seen in other galaxies (§ 4.1.3)? Interpreting this galactic - relation requires a good understanding of how is determined by the properties of the molecular gas. Compared to unresolved galaxy samples that established the relation, in this paper, the constant over a 1 kpc scale in IC 342 provides constraints to the physical conditions of molecular gas from a new perspective: in other words, can be relatively constant over a wide range of physical parameters.
We discuss each of the questions in subsections below to conclude that is a good relative abundance tracer of HCN and HCO+in IC342 and that the similar trends seen in the ratios of HCN/HCO+ of other galaxies suggest that they may also be tracking abundance patterns there.
4.1.1 Permitted Parameter Space for a Fixed
We investigate how a fixed value of of 1.2 is realized in IC 342 by building the radiative transfer model with different physical conditions and comparing the inferred intensity ratio, , to the observed values.
First, we assume HCN and HCO+ coexist and that the (1–0) emission lines originate from the same regions under the same temperatures and densities. The assumption is based on the similar morphology, the line profiles among HCN and HCO+ (see § 3.2), and that HCN and HCO+ have similar critical densities. Then, we apply an escape probability formalism for a uniform sphere geometry, and use a one-component radiative transfer model with RADEX (Van der Tak et al., 2007) to explore the value of over a grid of solutions in the space of the density () and the column density (). The optical depths and the brightness temperatures are calculated under the corresponding parameter space to determine (see Appendix A for details). Specifically, , , and are all taken as constant properties within a beam.
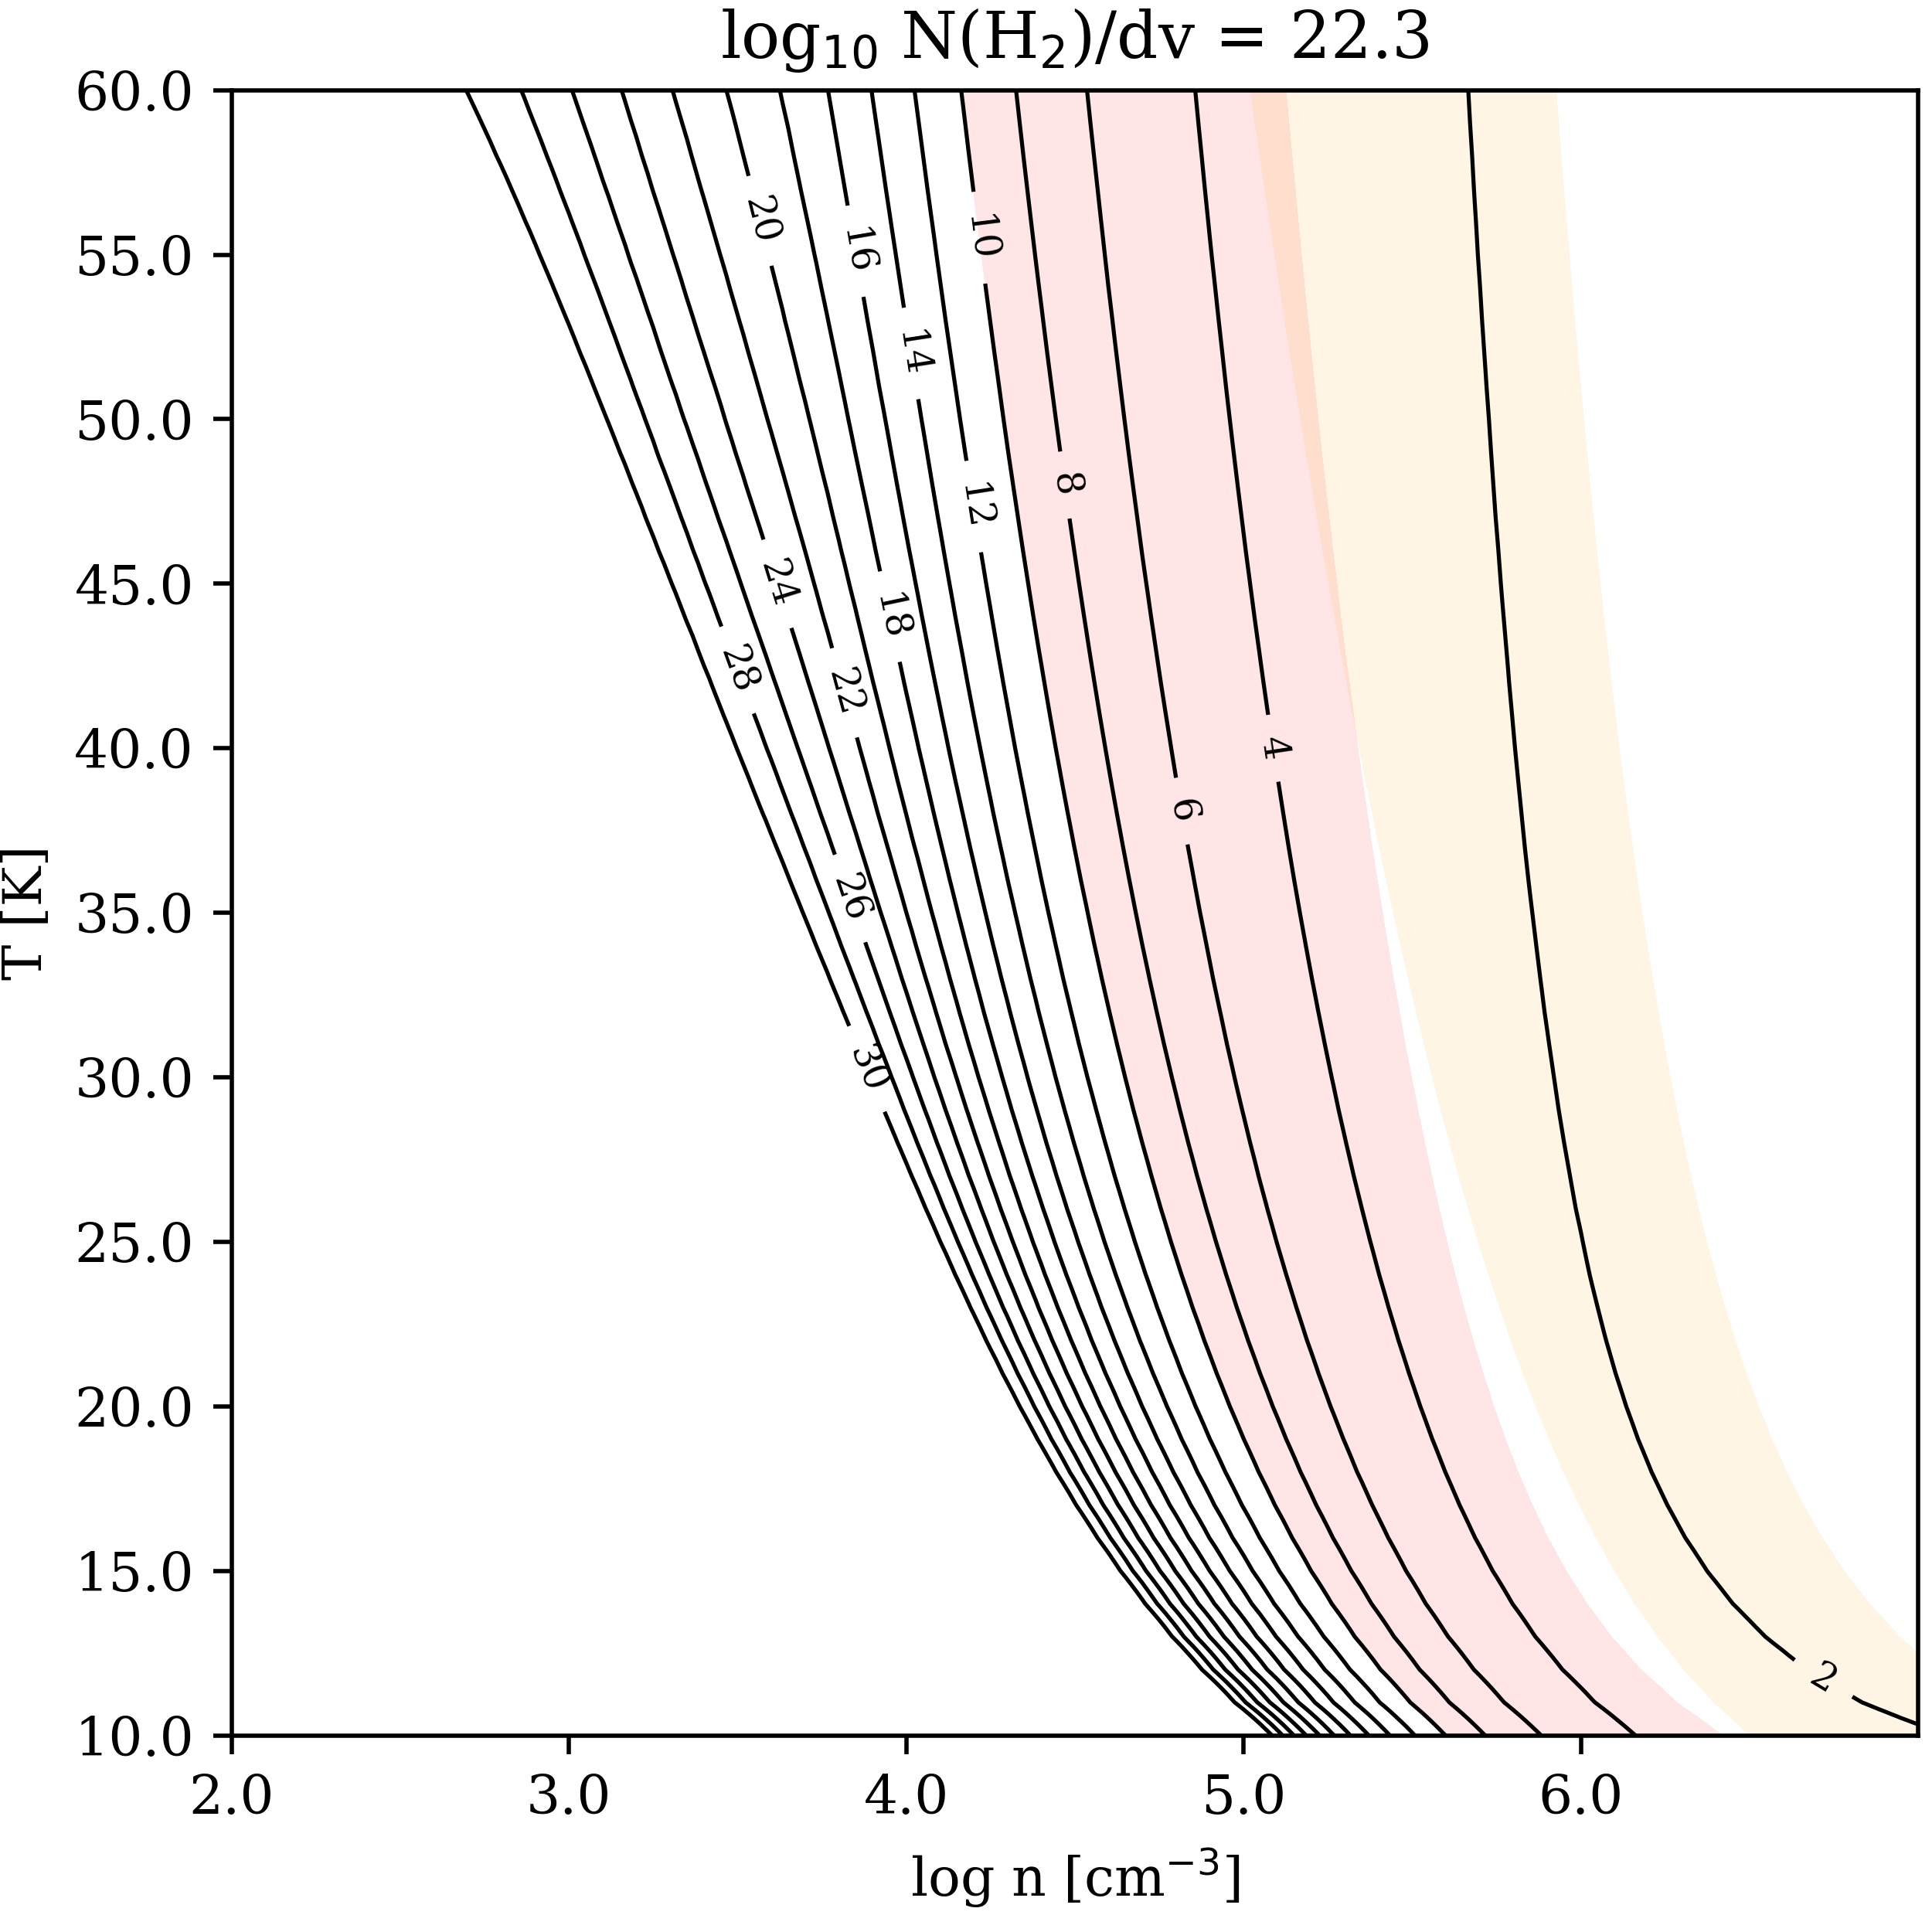
We present in the left panel of Figure 5 the grid of solutions in the parameter space that produces . Axes are and . The range of is chosen from – cm-3, and is from cm-2/50 km s-1. The abundance of [HCO+/H2] is fixed at 2 (the Galactic value adopted by Krips et al., 2008), and the abundance of HCN is scaled relative to HCO+. Contours in the non-shadowed regions represent the column density ratios of HCN to HCO+, or equivalently, the abundance ratios that give a fixed constant of 1.2. The shadowed region represents the parameter space without a solution.
We note that the results are insensitive to temperatures from 10 to 100 K, and show calculations for 30K, which is close to the temperature of the molecular gas suggested by Meier & Turner (2001). We also find that changes in the value of the abundance of HCO+ shift the grid of solutions along the -axis (see discussions below) but do not influence our conclusions.
The non-shadowed regions in the left panel of Figure 5 give solutions to ; however, not all solutions are physically realistic. We investigate the constraints on the excitation conditions or optical depth for four different regions marked with circled numbers on the left-hand panel of Figure 5. These constraints are summarized in Table 2.
| Region | Optical depth | Excitation condition | ||
| HCN | HCO+ | HCN | HCO+ | |
| 1 | sub | sub | ||
| 2 | therm | therm | ||
| 3 | 1 | 1.8 | therm | therm |
| 4 | 1 | 1 | sub | sub |
In region 1, both lines are subthermalized and collisions control the level populations. Both lines are very optically thick, and the intensity ratio is determined by the ratio of the excitation temperature . Region 2, in contrast, controls through the relative optical depth together with . In region 2, both HCN and HCO+ have intermediate optical depth, and HCO+ emission is thermalized. In region 3, the particle density is very high, and both lines are thermalized and of HCN and HCO+ are equal. Therefore, the ratio of is a constant. Region 3 thus requires a constant (HCO+) for which = 1/1.2, because HCN emission is optically thick. Such a tight constraint rules out region 3 as a realistic solution. Finally, contours in region 4 are parallel to the horizontal axis. While both HCN and HCO+ are subthermalized in this region due to the low value of , both (HCO+) and the ratio are independent of in this region. Similarly to region 3, we consider the constant in region 4 to be unrealistic.
Since both regions 1 and 2 are the permitted parameter spaces for a fixed with a value of 1.2, we further compare the two regions in § 4.1.2 to see whether they can apply to the whole bar region of IC 342.
4.1.2 Thermal vs. Subthermal in the Bar of IC 342
Our RADEX modeling results show that either region 1 or region 2 are permitted solutions of parameter space for the constant across the IC 342 bar. To further determine whether both regions are equally likely or that one region is more likely than the other, we compare the theoretical predictions with the observations, including the column densities, the optical depths, and the abundance ratios derived from current and/or past studies as direct evidence. As we will conclude below, region 2 (thermal excitation) serves this requirement better than region 1 (subthermal excitation) does. We summarize the key criteria in Table 3.
| Comparison with … | Criteria | Better Region |
|---|---|---|
| Models | Range of [HCO+/H2] | Region 2 |
| Allowed uncertainties for a specific | Region 2 | |
| Observations | Column density measured by C18O(1–0) | Region 2 |
| (HCN) estimated by comparing single-dish/interferometer maps | Region 2 | |
| (HCN) derived through H12CN(1–0)/H13CN(1–0) | N/A | |
| The abundance ratio of HCN-to-HCO+ | N/A |
Theoretical constraints from the RADEX modeling
A constant in the grid of (, ) is produced along the abundance ratio contours (Figure 5). The orientation of the contours reflects certain relationships of and . For example, in region 1, the contour pattern indicates that constant. In region 2, the contour lines resemble more of the condition that is constant, because . This point is illustrated as a group of parallel straight lines with a slope of one in the right panel of Figure 5. The intercept of each line there corresponds to a different [HCO+/H2]. As is shown in Figure 5, while [HCO+/H2] only spans one order of magnitude from 1.6 to 1.6 km s-1 pc-1 in region 2, in region 1 the range is as high as four orders of magnitude. Therefore, the - relation in region 2 is more realistic for a fixed . We note that we justify the feasible parameter space with the product of [HCO+/H2] and , rather than [HCO+/H2] or separately because we do not have much knowledge about each of them. The “indirect” evidence of a constant HCN(1–0)-to-HCO+(1–0) ratio across the IC 342 bar fits the movement of points along the abundance ratio contours of region 2 better. If points on the (, ) space move along the constant direction in the grid, region 1 has a smaller tolerance on the uncertainties to the solutions of a specific . We illustrate this in the right panel of Figure 5, in which we only keep contour lines in regions 1 and 2 for clarity. Specifically, the red- and grey-shadowed regions represent from 1.1 to 1.2, and from 1.2 to 1.3, a range that represents the uncertainty level we have observed in IC 342. While the wider shaded region in region 1 seems to allow for a larger permitted parameter space under from 1.1 to 1.3, the permitted range along the constant is actually much smaller than that of region 2.
Observational constraints
We also consider observational constraints on the column densities, the optical depths, and the abundance ratio to discuss which region on the grid of (, ) is the preferred parameter space for the bar of IC 342.
We make the assumption that C18O and HCN (or HCO+) trace the same gas to compare column densities and decide which excitation region better represents the conditions in IC 342. As we have shown in § 3.2, the corresponding (or ) is cm-2 (or 1020.3 cm-2 km s-1). This value agrees better with the column density referred to by region 2.
The comparison between the single-dish GBT/Argus image and the interferometric images shows that HCN has an intermediate optical depth. In observations by interferometers PdBI in Downes et al. (1992) and Schinnerer et al. (2008), several (3–5) individual giant molecular clouds (GMCs) on scales of 80 pc were found encircling a 100 pc hole at the center of IC 342. If material on the near side of the nucleus had high optical depth, the GMCs revealed by the interferometers would then be behind an opaque screen and would be invisible, either spatially or in the velocity space. An alternative explanation is that the foreground screen consists of a collection of high opacity but clumpy HCN cores not yet resolved by the interferometer (e.g., 1 pc scales, and the gaps between the cores are much smaller than the GBT beam.
Results from past observations of isotopologues of HCN in IC 342 can be consistent with either region 1 or region 2 (Downes et al., 1992; Wilson, 1999; Schulz et al., 2001; Schinnerer et al., 2008). Schulz et al. (2001) measured H12CN(1–0)/H13CN(1–0) over GMCs in the center of IC 342 and found a value of . This value is larger than one, and even larger than the local [12C/13C] ratio of (Halfen et al., 2017). These measurements indicate the partial coverage of H13CN relative to H12CN must be smaller than one. A fractional coverage of 0.1 would result in a high optical depth of H12CN, and a fractional coverage of 0.4 would give H12CN an intermediate optical depth ().
A known abundance ratio of HCN to HCO+ could distinguish between regions 1 and 2 if the range of its values could be constrained to order of unity (region 2) or order of ten (region 1). Theoretical models can predict the abundance ratio of HCN to HCO+. For example, shocked molecular clouds allow possible endothermic reactions to occur and gas-phase ion-molecule reactions to proceed in the compressed layers, so the abundance of HCO+ could be suppressed by at most two orders of magnitudes (see Figure 1 in Iglesias & Silk, 1978). As a comparison, models of PDRs mostly yield [HCN/HCO+]1 (Papadopoulos, 2007). Since bar-induced shocks and PDR regions produced by the central starburst (Meier & Turner, 2005) coexist in the nucleus of IC 342, we cannot distinguish region 1 and 2 through the predictions on the abundance ratio.
4.1.3 Thermal vs. Subthermal in the General Case
We described in § 4.1.1 and Table 3 that we favor region 2 more than region 1 in the nuclear bar region of IC 342. The most common interpretation for in the literature, however, is subthermal excitation together with large optical depth, or the physical conditions indicated by region 1. As we will describe in detail below, this interpretation is often used for determining the - or the -AGN/SB relationships, whereas these relationships are typically inferred from unresolved or low spatial resolution observations (e.g., Krips et al., 2008; Jiménez-Donaire et al., 2017).
The degeneracy in solution between regions 1 and 2 that we have seen in IC 342 is unlikely to be unique to this galaxy (Table 3). Therefore, we investigate (1) whether region 1 is the only possible solution to single-beam observations on samples of external galaxies, and (2) whether region 2 serves as a proper solution if external galaxies are spatially resolved and still have a constant .
We first revisit how region 1 was derived from unresolved or low spatial resolution observations. Take NGC 253 as an example: it has spatially resolved and indistinguishable HCN(1–0) and HCO+(1–0) maps (Knudsen et al., 2007), and a constant of 1.4 is measured for the two maps. Knudsen et al. (2007) compare the (1-0) maps of NGC 253 to the single beam (3-2) data and conclude that both HCN(1–0) and HCO+(1–0) are optically thick and are subthermally excited ( = 105.2 cm-3 at 50 K).
We can derive the same conclusion for IC 342 using the same analysis method. For IC 342, the James Clerk Maxwell Telescope (JCMT) observed =4–3 transitions of HCN and HCO+ (Tan et al., 2018). We convolved the =1–0 image to the 14′′ beam resolution of HCN(4–3), and found that the line intensity ratio of (1–0)/(4–3) (hereafter referred as ) is 3–10 for HCN, and 2.5–6 for HCO+, respectively. Using the same parameters in RADEX as § 4.1.1 over the one-component model, the range of corresponds to from 104.5–105.5 cm-3 (Figure 6) if HCN(1–0) is optically thick (1). This result coincides with region 1 (see Figure 5) and seems to be consistent with the condition that Knudsen et al. (2007) have suggested.
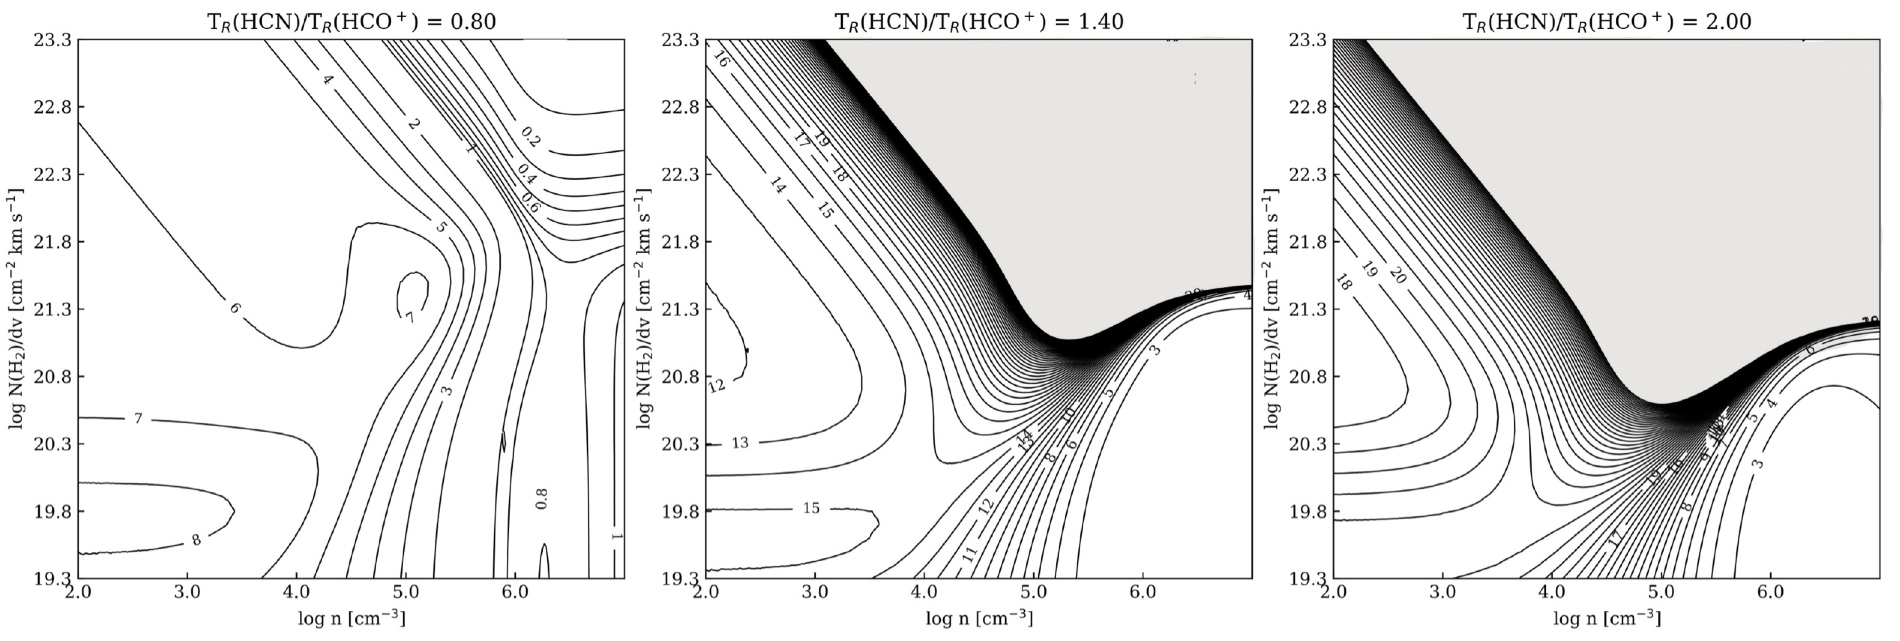
However, such a combination of the column density and the particle density is not the unique solution that comes from single-beam observations. For example, a combination of a column density that is 10 times lower, an intermediate optical depth close to one, and a high at which HCN(1–0) is thermalized also produces in range of 3–10 (see the orange area in Figure 6).
We, therefore, conclude that region 1 may not be the only possible solution to single-beam observations of external galaxy samples. This is because, in the analysis above, single-component modeling of emission from states with very different excitation conditions is likely an oversimplification. First, is insensitive to either temperature or [HCN/H2], but is very sensitive to (see Figure 6). A small variation in the value of the line intensity ratio will change the result of significantly and will bring a large uncertainty on the derived . Second, the one-component model used in analyzing smoothed intensity ratios in a large beam does not represent the actual physical conditions, because high- lines require much higher critical densities for thermalization. While is tracing more of the bright =4–3 lines, it probes more of the fraction of high excitation materials within the beam, or equivalently, the mean particle density.
We next investigate whether region 2 serves as a proper solution to situations where external galaxies are spatially resolved and still have a constant . We examine solutions of the (, ) parameter space when is between 0.8 to 2, a range that is typical in a sample of galaxies when the - or -AGN/SB relations are discussed (e.g., Krips et al., 2010). Figure 7 presents the solutions to = 0.8, 1.4, and 2. For = 0.8 (or that is smaller than one), all (, ) pairs have a solution for the abundance ratio. This is because HCO+ has a smaller critical density and is thermalized more easily than HCN. If is larger than one, the solution in the (, ) grid is similar to that of = 1.2 (see Figure 5). Specifically, as increases, the upper limit of the allowed solution for at cm-3 decreases, and the corresponding abundance ratio for (, ) at cm-3 increases (see Figure 7). Such a behavior explains why the value of as large as, for example, 5, is not seen in external galaxies. For such a high value of , there is no solution in the (, ) grid at cm-3. At cm-3, the (, ) solution requires an abundance ratio of 50 that is unlikely. This is consistent with conclusions from Yamada et al. (2007) or Graciá-Carpio et al. (2008) that very high HCN/HCO+ intensity ratios require extreme abundance ratios.
Figure 7 shows that being smaller than one is not a peculiar result and does not put strong constraints on physical conditions. In contrast, with a value larger than one can be used to constrain physical conditions. Therefore, for external galaxies that are spatially resolved and have a constant distribution with values larger than one, we can conclude that region 2 is still the preferable parameter space because we require a parameter space that is insensitive to the change of physical conditions across a large physical scale, which refers to the nuclear bar region regarding IC 342 (see § 4.1.2). Furthermore, we emphasize that the corresponding abundance ratio in region 2 changes under different . This implies that , or the HCN-to-HCO+ intensity ratio, is more sensitive to small changes in the abundance ratio than changes in temperature or particle density.
The idea that the HCN-to-HCO+ intensity ratio traces abundance is related to using as a potential diagnostic tool to distinguish AGN and starbursts in galactic nuclei. It has been argued that the abundance ratio of HCN to HCO+ is sensitive to the environment which hosts an AGN or a starburst (e.g., Graciá-Carpio et al., 2006; Imanishi et al., 2006, 2007). First, HCN can be enhanced chemically either by FUV radiation from young massive star-forming regions or through strong X-ray radiation from an AGN. AGN are therefore likely to have a higher HCN abundance since X-ray radiation penetrates more deeply into gas clouds than UV radiation. Second, evolved starbursts tend to have a lower HCN-to-HCO+ abundance ratio due to the ionization effects from cosmic rays from supernovae. The ionization effects potentially increase the HCO+ abundance and decrease the HCN abundance (e.g., Behrens et al., 2022; Krips et al., 2008; Meijerink et al., 2011).
In conclusion, (1) region 1 does not uniquely account for multi-line constraints from single-dish observations, and (2) samples of external galaxies in the - or -AGN/SB relation, if they are mapped with finer resolution, might still have a constant across HCN/HCO+ emitting region. And if is larger than one, region 2 is the preferable parameter space. In this case, is insensitive to the exact condition of the two species and is telling more of the relative abundance of the two species. This in turn relates to the existence of AGN or starbursts.
4.2 Breakdown of the HCN-IR Correlation at High Spatial Resolution
On a galactic scale, a scale-dependent scatter was previously observed with CO in the relation between the molecular gas surface density and the SFR (e.g., Schruba et al., 2010; Momose et al., 2013; Kruijssen & Longmore, 2014; Kreckel et al., 2018; Pan et al., 2022). Such a relationship breaks down on smaller spatial scales due to incomplete sampling of star-forming regions by CO emission. Argus on the GBT, on the other hand, with its relatively high (6–8′′) spatial resolution and excellent surface brightness sensitivity, provides a unique opportunity to inspect a similar breakdown in the - relationship in nearby HCN-bright galaxies as the spatial resolution decreases (Figure 8). In earlier studies with the IRAM 30 m telescope, the EMPIRE survey (Jiménez-Donaire et al., 2017), at 30′′ resolution, reveals that the ratios of HCN/CO and HCN/IR show correlations with radius, galaxy surface mass density, molecular gas surface density, and gas pressure.
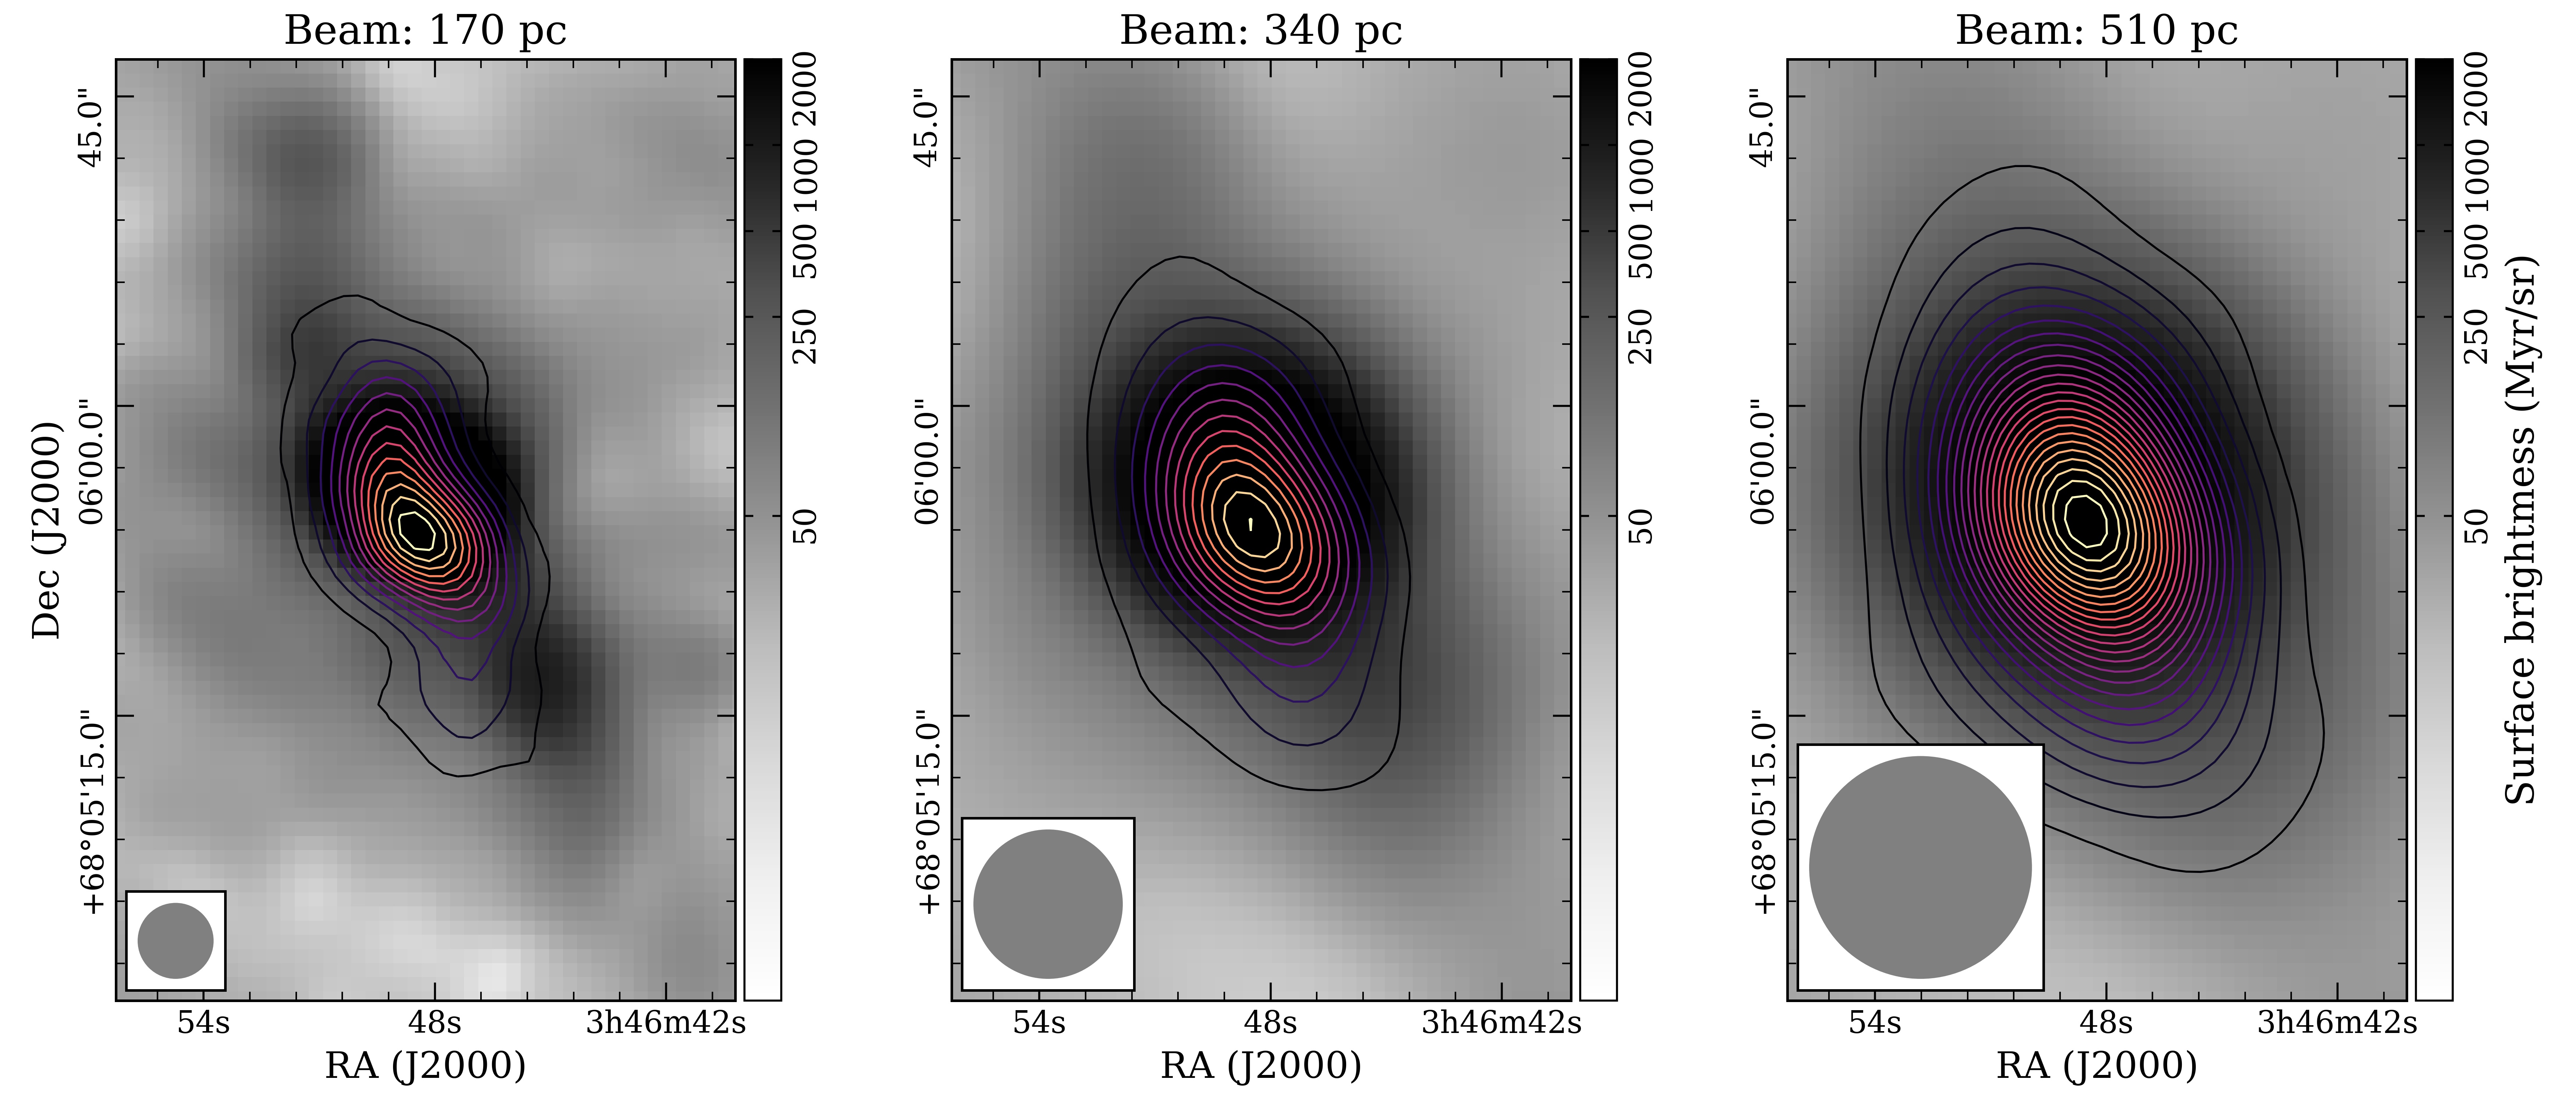
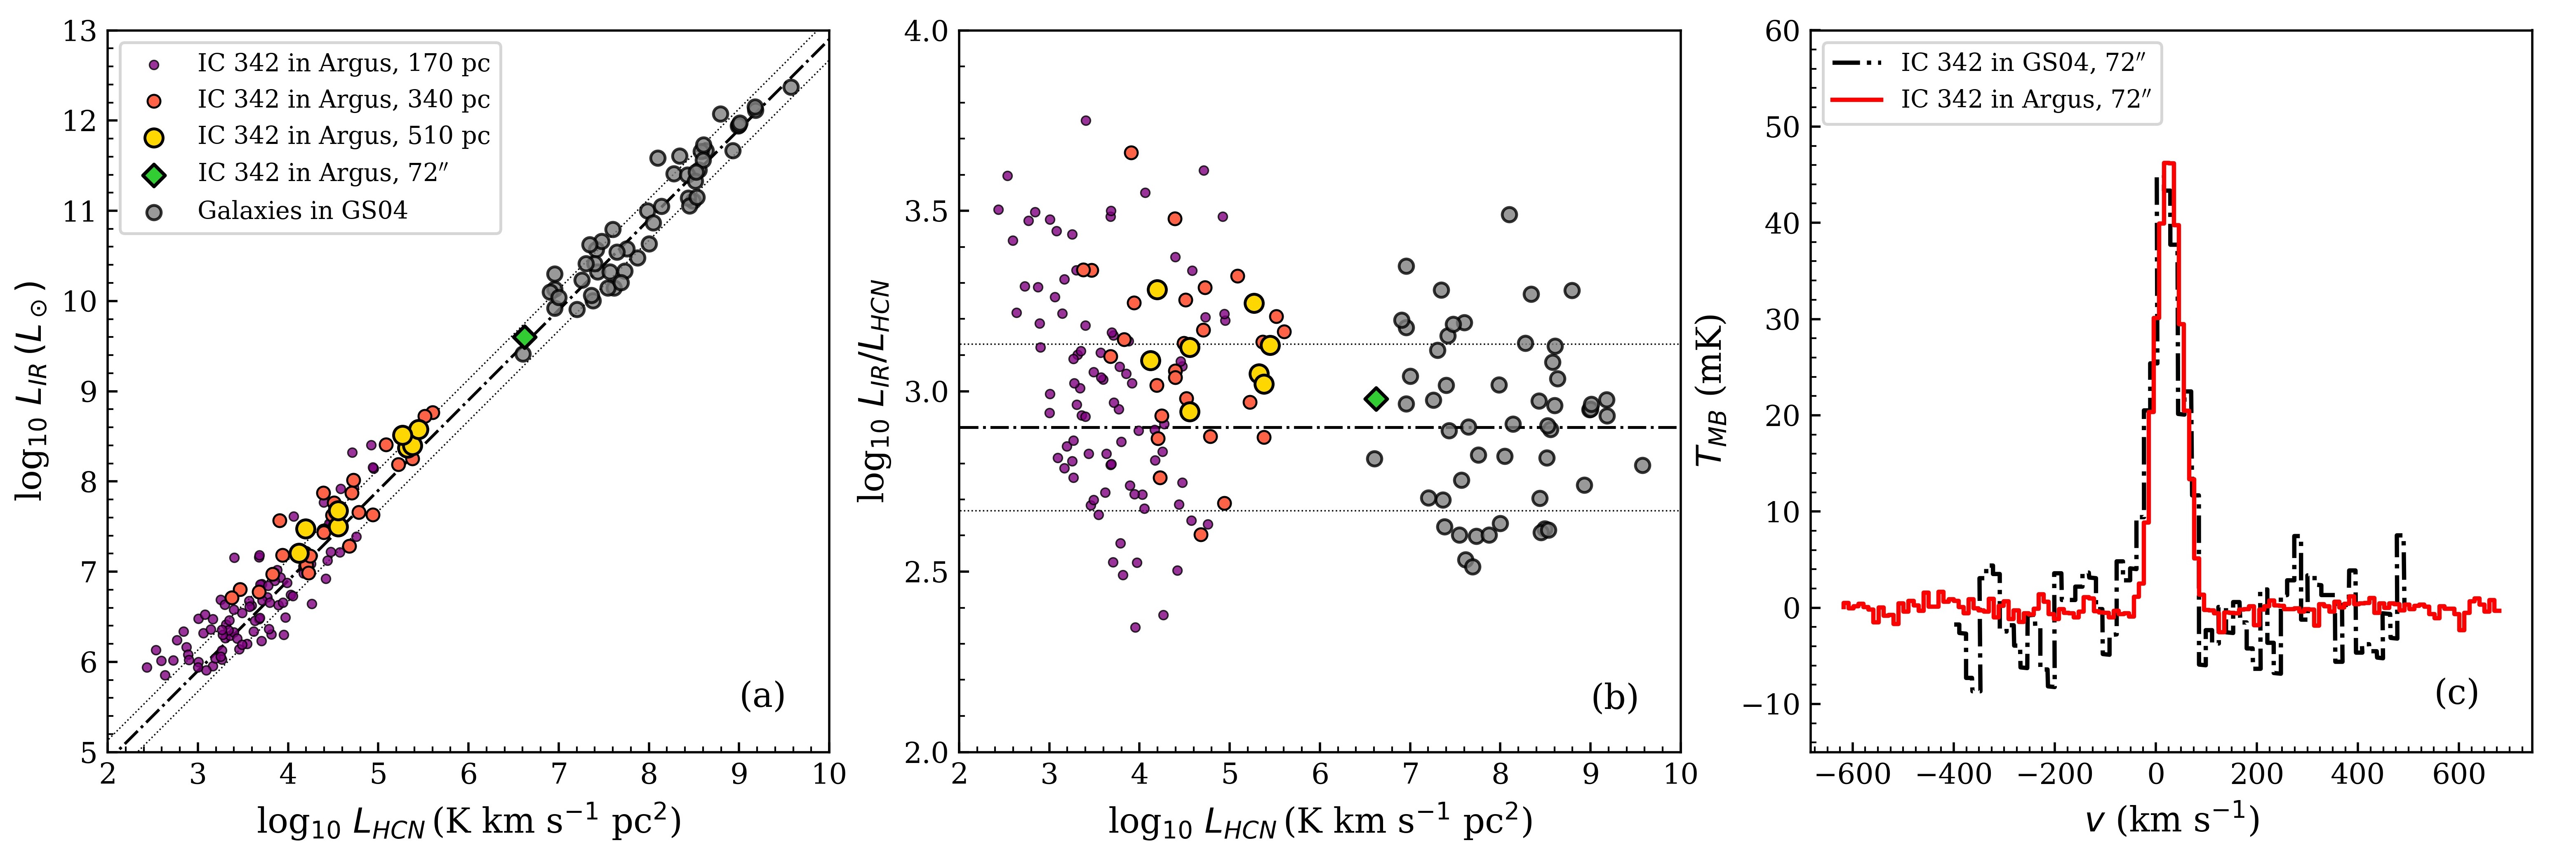
We present in Figure 9a and 9b the - and the /- relation on scales of 170 pc (10′′), 340 pc (20′′), and 510 pc (30′′) obtained by convolving our Argus HCN image to different beam sizes. The HCN luminosity, , was derived from the integrated intensities following Gao & Solomon (2004a). We confirm that the measurements of the line intensities from the two studies are consistent by presenting in Figure 9c the HCN spectra observed from a 72′′ beam at the same position, although we note that there is a blue-shifted wing in the Gao & Solomon (2004a) spectrum that we do not detect. The total infrared luminosity, compared to IRAS data used in Gao & Solomon (2004a), was calibrated from the brightness in the Herschel 70 m band (Kennicutt et al., 2011), adopting calibration coefficients from Galametz et al. (2013). The converted is consistent with that in Gao & Solomon (2004a) derived from IRAS data (Figure 9a and 9b). All the data points on (sub-galactic) scales from 170 to 510 pc fall on the Gao & Solomon (2004a) relation with a slope of one (Figure 9a and 9b).
Table 4 summarizes the variation of the scatter, i.e., the standard deviation of log, of Argus data to the - relation of which the power is one under different sampling sizes. The scatter drops as the spatial scale increases. The scatter for the smallest (170 pc) scale of the corresponding - relation is only 1.3 times the scatter for beam-averaged external galaxies, which is comparable to the scatter at 340 pc in IC 342. As Figure 1 shows, Argus resolves the angular offset between the IR emission and molecular gas emission with a 100 pc resolution. The scatter at a 340 pc scale therefore intrinsically reflects this angular offset.
| Regions | ||
|---|---|---|
| 170 pc | 3.02 | 0.31 |
| 340 pc | 3.10 | 0.23 |
| 510 pc | 3.11 | 0.10 |
| GS04aaValues adopted from Gao & Solomon (2004a). | 2.92 | 0.23 |
The scale-scatter breakdown observed in CO is interpreted as an incomplete sampling of star-forming regions. Specifically, Schruba et al. (2010) propose that the breakdown reflects a temporal evolution process of gas depletion in star formation revealed by different spatial scales. However, we may not conclude that the breakdown in the - relation of IC 342 is also due to the gas depletion in star formation because the shift between and is from the bar rotation, as the evolution in IC 342 is possibly influenced by the passing density wave (Turner & Hurt, 1992). We can only argue that the HCN(1–0) emission is more strongly correlated with star formation when averaged over large regions of IC 342 than measured at high resolution. The high-resolution observations suggest that the relationship begins to break down on smaller 340 pc regions. As a reference, we note that Murphy et al. (2015) has reported a spatial offset between HCN (and HCO+) with the continuum tracing star-formation on a physical scale of 130 pc in NGC 3627.
We conclude that HCN(1–0) emission can serve as a good star formation tracer if a certain spatial sampling criterion is satisfied, although this may not fully reflect a dense gas-to-star formation relation. More samples with spatially resolved HCN emission from the DEGAS survey should provide a further understanding of the criteria that sustain the tight global - relation.
5 Summary
We have observed ground state transitions of 12CO, 13CO, C18O, HCN, and HCO+ from the external galaxy IC 342 with the 16-pixel spectroscopic focal plane Argus array on the 100-m GBT. These data provide single-dish measurements at high spatial resolution (6–10′′, 100 pc). The gaseous nuclear bar is mapped in all five transitions and 12CO(1–0) observations reveal the two inner spiral arms. The morphology of molecular gas traced by 12CO(1–0) and 13CO(1–0) differs from that of HCN(1–0) and HCO+(1–0), indicating different sensitivity of these molecular gas tracers to different physical conditions. 13CO(1–0) traces the surface layer of molecular clouds as 12CO(1–0) does due to radiative trapping. HCN emission correlates well with infrared emission tracing recent star formation as long as a sufficiently large sampling scale (e.g. 340 pc for IC 342) is satisfied.
Our Argus observations show that the intensity of spatially resolved HCN(1–0) and HCO+(1–0) emission have a remarkably tight correlation, of , with independent measurements at 100 pc resolution over the entire 1 kpc bar. This suggests that the line ratio of HCN(1–0) to HCO+(1–0) is insensitive to local varying physical conditions across the center of IC342. We use RADEX with a one-component model to explore the permitted parameter space over this constant line ratio and identify the preferred region to realize the insensitivity of the line ratio to the environments. Our investigation also searches for available parameter space for HCN(1–0)/HCO+(1–0) ratios observed among other external galaxies. For IC 342, we conclude that the HCN(1–0) and HCO+(1–0) emission from the 1 kpc gaseous bar of IC 342 likely have intermediate optical depth and between 104.5–106 cm-3, where HCO+(1–0) is thermalized and HCN(1–0) is close to thermalization. This result is compatible with results derived from analyses with higher- transitions, although it also indicates that the HCN(1–0) and HCO+(1–0) emission from external galaxies may have physical conditions other than large optical depth and specific particle densities that cause subthermalization. The insensitivity of the HCN(1–0)-to-HCO+(1–0) intensity ratio across the center of IC 342 indicates that it is more sensitive to the relative abundance ratio rather than particle densities.
The high spatial resolution of Argus also provides a unique opportunity to inspect the breakdown between the sampling scale and the degree of scatter of the - relation in the nearest HCN-bright galaxies. We find that the scatter of the - relationship decreases as the spatial scale increases from 10′′ to 30′′ (170–510 pc) and is comparable to the scatter of the global relation at the scale of 340 pc.
We would like to thank Dr. Stuart Vogel for useful and constructive discussions, Dr. Karen O’Neil (GBT) for the approval of the DDT request, and the operator teams for their help in the observations. We appreciate the constructive suggestions from the anonymous referee to improve the quality of the manuscript. This work was conducted as part of the “Dense Extragalactic GBT+Argus Survey” (DEGAS) collaboration. We thank the Argus instrument team from Stanford University, Caltech, JPL, University of Maryland, University of Miami, and the Green Bank Observatory for their efforts on the instrument and software that have made this work possible. The Argus instrument construction was funded by the National Science Foundation (NSF) ATI-1207825. The authors acknowledge funding from the award NSF AST-1615647 to the University of Maryland, and NSF AST-1616088 to the University of Miami. The National Radio Astronomy Observatory is a facility of the National Science Foundation operated under cooperative agreement by Associated Universities, Inc.
Appendix A Solutions for a specific line intensity ratio
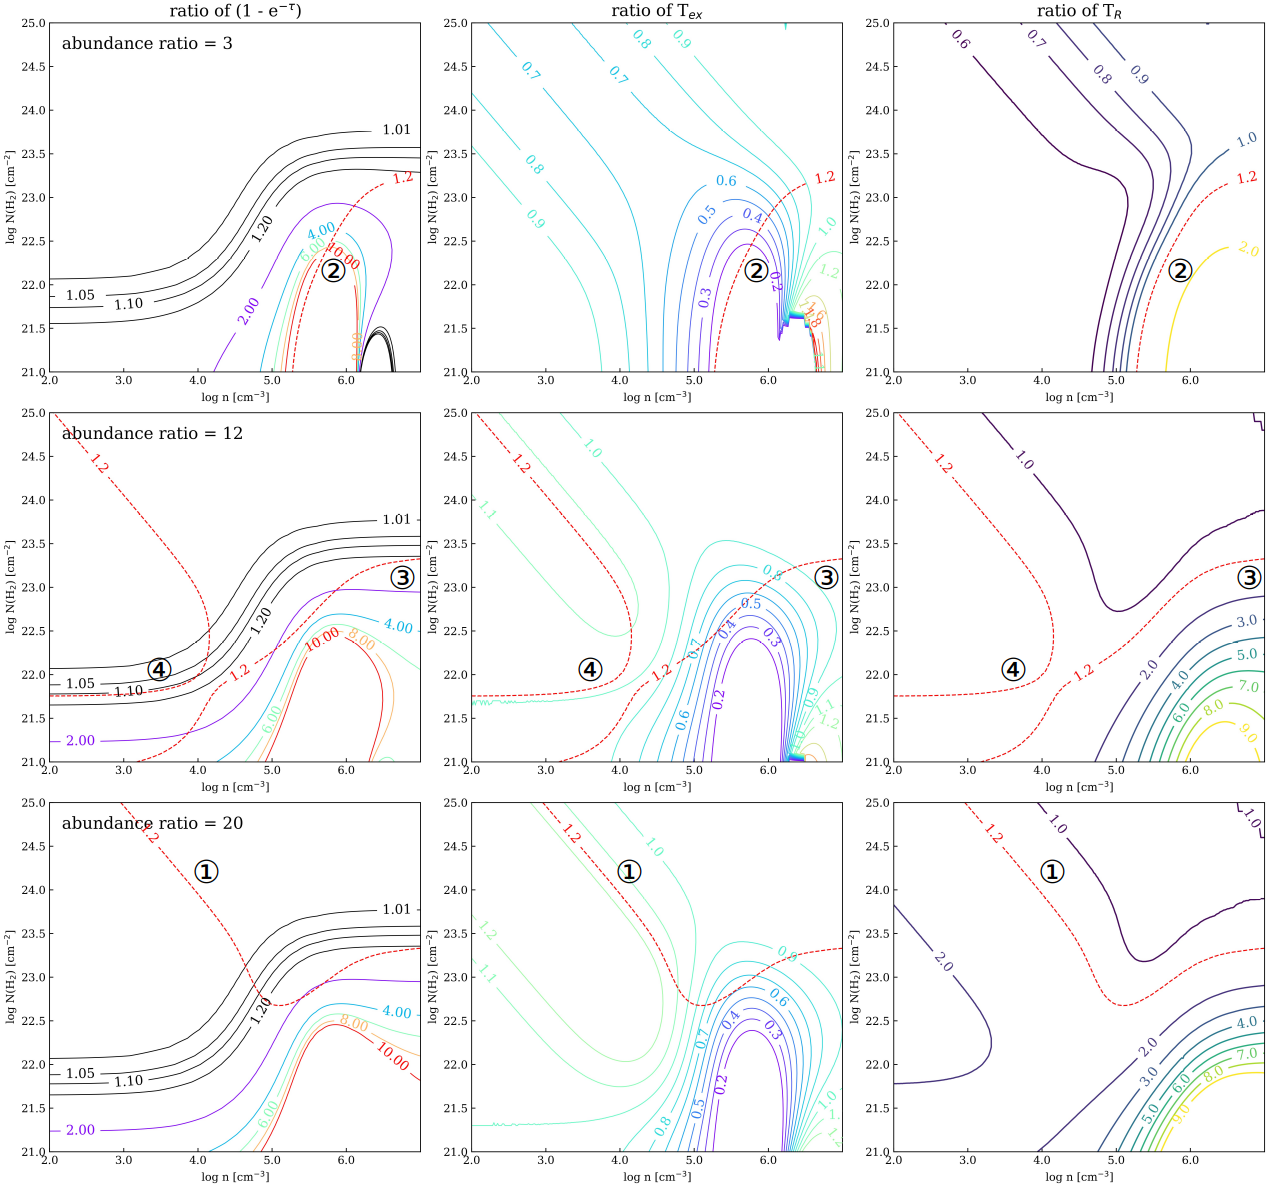
We plot in Figure 10 the ratio of (), and the ratio of between HCN(1–0) and HCO+(1–0) in the first and the second column. The optical depth effects and the excitation condition are represented, sequentially. Plots in the third column show the joint result of and , as = . is the Rayleigh-Jeans corrected excitation temperature.
We overlay the contour representing a ratio of 1.2 on the first two columns to see the corresponding and . The four representative regions discussed in Section 4.1 are labeled in circled numbers: (1) region 1 is contributed by very large optical depths, as it is located where the ratio of () of HCN and HCO+ is close to 1, and therefore the ratio of equal to 1.2 is because the ratio of is 1.2, (2) region 2 spans across where HCN is less thermalized than HCO+, and its brightness is contributed by larger (), (3) region 3 is where both HCN and HCO+ are thermalized, and the ratio of () is fixed to 1.2 regardless of the abundance ratio, and (4) region 4 follows the contours when the ratio of is slightly larger than 1 while both lines are subthermalized, and () is constant.
References
- Astropy Collaboration et al. (2013) Astropy Collaboration, Robitaille, T. P., Tollerud, E. J., et al. 2013, A&A, 558, A33. doi:10.1051/0004-6361/201322068
- Astropy Collaboration et al. (2018) Astropy Collaboration, Price-Whelan, A. M., Sipőcz, B. M., et al. 2018, AJ, 156, 123. doi:10.3847/1538-3881/aabc4f
- Behrens et al. (2022) Behrens, E., Mangum, J. G., Holdship, J., et al. 2022, ApJ, 939, 119. doi:10.3847/1538-4357/ac91ce
- Bigiel et al. (2008) Bigiel, F., Leroy, A., Walter, F., et al. 2008, AJ, 136, 6
- Bigiel et al. (2016) Bigiel, F., Leroy, A. K., Jiménez-Donaire, M. J., et al. 2016, ApJ, 822, L26. doi:10.3847/2041-8205/822/2/L26
- Bolatto et al. (2013) Bolatto, A. D., Wolfire, M., & Leroy, A. K. 2013, ARA&A, 51, 207. doi:10.1146/annurev-astro-082812-140944
- Crosthwaite et al. (2000) Crosthwaite, L. P., Turner, J. L., & Ho, P. T. P. 2000, AJ, 119, 1720. doi:10.1086/301302
- Crosthwaite et al. (2001) Crosthwaite, L. P., Turner, J. L., Hurt, R. L., et al. 2001, AJ, 122, 797
- Dahmen et al. (1998) Dahmen, G., Huttemeister, S., Wilson, T. L., et al. 1998, A&A, 331, 959
- Downes et al. (1992) Downes, D., Radford, S. J. E., Guilloteau, S., et al. 1992, A&A, 262, 424
- Eckart et al. (1990) Eckart, A., Downes, D., Genzel, R., et al. 1990, ApJ, 348, 434
- Egusa et al. (2011) Egusa, F., Koda, J., & Scoville, N. 2011, ApJ, 726, 85
- Elmegreen (2002) Elmegreen, B. G. 2002, ApJ, 577, 206. doi:10.1086/342177
- Evans et al. (2001) Evans, N. J., Rawlings, J. M. C., Shirley, Y. L., et al. 2001, ApJ, 557, 193
- Frayer et al. (2019) Frayer, D. T., Maddalena, R. J., White, S., et al. 2019, arXiv e-prints, arXiv:1906.02307
- Galametz et al. (2013) Galametz, M., Kennicutt, R. C., Calzetti, D., et al. 2013, MNRAS, 431, 1956. doi:10.1093/mnras/stt313
- Gao & Solomon (2004a) Gao, Y., & Solomon, P. M. 2004, ApJ, 606, 271
- Gao & Solomon (2004b) Gao, Y. & Solomon, P. M. 2004, ApJS, 152, 63. doi:10.1086/383003
- Garcia-Burillo et al. (1993) Garcia-Burillo, S., Guelin, M., & Cernicharo, J. 1993, A&A, 274, 123
- Goldsmith (2001) Goldsmith, P. F. 2001, ApJ, 557, 736
- Graciá-Carpio et al. (2006) Graciá-Carpio, J., García-Burillo, S., Planesas, P., et al. 2006, ApJ, 640, L135. doi:10.1086/503361
- Graciá-Carpio et al. (2008) Graciá-Carpio, J., García-Burillo, S., Planesas, P., et al. 2008, A&A, 479, 703
- Halfen et al. (2017) Halfen, D. T., Woolf, N. J., & Ziurys, L. M. 2017, ApJ, 845, 158. doi:10.3847/1538-4357/aa816b
- Harris et al. (2020) Harris, C. R., Millman, K. J., van der Walt, S. J., et al. 2020, Nature, 585, 357. doi:10.1038/s41586-020-2649-2
- Haslam et al. (1970) Haslam, C. G. T. and Quigley, M. J. S. and Salter, C. J., MNRAS, 147, 405
- Heiderman et al. (2010) Heiderman, A., Evans, N. J., Allen, L. E., et al. 2010, ApJ, 723, 1019. doi:10.1088/0004-637X/723/2/1019
- Hirota et al. (2010) Hirota, A., Kuno, N., Sato, N., et al. 2010, PASJ, 62, 1261. doi:10.1093/pasj/62.5.1261
- Iglesias & Silk (1978) Iglesias, E. R. & Silk, J. 1978, ApJ, 226, 851. doi:10.1086/156665
- Imanishi et al. (2006) Imanishi, M., Nakanishi, K., & Kohno, K. 2006, AJ, 131, 2888. doi:10.1086/503527
- Imanishi et al. (2007) Imanishi, M., Nakanishi, K., Tamura, Y., et al. 2007, AJ, 134, 2366. doi:10.1086/523598
- Imanishi et al. (2009) Imanishi, M., Nakanishi, K., Tamura, Y., et al. 2009, AJ, 137, 3581. doi:10.1088/0004-6256/137/3/3581
- Jiménez-Donaire et al. (2017) Jiménez-Donaire, M. J., Bigiel, F., Leroy, A. K., et al. 2017, MNRAS, 466, 49. doi:10.1093/mnras/stw2996
- Jiménez-Donaire et al. (2019) Jiménez-Donaire, M. J., Bigiel, F., Leroy, A. K., et al. 2019, ApJ, 880, 127. doi:10.3847/1538-4357/ab2b95
- Kauffmann et al. (2017) Kauffmann, J., Goldsmith, P. F., Melnick, G., et al. 2017, A&A, 605, L5. doi:10.1051/0004-6361/201731123
- Kennicutt (1998) Kennicutt, R. C. 1998, ApJ, 498, 541. doi:10.1086/305588
- Kennicutt et al. (2011) Kennicutt, R. C., Calzetti, D., Aniano, G., et al. 2011, PASP, 123, 1347. doi:10.1086/663818
- Kennicutt, & Evans (2012) Kennicutt, R. C., & Evans, N. J. 2012, ARA&A, 50, 531
- Kreckel et al. (2018) Kreckel, K., Faesi, C., Kruijssen, J. M. D., et al. 2018, ApJ, 863, L21. doi:10.3847/2041-8213/aad77d
- Knudsen et al. (2007) Knudsen, K. K., Walter, F., Weiss, A., et al. 2007, ApJ, 666, 156
- Krips et al. (2008) Krips, M., Neri, R., García-Burillo, S., et al. 2008, ApJ, 677, 262
- Krips et al. (2010) Krips, M., Crocker, A. F., Bureau, M., et al. 2010, MNRAS, 407, 2261
- Kruijssen & Longmore (2014) Kruijssen, J. M. D. & Longmore, S. N. 2014, MNRAS, 439, 3239. doi:10.1093/mnras/stu098
- Koda et al. (2009) Koda, J., Scoville, N., Sawada, T., et al. 2009, ApJ, 700, L132
- Kuno et al. (2007) Kuno, N., Sato, N., Nakanishi, H., et al. 2007, PASJ, 59, 117
- Kutner, & Ulich (1981) Kutner, M. L., & Ulich, B. L. 1981, ApJ, 250, 341
- Lada & Lada (2003) Lada, C. J. & Lada, E. A. 2003, ARA&A, 41, 57. doi:10.1146/annurev.astro.41.011802.094844
- Lada et al. (2010) Lada, C. J., Lombardi, M., & Alves, J. F. 2010, ApJ, 724, 687. doi:10.1088/0004-637X/724/1/687
- Leroy et al. (2008) Leroy, A. K., Walter, F., Brinks, E., et al. 2008, AJ, 136, 2782. doi:10.1088/0004-6256/136/6/2782
- Leroy et al. (2017) Leroy, A. K., Usero, A., Schruba, A., et al. 2017, ApJ, 835, 217. doi:10.3847/1538-4357/835/2/217
- Leroy et al. (2021) Leroy, A. K., Schinnerer, E., Hughes, A., et al. 2021, ApJS, 257, 43. doi:10.3847/1538-4365/ac17f3
- Mangum et al. (2007) Mangum, J. G., Emerson, D. T., & Greisen, E. W. 2007, A&A, 474, 679
- Mangum & Shirley (2015) Mangum, J. G. & Shirley, Y. L. 2015, PASP, 127, 266. doi:10.1086/680323
- Meier et al. (2000) Meier, D. S., Turner, J. L., & Hurt, R. L. 2000, ApJ, 531, 200
- Meier & Turner (2001) Meier, D. S., & Turner, J. L. 2001, ApJ, 551, 687
- Meier & Turner (2005) Meier, D. S., & Turner, J. L. 2005, ApJ, 618, 259
- Meier et al. (2011) Meier, D. S., Turner, J. L., & Schinnerer, E. 2011, AJ, 142, 32
- Meijerink et al. (2007) Meijerink, R., Spaans, M., & Israel, F. P. 2007, A&A, 461, 793. doi:10.1051/0004-6361:20066130
- Meijerink et al. (2011) Meijerink, R., Spaans, M., Loenen, A. F., et al. 2011, A&A, 525, A119. doi:10.1051/0004-6361/201015136
- Momose et al. (2013) Momose, R., Koda, J., Kennicutt, R. C., et al. 2013, ApJ, 772, L13. doi:10.1088/2041-8205/772/1/L13
- Murphy et al. (2015) Murphy, E. J., Dong, D., Leroy, A. K., et al. 2015, ApJ, 813, 118. doi:10.1088/0004-637X/813/2/118
- Nguyen-Q-Rieu et al. (1992) Nguyen, Q.-R., Jackson, J. M., Henkel, C., et al. 1992, ApJ, 399, 521
- Nguyen-Q-Rieu et al. (1994) Nguyen-Rieu, Viallefond, F., Combes, F., et al. 1994, IAU Colloq. 140: Astronomy with Millimeter and Submillimeter Wave Interferometry, 336
- Pan et al. (2022) Pan, H.-A., Schinnerer, E., Hughes, A., et al. 2022, ApJ, 927, 9. doi:10.3847/1538-4357/ac474f
- Papadopoulos (2007) Papadopoulos, P. P. 2007, ApJ, 656, 792. doi:10.1086/510186
- Privon et al. (2015) Privon, G. C., Herrero-Illana, R., Evans, A. S., et al. 2015, ApJ, 814, 39
- Privon et al. (2020) Privon, G. C., Ricci, C., Aalto, S., et al. 2020, ApJ, 893, 149. doi:10.3847/1538-4357/ab8015
- Saha et al. (2002) Saha, A., Claver, J., & Hoessel, J. G. 2002, AJ, 124, 839. doi:10.1086/341649
- Schinnerer et al. (2008) Schinnerer, E., Böker, T., Meier, D. S., et al. 2008, ApJ, 684, L21. doi:10.1086/592109
- Schruba et al. (2010) Schruba, A., Leroy, A. K., Walter, F., et al. 2010, ApJ, 722, 1699. doi:10.1088/0004-637X/722/2/1699
- Schulz et al. (2001) Schulz, A., Güsten, R., Köster, B., et al. 2001, A&A, 371, 25
- Sieth et al. (2014) Sieth, M., Devaraj, K., Voll, P., et al. 2014, Proc. SPIE, 91530P
- Silk (1997) Silk, J. 1997, ApJ, 481, 703. doi:10.1086/304073
- Sheth et al. (2002) Sheth, K., Vogel, S. N., Regan, M. W., et al. 2002, AJ, 124, 2581
- Shirley (2015) Shirley, Y. L. 2015, PASP, 127, 299. doi:10.1086/680342
- Tan et al. (2018) Tan, Q.-H., Gao, Y., Zhang, Z.-Y., et al. 2018, ApJ, 860, 165
- Turner & Ho (1983) Turner, J. L. & Ho, P. T. P. 1983, ApJ, 268, L79. doi:10.1086/184033
- Turner & Hurt (1992) Turner, J. L., & Hurt, R. L. 1992, ApJ, 384, 72
- Usero et al. (2015) Usero, A., Leroy, A. K., Walter, F., et al. 2015, AJ, 150, 115. doi:10.1088/0004-6256/150/4/115
- Van der Tak et al. (2007) Van der Tak, F.F.S., Black, J.H., Schöier, F.L., Jansen, D.J., van Dishoeck, E.F., 2007, A&A, 468, 627
- Virtanen et al. (2020) Virtanen, P., Gommers, R., Oliphant, T. E., et al. 2020, Nature Methods, 17, 261. doi:10.1038/s41592-019-0686-2
- Viti (2017) Viti, S. 2017, A&A, 607, A118. doi:10.1051/0004-6361/201628877
- Wilson (1999) Wilson, T. L. 1999, Reports on Progress in Physics, 62, 143. doi:10.1088/0034-4885/62/2/002
- Yamada et al. (2007) Yamada, M., Wada, K., & Tomisaka, K. 2007, ApJ, 671, 73. doi:10.1086/522332