JWST spectroscopy of UV-selected galaxies: New constraints on the evolution of the Ly escape fraction in the reionization era
Abstract
We describe JWST/NIRSpec prism measurements of Ly emission in galaxies. We identify Ly detections in 10 out of 69 galaxies with robust rest-optical emission line redshift measurements at in the CEERS and DDT-2750 observations of the EGS field. Galaxies at with faint continuum (F150W 27–29 mag) are found with extremely large Ly equivalent widths (ranging up to 286 Å). Likely Ly detections are also seen in two new galaxies ( 7.49 and 7.17) from the second epoch of CEERS observations, both of which show large Ly equivalent widths that likely indicate significant transmission through the IGM. We measure high Ly escape fractions in the 12 Ly emitters in our sample (median 0.28), two of which show near unity (). We find that % of galaxies with [O iii]+H EW 1000 Å have , consistent with the fractions found in lower-redshift samples with matched [O iii]+H EWs. While uncertainties are still significant, we find that only % of galaxies with similarly strong rest optical emission lines show such large , as may be expected if IGM attenuation of Ly increases towards higher redshifts. We identify photometric galaxy overdensities near the Ly emitters, potentially providing the ionizing flux necessary to create large ionized sightlines that facilitate Ly transmission. Finally, we investigate the absence of Ly emission in a comparable (and spectroscopically confirmed) galaxy overdensity at in the Abell 2744 field, discussing new prism spectra of the field obtained with the UNCOVER program.
keywords:
dark ages, reionization, first stars - cosmology: observations - galaxies: evolution - galaxies: high-redshift1 Introduction
The reionization of intergalactic hydrogen marks the important stage where early structure formation has impacted the vast majority of baryons in the universe. Through a variety of observational efforts over the past two decades, substantial progress has been made to constrain the timeline of this reionization process and the nature of the early ionizing sources (see Stark 2016; Fan et al. 2023; Robertson 2022 for reviews). Measurements of hydrogen absorption features presented in the quasar spectra indicate that the universe is partially neutral at (Greig et al., 2017; Davies et al., 2018; Wang et al., 2020; Yang et al., 2020a) and becomes mostly ionized by 5.5–6 (e.g., Fan et al., 2006; McGreer et al., 2015; Yang et al., 2020b; Qin et al., 2021; Zhu et al., 2022; Jin et al., 2023). Measurements of the Cosmic Microwave Background have suggested a similar picture, where constraints on the electron scattering optical depth imply a reionization mid-point at (Planck Collaboration et al., 2016, 2020). With the rapidly declining quasar luminosity function at (e.g., Matsuoka et al., 2018; Kulkarni et al., 2019; Jiang et al., 2022), young star-forming galaxies are thought to be the likely dominant contributors to the ionizing photons necessary for this process (Robertson et al., 2015; Stanway et al., 2016; Dayal & Ferrara, 2018; Finkelstein et al., 2019; Naidu et al., 2020).
The Ly emission from early star-forming galaxies has been shown to be another useful probe in constraining the timeline of reionization (e.g., Dijkstra, 2014; Ouchi et al., 2020). While strong Ly emission has been commonly observed in galaxies (e.g., Stark et al., 2011; Curtis-Lake et al., 2012; Cassata et al., 2015; De Barros et al., 2017), deep spectroscopic surveys show that it becomes increasingly rare at higher redshifts ( 7–8; e.g., Stark et al. 2010; Ono et al. 2012; Treu et al. 2013; Caruana et al. 2014; Pentericci et al. 2014; Schenker et al. 2014; Tilvi et al. 2014; Pentericci et al. 2018; Hoag et al. 2019; Mason et al. 2019; Jung et al. 2020). This decline of Ly visibility is consistent with a significant neutral hydrogen fraction of the intergalactic medium (IGM) at (; e.g., Mesinger et al. 2015; Zheng et al. 2017; Mason et al. 2018a, 2019; Hoag et al. 2019; Jung et al. 2020; Whitler et al. 2020; Bolan et al. 2022).
JWST has recently ushered in a new era of high-redshift Ly studies (e.g., Jones et al. 2023; Jung et al. 2023; Saxena et al. 2023b, a; Tang et al. 2023; Witten et al. 2023), with detections now being made out to (Bunker et al., 2023). Ly investigations with JWST provide several advantages compared to earlier efforts. The absence of atmospheric OH lines greatly increases Ly completeness and improves the reliability of upper limits on fluxes when lines are not detected. Access to strong rest-optical emission lines provides spectroscopic redshifts whether or not Ly is detected, allowing the environment around Ly emitters to be more efficiently characterized. Detection of H (or H) allows the intrinsic luminosity of Ly to be calculated, which when combined with the observed Ly flux yields estimates of the Ly escape fraction (e.g., Roy et al., 2023; Saxena et al., 2023b; Tang et al., 2023). The rest-optical emission lines also constrain the systemic redshifts for measurement of Ly velocity profiles, providing a key input to reionization calculations (e.g., Bunker et al., 2023; Prieto-Lyon et al., 2023; Saxena et al., 2023b; Tang et al., 2023).
The Cosmic Evolution Early Release Science (CEERS111https://ceers.github.io/; ERS-1345, PI: S. Finkelstein; Finkelstein et al. in prep, also see Finkelstein et al. 2022, 2023) has recently obtained JWST imaging and spectroscopy of the EGS field, providing one of first opportunities for a statistical investigation of Ly in the reionization era. This region is known to have a large number of Ly emitting galaxies, with previously confirmed structures at , , and (Oesch et al., 2015; Zitrin et al., 2015; Roberts-Borsani et al., 2016; Stark et al., 2017; Tilvi et al., 2020; Jung et al., 2022; Larson et al., 2022; Cooper et al., 2023). The CEERS spectra have revealed additional galaxies at these redshifts (Arrabal Haro et al., 2023b; Fujimoto et al., 2023; Harikane et al., 2023b; Sanders et al., 2023a; Tang et al., 2023), potentially suggesting the Ly emitters trace large-scale overdensities spanning several physical Mpc. Such overdensities of galaxies could generate significant amounts of ionizing photons, creating large ionized bubbles that facilitate the transmission of Ly photons from the member galaxies (e.g., Barkana & Loeb, 2004; Furlanetto et al., 2004; Wyithe & Loeb, 2005; Iliev et al., 2006; Dayal & Ferrara, 2018; Weinberger et al., 2018).
The CEERS spectra have also revealed insight into the nature of the Ly emitters in the field. Tang et al. (2023) demonstrated that the systems with Ly are atypical in their properties, with hard spectra and more efficient ionizing photon production than is common at this redshift. This may reflect very young stellar populations formed during a rapid burst (Endsley et al., 2021b; Saxena et al., 2023b; Tang et al., 2023) or the presence of an AGN (Larson et al., 2023). Regardless of the origin, the ionizing properties will result in boosted intrinsic Ly luminosities, enhancing the likelihood of detecting the line in the face of IGM attenuation even within small ionized bubbles. The Ly detections at also appear to be redshifted significantly from systemic, with velocity offsets commonly in excess of 500 km s-1 (Bunker et al., 2023; Tang et al., 2023). Given that the IGM attenuation of Ly is strongest close to the line center, the large velocity offsets will further contribute to the visibility of Ly.
In spite of this progress, the size of the ionized bubbles around the Ly emitting galaxies in the EGS field remains poorly constrained, making it unclear the relative role of overdensities and intrinsic galaxy properties play in explaining their strong observed Ly (e.g., Jung et al., 2022; Whitler et al., 2023a; Tang et al., 2023). If overdensities have carved out large ionized regions (i.e., 1 physical Mpc), we expect the transmission of Ly through the IGM to be enhanced (e.g., Mason et al., 2018b; Mason & Gronke, 2020). If the overdensities and bubble sizes are smaller, we would expect to see significant attenuation in the Ly line from the damping wing of the neutral IGM. The CEERS H detections allow Ly escape fractions () to be derived for the Ly emitters in the field. Typical escape fractions are low ( = 0.03–0.09), suggesting the majority of Ly photons are not making their way through the NIRSpec slitlets (Tang et al., 2023). Galaxies with similar rest-optical spectral properties at lower redshifts () tend to have much stronger Ly (e.g., Yang et al., 2017; Tang et al., 2021; Flury et al., 2022a), with Ly EWs that are 6–12 greater than the Ly emitters in CEERS. This may be indicating that the Ly emitters trace relatively small ionized bubbles, with excess attenuation from the neutral IGM on the outside of the bubbles. Alternatively, the interstellar medium (ISM) and circumstellar medium (CGM) of the galaxies may scatter the Ly more than the comparison samples at lower redshift.
In this paper, we seek to extend the Ly investigations presented in Tang et al. (2023) to a larger sample of galaxies. We have two primary goals. First, we seek to characterize the Ly properties of galaxies at slightly lower redshifts () where the impact of the IGM on the line is reduced. At these redshifts, we expect to see Ly with larger escape fractions than those studied to date at . This comparison sample will be important in interpreting the emerging body of Ly detections deep in the reionization era. Second, we aim to use new measurements of Ly in faint galaxies to better characterize whether the previously-known Ly emitters in the EGS field are likely to trace large ionized regions. We will investigate whether there are significant overdensities of photometrically-selected galaxies in the EGS field, as may be expected if large bubbles are present.
The connection between ionized bubbles and galaxy overdensities has been further tested in recent JWST observations of the protocluster discovered in GLASS ERS (JWST-GO1324, P.I. Treu; Treu et al. 2022) and JWST Director’s Discretionary Time (DDT-2756, PI. W. Chen; Roberts-Borsani et al. 2023) observations of the Abell 2744 field (Morishita et al., 2023). The galaxies in this protocluster are significantly overdense (20) over a relatively small radius of 60 physical kpc. While such a region may be expected to have carved out a large ionized bubble, JWST spectroscopy presented in Morishita et al. (2023) has revealed no Ly emission. In this paper, we use new JWST spectra of galaxies in the protocluster to understand why Ly does not appear to be enhanced in this overdense volume.
The organization of the paper is as follows. In §2, we first describe JWST/NIRSpec observations (§ 2.1), our Ly emitting galaxy sample (§ 2.2), and the photoionization modeling of their NIRCam spectral energy distributions (§ 2.3). In §3, we then discuss the Ly properties inferred for these Ly emitting galaxies, comparing them to literature samples spanning a wide range of redshifts. Based on the photometric samples identified from the NIRCam imaging, we characterize the large scale environments of the newly identified Ly emitting galaxies at in §4. In §5, we discuss the dependence on galaxy local environment for Ly visibility, considering the detection of a large number of 7–8 Ly emitting galaxies in the EGS field and the new JWST observations of Ly emission in the protocluster presented in Morishita et al. (2023). Finally, we summarize our findings in §6. Throughout this paper, we adopt a flat CDM cosmology with = 70 km s-1 Mpc-1, , and . All magnitudes are measured in the AB system (Oke & Gunn, 1983), and the emission line equivalent widths are calculated in the rest frame.
2 Data and Sample Properties
The goal of this paper is to characterize the Ly emission strengths in galaxies observed with JWST/NIRSpec (Jakobsen et al., 2022; Böker et al., 2023). We primarily focus on the CEERS program in the EGS field (Finkelstein et al. in prep, also see Finkelstein et al. 2022, 2023). We first describe the NIRSpec spectra and the spectroscopic sample in § 2.1. We identify the Ly emitting galaxies and constrain their Ly properties in § 2.2. Based on broad-band SEDs of the Ly emitting galaxies, we then derive their galaxy physical properties through photoionization modeling in § 2.3.
2.1 Spectroscopy of galaxies with JWST/NIRSpec
Our work builds on the previous efforts in characterizing the Ly emission at from the CEERS NIRSpec spectra (e.g., Jung et al., 2023; Tang et al., 2023; Witten et al., 2023). To date, six Ly emitting galaxies have been investigated at using the spectra taken in the CEERS epoch 2 (December 2022) observations. Two of these are newly identified Ly detections, whereas the other four were previously reported in the literature based on ground-based spectroscopy. Here we extend the Ly emitting galaxy search to slightly lower redshifts (), where the IGM is expected to be significantly more ionized. This requires us to focus on the prism observations, where the wavelength coverage extends blue enough to recover Ly at . To obtain a complete sample of Ly emitters in CEERS, we augment this with an updated search for Ly emitting galaxies from the new NIRSpec prism spectra taken since the first Ly analysis in CEERS by Tang et al. (2023). This includes the CEERS epoch 3 observations (taken in February 2023; see Arrabal Haro et al. in prep) and the Director’s Discretionary Time (DDT) observations (DDT-2750, PI: P. Arrabal Haro; Arrabal Haro et al. 2023a, b), which focus on NIRCam-selected targets and allows us to detect fainter 5 galaxies. In §5, we characterize the Ly properties within a spectroscopically-confirmed overdensity at . Here we utilize the NIRSpec prism observations for the overdensity recently taken as part of the Ultradeep NIRSpec and NIRCam ObserVations before the Epoch of Reionization (UNCOVER222https://jwst-uncover.github.io/; GO-2561, PIs: I. Labbé & R. Bezanson; Bezanson et al. 2022; Goulding et al. 2023; Wang et al. 2023; S. Price et al., in prep.) program. Below we will briefly describe the spectroscopic observations and identification of galaxies in the CEERS field, but we note that the UNCOVER spectra are reduced and analyzed in the same manner as the CEERS data.
The CEERS NIRSpec multi-object spectroscopy (MOS) observations employ the Micro Shutter Array (MSA; Ferruit et al. 2022), with a detailed description of the configuration given in the CEERS phase-2 public PDF333https://www.stsci.edu/jwst/phase2-public/1345.pdf and Arrabal Haro et al. in prep. Briefly, the epoch 2 (December 2022) observations consist of six pointings with medium-resolution grating using the G140M/F100LP, G235M/F170LP, and G395M/F290LP grating/filter pairs and eight pointings with the low-resolution prism. The prism observations that are the focus of this paper deliver simultaneous spectral coverage spanning 0.6–5.4 m, with a spectral resolution of ( 1300 km s-1). The observed targets on the prism pointings include 466 galaxies, spanning a wide (photometric or spectroscopic) redshift range from = 0.1–12 (Arrabal Haro et al., 2023a, b). Each of the targets was observed using the 3-shutter MSA slitlet (1.5″ 0.2″), with a total exposure time of 3107 s split into three exposures of 14 groups per disperser and per pointing. We also take advantage of the two new prism pointings taken in CEERS epoch 3 (February 2023) observations and the additional prism pointing taken in the DDT observations (DD-2750; Arrabal Haro et al. 2023b). The two CEERS epoch 3 pointings target in total 283 NIRCam-selected galaxies also across a wide range of redshift, with a total integration time of 6127s and 2042s, respectively. The DDT observation employs a single 5.1 hr pointing, mainly targeting 12–16 galaxy candidates selected with NIRCam but also with galaxies at lower redshifts in the MSA (145 galaxies in total). All the NIRSpec spectra are reduced in the same manner as presented in Tang et al. (2023) using the JWST data reduction pipeline444https://jwst-pipeline.readthedocs.io/en/latest/. In this step, we have applied slit loss corrections by assuming a point source given that the majority of sources analyzed in this work are not significantly extended. More information on the data reduction is provided in Tang et al. (2023).
Each extracted 2D spectrum was visually inspected by three co-authors (M. Tang, M. Topping, and ZC) in search of robust emission line detections indicating a redshift of 5. Our redshift identification process is similar to that described in Tang et al. (2023), requiring multiple emission line detections (often the [O iii] doublet and H or H). After investigating the full database, we identify 69 emission line galaxies at 555Here, we have removed potential AGNs as indicated by very broad H (FWHM 1000 km-1) and narrow [O iii] emission lines observed in the medium resolution grating spectra (e.g., Kocevski et al., 2023; Harikane et al., 2023a). We further identify 10 new galaxies at from the more recent CEERS observations conducted since Tang et al. (2023). In the following sections, we will add these systems to the 21 galaxies in Tang et al. (2023), resulting in a total sample of 100 galaxies at . A significant subset of these sources overlap with those presented in the literature, and we have verified that our redshifts are in excellent agreement with those published elsewhere (e.g., Arrabal Haro et al., 2023a; Fujimoto et al., 2023; Harikane et al., 2023b; Nakajima et al., 2023; Sanders et al., 2023b). The full prism spectroscopic catalog will be presented in a future work (Chen et al., in prep).
The 1D spectra are extracted with a boxcar aperture following the procedures in Tang et al. (2023), which is set to match the emission line profile along the spatial direction for each target (typical aperture is 6 pixels). We determine the systemic redshifts by fitting Gaussian profiles (plus a constant factor for the underlying continuum) to the brightest rest-optical lines (i.e., [O iii]+H or H). The derived redshifts for the 69 prism-selected galaxies at range from to 6.98, with a median of . For the 10 galaxies identified with the new datasets taken in February–March 2023, their redshifts span from 7.00 to 8.75, with a median of 7.48.
We measure optical emission line fluxes through Gaussian profile fitting, following the method of Sanders et al. (2023b). We allow the centroid of each line to vary from the determined redshift within half of the spectral velocity resolution (650 km s-1 for the prism spectra). To account for the wavelength dependence of the spectral resolution, we also restrict the line width to be within 50% to 150% of the line widths determined from the strongest optical lines (i.e., [O iii]+H or H). The uncertainties are derived by perturbing the fluxes according to the error spectra and repeating the measurements 500 times. Dust corrections will be conducted via the Balmer decrement where available (and the SED where the Balmer decrement is not measured). We will discuss the corrections in §2.3 once SEDs have been characterized for our sample.
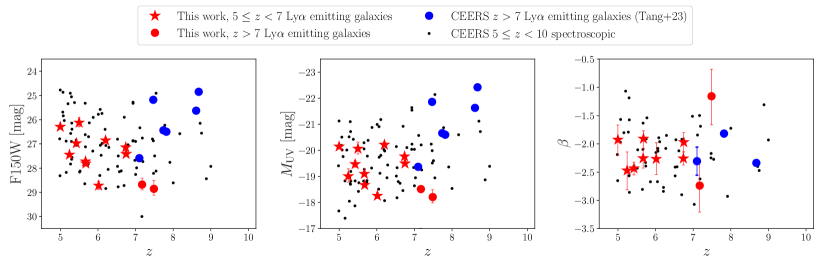
We measure HST/ACS+JWST/NIRCam photometry for our spectroscopic sample of galaxies, following the photometric procedures detailed in Endsley et al. (2023b) (also see Tang et al. 2023; Whitler et al. 2023a). We utilize the NIRCam imaging in the EGS field observed as part of the CEERS program in two scheduling windows in June and December 2022 (see Bagley et al. 2023), and the HST/ACS (WFC3/IR as well for those without NIRCam coverage) imaging assembled and reduced with Grizli (Brammer et al., 2022) as part of the Complete Hubble Archive for Galaxy Evolution (CHArGE) project (Kokorev et al. 2022; Kokorev et al. in prep.). Among the 79 new sources considered in this paper, 59 are covered by CEERS NIRCam observations. We measure their Kron photometry (Kron, 1980) in ACS F435W, F606W, and F814W filters, and in NIRCam F115W, F150W, F200W, F275W, F356W, F410M, and F444W filters. For the remaining 20 sources, the flux density in the HST WFC3/IR filters (F125W, F140W, and F160W) are measured instead. Figure 1 shows the NIRCam/F150W (or WFC3/F160W when not covered with NIRCam) magnitude distribution for the 79 galaxies we present in this paper, ranging from 24.8 to 28.9 with a median of 27.1 mag.
2.2 Ly Detections at in CEERS spectra
| ID | RA | Dec | NRC/F150W | WFC3/F160W | O32 | ||
| (deg) | (deg) | (mag) | (mag) | (mag) | |||
| CEERS-1374 | 5.00 | 214.9439108 | 52.8500417 | – | |||
| CEERS-82069 | 5.24 | 214.7303221 | 52.7549722 | – | |||
| CEERS-80573 | 5.43 | 214.7739242 | 52.7806000 | – | |||
| CEERS-1334 | 5.50 | 214.7683562 | 52.7176417 | – | |||
| CEERS-323 | 5.67 | 214.8725558 | 52.8759500 | – | |||
| CEERS-80916 | 5.68 | 214.8916300 | 52.8159417 | – | – | ||
| CEERS-476 | 6.02 | 214.8055608 | 52.8363444 | – | |||
| CEERS-1561 | 6.20 | 215.1660971 | 53.0707556 | – | |||
| CEERS-81049 | 6.74 | 214.7898221 | 52.7307889 | – | |||
| CEERS-80925 | 6.75 | 214.9486800 | 52.8532722 | – | |||
| CEERS-80374 | 7.17 | 214.8980742 | 52.8248944 | – | |||
| CEERS-80239 | 7.49 | 214.8960542 | 52.8698528 | – |
[t] ID Flux Ly EW Ly EW [O iii]+H log (/erg-1Hz) ( (Å) (Case B) (Case B, (Case A) (Å) erg s-1 cm-2) corrected)a CEERS-1374 5.00 CEERS-82069 5.24 CEERS-80573 5.43 CEERS-1334 5.50 b – – CEERS-323 5.67 CEERS-80916 5.68 CEERS-476 6.02 CEERS-1561 6.20 b – – CEERS-81049 6.74 CEERS-80925 6.75 CEERS-80374 7.17 CEERS-80239 7.49 c
-
a
The with prism Ly flux corrections, where the correction factors are computed using the Ly mock observations as shown in Figure 4.
-
b
EW [O iii]+H directly measured from the prism spectra given the optical continuum also detected.
-
c
lower limits given the H non-detection.
We now seek to identify and characterize Ly emission from the CEERS spectroscopic sample established in the previous section, building on our earlier work characterizing Ly emitting galaxies in CEERS (Tang et al., 2023). We first will focus on Ly emitting galaxies at in the prism spectra before discussing new systems at from data obtained since Tang et al. (2023).
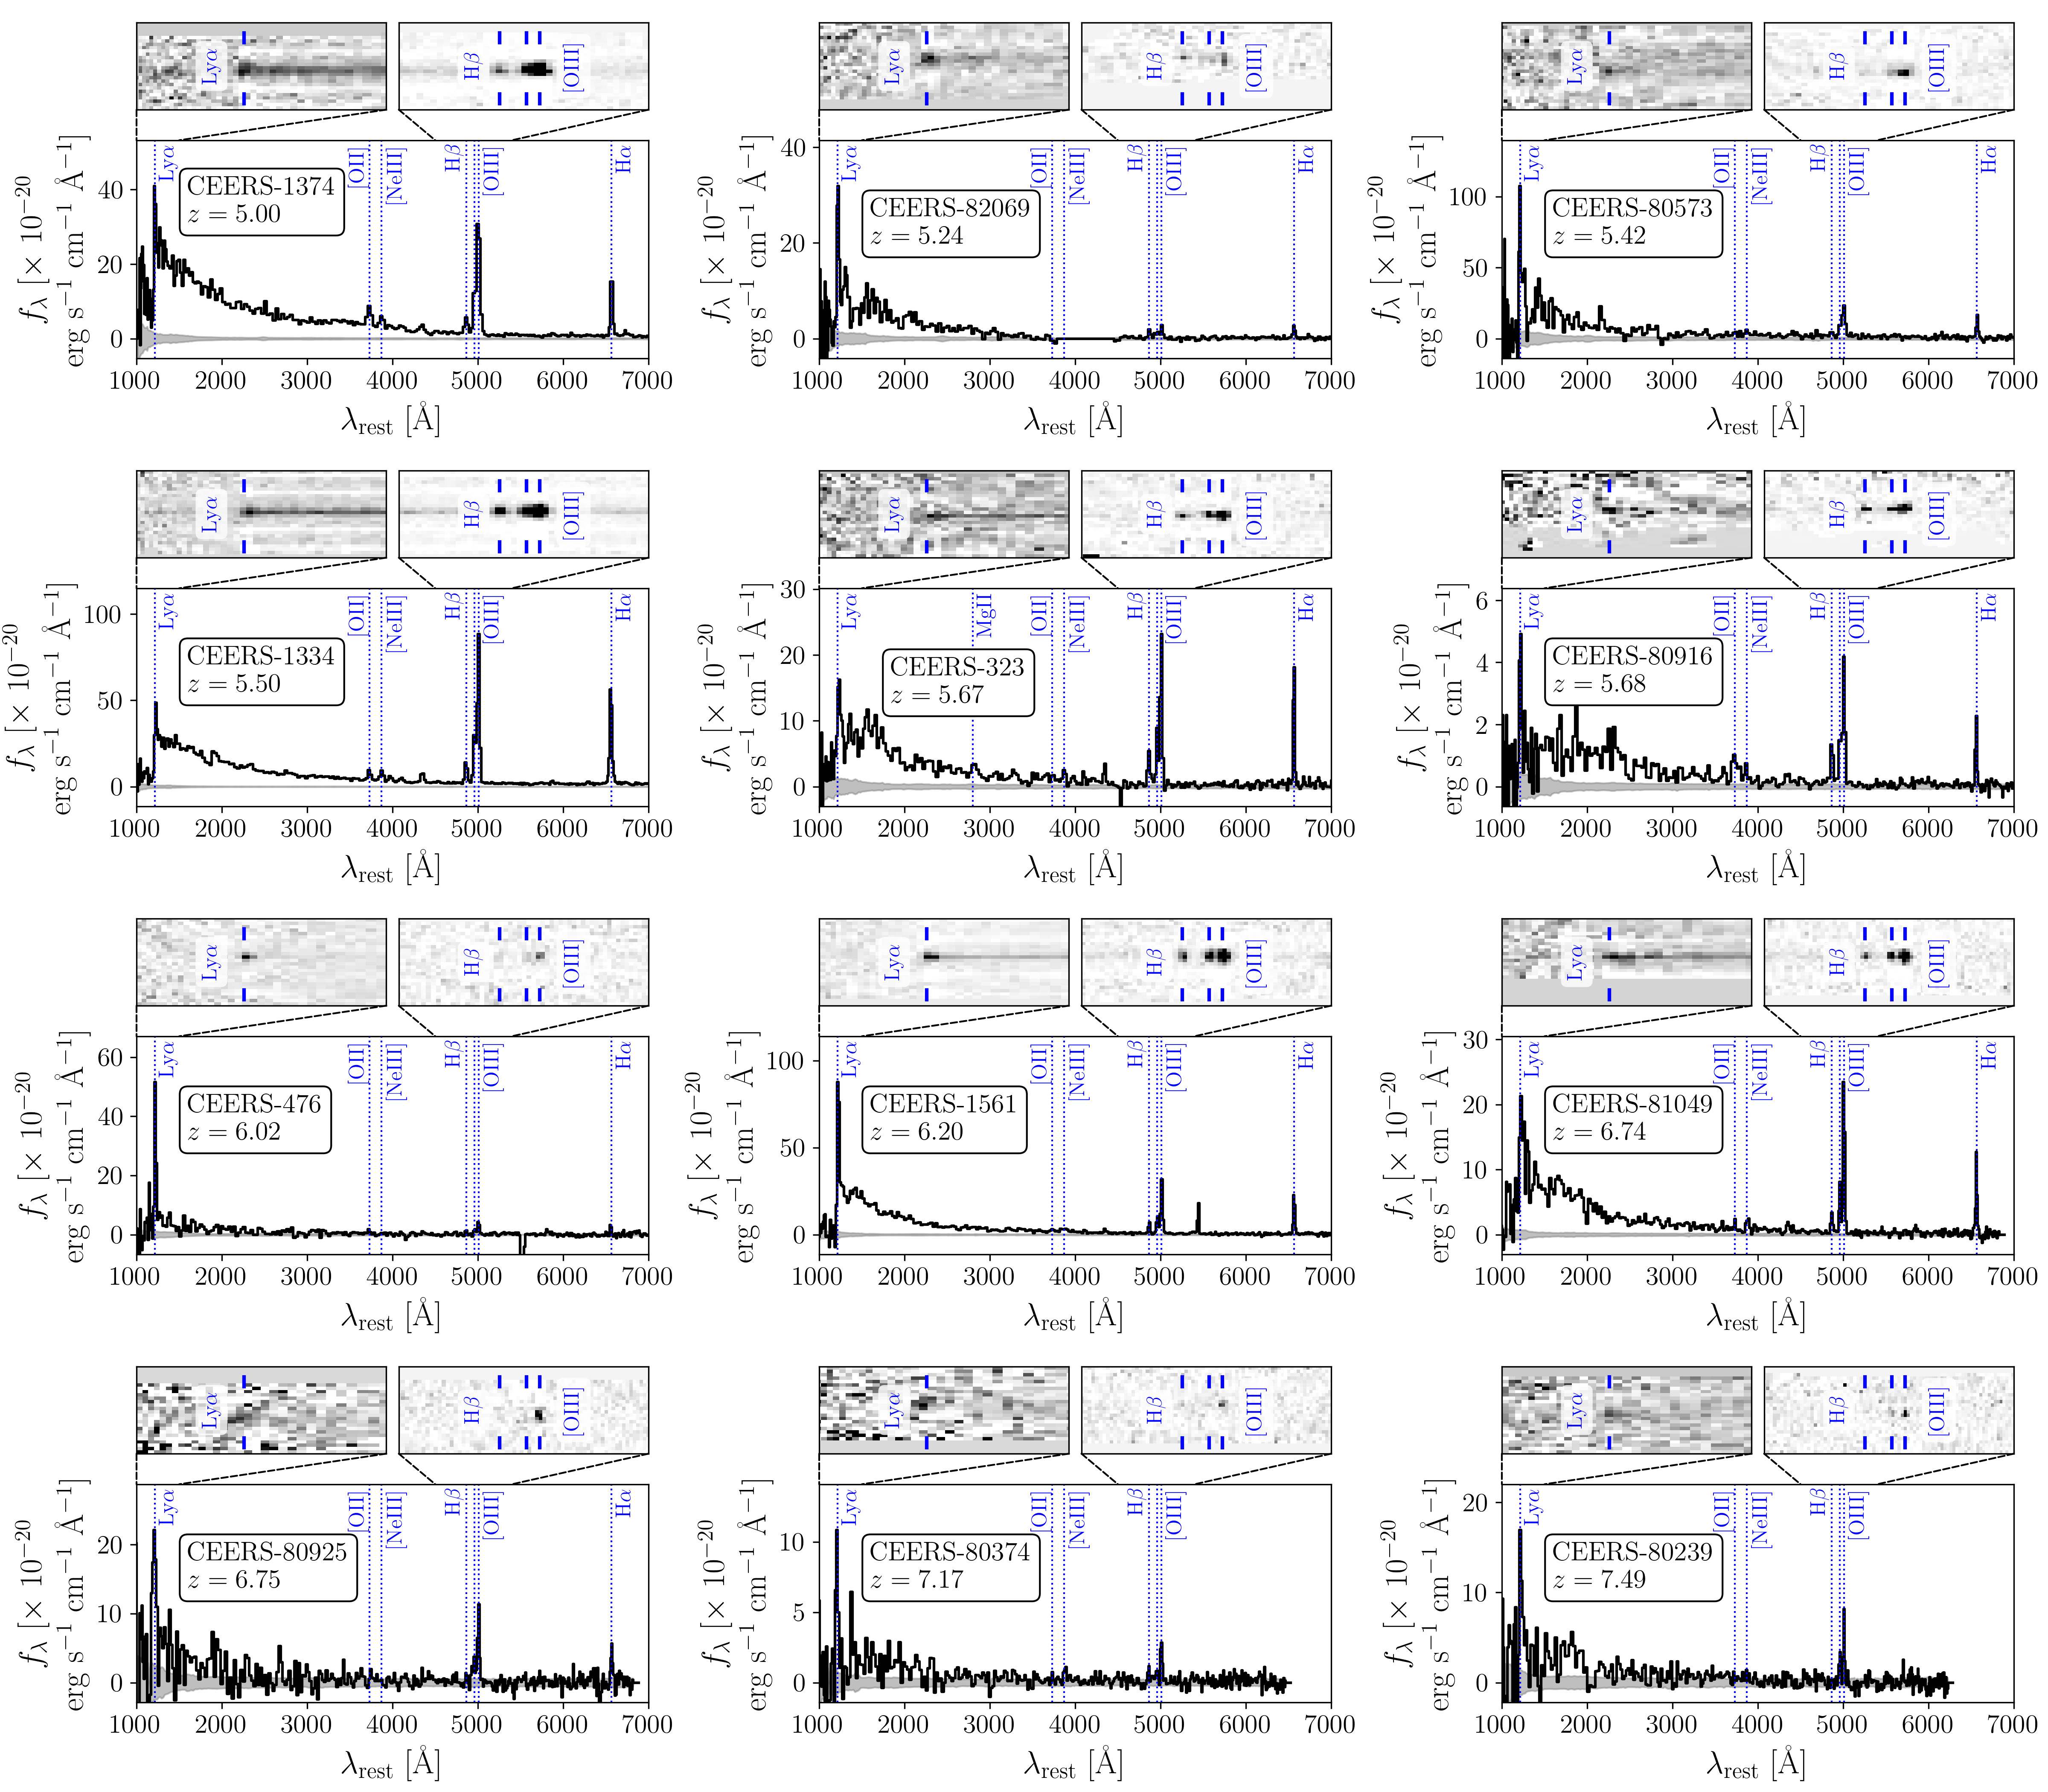
We visually search for Ly in each of the 69 galaxies with prism redshifts at . We detect emission features at the wavelength of Ly in 10 galaxies (see Table 1), with redshifts spanning to 6.749 (median 5.67) and SNR = 5.6 to 26.9 (median 11.9). We have verified that these emission features are not due to cosmic rays by visually inspecting the individual exposures, thus most likely corresponding to Ly detection. For one source (CEERS-80925), the Ly SNR is below 7 (5.6), and we consider it to be a tentative detection. We will include this in our analysis below, but our results are not significantly altered if we remove this source. We show the prism spectra in Figure 2, highlighting the rest-optical lines and Ly detection. The UV continuum is also detected for the 10 Ly emitters, at SNR = 5.8–132 (median 13.6) per rest-frame 150 Å bin. The continuum (measured in consistent aperture as the Ly flux) allows direct constraints to be placed on the Ly EW. We first fit the UV continuum with a linear function over the window of [100, 400] Å redwards of Ly in the rest frame. We then compute the total Ly flux by directly integrating the continuum-subtracted line profile over the window of [-50, 80] Å (in the rest frame) around the line center. This aperture is chosen to match the observed width of the line. The measured Ly fluxes range from to erg s-1 cm-2, corresponding to luminosities of to erg s-1. The resulting Ly EWs are presented in Table 2, ranging from 19 to 286 Å with a median EW = 134 Å.
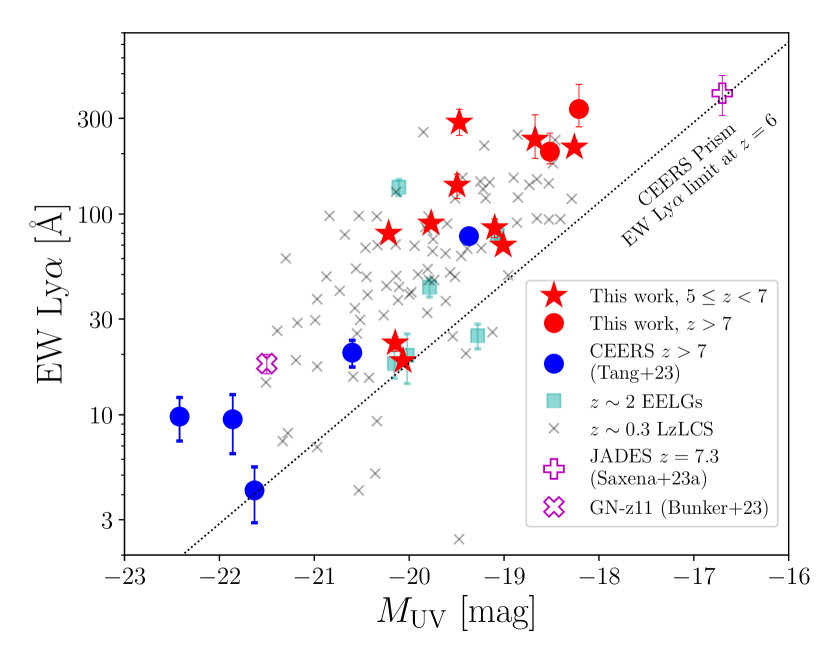
For the 10 galaxies with Ly at , their NIRCam H-band (F150W) magnitudes (or ACS F160W if not covered by NIRCam) range from 26.1 to 28.7 (median 27.3, see Table 1), which are on average fainter than the full CEERS spectroscopic sample (Figure 1). Following Tang et al. (2023), we estimate their absolute UV magnitudes from the NIRCam (or WFC3) photometry in the filter where the central wavelength is closest to the rest-frame 1500 Å. The resulting absolute UV magnitudes span to (median ). These values overlap with a subset of the CEERS Ly emitting galaxies recently identified in Tang et al. (2023), but are fainter than the Ly emitting galaxies identified with ground-based observations in this field ( ; e.g., Oesch et al., 2015; Zitrin et al., 2015; Stark et al., 2017; Jung et al., 2022; Larson et al., 2022). We note that given the flux limit of the CEERS prism spectra, only large EW Ly ( 100 Å) will be detected in galaxies with faint continuum ( ; see Figure 3). The sources with high Ly EW identified in this work are similar to the strong Ly emitting galaxies found at lower redshifts (e.g., Malhotra & Rhoads, 2002; Cowie et al., 2011; Nakajima et al., 2012; Nakajima et al., 2013; Izotov et al., 2016; Yang et al., 2017; Izotov et al., 2018a, b; Tang et al., 2021; Flury et al., 2022a; Naidu et al., 2022). For context, the CEERS Ly emitting galaxies are up to 3 mag fainter in than GN-z11 ( = and Ly EW = 18 Å; Oesch et al. 2015; Bunker et al. 2023), powering up to 10 times larger Ly EW. Their large Ly EWs and low UV luminosities approach what is measured for the ultra-faint Ly emitting galaxy at , JADES-GS-z7-LA ( = and Ly EW = 400 Å; Saxena et al. 2023b).
We now investigate the CEERS spectra obtained after the first epoch of observations with the goal of identifying Ly emitters at . The data reveal two likely Ly detections, CEERS-80374 at = 7.17, and CEERS-80239 at = 7.48. Both Ly emitting galaxies are identified in the CEERS epoch 3 observations taken in February 2023. The spectra show multiple rest-optical emission lines (i.e., H and [O iii]) as well as an emission line feature at the position of Ly at SNR = 7.8 and 8.2 that supports our identification (see Figure 2). Both Ly emitting galaxies show the detection of UV continuum in the spectra. We compute Ly EWs in the same manner as above. The derived values are Å for CEERS-80374 and Å for CEERS-80239, among the highest EWs detected at (e.g., Jung et al., 2020; Bunker et al., 2023; Saxena et al., 2023b; Tang et al., 2023). We measure = for CEERS-80374 and for CEERS-80239 as above, which are among the faintest UV continuum magnitudes in our sample (see Figure 3). The UV magnitudes are also fainter than the majority of the Ly emitting galaxies found previously, approaching the values measured for the strongest Ly emitting galaxies found in other surveys ( to ; e.g., Maseda et al., 2018; Saxena et al., 2023b; Maseda et al., 2023). We will come back to discuss this population in later sections.
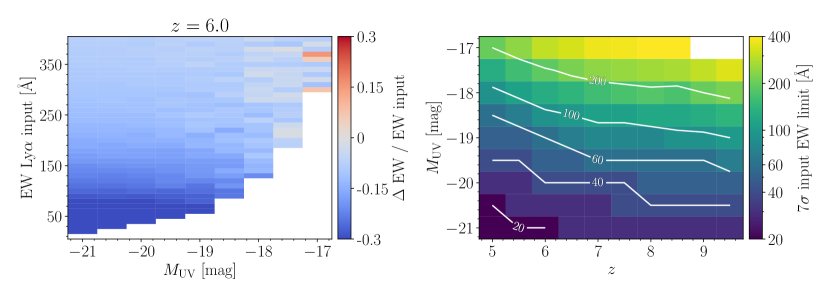
To assess the robustness of our Ly EW measurements from the prism spectra, we simulate the observed Ly spectra for galaxies spanning the redshift and range relevant to our Ly emitting galaxy sample. We create mock 1D Ly spectra for galaxies spanning –10 in steps of z = 0.2 and = to in steps of = 0.5. Each Ly spectrum consists of a skewed Gaussian profile as the intrinsic Ly emission line before IGM attenuation. We also adopt a flat continuum that matches the assumed . For the Ly line, we assume a narrow (FWHM = 300 km s-1) profile with the peak redshifted by 200 km s-1 relative to the systemic redshift, but we note that the results do not strongly depend on the assumed FWHM and velocity offset given the much poorer prism spectral resolution ( 6,000–10,000 km s-1 at the observed Ly wavelength). By adjusting the amplitude of the line, we obtain the intrinsic Ly profile. We choose amplitudes that correspond to EW = 10–400 Å in steps of 5 Å. In this process, we have assumed that emission bluewards of 1216 Å is completely attenuated by IGM. Next, we convolve the intrinsic Ly profiles to match the wavelength-dependent resolution of the prism observations and rebin the spectra to the observed wavelength grid 666https://jwst-docs.stsci.edu/jwst-near-infrared-spectrograph/nirspec-instrumentation/nirspec-dispersers-and-filters. We also add wavelength-dependent noise that is estimated from the median noise of our spectroscopic sample at the same observed wavelength grid. For each simulated observation of Ly spectrum, we then compute the observed Ly EW using the same method as we described above, adopting the same integration window of [, ] Å relative to the line center in the rest-frame to compute the line flux. We repeat this process 100 times to obtain the median observed Ly EW and SNR at each redshift, , and input Ly EW. Considering only the spectra where the Ly is observed at SNR 7 (similar to our adopted threshold for identifying Ly in CEERS observations), we measure the observed Ly EW from simulated spectra and compare them with the input values (Figure 4).
At , for mock spectra with input Ly EW Å and , we recover similarly high EW values, which in general are only slightly smaller (by 20%) than the input EWs. The smaller “observed” EWs are expected if a fraction of the Ly photons fall on pixels dominated by the continuum break, reducing the recovered line flux. The percentage difference between the measured and input Ly EW increases towards smaller input EW, with the measured value potentially underestimated by 30–50% for more moderate EW ( Å) lines. Among the 8 strongest Ly emitting galaxies (80 Å) in our sample, we find that the EWs may be underestimated by a small fraction ( 25%) due to the instrumental effects described above. For the remaining 4 sources with weaker Ly (23–80 Å), Figure 4 suggests measured values may be underestimated by up to 50%. In what follows, we will report the measured values, but we will also consider how our results may change if the Ly EWs are underestimated.
As the majority of galaxies in our spectroscopic sample do not show Ly, we now consider what EW limits we can place on them given the prism non-detections. The right panel of Figure 4 shows the limiting input Ly EW that leads to a 7 emission line in the mock spectra. For bright ( ) sources with intrinsic EW = 20 Å, we are able to detect Ly at . This is approximately the smallest Ly EW value measured in our CEERS sample. We also see in Figure 4 that the Ly EW limit increases rapidly at lower luminosities. At 5–8, these tests suggest that a Ly non-detection at = would correspond to EW 90–180 Å, whereas at = , the non-detection would correspond to EW 30–50 Å. We note that these tests are consistent with Ly being detected in GNz11 at moderate resolution () but not with the prism (Bunker et al., 2023): given its absolute magnitude ( = ) and redshift (), we find that the prism can only recover Ly with EW35 Å (assuming continuum per pixel SNR = 20 and no damping wing effect of IGM absorption), above the value recovered at higher resolution (EW = Å).
For individual galaxies with non-detections of Ly in our sample, we have derived the Ly EW upper limits by direct integration of the error spectra. We use the same integration window (i.e., [-50, 80] Å relative to Ly in the rest frame) used for individual Ly emitting galaxies in our sample. The resulting 7 upper limits on Ly fluxes range from to erg s-1 cm-2, translating into EW spanning from 15 Å to 560 Å. However, as already shown above with the mock Ly observations, when the Ly is detected, the observed EW could be underestimated (by up to 50%) compared to the input Ly EW. As a result, the Ly upper limits derived from the observed spectra could still be underestimated given the poor resolution of the prism observations. In our following analysis, we will include these non-detections of Ly and consider the impact of underestimated upper limits on our results. By combining these non-detections with the 12 Ly emitting galaxies, we will be able to assess how common strong Ly emission lines are at different redshift ranges, which we will discuss in the following sections.
We note again that the Ly measurements reported in this section may be missing diffuse flux scattered from gas surrounding the UV-bright components. Studies with the VLT/MUSE Integral Field Spectrograph have characterized the surface brightness profile of Ly halos for large numbers of faint Ly emitting galaxies up to 6 (e.g., Wisotzki et al., 2016; Leclercq et al., 2017). To assess roughly how much of the total Ly flux we may be missing in these NIRSpec microshutter observations, we compare the three compact 6 Ly emitting galaxies that have been observed by both NIRSpec prism and VLT/MUSE IFS (Saxena et al., 2023a). This analysis will be presented in Tang et al., in prep. The NIRSpec line flux is taken from Saxena et al. (2023a), and the MUSE Ly flux is from Bacon et al. (2017, 2023) extracted with the “ORIGIN” software (Mary et al., 2020), and more details will also be described in Tang et al. in prep.. For the three systems, we find that the NIRSpec measured Ly fluxes are 70–80% of the fluxes measured from VLT/MUSE. If we assume the Ly surface brightness profile from Leclercq et al. (2017), the MUSE “ORIGIN” aperture in turn recovers 75% of the total Ly after accounting for the diffuse flux in the Ly halo. This suggests that, for the galaxies in our sample, the total Ly flux could be up to a factor of 1.67 larger than our NIRSpec measurements. In this paper, we are mostly focused on a comparison of Ly properties in galaxies observed with NIRSpec MSA, somewhat mitigating the impact of the slit loss associated with Ly halos. Future studies with NIRSpec Integral Field Spectroscopy are required to assess slit loss fractions in larger samples of Ly emitters in the reionization era.
2.3 SED Fitting and Photoionization Modeling
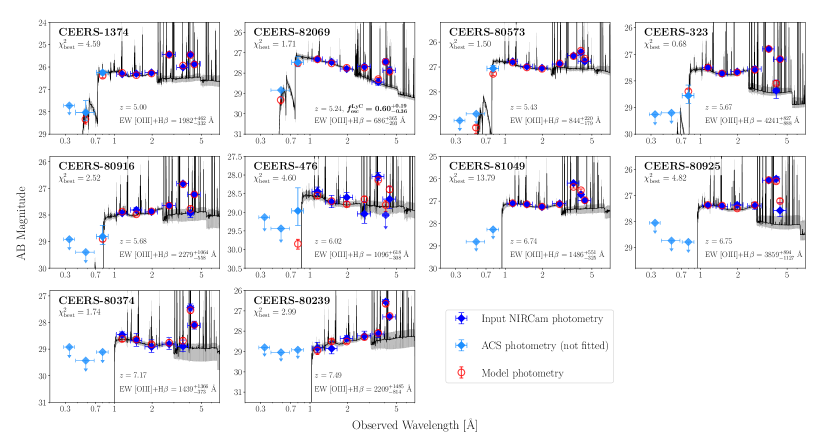
The stellar population properties of our spectroscopic sample, including the new 5 Ly emitting galaxies are derived from spectral energy distributions (SEDs). The CEERS NIRCam footprint covers 10 of the 12 Ly emitters (49 of the 67 galaxies not detected in Ly) in our new prism sample. We will focus primarily on these sources in this section given the significant improvement NIRCam provides relative to HST and Spitzer. We show the NIRCam SEDs of the 10 newly identified Ly emitting galaxies in Figure 5. Their SEDs show characteristic flux excesses (0.3–1.6 mag) from [O iii]+H and H in the NIRCam long wavelength filters that indicate the presence of young massive stars. Through power law fitting to the broad-band SED sampling the rest-frame UV (see Topping et al. 2022b; Cullen et al. 2023; Topping et al. 2023), we estimate that their UV slopes () range from to , with the median . The bluest UV slopes are also consistent with substantial leakage of ionizing photons (e.g., Bouwens et al., 2010; Ono et al., 2012; Topping et al., 2022b; Furtak et al., 2023; Topping et al., 2023), which we will discuss below. We infer the physical properties of the galaxies in our sample by fitting the NIRCam photometry with the BayEsian Analysis of GaLaxy sEds (Beagle; Chevallard & Charlot 2016) code. We largely follow the modeling process described in Endsley et al. (2023b) and Tang et al. (2023), which we summarize below. For the 10 Ly emitting galaxies, we also consider a set of models allowing the escape of ionizing photons from the host galaxies, which will also be described below. In both cases, we employ the Gutkin et al. (2016) photoionization models that self-consistently combine the stellar emission from the latest Bruzual & Charlot (2003) stellar population synthesis models with the nebular emission computed with the photoionization code Cloudy (Ferland et al. 2013). We fix the redshift to the spectroscopic values determined in § 2.1, and we only consider the NIRCam filters redwards of the Ly emission line.
We assume a constant star formation history (CSFH), adopting the Chabrier (2003) initial mass function with the mass range of 0.1–300 . We place a log-uniform prior on the galaxy age (defined as the duration of the constant star formation) from 1 Myr to the age of the universe at the given redshift, and on the stellar mass over the range of . However, we note that in cases where the star formation history has undergone a recent upturn, the stellar masses inferred from CSFH could substantially underestimate the total stellar mass if there is a hidden older stellar population (e.g., Tacchella et al., 2023; Topping et al., 2022a; Endsley et al., 2023a; Whitler et al., 2023c, b). We assume log-uniform priors on both stellar metallicities and ionization parameters over a broad range of the parameter space allowed by the models (i.e, ; ). The interstellar (the gas-phase + dust) metallicity is kept the same as the stellar metallicities through a fixed depletion factor ( = 0.3) of metals into dust grains, and we assume the gas density cm-3. We use the SMC curve (Pei, 1992) with V-band optical depth () adjusted from Finally, we assume the Inoue et al. (2014) model to account for the IGM attenuation.
Our default BEAGLE models are ionization-bounded, assuming that all ionizing photons emitted from stars have been reprocessed by the interstellar medium into nebular emission lines or absorbed by dust grains. Previous work has shown that extremely strong Ly emitting galaxies (i.e., 50–100 Å) could leak a significant amount of Lyman continuum (LyC) photons (e.g., Flury et al., 2022b; Dijkstra et al., 2016; Verhamme et al., 2017; Izotov et al., 2020; Pahl et al., 2021), diminishing the nebular continuum and emission line flux. This can result in very blue UV slopes () that are not seen in the standard ionization-bounded models (e.g., Raiter et al., 2010; Zackrisson et al., 2017; Yamanaka et al., 2020; Chisholm et al., 2022; Topping et al., 2022b; Topping et al., 2023; Kim et al., 2023). Given the presence of very blue sources in our sample, we also consider a set of BEAGLE models that account for the escape of LyC photons ( models). The models we adopt use a “picket fence” geometry where a fraction of LyC photons escape through low H i density sightlines from the host galaxy. (e.g., Heckman et al., 2001; Heckman et al., 2011; Reddy et al., 2016; Gazagnes et al., 2020). We place a uniform prior on the LyC escape fraction () over [0,1], with the remaining BEAGLE parameters kept the same as in our fiducial ionization-bounded models.
For the majority (9/10) of the Ly emitting galaxies, the models provide equally accurate fits to the NIRCam SEDs, with the implied ranging from 0.19–0.47. In both sets of Beagle fits, the minimum values are found to have small differences between the two models. Their fitted parameters from the two models are mostly consistent, except that the models prefer slightly younger CSFH ages ( 0.36 dex) and higher stellar masses ( 0.43 dex), similar to what is found in Tang et al. (2023). However, for CEERS-82069, where the observed SEDs cannot be fitted well with the fiducial BEAGLE models (best = 36.0), the models improve the fitted SED significantly (best = 1.71, see its SED in Figure 5). Its potential high escape fraction of LyC photons is also consistent with the extremely blue UV continuum slope (). Therefore, the SED fitting results derived from the models are preferred over those from the default ionization-bounded models for CEERS-82069. In the following analysis, we will primarily focus on the results from the models for CEERS-82069, and the results from our default models for the remaining 9 galaxies, which are reported in Table 2.
The Beagle models of the Ly emitters show large flux excesses in the NIRCam SEDs at 3–5 m, resulting in the models preferring large EW [O iii]+H (682 Å up to 4300 Å in the rest frame). The median EW [O iii]+H is 1982 Å, significantly higher than the typical values inferred for 6–8 galaxies (median 780 Å; Endsley et al. 2021a; Endsley et al. 2023b, a). The very high [O iii]+H EWs also translate into extremely young stellar population ages (assuming CSFH) ranging from 2 to 54 Myr (median 6 Myr), younger than the more general populations at these redshifts (median 30–69 Myr; Whitler et al. 2023c; Endsley et al. 2023a) but comparable to the Ly emitting galaxies found in Tang et al. (2023). The stellar masses associated with these young stellar populations are estimated to be – (median ). The corresponding specific star formation rates range between 19–473 Gyr-1 and occupy the high end of the sSFR distribution of UV-bright galaxies at this redshift (median Gyr-1; Topping et al. 2022a), consistent with rapidly rising SFHs occurring in these Ly emitting galaxies (Endsley et al., 2023b, a). The rest-optical spectra also reveal O32 (=[O iii]4959,5007 / [O ii]3728) ratios up to (median 7.3), suggesting gas under extreme ionization conditions. We also note that when the rest-optical continuum is also well-detected (SNR7 over a 1200 Å window in the rest-frame) in the prism spectra, we derive values of EW [O iii]+H that are consistent with the Beagle-based values within the 1–2 uncertainties.
With the constraints on the dust attenuation from SED modeling, we now reassess the dust correction to the optical emission line fluxes measured from prism spectra. We perform dust correction considering both the Balmer decrement derived directly from the spectra and the effective optical depth estimated with Beagle. Among the 12 Ly emitting galaxies, we detect both H and H at SNR(H) = 16–106 for 6 systems, allowing us to estimate the dust attenuation using the H/H flux ratios. In one case (CEERS-1334), we use the H/H ratio (H detected at SNR = 45) owing to an anomalously high H flux. Assuming the case B recombination with the gas temperature K and density cm-3, we expect an intrinsic H/H (H/H) = 2.86 (0.47; Draine 2011). Comparing this with the observed ratios (median H/H = 3.20, and H/H consistent with zero dust for CEERS-1334), we derive the corresponding optical depth in the V band (), assuming the SMC attenuation curve (Pei, 1992). We find that inferred range from 0.0 (CEERS-1334 and CEERS-80916) to 0.56 (CEERS-1561), corresponding to small correction factors to the H flux of 1.00–1.55 (median 1.24) to the six galaxies.
However, for the remaining 6 galaxies, the Balmer emission lines (H and H at , and H and H at ) are poorly detected (SNR7 for at least one line), leading to large uncertainties when deriving the dust attenuation based on the Balmer decrement. In order to estimate their dust attenuation, we rely on the optical depths in the V band derived with NIRCam SED modeling above, which span = 0.005–0.20 (median 0.009). To investigate whether these SED-based attenuation factors are applicable to emission lines, we compare the derived from the continuum SED and that from the Balmer decrement for four galaxies where both measurements are available. We find that the continuum SED suggests a that is 3.1–4.9 smaller than the value inferred from Balmer emission lines. Since the SED-based attenuation is mostly driven by the reddening of the continuum, it is often dominated by the fraction of dust in the diffuse ISM, affecting stars that have freed themselves from their birth clouds. If the age of the stellar population is very young throughout the galaxy, we may expect the stars and nebular-emitting gas to face similar attenuation. It is unclear whether the offset of we find is due to H ii regions facing greater attenuation than stellar continuum (e.g., Calzetti et al., 2000; Förster Schreiber et al., 2009; Wuyts et al., 2011; Price et al., 2014; Reddy et al., 2015, 2020; Shivaei et al., 2020), or due to uncertainty in estimating attenuation from SEDs of very young and blue galaxies. Based on these results, when computing attenuation facing emission lines, we will adopt the Reddy et al. (2020) relation, where the nebular attenuation is 4.331 (assuming the SMC curve) of that faced by the stellar continuum. However, we note that our analysis in the following is not significantly impacted if we adopt the original inferred with Beagle fits to NIRCam SEDs. This requires small correction factors to the H (H) flux of 1.02–1.96 (median 1.03) for these six galaxies without robust Balmer decrement measurements.
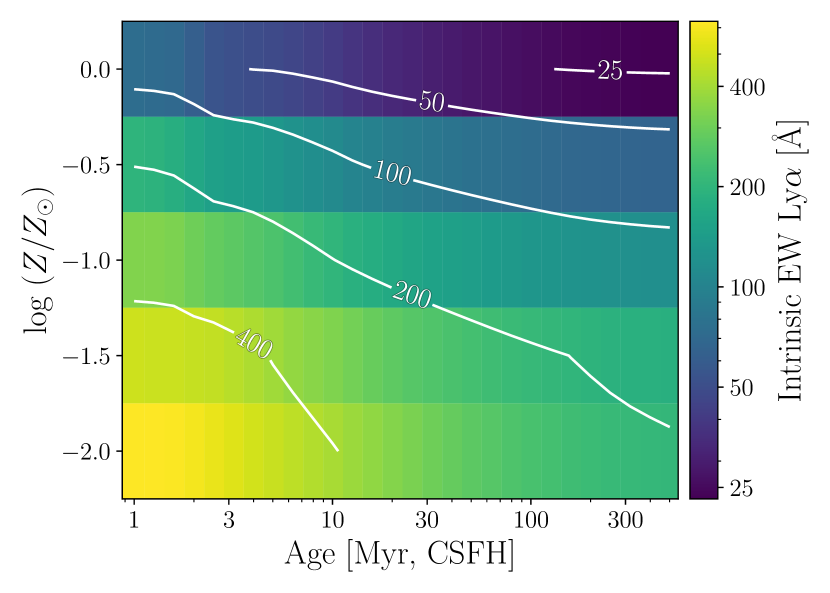
In the following section, we will quantify the escape fraction of Ly for the Ly emitting galaxies in our sample, using the H or H detections to compute the intrinsic Ly luminosity. The Beagle models described above provide an independent estimate of the ionizing photon production rate, which also translates into an intrinsic Ly luminosity and EW. In this process, Beagle takes the Ly luminosity output by Cloudy (Ferland et al., 2013), which is supposed to account for the absorption of ionizing photons by dust before they ionize hydrogen (Charlot & Longhetti, 2001; Gutkin et al., 2016). In Figure 6, we show the intrinsic Ly EW implied by Beagle as a function of both stellar population age (assuming CSFH) and stellar metallicity. Here, we have assumed the default ionization bounded H ii regions with an ionization parameter of log = , and adopted the same Chabrier (2003) IMF and treatment to the gas-phase metallicity as described for our SED fitting. It is clear that the intrinsic Ly EW are largest at the youngest stellar population ages and lowest metallicity, reaching 200 Å at age 30 Myr and . At the young stellar population ages that are common for our Ly emitting galaxy sample (2–54 Myr), the Beagle models infer very high ionizing photon production efficiency log ( / erg-1 Hz) = 25.5–25.9, which corresponds to the hydrogen ionizing photon production rate per unit intrinsic UV luminosity at rest-frame 1500 Å including nebular and stellar continuum (e.g., Chevallard et al., 2018; Tang et al., 2019). The efficient production of ionizing photons results in the production of very large Ly EWs in the sample, with values ranging from 113 to 601 Å (median 256 Å). Compared with the observed Ly EW (20–334 Å), the larger intrinsic EW implies that only a fraction of the Ly photons are able to escape from the host galaxies (on the scale of the NIRSpec microshutter) and through the IGM, which we will discuss in the following section.
3 Redshift Evolution of Ly Escape Fraction
[t] ID RA Dec EW [O iii]+H EW Ly (deg) (deg) (mag) (Å) (Å) (Case B) (Case B, corrected)a CEERS-1912 5.11 215.0108337 53.0133278 CEERS-82052 5.16 214.7665608 52.7822694 CEERS-4210 5.26 215.2372075 53.0610861 – CEERS-81022 5.30 214.8004492 52.7488889 CEERS-2168 5.66 215.1526021 53.0570611 – CEERS-83592 5.73 214.9566929 52.8337806 DDT-2315 5.75 214.9191721 52.8935000 CEERS-397 6.01 214.8361971 52.8826917 CEERS-362 6.05 214.8126892 52.8815361 CEERS-81063 6.08 214.7991100 52.7251194 CEERS-1518 6.11 215.0068021 52.9650417 – CEERS-1065 6.19 215.1168542 53.0010806 – CEERS-81068 6.27 214.8205071 52.7371472 DDT-663 6.52 214.8789692 52.8967472 CEERS-1414 6.70 215.1280287 52.9849361 CEERS-717 6.93 215.0814058 52.9721806 – CEERS-1143 6.93 215.0770062 52.9695056 – DDT-445 6.98 214.9416108 52.9291306 CEERS-80432 7.47 214.8120558 52.7467472
-
a
The with prism Ly flux corrections, where the correction factors are computed using the Ly mock observations as shown in Figure 4.
JWST has recently opened a new window on Ly emitting galaxies in the reionization era (e.g., Bunker et al. 2023; Jones et al. 2023; Jung et al. 2023; Saxena et al. 2023b, a; Tang et al. 2023). Initial investigations have demonstrated that many of the strongest known Ly emitters at are not effective leakers of Ly radiation, with typical Ly escape fractions (0.073) that suggest significant attenuation relative to similar systems at (Bunker et al., 2023; Tang et al., 2023). It is not clear whether the line photons are mostly scattered by HI in the galaxy or in the surrounding IGM. More recent work has begun to uncover the first galaxies with very large Ly escape fractions (, Jung et al. 2023; Saxena et al. 2023b, a; Tang et al. 2023), leaving little room for attenuation from the IGM. These Ly emitters potentially provide signposts of large ionized bubbles expected around overdensities of faint galaxies.
Future NIRSpec observations promise to build on the early work described above, delivering the distribution of Ly escape fractions (as a function of galaxy properties) at . If we are to robustly link these measurements to quantitative constraints on the IGM ionization state, we need knowledge of the distribution of Ly escape fractions in similar galaxies just after reionization, where the impact of the damping wing from the neutral IGM is less important. Our primary goal in this section is to use our CEERS NIRSpec prism database to begin investigating the Ly escape fractions at the tail end of reionization. We seek to determine what fraction of galaxies have very high Ly escape fractions at (similar to the galaxy reported in Saxena et al. 2023b) and to quantify how this fraction evolves with redshift into the reionization era.
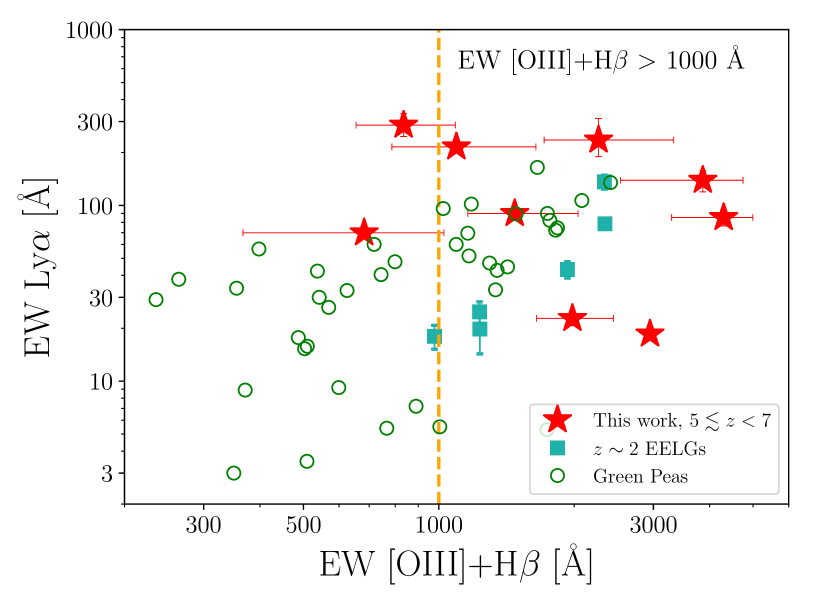
Our CEERS prism database consists of 69 galaxies with confident rest-optical emission line redshifts at . As reported in §2, 10 of these systems have Ly detections in the prism spectra (Figure 2). The implied EWs are often quite large, with 7 in excess of 70 Å and a further 3 in the range 100–300 Å, comparable to the most extreme systems uncovered in ground-based surveys (e.g., Trainor et al., 2015; Hashimoto et al., 2017a, b; Maseda et al., 2018; Ning et al., 2020; Vanzella et al., 2020; Matthee et al., 2021; Kerutt et al., 2022; Torralba-Torregrosa et al., 2023). These values approach the maximum intrinsic Ly EWs expected from stellar population synthesis models for very young and metal poor stellar populations (200 to 600 Å; Figure 6), suggesting a significant fraction of the line is likely to have been transmitted through both the galaxy and IGM. The majority of strong Ly emitters have intense [O iii]+H emission (Figure 7), with values largely following the trend between the two quantities seen in lower redshift samples (Du et al., 2020; Tang et al., 2021). Here we see that the typical Ly EWs start to increase above [O iii]+H EW = 1000 Å, with the majority having Ly EWs between 50 and 300 Å at all redshifts considered.
To infer the Ly escape fractions in the galaxies, we first quantify the intrinsic Ly luminosity passing through the NIRSpec microshutter. We calculate the intrinsic Ly luminosity from the dust-corrected H flux and basic recombination assumptions. In CEERS-1334, we use the dust-corrected H flux instead owing to its anomalously high H flux. We also use the dust-corrected H flux for the two galaxies in our sample, because the H emission line falls outside the prism wavelength coverage. We note that this definition of the Ly escape fraction will focus on the transmission through the microshutter, as is common when Ly escape fractions are calculated with slit-based spectrographs (e.g., Begley et al., 2023; Bunker et al., 2023; Roy et al., 2023; Saxena et al., 2023a; Tang et al., 2023). In this paper, we will primarily focus on the evolution of Ly escape fractions derived self-consistently from NIRSpec MSA observations at . While potential corrections for Ly scattered into a diffuse halo may be somewhat more important when comparing to ground based observations at lower redshifts (given the slightly larger slits), such comparisons are not central to this paper.
We first consider case B recombination where the intrinsic line ratio Ly/H (Ly/H) = 8.6 (24.6) at gas temperature = K and electron density = 250 cm-3 using the Pyneb (Luridiana et al., 2015) package with the Storey & Hummer (1995) atomic data. Alternative assumptions on gas properties ( =5, 000–20,000 K and = 100–1000 cm-3) only change the Ly/H (Ly/H) ratios by 10 percent, with larger ratios at higher and larger . However, we note that the assumption of case B recombination with optically thick H ii regions is not always valid, in particular for galaxies with substantial leakage of Ly or Lyman continuum photons (e.g., Gazagnes et al., 2020). Given the large Ly EWs quoted above, this may be relevant for a subset of our sample. Here the escape fraction may be better estimated by case A recombination (Osterbrock & Ferland, 2006), where the intrinsic Ly/H (Ly/H) ratio is 12.0 (33.7) for = K and = 250 cm-3 gas. This is a factor of 1.4 larger than that of case B, resulting in smaller Ly escape fractions for a given Ly and H flux when case A is adopted. Unless otherwise stated, we will focus on the case B escape fractions in the following. For galaxies lacking Ly detections, we place 7 upper limits on , combining the Ly flux upper limits derived in §2.2 and the dust-corrected H or H flux.
The derived Ly escape fractions are reported in Table 2 for the sources with Ly detections. As expected, the results confirm the presence of large Ly escape fractions in galaxies with large EWs. The median value in our sample is = 0.28, well above typical values of UV-selected galaxies at lower redshifts (Hayes et al., 2011). If we instead adopt the case A value, we find decreases by about 30% (median decreases to 0.20), but the values still indicate that significant transmission of Ly photons is fairly common at . One of our goals was identifying galaxies similar to the strong Ly emitter with near unity identified by Saxena et al. (2023b) at . Our sample contains four Ly emitting galaxies at with 50% Ly escape fractions. Two of these systems (CEERS-82069 and 476) have escape fractions (and EWs) that are similar to the galaxy in Saxena et al. (2023b). Each of these has prominent Ly coupled with weak H lines in the rest-optical (Figure 2), implying Ly/H ratios approaching the theoretical limit. The Ly escape fractions quoted above do not account for the impact of the low resolution prism on the recovered line flux (see §2.2). To estimate the impact of this effect on our results, we apply the redshift and -dependent flux corrections (Figure 4) to our observed values. We find that this typically leads to small increases (median 1.14) to the Ly escape fractions described above. We provide these corrected values in Table 2.
To establish a useful baseline for comparison against samples, we need to consider the distribution of escape fractions in the galaxy population near the end of reionization. Here, we primarily focus on the Ly escape fractions derived at slightly lower redshifts (). The Ly escape fractions derived from NIRSpec MSA observations depend on both galaxy properties (i.e., dust, H i covering fraction) and the neutral content of the IGM. To reliably link evolution in the escape fractions to the IGM, we must compare samples across cosmic time with matched galaxy properties. Here we attempt to do this by considering only galaxies with intense rest-optical nebular emission ([O iii]+H EW 1000 Å based on Beagle SED modeling or direct measurements from the prism spectra) and lacking significant dust attenuation (). This has the effect of isolating sources that are moderately metal poor and dominated by very young stellar populations (e.g., Tang et al., 2019; Curti et al., 2023; Nakajima et al., 2023; Sanders et al., 2023a). There is one source in our sample (CEERS-82069) that appears to have extremely young stellar populations (CSFH age = Myr) coupled with a much lower [O iii]+H EW. As we discussed in §2.3, this source has a very blue UV slope that may suggest the emission lines may be weakened by the leakage of ionizing photons. To ensure we include all the young and metal-poor sources, we include this source in our sample for calculating the distribution of Ly escape fractions. This leaves us 24 galaxies satisfying our selection criteria, including 9 Ly emitting galaxies (median = 0.25) and an additional 15 systems with Ly non-detections (see Table 3).
To infer the distribution, we adopt a Bayesian approach following the method outlined in Schenker et al. (2014) and Boyett et al. (2022). Briefly, we assume a lognormal distribution for with parameters () in the following functional form
| (1) |
where is the normalization factor, and . Here, we have adopted a upper limit of 1. For systems with derived (or the upper limits) , we will assume (or the upper limits) = 1 in deriving the distribution. We use Bayes’ Theorem to derive the posterior probability distribution of model parameters () given the observed data ()
| (2) |
where is the likelihood of observing the data given the model parameters, and are the priors. We adopt a uniform prior on the lognormal location parameter from –0 (corresponding to median = 0.0001–1 in the linear space for the probability density function in Equation 1), and Gaussian prior on the scale parameter (centered at 0.6 with standard deviation 0.3).
For a given set of model parameters (, ), we compute the likelihood of observing the data considering both measurements and those with upper/lower limits. For each system with measurements (detected both in Ly and Balmer emission lines), the Gaussian measurement uncertainty of is given by
| (3) |
where and are the measured and uncertainty for the -th source. The individual likelihood for each source is thus
| (4) |
For sources not detected in Ly and with upper limits, the individual likelihood is given by
| (5) |
where the corresponds to the observed upper limit. Similarly, in the case of lower limits due to non-detection of Balmer emission lines (e.g., CEERS-80239), the individual likelihood is
| (6) |
where the corresponds to the observed lower limit. The likelihood over the entire dataset is thus taken as the product of the individual likelihood of each source, including both measurements and those with upper/lower limits.
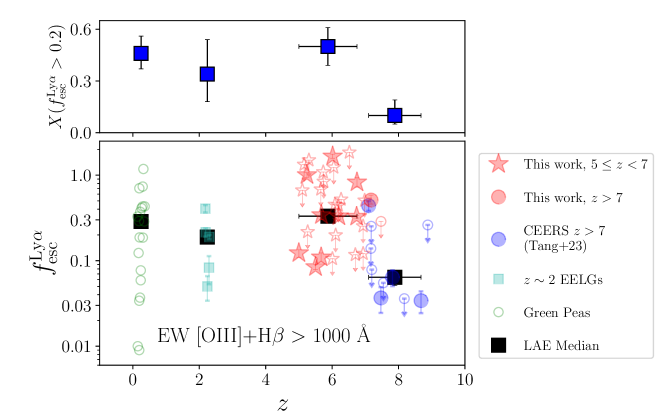
To derive the Ly escape fraction distribution at , we adopt the Markov chain Monte Carlo approach to sample the posteriors of the model parameters (, ) with the Emcee package (Foreman-Mackey et al., 2013). We first consider the raw Ly escape fractions derived from the prism spectra, and then we will consider the distribution changes if we make flux corrections accounting for the impact of the low resolution prism on the line recovery (Figure 4). Considering the raw escape fractions, we compute the marginalized posterior distributions of lognormal parameters, finding and . In what follows, we define the percentage of the galaxies in this sample with moderately high escape fractions of Ly photons ( 0.2) as (). This analysis demonstrates that of the high-EW ([O iii]+H 1000 Å) systems have . If we apply the flux corrections to the prism measurements described above (see Figure 4), we find a slightly larger fraction of the sample () has Ly escape fractions in excess of 0.2 (lognormal parameters , ).
Lower redshift samples of similarly selected galaxies also show large escape fractions of Ly emission (e.g., Henry et al., 2015; Izotov et al., 2016; Yang et al., 2017; Tang et al., 2021; Flury et al., 2022b). Applying a similar selection ([O iii]+H EW 1000 Å) to the Green Pea sample of Yang et al. (2017), we derive the distribution for the resulting sample following our method above. We obtain a lognormal location parameter and scale parameter , which suggests significant leakage of Ly photons ( 0.2) in of the sample. In addition, at 2, we find lognormal distribution with and with the Tang et al. (2021) EELGs satisfying the same [O iii]+H EW cut. The modeled distribution translates into a fraction of of the EELGs that show 0.2. This suggests that the fractions of large escape fraction systems in samples are broadly comparable to what we have found using NIRSpec at 5.0–6.8 (see Figure 8).
We now seek to determine if existing constraints on the Ly escape fraction at reveal evolution with respect to our benchmark measurement at –6.8. Here we build on the spectroscopic catalog assembled in Tang et al. (2023) (see also Jung et al. 2023; Larson et al. 2023), adding the 10 new galaxies we confirmed at in this paper (see §2.2). The database contains 10 galaxies with [O iii]+H EW 1000 Å. We also include two galaxies that lack NIRCam SEDs but have very large O32 ratios () that are often linked to large [OIII]+H EWs (see Tang et al. 2023). (We note that our main z>7 results do not change by including these sources.) This results in 12 galaxies that satisfy our selection. We note that the derived in Tang et al. (2023) assumed zero dust attenuation based on Balmer decrements from composite spectra. For consistency with our measurements, we apply small dust corrections to the values following the same method described in §2.3. This results in a median 14% decrease of the original Ly escape fractions, as the predicted intrinsic Ly luminosity is modestly larger following the dust correction. The derived lognormal distribution ( and ) is markedly different from that at .
The results demonstrate that large escape fractions ( 0.2) are only found in % of the systems in CEERS. Considering the corrections to the prism-based values, we find this high- fraction is % (lognormal parameters , ). This fraction is lower than that at , , and (see Figure 8), as would be expected given the inferred neutral fraction of the IGM at (Mesinger et al., 2015; Zheng et al., 2017; Mason et al., 2018a, 2019; Hoag et al., 2019; Whitler et al., 2020; Bolan et al., 2022). Comparison between the and samples admittedly faces limited statistics and uncertainties in the prism-based EWs, but the data are nonetheless consistent with a significant decline in toward earlier times (Figure 8). Furthermore, in §5, we will show that the CEERS EGS field may have large ionized sightlines that amplify Ly relative to the global average at . In this sense, the downturn in the Ly escape fractions is likely to be greater in other deep fields. As sample sizes increase at , it will be possible to build up the statistics while also considering sources matched in a wider range of galaxy properties.
4 Ly Associations at in the EGS Field
We have demonstrated in §3 that large Ly escape fractions and Ly EWs are relatively common in faint galaxies, with 0.2 presented in 50% of those with [O iii]+H EW1000 Å. At , we expect high systems to become less common as the IGM grows more neutral, with detections mostly limited to galaxies in large ionized regions of the IGM. The discovery of Ly emission in numerous galaxies in the EGS (Oesch et al., 2015; Zitrin et al., 2015; Roberts-Borsani et al., 2016; Stark et al., 2017; Tilvi et al., 2020; Jung et al., 2022; Larson et al., 2022; Cooper et al., 2023) with ground-based telescopes has long hinted at the possible presence of several ionized bubbles in the field. The first epoch of CEERS NIRSpec spectroscopy targeted a number of these previously-known Ly emitters, generally revealing very low escape fractions (Jung et al., 2023; Tang et al., 2023) that indicate Ly photons face significant attenuation. This may suggest that these systems are situated in relatively small ionized bubbles (with significant IGM attenuation) or it may reflect large column densities of HI on galaxy scales. As these first galaxies targeted tend to be very luminous (and fairly massive) and often with large Ly velocity offset (e.g., Tang et al., 2023; Bunker et al., 2023) implying significant scattering of Ly photons, it is perhaps likely that the HI within the galaxy is largely responsible for reducing the measured escape fraction through the NIRSpec microshutter. In this case, the Ly emitters could still trace large ionized structures where the IGM attenuation is minimal.
The more recent CEERS NIRSpec observations have targeted fainter galaxies identified in NIRCam images of the EGS field (e.g., Arrabal Haro et al., 2023b). In this paper, we present likely detections of Ly in two of these galaxies, CEERS-80374 () and CEERS-80239 (). Because of the faint continuum of both galaxies ( = and , respectively), both detections require extremely large EW Ly emission ( Å and Å). These large Ly EWs suggest these galaxies are situated in ionized regions that facilitate significant transmission of Ly through the IGM (also see Witstok et al. 2023). In one of these systems (CEERS-80239), we are able to measure the Ly escape fraction ( = ) via detection of H, indicating that at least % of the Ly photons are transmitted through the IGM (with a larger IGM transmission implied if some of the attenuation occurs in the ISM and CGM of the galaxy).777In the other galaxy, CEERS-80374, we do not detect H given its faintness (see Figure 2). Nonetheless, a large escape fraction ( = ) is implied by comparing the observed Ly EW with the value derived from Beagle photoionization modeling (§2.3) . To achieve this large may require that the nearest patch of mostly neutral IGM be located at least 1–2 physical Mpc (pMpc) away (Mason & Gronke 2020). Here we have assumed the Ly velocity offset is 100–200 km s-1, a typical range for faint galaxies with strong Ly (Saxena et al., 2023b).888While both sources have rest-optical emission line detections which establish the systemic redshift, they are observed with the prism which precludes robust Ly velocity offset measurements. High-resolution () NIRSpec spectroscopy would be required to measure velocity offset 130 km s-1. Adopting slightly different assumptions will alter the values quoted above, but it is unlikely to change the fact that these two galaxies likely must sit in large ionized regions to facilitate observation of Ly with EW in excess of 200-300 Å.999Very large velocity offsets could conceivably allow Ly to escape in smaller bubbles with less IGM attenuation. But such large velocity offsets are not expected in galaxies with such large Ly EWs (e.g., Erb et al., 2014; Nakajima et al., 2018; Cassata et al., 2020; Tang et al., 2021; Prieto-Lyon et al., 2023).
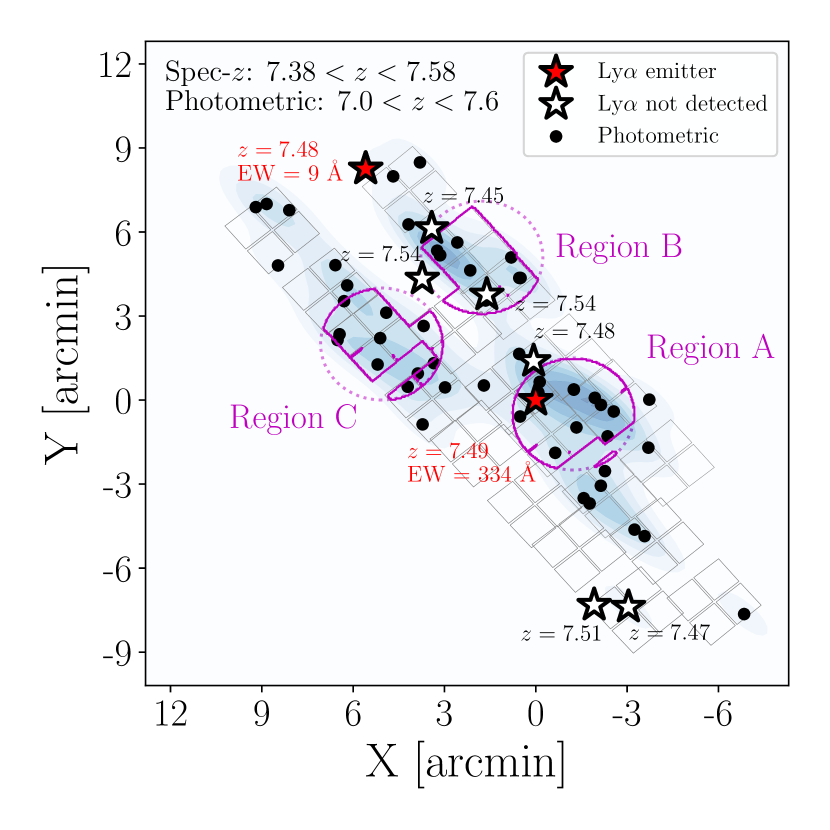
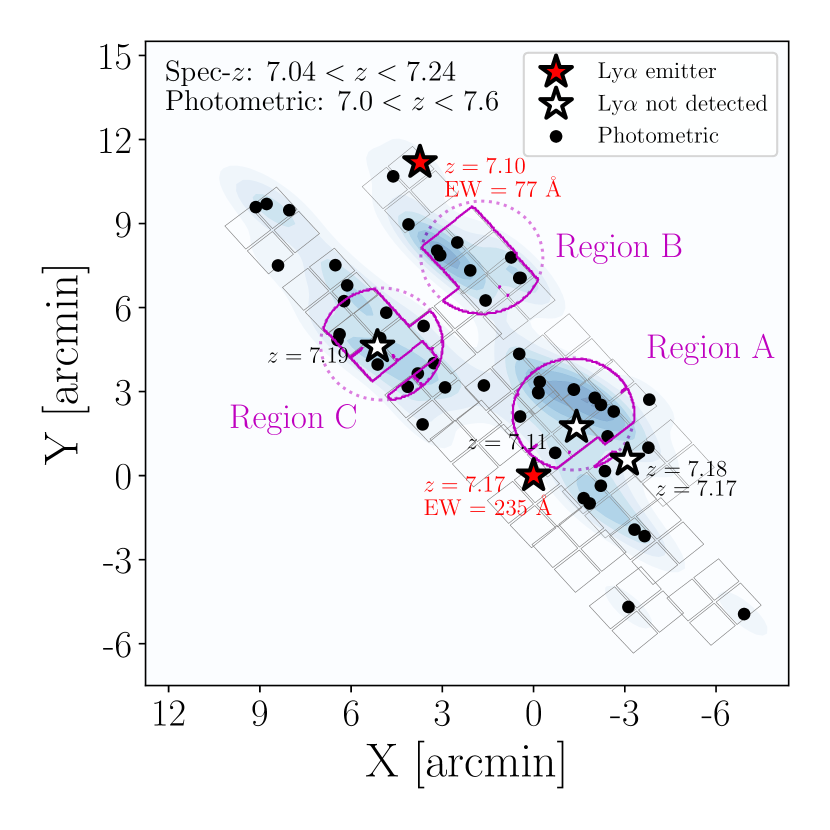
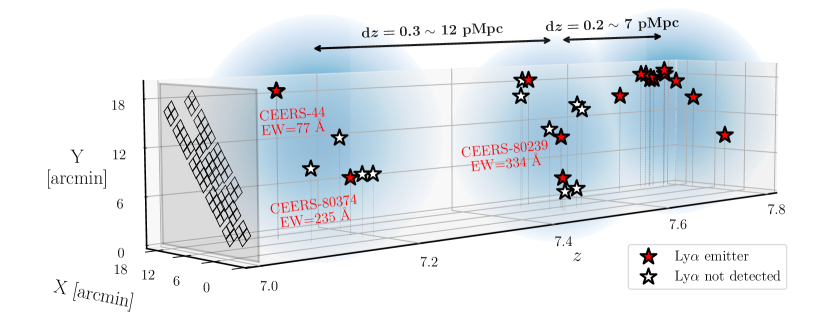
The next step is identifying the galaxy population responsible for carving out the ionized regions that are facilitating such efficient Ly escape. Given that both CEERS-80374 and CEERS-80239 are very faint continuum sources (and unlikely to create significant bubbles on their own), it is probable that they are part of overdense structures that are responsible for creating the ionized region that is enabling efficient Ly escape. We first search for spectroscopically-confirmed galaxies at the redshifts of both galaxies. A map is shown in Figure 9. We note that the new Ly emitter CEERS-80374 () is at a similar redshift as CEERS-698 (), an extremely UV-luminous ( = ) galaxy shown previously to have Ly emission with Keck (Roberts-Borsani et al., 2016; Stark et al., 2017). Taking the systemic redshifts of both, we find the two are separated by only 3.1 pMpc. CEERS NIRSpec observations also confirm an additional six galaxies between CEERS-698 and CEERS-80374, hinting at an extended structure that could be contributing to the ionized bubble. The other new Ly emitter we identify (CEERS-80239) is at a similar redshift as CEERS-44 (separated by 4.7 pMpc), another strong Ly emitter (EW=77Å) in the same field (Tang et al., 2023). CEERS-44 also shows a large Ly escape fraction ( = ), perhaps suggesting reduced IGM attenuation to Ly photons at across the field. Another four galaxies with very similar spectroscopic redshifts and close separations (0.7–3.9 pMpc) from CEERS-80239 and CEERS-44 have been identified in the CEERS program (see Tang et al. 2023 and Figure 9). We present these spectroscopically confirmed galaxies at each Ly emitting galaxy redshift in Table 4. Unfortunately, their Ly line either falls outside the detector or has upper limits on Ly EW (185 Å), making them also potential Ly emitting galaxies within the same ionized regions.
The NIRCam imaging obtained with CEERS provides a more complete census of the galaxies likely to be at the same redshift as the two Ly emitters identified in this study. In the remainder of this section, we characterize color-selected galaxies likely to lie at and assess implications for overdense structures in the vicinity of CEERS-80374 and CEERS-80239. We use an updated catalog of F814W-dropout galaxies spanning the entire footprint of CEERS NIRCam observations, expanding from the catalog published in Endsley et al. (2023b). These dropout galaxies are selected with the same color selection as in Endsley et al. (2023b) but include the full database of CEERS imaging (whereas the earlier paper only included the first epoch). Photometric redshifts are inferred from Beagle SED fitting to the HST/ACS+JWST/NIRCam multi-band photometry. The reader is directed Endsley et al. (2023b) for more details. In total, our selection yields 269 galaxies with F200W28 mag at 6.5–8 across the 92.1 arcmin2 CEERS footprint with overlapping ACS imaging.
Our goal is to identify galaxies in this sample that are likely to be at similar redshifts as CEERS-80374 () and CEERS-80239 (). We adopt an empirically-motivated approach utilizing the F410M medium band photometry to isolate galaxies at 7.0–7.6 (see Endsley et al. 2023a for full details). In this redshift range, the [O iii]+H emission lines fall in the F410M filter, leading to red colors in F356W - F410M. By selecting dropouts in our sample that are red in F356W - F410M (), we are likely to pick out those galaxies with large EW [O iii]+H ( 400 Å). Given the [O iii]+H EW distribution in CEERS (Endsley et al., 2023b), this corresponds to 82% of the population at these redshifts. This color cut results in a sample of 54 galaxies likely to lie at 7.0–7.6 based on the F410M excesses (see Table 5). The Beagle SED fits described above indicate that the photometric redshifts of all 54 sources lie in the desired redshift range.
We show the distribution of photometric targets in Figure 9. We identify three regions (region A, B, and C) in the vicinity of CEERS-80374 and CEERS-80239 with high surface densities of 7.0–7.6 galaxies. Each of the two regions contains 9–12 photometric galaxies within a radius of 2 arcmin (0.6 projected pMpc), corresponding to a surface area of 7.5–10.9 arcmin2 with overlapping NIRCam imaging. The derived surface density (1.1–1.3 galaxies / arcmin2) is greater than the average over the full footprint. In particular, region A overlaps with CEERS-80239 and is found only 0.5 arcmin away from CEERS-80374, suggesting that one (or both) of the Ly emitters may be associated with this overdensity. The other regions (B & C) are both found 5.5 arcmin away from CEERS-80239, which could be expected if the structures extend to larger distances over the field.
In order to quantify the strength of these photometric overdensities, we compare the observed galaxy number with that predicted from the UV luminosity function and our selection efficiency. Our method to compute the expected number of galaxies () broadly follows Endsley et al. (2023a). We summarize the approach below (also see Endsley et al. 2021a; Whitler et al. 2023a). As a first step, we consider the selection efficiency imposed by both the dropout selection and the F356W - F410M color cut before estimating the predicted number of observable galaxies. We start by modeling the probability of a galaxy being selected by both criteria as a function of both redshift and magnitude using a model SED with a flat rest-UV continuum in (). At each redshift and magnitude, we add [O iii]+H emission lines with the equivalent widths randomly drawn from the Endsley et al. (2023b) distribution at , assuming a fixed [O iii]5007/H ratio = 6 (e.g., Tang et al. 2019). We compute the mock photometry in each ACS+NIRCam filter, taking into account the IGM transmission model of Inoue et al. (2014) and perturbing the photometry with the typical noise estimated from the observed values for our sample. The selection efficiency at each redshift ( = 6.5–8.0 in z = 0.02 unit spacing) and magnitude (F150W = 25.0–28.0 in 0.1 mag unit spacing) is then estimated as the fraction of 1000 realizations passing both our dropout criteria for galaxies and the F356W - F410M color cut.
We combine the selection efficiency with the redshift-dependent UV luminosity function of Bouwens et al. (2022) to derive the strength of the photometric overdensities. To compute the cosmic mean galaxy number surface density, we convolve the UV luminosity function with the selection efficiency and integrate it over 7.0–7.6 and magnitudes brighter than , the limit of our sample (also see Endsley et al. 2023b). Comparing the resulting mean surface density (0.4 galaxies / arcmin2) with what we observe in Region A, B, and C, we found the three regions correspond to overdensities at , , and , respectively. We note that our selection includes candidate galaxies over a relatively wide redshift range (–7.6). It is plausible each of the regions could be considerably more overdense if the redshifts of the candidate galaxies are more narrowly distributed around a given redshift.
The photometric data suggest that overdensities (in region A) may surround the two intense Ly emitters identified in this study. The potential overdensities in regions B and C suggest that there may be extended structures across the field at the redshifts of one or both of the Ly emitters. A single overdensity of this amplitude () over a radius of pMpc alone can create moderately-sized bubbles ( 0.8 pMpc) with nominal assumptions on source properties (see Endsley & Stark 2022; Whitler et al. 2023a). Given the presence of three such overdensities in this field, it is conceivable that collectively they create a much larger ionized region ( 1–2 pMpc) as is likely required for explaining the observed escape fractions of the Ly emitting galaxies. Given that the galaxies in this sample are selected on F356W-F410M colors that indicate strong [O iii]+H emission, it should be trivial in the future to map out rest-optical emission line redshifts (with NIRSpec or NIRCam grism) and better characterize whether the galaxies in the overdense regions are associated with the or extreme Ly emitters.
5 Discussion
The spectroscopic capabilities of JWST are ushering in a new era of investigating reionization. With rest-optical emission line redshifts now easily accessible at , it is becoming possible to fully map out the spatial distribution of galaxies in 3D across known deep fields, identifying regions that are overdense and those that are underdense. Deep Ly follow-up will in turn offer insight into which of these regions have been able to carve out large ( pMpc) ionized bubbles. In so doing, these observations provide a local view of reionization, taking a new step beyond the global reionization studies of the past two decades. In this section, we contrast observations of two overdensities with Ly measurements.
The EGS field presents one of the most interesting cases of a likely ionized region, with 16 robust Ly detections at (Oesch et al., 2015; Roberts-Borsani et al., 2016; Stark et al., 2017; Tilvi et al., 2020; Jung et al., 2022, 2023; Tang et al., 2023; Witten et al., 2023). No other deep field has proven as rich in Ly emitters, in spite of considerable observational investment. We described new Ly detections in the EGS field in §4, building the case for three associations of Ly emitters along the line of sight: at , , and . The radial distances between these associations are 7 pMpc ( and ) and 12 pMpc ( and ), comparable to the diameters of large ionized bubbles expected at (Lu et al., 2023). The new discovery of Ly with EW200 Å in these associations confirms that there is likely to be large ionized sightlines (1–2 pMpc) at in the EGS. Both photometric and spectroscopic samples are now revealing significant overdensities of galaxies in this redshift range (see §5).
These observations raise the possibility that the EGS contains an extended structure oriented radially along the line of sight over part of the region spanning to . Such filament-like structures are expected to be common topological features in the reionization era (e.g., Elbers & van de Weygaert 2019, 2023). If viewed along the line of sight, ionized filaments may create the optimal conditions for detecting Ly at , providing large ionized sightlines for galaxies throughout the structure. In particular, galaxies at the far-end of the structure can have their Ly transmission significantly boosted. For example, we find that galaxies viewed at the far side of large ( pMpc) filaments will transmit 2.4–2.9 more Ly flux than if they were situated in relatively small ( pMpc) ionized bubbles. Here we follow the procedures described in Mason & Gronke (2020), with the range dictated by our assumed distribution of Ly velocity offsets (50–200 km s-1). Clearly, radial-extended ionized filaments will amplify many Ly lines that otherwise would not be visible.
The future prospects for characterizing the ionized regions in the EGS are good. To date, the majority of existing Ly detections have come from brighter galaxies identified in HST imaging. The NIRCam photometric samples extend significantly fainter, providing much-improved statistics of the galaxy distribution. Thus far, only a very small fraction of the NIRCam samples have been followed up with spectroscopy (fewer than 6% of the galaxies reported in §4 have NIRSpec observations, and none of them have spectra required for bubble size inferences). Once a larger subset of them have rest-optical spectra, it will be possible to map the 3D spatial distribution of galaxies through the field. Such a dataset will reveal whether overdensities are peaked near the known Ly emitters (as may be expected if we are observing a series of bubbles along the line of sight) or whether the entire redshift range spanning is uniformly overdense (as may be expected if there is a single extended ionized sightline). Deep Ly spectroscopy of the NIRCam-identified galaxies will enable direct tests of these scenarios. Here the fainter magnitudes of the NIRCam database are critical. As shown in §3, Ly EWs often reach extremely large values (100 Å) in UV-faint galaxies (M). When such objects are identified at with small Ly velocity offsets (100 km s-1), it immediately points to large radial ionized sightlines (e.g., Mason & Gronke, 2020; Saxena et al., 2023b). Comprehensive high resolution Ly spectroscopy of the NIRCam-selected galaxies in Figure 9 will allow these ionized regions to be mapped across the EGS.
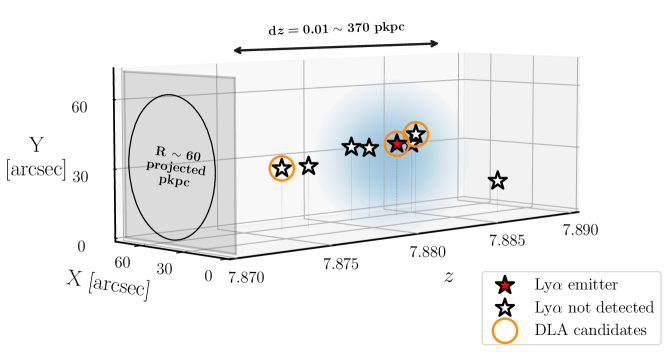
The connection between Ly visibility and galaxy overdensities is now starting to be seen in several other fields (e.g., Hu et al., 2021; Endsley et al., 2023a; Witstok et al., 2023; Witten et al., 2023). However one recently-confirmed overdensity at in the Abell 2744 field presents a conflicting picture (Morishita et al., 2023). NIRSpec observations of this field from the GLASS ERS (JWST-GO1324; Treu et al. 2022, P.I. Treu) and DDT-2756 (Roberts-Borsani et al. 2023, PI. W. Chen) programs have confirmed redshifts for 7 galaxies clustered within a small region with a projected radius of 60 physical kpc (pkpc). The density of galaxies in this small area implies a strong galaxy overdensity (), albeit over much smaller physical scales than the CEERS overdensities discussed above. Five of the seven galaxies have Ly constraints from NIRSpec. None show Ly emission, with small reported Ly EW upper limits ranging from 15.9–27.6 Å. The Ly non-detections raise the question of whether this dense region has been able to ionize its surroundings.
The UNCOVER program (GO-2561, PIs: I. Labbé & R. Bezanson; Bezanson et al. 2022) has recently obtained NIRSpec prism spectra of two of the seven spectroscopically-confirmed galaxies (GLASSz8-2 and YD4) and one of eight photometric candidates (ZD4) associated with the overdensity (Morishita et al., 2023). Following the procedures described in §2.1, we obtained reduced spectra for the three galaxies, which are shown in Figure 11. The photometric candidate ZD4 is confirmed to lie at , placing it as part of the same overdensity. In addition to strong rest-optical emission lines ([OIII]+H EW = Å), we identify an emission line feature (SNR = 5.9) at a wavelength consistent with Ly in the galaxy. We measure a relatively large Ly EW ( Å), suggesting the overdensity may indeed have carved out an ionized region. For the other two galaxies where we do not detect Ly, we obtain upper limits on the equivalent widths (EW 85 Å for GLASSz8-2 and EW 91 Å for YD4) that are consistent with the previous constraints (Morishita et al., 2023).
The UNCOVER spectra also hint at why Ly is not seen in many galaxies of the Morishita et al. (2023) overdensity. In each of the three spectra, we see evidence for damped Ly absorption (see Figure 11) that will significantly attenuate any Ly emission that is present. Strong HI absorption is perhaps not surprising given the close separations (within a projected radius of 60 pkpc) of many of the galaxies in the protocluster structure. In contrast, the EGS field presents a galaxy overdensity on much larger scales (1 pMpc), where the obscuring effect of DLAs is likely to be less common. To estimate the viability of the damped Ly interpretation for the continuua of the UNCOVER spectra, we perform a simple analysis fitting a DLA transmission profile to the spectra over the window of 1100–2000 Å in the rest frame. We compute the Ly optical depth using the cross-section approximation by Tasitsiomi (2006) and assume a continuum spectrum (prior to absorption by the damped Ly system) obtained by extrapolating the power-law fit to the observed continuum over 1400–3000 Å in the rest-frame. We perform the fit in the observed frame, convolving the model spectrum with the instrumental resolution of the prism. We fit using the H i column density, covering fraction, and peculiar velocity of the DLA, and the Ly EW (fixing a Ly FWHM of 200 km s-1) prior to attenuation by the DLA as free parameters. As this region is a dense candidate protocluster, redshifted DLA systems may arise from foreground protocluster members with line-of-sight motion towards the observed galaxies, motivating our inclusion of peculiar velocity as a free parameter. We find degeneracies between the peculiar velocity of the absorber, the HI covering fraction, and the Ly EW (prior to attenuation by the DLA). The parameters also are sensitive to different assumptions about the local ionization state of the IGM in the vicinity of the galaxies. A detailed characterization of these properties is outside the scope of the current study given these degeneracies and the resolution of the spectrum ( 4000 km s-1 per pixel). Higher resolution spectroscopy is required for a more robust view of the DLA properties.
Nevertheless, in all cases, we find large HI column densities (– cm-2)101010We note that given the prism resolution and SNR, each spectrum can be fit with a column density of cm-2. are required to reproduce the observed spectra (see Figure 11). The inferred column densities are high but similar to that inferred for other galaxies with recent NIRSpec prism observations (e.g., Heintz et al., 2023). We suggest such column densities may be more commonly seen in protocluster environments at where a large number of galaxies are closely separated. Such dense neutral H i in the local surroundings could heavily attenuate the Ly photons, contributing to the apparent lack of Ly detection in the majority (5/6) of the member galaxies associated with the Morishita et al. (2023) overdensity. We finally note that the UNCOVER spectrum of ZD4 has recently been presented in Cameron et al. (2023). They suggest nebular continuum may provide an alternative explanation to damped Ly absorption. Higher resolution data will ultimately be required to fully disentangle the relative contribution of these effects. However, the weak rest-optical emission lines in ZD4 (H EW = Å) suggest that such strong nebular emission is not likely present in this system. The ionizing photon production efficiency implied by the H detection in ZD4 (log ( / erg-1 Hz) = ) is well below that required for the nebular continuum to dominate the far-UV continuum (e.g., Topping et al., 2022b). Also, given the presence of such apparent absorption features redwards of Ly wavelength in all three galaxies observed with UNCOVER in this overdensity, we suggest that the damped Ly absorption remains a very likely explanation for ZD4 and the other two systems.
Strong galaxy overdensities that span small physical size scales (within a projected radius of 60 pkpc) are more likely to have small ionized bubbles. In particular, for the Abell 2744 overdensity at , Lu et al. (2023) demonstrated that the range of bubble sizes was likely to be pMpc (with a range between 0.2 and 1.8 Mpc), lower than that expected in the CEERS field (1.0 pMpc, with a range between 0.2–2.7 pMpc). The small bubble sizes potentially explain the weak Ly emission reported in Morishita et al. (2023). The observations here suggest an additional factor regulating Ly visibility in this region may be damped Ly absorption. This is likely to be most impactful in attempts to characterize Ly in large overdensities spanning small scales, where the close galaxy separations ( 50–390 pkpc) lead to the common presence of foreground absorbers. Efforts to characterize ionized bubbles may be best focused on regions that are overdense over larger scales ( 1 pMpc). Systematic surveys of Lyman alpha visibility as a function of galaxy overdensity will enable us to directly connect ionized regions to both their local environment and galaxy properties, paving the way for a detailed understanding of how galaxies achieved reionization.
6 Summary
We investigate Ly properties of galaxies at in JWST/NIRSpec prism spectroscopy taken as part of CEERS (Finkelstein et al., 2022, 2023) and DDT-2750 (Arrabal Haro et al., 2023a, b) observations of the EGS field. We summarize our main findings below.
-
1.
We have assembled a spectroscopic catalog of 69 galaxies at confirmed via rest-optical emission line detections in JWST prism spectroscopy. Many of the galaxies are faint continuum sources (F150W = 27–29 mag) selected in NIRCam imaging, allowing characterization of Ly output in very low mass star-forming systems. We identify likely Ly emission (SNR = 5.6–26.9) in 10 of the 69 galaxies. Given the faint continuum flux densities, the implied Ly EWs extend to very large values (ranging up to 286 Å with a median of 134 Å). These are comparable to the Ly EWs found in faint galaxies with MUSE (e.g., Hashimoto et al., 2017b; Maseda et al., 2018; Vanzella et al., 2020; Kerutt et al., 2022) and other narrowband surveys (e.g., Trainor et al., 2015; Hashimoto et al., 2017a; Harikane et al., 2018; Ning et al., 2020; Matthee et al., 2021).
-
2.
We present likely detections of Ly (SNR = 7.8 and 8.2) in two galaxies, CEERS-80374 () and CEERS-80239 (). These prism spectra were obtained in the second epoch of CEERS observations, after the first papers describing Ly spectroscopy were released (Jung et al., 2023; Tang et al., 2023). Both galaxies are very faint in the continuum (F150W = 28.7 and 28.9 mag), with the Ly detections implying extremely large Ly EWs ( Å and Å). Such intense Ly likely requires near-unity transmission through the IGM, possibly indicating the two galaxies are situated in large ionized regions, as recently found in the faint Ly emitter JADES-GS-z7-LA (Saxena et al., 2023b).
-
3.
We explore the physical properties of our sample using NIRCam SEDs and NIRSpec rest-optical prism spectroscopy. The galaxies in our sample with Ly emission tend to be dominated by extremely young stellar populations (median age = 6 Myr for constant star formation), as is common for galaxies that have undergone a recent burst of star formation. This results in very efficient ionizing photon production (median = erg-1 Hz) that translates into intense intrinsic Ly emission (median EW = 256 Å). As expected for such young systems, we see intense [O iii]+H emission (median EW = 1982 Å), well above the average for galaxies (Endsley et al., 2023a).
-
4.
We compute Ly escape fractions for our sample using flux ratios of the Ly and the Balmer emission lines (H or H) in the NIRSpec data. We find that large escape fractions are still common in the galaxy population at , with a Case B median value of = 0.28. This is well above what is common in the first spectroscopic samples (median = 0.073; Tang et al. 2023). We find two galaxies in our sample that show Ly/H ratios suggesting close-to-unity ( 80%) escape fractions of Ly. These efficient Ly leakers appear similar to the extreme Ly emitters now being found at (e.g., Saxena et al. 2023b).
-
5.
The distribution of Ly escape fractions at in our sample provides a baseline to compare against emerging samples (e.g., Tang et al., 2023; Jung et al., 2023), allowing insight into the impact of the neutral IGM on Ly. We find that % of the galaxies with large EW [O iii]+H ( 1000 Å) have moderately large (). We show that lower redshift () galaxies with similar properties show comparable Ly escape fractions. If the IGM significantly attenuates Ly emission, we expect this percentage to go down. While current statistics are limited, we find only % of the CEERS galaxies (from both Tang et al. 2023 and this work) satisfying the EW [O iii]+H selection have such large escape fractions. As JWST builds larger spectroscopic samples, it will become possible to reduce the uncertainties on such measurements, improving efforts to link measurements of the Ly escape fraction to the IGM.
-
6.
The two galaxies with likely detections of strong Ly emission are found to be located at the same redshifts as other Ly emitters in the CEERS EGS field, potentially hinting at extended ionized structures at both redshifts. We characterize the distribution of faint galaxies around both Ly emitters using NIRCam imaging. We find evidence for photometric overdensities of –7.6 galaxies (at the 3.1–3.7 level), as would be expected if there are large ionized bubbles in the field. The detection of a large number of high-EW Ly emitting galaxies combined with the presence of significant photometric overdensities also suggest the presence of long ionized sightlines that boost the Ly emission in this field. Future spectroscopic observations are required to better characterize the overdensity structures and ionized region sizes at the redshifts of these Ly emitters.
-
7.
We further investigate the dependence of Ly transmission on the local environment, considering the galaxy overdensity with 7 previously confirmed member galaxies, z7p9OD, in the Abell 2744 field. Utilizing the new UNCOVER deep NIRSpec prism observations covering this overdensity, we confirm one more photometrically selected member to be associated with the overdensity, which is also the only source detected in Ly (with EW = Å) in this region. We also identify damped Ly absorption in all three member galaxies with deep UNCOVER spectra, suggesting the presence of high column density H i in the local surroundings of the overdensity. Such H i gas may obscure much of the Ly photons from the member galaxy, leading to the low fraction (1/6) of Ly detection in this overdensity. JWST NIRSpec observations mapping a larger sample of overdensities will be required to statistically investigate how Ly visibility may be affected by overdense environments spanning different physical scales.
[t] ID RA Dec. EW Ly Separation from Separation from Ref.a (deg) (deg) (mag) (Å) CEERS-80239 (′) CEERS-80374 (′) Spectroscopically confirmed galaxies near CEERS-80239 DDT-434 214.8980100 52.8929639 – 1.39 – This work DDT-449 214.9404890 52.9325555 4.09 – This work CEERS-689 214.9990525 52.9419778 5.71 – T23, N23 CEERS-1163 214.9904679 52.9719889 – 7.02 – T23, N23 CEERS-80445 214.8431150 52.7478861 – 7.57 – This work, N23 CEERS-80432 214.8120558 52.7467472 7.99 – This work, N23 CEERS-698 215.0503167 53.0074417 9.96 – RB16, S17, T23, N23, S23 Spectroscopically confirmed galaxies near CEERS-80374 CEERS-534 214.8591171 52.8536389 – 2.23 This work CEERS-498 214.8130450 52.8342500 – 3.13 T23 CEERS-499 214.8130042 52.8341694 – – 3.13 T23 CEERS-1038 215.0396971 52.9015972 – – 6.89 T23, N23 CEERS-44 215.0011150 53.0112694 – 11.79 T23, N23
[t] ID RA Dec. F356W - F410M Separation from Separation from Ref.a (deg) (deg) (mag) (mag) CEERS-80239 (′) CEERS-80374 (′) z7_F410M_ 1 214.8936194 52.8740006 0.26 2.95 This work z7_F410M_ 2 214.8939244 52.8745818 0.29 2.99 This work z7_F410M_ 3 214.8925124 52.8806457 0.66 3.35 This work z7_F410M_ 4 214.9102765 52.8600728 0.78 2.16 This work z7_F410M_ 5 214.8615723 52.8760338 1.30 3.34 E23 z7_F410M_ 6 214.8615875 52.8761597 1.30 3.35 E23 z7_F410M_ 7 214.8591919 52.8535843 1.65 2.22 E23 z7_F410M_ 8 214.9110902 52.8973152 1.74 4.37 This work z7_F410M_ 9 214.9431503 52.8785455 1.78 3.61 This work z7_F410M_10 214.8425293 52.8711929 1.94 3.43 E23 z7_F410M_11 214.8784485 52.8384552 1.99 1.08 E23 z7_F410M_12 214.8369751 52.8670006 2.15 3.36 E23 z7_F410M_13 214.8253632 52.8630600 2.59 3.49 E23 z7_F410M_14 214.8309479 52.8482819 2.69 2.81 E23 z7_F410M_15 214.9783644 52.8773967 3.01 4.29 This work z7_F410M_16 214.8333282 52.8275871 3.41 2.35 E23 z7_F410M_17 214.9885098 52.8918060 3.60 5.18 This work z7_F410M_18 214.7931213 52.8701210 3.73 4.67 E23 z7_F410M_19 214.8370667 52.8188782 3.73 2.24 E23 z7_F410M_20 214.9987301 52.8553770 3.82 4.08 This work z7_F410M_21 214.8526001 52.8114624 3.84 1.84 E23 z7_F410M_22 214.9415894 52.9291191 3.92 6.45 E23 z7_F410M_23 215.0030565 52.8856697 3.99 5.27 This work z7_F410M_24 214.7939301 52.8415337 4.07 3.90 E23 z7_F410M_25 214.8471985 52.8083382 4.09 2.10 E23 z7_F410M_26 215.0122205 52.8777771 4.23 5.21 This work z7_F410M_27 214.9098511 52.9425430 4.39 7.07 E23 z7_F410M_28 214.9110565 52.9425240 4.39 7.07 E23 z7_F410M_29 214.9977908 52.9139550 4.53 6.45 This work z7_F410M_30 214.9554901 52.9470100 5.10 7.62 E23 z7_F410M_31 214.9183197 52.9547272 5.16 7.82 E23 z7_F410M_32 215.0395352 52.8910261 5.35 6.48 This work z7_F410M_33 215.0371798 52.9067190 5.57 7.03 This work z7_F410M_34 214.8065082 52.7927667 5.65 3.84 This work z7_F410M_35 215.0316755 52.9218393 5.82 7.57 This work z7_F410M_36 214.7973715 52.7888976 6.03 4.24 This work z7_F410M_37 214.9827271 52.9560814 6.05 8.45 E23 z7_F410M_38 214.9830170 52.9560051 6.05 8.45 E23 z7_F410M_39 214.9672394 52.9636269 6.19 8.69 E23 z7_F410M_40 214.9854889 52.9587479 6.24 8.63 E23 z7_F410M_41 215.0758595 52.9055814 6.85 8.06 This work z7_F410M_42 215.0740322 52.9090114 6.86 8.13 This work z7_F410M_43 215.0699407 52.9287066 7.22 8.81 This work z7_F410M_44 215.0671249 52.9381049 7.42 9.14 This work z7_F410M_45 215.0115204 52.9743690 7.53 9.86 E23 z7_F410M_46 214.8120564 52.7467451 7.99 5.63 This work z7_F410M_47 215.0778539 52.9501237 8.15 9.94 This work z7_F410M_48 215.0254059 53.0029793 9.26 11.64 E23 z7_F410M_49 215.0011139 53.0112724 9.30 11.79 E23 z7_F410M_50 215.1298690 52.9499481 9.73 11.26 This work z7_F410M_51 214.7071113 52.7425158 10.26 8.51 This work z7_F410M_52 215.1196409 52.9828335 10.55 12.41 This work z7_F410M_53 215.1401974 52.9865438 11.27 13.07 This work z7_F410M_54 215.1500154 52.9846551 11.48 13.23 This work
-
a
References: E23 – Endsley et al. (2023b)
Acknowledgements
The authors thank Jacopo Chevallard for the use of the Beagle tool used for much of our SED fitting analysis, Gabe Brammer for providing the optical imaging of the EGS as part of CHArGE program, John Chisholm for providing data of LzLCS sample, and Ting-Yi Lu for helpful discussion on ionized bubbles. This work is based in part on observations made with the NASA/ESA/CSA JWST. The data were obtained from the Mikulski Archive for Space Telescopes at the Space Telescope Science Institute, which is operated by the Association of Universities for Research in Astronomy, Inc., under NASA contract NAS 5-03127 for JWST. These observations are associated with programs #ERS-1345 (CEERS), DDT-2750, and GO-2561 (UNCOVER). The authors acknowledge the CEERS, DDT-2750, and UNCOVER teams led by Steven L. Finkelstein, Pablo Arrabal Haro, and I. Labbé & R. Bezanson for developing their observing program with a zero-exclusive-access period.
DPS acknowledges support from the National Science Foundation through the grant AST-2109066. CM acknowledges support by the VILLUM FONDEN under grant 37459 and the Carlsberg Foundation under grant CF22-1322. The Cosmic Dawn Center (DAWN) is funded by the Danish National Research Foundation under grant DNRF140. LW acknowledges support from the National Science Foundation Graduate Research Fellowship under Grant No. DGE-2137419. M. Tang acknowledges funding from the JWST Arizona/Steward Postdoc in Early galaxies and Reionization (JASPER) Scholar contract at the University of Arizona. This material is based in part upon High Performance Computing (HPC) resources supported by the University of Arizona TRIF, UITS, and Research, Innovation, and Impact (RII) and maintained by the UArizona Research Technologies department.
This work made use of Astropy:111111http://www.astropy.org a community-developed core Python package and an ecosystem of tools and resources for astronomy (Astropy Collaboration et al., 2013, 2018, 2022); Beagle (Chevallard & Charlot, 2016); Emcee (Foreman-Mackey et al., 2013); Jupyter (Kluyver et al., 2016); Matplotlib (Hunter, 2007); Numpy (Harris et al., 2020); Photutils, an Astropy package for detection and photometry of astronomical sources (Bradley et al., 2022); Scikit-image (van der Walt et al., 2014); Scipy (Virtanen et al., 2020); and Sedpy (Johnson, 2021).
Data Availability
The JWST and HST imaging data used in this work are available through the MAST Portal (https://mast.stsci.edu/portal/Mashup/Clients/Mast/Portal.html). The data product and analysis code used in this work will be shared upon reasonable request to the corresponding author.
References
- Arrabal Haro et al. (2023a) Arrabal Haro P., et al., 2023a, Nature, 622, 707
- Arrabal Haro et al. (2023b) Arrabal Haro P., et al., 2023b, ApJ, 951, L22
- Astropy Collaboration et al. (2013) Astropy Collaboration et al., 2013, A&A, 558, A33
- Astropy Collaboration et al. (2018) Astropy Collaboration et al., 2018, AJ, 156, 123
- Astropy Collaboration et al. (2022) Astropy Collaboration et al., 2022, apj, 935, 167
- Bacon et al. (2017) Bacon R., et al., 2017, A&A, 608, A1
- Bacon et al. (2023) Bacon R., et al., 2023, A&A, 670, A4
- Bagley et al. (2023) Bagley M. B., et al., 2023, ApJ, 946, L12
- Barkana & Loeb (2004) Barkana R., Loeb A., 2004, ApJ, 609, 474
- Begley et al. (2023) Begley R., Cullen F., McLure R. J., Shapley A. E., Dunlop J. S., Carnall A. C., McLeod D. J., Donnan C. T., 2023, MNRAS,
- Bezanson et al. (2022) Bezanson R., et al., 2022, arXiv e-prints, p. arXiv:2212.04026
- Böker et al. (2023) Böker T., et al., 2023, PASP, 135, 038001
- Bolan et al. (2022) Bolan P., et al., 2022, MNRAS, 517, 3263
- Bouwens et al. (2010) Bouwens R. J., et al., 2010, ApJ, 708, L69
- Bouwens et al. (2022) Bouwens R. J., Illingworth G., Ellis R. S., Oesch P., Stefanon M., 2022, ApJ, 940, 55
- Boyett et al. (2022) Boyett K. N. K., Stark D. P., Bunker A. J., Tang M., Maseda M. V., 2022, MNRAS, 513, 4451
- Bradley et al. (2022) Bradley L., et al., 2022, astropy/photutils: 1.5.0, doi:10.5281/zenodo.6825092, https://doi.org/10.5281/zenodo.6825092
- Brammer et al. (2022) Brammer G., Strait V., Matharu J., Momcheva I., 2022, grizli, Zenodo, doi:10.5281/zenodo.6672538
- Bruzual & Charlot (2003) Bruzual G., Charlot S., 2003, MNRAS, 344, 1000
- Bunker et al. (2023) Bunker A. J., et al., 2023, A&A, 677, A88
- Calzetti et al. (2000) Calzetti D., Armus L., Bohlin R. C., Kinney A. L., Koornneef J., Storchi-Bergmann T., 2000, ApJ, 533, 682
- Cameron et al. (2023) Cameron A. J., Katzm H., Witten C., Saxena A., Laporte N., Bunker A. J., 2023, arXiv e-prints, p. arXiv:2311.02051
- Caruana et al. (2014) Caruana J., Bunker A. J., Wilkins S. M., Stanway E. R., Lorenzoni S., Jarvis M. J., Ebert H., 2014, MNRAS, 443, 2831
- Cassata et al. (2015) Cassata P., et al., 2015, A&A, 573, A24
- Cassata et al. (2020) Cassata P., et al., 2020, A&A, 643, A6
- Chabrier (2003) Chabrier G., 2003, PASP, 115, 763
- Charlot & Longhetti (2001) Charlot S., Longhetti M., 2001, MNRAS, 323, 887
- Chevallard & Charlot (2016) Chevallard J., Charlot S., 2016, MNRAS, 462, 1415
- Chevallard et al. (2018) Chevallard J., et al., 2018, MNRAS, 479, 3264
- Chisholm et al. (2022) Chisholm J., et al., 2022, MNRAS, 517, 5104
- Cooper et al. (2023) Cooper O. R., et al., 2023, arXiv e-prints, p. arXiv:2309.06656
- Cowie et al. (2011) Cowie L. L., Barger A. J., Hu E. M., 2011, ApJ, 738, 136
- Cullen et al. (2023) Cullen F., et al., 2023, MNRAS, 520, 14
- Curti et al. (2023) Curti M., et al., 2023, arXiv e-prints, p. arXiv:2304.08516
- Curtis-Lake et al. (2012) Curtis-Lake E., et al., 2012, MNRAS, 422, 1425
- Davies et al. (2018) Davies F. B., et al., 2018, ApJ, 864, 142
- Dayal & Ferrara (2018) Dayal P., Ferrara A., 2018, Phys. Rep., 780, 1
- De Barros et al. (2017) De Barros S., et al., 2017, A&A, 608, A123
- Dijkstra (2014) Dijkstra M., 2014, Publ. Astron. Soc. Australia, 31, e040
- Dijkstra et al. (2016) Dijkstra M., Gronke M., Venkatesan A., 2016, ApJ, 828, 71
- Draine (2011) Draine B. T., 2011, Physics of the Interstellar and Intergalactic Medium
- Du et al. (2020) Du X., Shapley A. E., Tang M., Stark D. P., Martin C. L., Mobasher B., Topping M. W., Chevallard J., 2020, ApJ, 890, 65
- Elbers & van de Weygaert (2019) Elbers W., van de Weygaert R., 2019, MNRAS, 486, 1523
- Elbers & van de Weygaert (2023) Elbers W., van de Weygaert R., 2023, MNRAS, 520, 2709
- Endsley & Stark (2022) Endsley R., Stark D. P., 2022, MNRAS, 511, 6042
- Endsley et al. (2021a) Endsley R., Stark D. P., Chevallard J., Charlot S., 2021a, MNRAS, 500, 5229
- Endsley et al. (2021b) Endsley R., Stark D. P., Charlot S., Chevallard J., Robertson B., Bouwens R. J., Stefanon M., 2021b, MNRAS, 502, 6044
- Endsley et al. (2023a) Endsley R., et al., 2023a, arXiv e-prints, p. arXiv:2306.05295
- Endsley et al. (2023b) Endsley R., Stark D. P., Whitler L., Topping M. W., Chen Z., Plat A., Chisholm J., Charlot S., 2023b, MNRAS, 524, 2312
- Erb et al. (2014) Erb D. K., et al., 2014, ApJ, 795, 33
- Fan et al. (2006) Fan X., et al., 2006, AJ, 132, 117
- Fan et al. (2023) Fan X., Bañados E., Simcoe R. A., 2023, ARA&A, 61, 373
- Ferland et al. (2013) Ferland G. J., et al., 2013, Rev. Mex. Astron. Astrofis., 49, 137
- Ferruit et al. (2022) Ferruit P., et al., 2022, A&A, 661, A81
- Finkelstein et al. (2019) Finkelstein S. L., et al., 2019, ApJ, 879, 36
- Finkelstein et al. (2022) Finkelstein S. L., et al., 2022, ApJ, 940, L55
- Finkelstein et al. (2023) Finkelstein S. L., et al., 2023, ApJ, 946, L13
- Flury et al. (2022a) Flury S. R., et al., 2022a, ApJS, 260, 1
- Flury et al. (2022b) Flury S. R., et al., 2022b, ApJ, 930, 126
- Foreman-Mackey et al. (2013) Foreman-Mackey D., Hogg D. W., Lang D., Goodman J., 2013, PASP, 125, 306
- Förster Schreiber et al. (2009) Förster Schreiber N. M., et al., 2009, ApJ, 706, 1364
- Fujimoto et al. (2023) Fujimoto S., et al., 2023, ApJ, 949, L25
- Furlanetto et al. (2004) Furlanetto S. R., Zaldarriaga M., Hernquist L., 2004, ApJ, 613, 1
- Furtak et al. (2023) Furtak L. J., Shuntov M., Atek H., Zitrin A., Richard J., Lehnert M. D., Chevallard J., 2023, MNRAS, 519, 3064
- Gazagnes et al. (2020) Gazagnes S., Chisholm J., Schaerer D., Verhamme A., Izotov Y., 2020, A&A, 639, A85
- Goulding et al. (2023) Goulding A. D., et al., 2023, ApJ, 955, L24
- Greig et al. (2017) Greig B., Mesinger A., Haiman Z., Simcoe R. A., 2017, MNRAS, 466, 4239
- Gutkin et al. (2016) Gutkin J., Charlot S., Bruzual G., 2016, MNRAS, 462, 1757
- Harikane et al. (2018) Harikane Y., et al., 2018, ApJ, 859, 84
- Harikane et al. (2023a) Harikane Y., et al., 2023a, arXiv e-prints, p. arXiv:2303.11946
- Harikane et al. (2023b) Harikane Y., Nakajima K., Ouchi M., Umeda H., Isobe Y., Ono Y., Xu Y., Zhang Y., 2023b, arXiv e-prints, p. arXiv:2304.06658
- Harris et al. (2020) Harris C. R., et al., 2020, Nature, 585, 357
- Hashimoto et al. (2017a) Hashimoto T., et al., 2017a, MNRAS, 465, 1543
- Hashimoto et al. (2017b) Hashimoto T., et al., 2017b, A&A, 608, A10
- Hayes et al. (2011) Hayes M., Schaerer D., Östlin G., Mas-Hesse J. M., Atek H., Kunth D., 2011, ApJ, 730, 8
- Heckman et al. (2001) Heckman T. M., Sembach K. R., Meurer G. R., Leitherer C., Calzetti D., Martin C. L., 2001, ApJ, 558, 56
- Heckman et al. (2011) Heckman T. M., et al., 2011, ApJ, 730, 5
- Heintz et al. (2023) Heintz K. E., et al., 2023, arXiv e-prints, p. arXiv:2306.00647
- Henry et al. (2015) Henry A., Scarlata C., Martin C. L., Erb D., 2015, ApJ, 809, 19
- Hoag et al. (2019) Hoag A., et al., 2019, ApJ, 878, 12
- Hu et al. (2021) Hu W., et al., 2021, Nature Astronomy, 5, 485
- Hunter (2007) Hunter J. D., 2007, Computing in Science & Engineering, 9, 90
- Iliev et al. (2006) Iliev I. T., Mellema G., Pen U. L., Merz H., Shapiro P. R., Alvarez M. A., 2006, MNRAS, 369, 1625
- Inoue et al. (2014) Inoue A. K., Shimizu I., Iwata I., Tanaka M., 2014, MNRAS, 442, 1805
- Izotov et al. (2016) Izotov Y. I., Schaerer D., Thuan T. X., Worseck G., Guseva N. G., Orlitová I., Verhamme A., 2016, MNRAS, 461, 3683
- Izotov et al. (2018a) Izotov Y. I., Schaerer D., Worseck G., Guseva N. G., Thuan T. X., Verhamme A., Orlitová I., Fricke K. J., 2018a, MNRAS, 474, 4514
- Izotov et al. (2018b) Izotov Y. I., Worseck G., Schaerer D., Guseva N. G., Thuan T. X., Fricke Verhamme A., Orlitová I., 2018b, MNRAS, 478, 4851
- Izotov et al. (2020) Izotov Y. I., Schaerer D., Worseck G., Verhamme A., Guseva N. G., Thuan T. X., Orlitová I., Fricke K. J., 2020, MNRAS, 491, 468
- Jakobsen et al. (2022) Jakobsen P., et al., 2022, A&A, 661, A80
- Jiang et al. (2022) Jiang L., et al., 2022, Nature Astronomy, 6, 850
- Jin et al. (2023) Jin X., et al., 2023, ApJ, 942, 59
- Johnson (2021) Johnson B. D., 2021, bd-j/sedpy: sedpy v0.2.0, Zenodo, doi:10.5281/zenodo.4582723
- Jones et al. (2023) Jones G. C., et al., 2023, arXiv e-prints, p. arXiv:2306.02471
- Jung et al. (2020) Jung I., et al., 2020, ApJ, 904, 144
- Jung et al. (2022) Jung I., et al., 2022, arXiv e-prints, p. arXiv:2212.09850
- Jung et al. (2023) Jung I., et al., 2023, arXiv e-prints, p. arXiv:2304.05385
- Kerutt et al. (2022) Kerutt J., et al., 2022, A&A, 659, A183
- Kim et al. (2023) Kim K. J., et al., 2023, ApJ, 955, L17
- Kluyver et al. (2016) Kluyver T., et al., 2016, in , IOS Press. pp 87–90, doi:10.3233/978-1-61499-649-1-87
- Kocevski et al. (2023) Kocevski D. D., et al., 2023, ApJ, 954, L4
- Kokorev et al. (2022) Kokorev V., et al., 2022, ApJS, 263, 38
- Kron (1980) Kron R. G., 1980, ApJS, 43, 305
- Kulkarni et al. (2019) Kulkarni G., Worseck G., Hennawi J. F., 2019, MNRAS, 488, 1035
- Larson et al. (2022) Larson R. L., et al., 2022, ApJ, 930, 104
- Larson et al. (2023) Larson R. L., et al., 2023, ApJ, 953, L29
- Leclercq et al. (2017) Leclercq F., et al., 2017, A&A, 608, A8
- Lu et al. (2023) Lu T.-Y., Mason C., Hutter A., Mesinger A., Qin Y., Stark D. P., Endsley R., 2023, arXiv e-prints, p. arXiv:2304.11192
- Luridiana et al. (2015) Luridiana V., Morisset C., Shaw R. A., 2015, A&A, 573, A42
- Malhotra & Rhoads (2002) Malhotra S., Rhoads J. E., 2002, ApJ, 565, L71
- Mary et al. (2020) Mary D., Bacon R., Conseil S., Piqueras L., Schutz A., 2020, A&A, 635, A194
- Maseda et al. (2018) Maseda M. V., et al., 2018, ApJ, 865, L1
- Maseda et al. (2023) Maseda M. V., et al., 2023, ApJ, 956, 11
- Mason & Gronke (2020) Mason C. A., Gronke M., 2020, MNRAS, 499, 1395
- Mason et al. (2018a) Mason C. A., Treu T., Dijkstra M., Mesinger A., Trenti M., Pentericci L., de Barros S., Vanzella E., 2018a, ApJ, 856, 2
- Mason et al. (2018b) Mason C. A., et al., 2018b, ApJ, 857, L11
- Mason et al. (2019) Mason C. A., et al., 2019, MNRAS, 485, 3947
- Matsuoka et al. (2018) Matsuoka Y., et al., 2018, ApJ, 869, 150
- Matthee et al. (2021) Matthee J., et al., 2021, MNRAS, 505, 1382
- McGreer et al. (2015) McGreer I. D., Mesinger A., D’Odorico V., 2015, MNRAS, 447, 499
- Mesinger et al. (2015) Mesinger A., Aykutalp A., Vanzella E., Pentericci L., Ferrara A., Dijkstra M., 2015, MNRAS, 446, 566
- Morishita et al. (2023) Morishita T., et al., 2023, ApJ, 947, L24
- Naidu et al. (2020) Naidu R. P., Tacchella S., Mason C. A., Bose S., Oesch P. A., Conroy C., 2020, ApJ, 892, 109
- Naidu et al. (2022) Naidu R. P., et al., 2022, MNRAS, 510, 4582
- Nakajima et al. (2012) Nakajima K., et al., 2012, ApJ, 745, 12
- Nakajima et al. (2013) Nakajima K., Ouchi M., Shimasaku K., Hashimoto T., Ono Y., Lee J. C., 2013, ApJ, 769, 3
- Nakajima et al. (2018) Nakajima K., Fletcher T., Ellis R. S., Robertson B. E., Iwata I., 2018, MNRAS, 477, 2098
- Nakajima et al. (2023) Nakajima K., Ouchi M., Isobe Y., Harikane Y., Zhang Y., Ono Y., Umeda H., Oguri M., 2023, ApJS, 269, 33
- Ning et al. (2020) Ning Y., et al., 2020, ApJ, 903, 4
- Oesch et al. (2015) Oesch P. A., et al., 2015, ApJ, 804, L30
- Oke & Gunn (1983) Oke J. B., Gunn J. E., 1983, ApJ, 266, 713
- Ono et al. (2012) Ono Y., et al., 2012, ApJ, 744, 83
- Osterbrock & Ferland (2006) Osterbrock D. E., Ferland G. J., 2006, Astrophysics of gaseous nebulae and active galactic nuclei
- Ouchi et al. (2020) Ouchi M., Ono Y., Shibuya T., 2020, ARA&A, 58, 617
- Pahl et al. (2021) Pahl A. J., Shapley A., Steidel C. C., Chen Y., Reddy N. A., 2021, MNRAS, 505, 2447
- Pei (1992) Pei Y. C., 1992, ApJ, 395, 130
- Pentericci et al. (2014) Pentericci L., et al., 2014, ApJ, 793, 113
- Pentericci et al. (2018) Pentericci L., et al., 2018, A&A, 619, A147
- Planck Collaboration et al. (2016) Planck Collaboration et al., 2016, A&A, 596, A108
- Planck Collaboration et al. (2020) Planck Collaboration et al., 2020, A&A, 641, A6
- Price et al. (2014) Price S. H., et al., 2014, ApJ, 788, 86
- Prieto-Lyon et al. (2023) Prieto-Lyon G., et al., 2023, ApJ, 956, 136
- Qin et al. (2021) Qin Y., Mesinger A., Bosman S. E. I., Viel M., 2021, MNRAS, 506, 2390
- Raiter et al. (2010) Raiter A., Schaerer D., Fosbury R. A. E., 2010, A&A, 523, A64
- Reddy et al. (2015) Reddy N. A., et al., 2015, ApJ, 806, 259
- Reddy et al. (2016) Reddy N. A., Steidel C. C., Pettini M., Bogosavljević M., Shapley A. E., 2016, ApJ, 828, 108
- Reddy et al. (2020) Reddy N. A., et al., 2020, ApJ, 902, 123
- Roberts-Borsani et al. (2016) Roberts-Borsani G. W., et al., 2016, ApJ, 823, 143
- Roberts-Borsani et al. (2023) Roberts-Borsani G., et al., 2023, Nature, 618, 480
- Robertson (2022) Robertson B. E., 2022, ARA&A, 60, 121
- Robertson et al. (2015) Robertson B. E., Ellis R. S., Furlanetto S. R., Dunlop J. S., 2015, ApJ, 802, L19
- Roy et al. (2023) Roy N., et al., 2023, ApJ, 952, L14
- Sanders et al. (2023a) Sanders R. L., Shapley A. E., Topping M. W., Reddy N. A., Brammer G. B., 2023a, arXiv e-prints, p. arXiv:2303.08149
- Sanders et al. (2023b) Sanders R. L., Shapley A. E., Topping M. W., Reddy N. A., Brammer G. B., 2023b, ApJ, 955, 54
- Saxena et al. (2023a) Saxena A., et al., 2023a, arXiv e-prints, p. arXiv:2306.04536
- Saxena et al. (2023b) Saxena A., et al., 2023b, A&A, 678, A68
- Schenker et al. (2014) Schenker M. A., Ellis R. S., Konidaris N. P., Stark D. P., 2014, ApJ, 795, 20
- Shivaei et al. (2020) Shivaei I., et al., 2020, ApJ, 899, 117
- Stanway et al. (2016) Stanway E. R., Eldridge J. J., Becker G. D., 2016, MNRAS, 456, 485
- Stark (2016) Stark D. P., 2016, ARA&A, 54, 761
- Stark et al. (2010) Stark D. P., Ellis R. S., Chiu K., Ouchi M., Bunker A., 2010, MNRAS, 408, 1628
- Stark et al. (2011) Stark D. P., Ellis R. S., Ouchi M., 2011, ApJ, 728, L2
- Stark et al. (2017) Stark D. P., et al., 2017, MNRAS, 464, 469
- Storey & Hummer (1995) Storey P. J., Hummer D. G., 1995, MNRAS, 272, 41
- Tacchella et al. (2023) Tacchella S., et al., 2023, MNRAS, 522, 6236
- Tang et al. (2019) Tang M., Stark D. P., Chevallard J., Charlot S., 2019, MNRAS, 489, 2572
- Tang et al. (2021) Tang M., Stark D. P., Chevallard J., Charlot S., Endsley R., Congiu E., 2021, MNRAS, 503, 4105
- Tang et al. (2023) Tang M., et al., 2023, MNRAS, 526, 1657
- Tasitsiomi (2006) Tasitsiomi A., 2006, ApJ, 645, 792
- Tilvi et al. (2014) Tilvi V., et al., 2014, ApJ, 794, 5
- Tilvi et al. (2020) Tilvi V., et al., 2020, ApJ, 891, L10
- Topping et al. (2022a) Topping M. W., et al., 2022a, MNRAS, 516, 975
- Topping et al. (2022b) Topping M. W., Stark D. P., Endsley R., Plat A., Whitler L., Chen Z., Charlot S., 2022b, ApJ, 941, 153
- Topping et al. (2023) Topping M. W., et al., 2023, arXiv e-prints, p. arXiv:2307.08835
- Torralba-Torregrosa et al. (2023) Torralba-Torregrosa A., et al., 2023, arXiv e-prints, p. arXiv:2307.10215
- Trainor et al. (2015) Trainor R. F., Steidel C. C., Strom A. L., Rudie G. C., 2015, ApJ, 809, 89
- Treu et al. (2013) Treu T., Schmidt K. B., Trenti M., Bradley L. D., Stiavelli M., 2013, ApJ, 775, L29
- Treu et al. (2022) Treu T., et al., 2022, ApJ, 935, 110
- Vanzella et al. (2020) Vanzella E., et al., 2020, MNRAS, 494, L81
- Verhamme et al. (2017) Verhamme A., Orlitová I., Schaerer D., Izotov Y., Worseck G., Thuan T. X., Guseva N., 2017, A&A, 597, A13
- Virtanen et al. (2020) Virtanen P., et al., 2020, Nature Methods, 17, 261
- Wang et al. (2020) Wang F., et al., 2020, ApJ, 896, 23
- Wang et al. (2023) Wang B., et al., 2023, ApJ, 957, L34
- Weinberger et al. (2018) Weinberger L. H., Kulkarni G., Haehnelt M. G., Choudhury T. R., Puchwein E., 2018, MNRAS, 479, 2564
- Whitler et al. (2020) Whitler L. R., Mason C. A., Ren K., Dijkstra M., Mesinger A., Pentericci L., Trenti M., Treu T., 2020, MNRAS, 495, 3602
- Whitler et al. (2023a) Whitler L., Stark D. P., Endsley R., Chen Z., Mason C., Topping M. W., Charlot S., 2023a, arXiv e-prints, p. arXiv:2305.16670
- Whitler et al. (2023b) Whitler L., Endsley R., Stark D. P., Topping M., Chen Z., Charlot S., 2023b, MNRAS, 519, 157
- Whitler et al. (2023c) Whitler L., Stark D. P., Endsley R., Leja J., Charlot S., Chevallard J., 2023c, MNRAS, 519, 5859
- Wisotzki et al. (2016) Wisotzki L., et al., 2016, A&A, 587, A98
- Witstok et al. (2023) Witstok J., et al., 2023, arXiv e-prints, p. arXiv:2306.04627
- Witten et al. (2023) Witten C., et al., 2023, arXiv e-prints, p. arXiv:2303.16225
- Wuyts et al. (2011) Wuyts S., et al., 2011, ApJ, 738, 106
- Wyithe & Loeb (2005) Wyithe J. S. B., Loeb A., 2005, ApJ, 625, 1
- Yamanaka et al. (2020) Yamanaka S., et al., 2020, MNRAS, 498, 3095
- Yang et al. (2017) Yang H., et al., 2017, ApJ, 844, 171
- Yang et al. (2020a) Yang J., et al., 2020a, ApJ, 897, L14
- Yang et al. (2020b) Yang J., et al., 2020b, ApJ, 904, 26
- Zackrisson et al. (2017) Zackrisson E., et al., 2017, ApJ, 836, 78
- Zheng et al. (2017) Zheng Z.-Y., et al., 2017, ApJ, 842, L22
- Zhu et al. (2022) Zhu Y., et al., 2022, ApJ, 932, 76
- Zitrin et al. (2015) Zitrin A., et al., 2015, ApJ, 810, L12
- van der Walt et al. (2014) van der Walt S., et al., 2014, PeerJ, 2, e453