A Spatially resolved X-ray Polarization map of the Vela Pulsar Wind Nebula
Abstract
In this paper, we present a full spatially resolved polarization map for the Vela Pulsar Wind Nebula (PWN) observed by IXPE. By employing effective background discrimination techniques, our results show a remarkably high degree of local polarization in the outskirt region, exceeding () with a probability of 95 (), which approaches the upper limit predicted by the synchrotron emission mechanism. The high degree of polarization suggests that the turbulent magnetic energy is at most 33% of the ordered one. In addition, the X-ray polarization map exhibits a toroidal magnetic field pattern that is consistent with the field revealed by radio observations across the entire nebula. This consistency reveals that the observed X-ray and radio emissions are radiated by electrons from the same magnetic field. Different from the Crab PWN, the consistency observed in the Vela PWN may be attributed to the interaction between the reverse shock of supernova blast wave and the PWN, which leads to a displacement between the synchrotron-cooled nebula and the fresh nebula close to the pulsar. These findings deepen our understanding of the structure and evolution of the Vela PWN, and the magnetohydrodynamic interaction in PWNe.
1 Introduction
A Pulsar Wind Nebula (PWN) is an intriguing astrophysical phenomenon that provides the unique environment for studying the interaction processes between the magnetized pulsar wind and the surrounding materials. The Vela PWN, located at a distance of 290 pc (Dodson et al., 2003a), is one of the best objects for investigating the interplay between the PWN and the reverse shock from the supernova explosion. The nebula is powered by the Vela pulsar (also known as PSR B0833-45) with an age of 11.4 kyr (Caraveo et al., 2001), and resides in the north of the extended radio structure Vela X. The Vela X is considered as a PWN relic, and the offset between the pulsar and the Vela X’s center is thought to result from the interaction between the nebula and the asymmetric reverse shock from supernova blast-wave (Blondin et al., 2001; Slane et al., 2018).
Multi-wavelength observations have been employed to comprehensively study and characterize the Vela PWN. The Chandra X-ray Observatory has provided detailed information into the innermost features (see the left panel of Fig. 1), revealing the presence of two prominent arcs and a jet toward the north-western direction within a radius of centered on the Vela pulsar (Helfand et al., 2001). A deeper observation shows a soft emission shell encompassing the arc-jet structure, and a faint, diffuse emission structure that extends towards the south-western region with a scale of several arc minutes (Kargaltsev & Pavlov, 2004). Observations in the radio band, at 5 GHz, display an extended image with two distinctive and asymmetric lobes (see the middle panel of Fig. 1). These lobes are located in the northeast and southwest of the center pulsar, with a diameter exceeding (Dodson et al., 2003b). However, the radio nebula does not show significant features resembling the X-ray arc-jet structure observed in the central region. Instead, it primarily overlaps with the dim diffuse X-ray emission observed in the southwest region. Despite the significant differences in multi-wavelength images, the south-west region exhibits notably nebular emissions in both X-ray and radio bands. Thus, the presence of the south-western nebula could provide some insights into the multi-wavelength observations of Vela PWN.
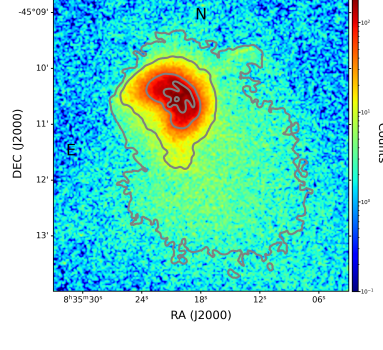
Magnetic field plays a crucial role in the evolution of PWNe, which could be investigated through a polarization study. Dodson et al. (2003b) showed the polarization map of the radio nebula, and a high polarization degree (PD) of 60% was found. The observation revealed a large-scale toroidal magnetic field with a symmetry axis aligned with the direction of the jet axis and the pulsar proper motion. Recently, Xie et al. (2022) reported a remarkably high X-ray PD in the central region (the white square region in the right panel of Fig. 1), using the Imaging X-ray Polarimeter Explorer (IXPE) (Weisskopf et al., 2022; Soffitta et al., 2021). It is found that the X-ray PD approached the upper limit permitted by the synchrotron emission mechanism, suggesting a highly ordered magnetic field near the particle acceleration site. In addition, the polarization angle (PA) of the X-ray shows a good agreement with that of the radio in the central region, despite their distinct shape.
The X-ray polarization study provides new information for understanding the formation and evolution of the Vela PWN. In this paper, we present a full X-ray polarization study for the entire Vela PWN. We extend the findings presented in Xie et al. (2022) by analysing the polarization characteristics observed in the south-western diffuse emission region, estimating the upper limit of the magnetic field strength ratio between the random and the ordered magnetic field, and conducting a comprehensive comparison between the X-ray and radio polarization pattern.
2 Observation and Data Reduction
2.1 X-ray Polarization Data
IXPE, a SMall EXplorers (SMEX) Mission funded by NASA and the Agenzia Spaziale Italiana (ASI), was launched on 9th December 2021 (Weisskopf et al., 2022). It is the first spatially resolved observatory fully dedicated to X-ray polarimetry in the energy band 2–8 keV. IXPE consists of three identical telescopes, each one having a polarimeter, the Gas Pixel Detector (GPD) (Costa et al., 2001; Baldini et al., 2021), sensitive to linear X-ray polarization and placed at the focus of the co-aligned Wolter-1 mirror module assemblies (MMAs). The IXPE MMAs have an angular resolution in half power diameter (HPD) of , and a field of view (FoV) of .
The Vela PWN was observed on April 2022 for a total exposure of 860 ks. Data is publically available on NASA’S HEASARC archive, and analysis is performed with ixpeobssim V30.5.0 (Baldini et al., 2022), which is developed by the IXPE collaboration following the formalism in Kislat et al. (2015). Details on data extraction are reported in Xie et al. (2022).
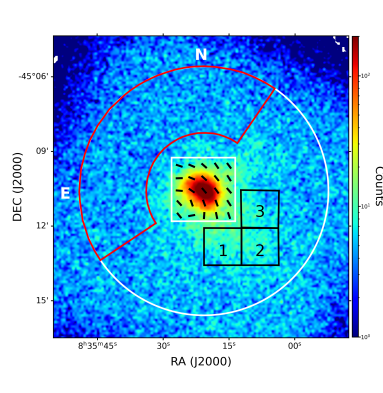
The right panel of Fig. 1 shows the images of the Vela PWN observed by IXPE, as well as the squared region analysed in Xie et al. (2022), and three black boxes in the diffuse emission region. All regions, including source and background, are chosen within a radius of centered on the pulsar (the white circle) to avoid the geometrical edge effects, as discussed in Di Marco et al. (2023). The energy range was narrowed down to 2–5 keV for further increment of the signal to background ratio (S/N ratio, hereafter). In addition, we applied the data selections provided in Di Marco et al. (2023) and Xie et al. (2021), which successfully remove approximately of the instrumental background, reducing the background contamination significantly.
2.2 Radio Polarization Data
We produced also radio polarization images of Vela PWN at 6, 13, and 21 cm for a comparison with the X-ray results. All of the radio data were taken from the Australia Telescope Compact Array (ATCA), and Tab. 1 shows detailed information about selected observations in every band. There are five observations in 6 cm band with the integration times of 53.7 hr, covering a - range from 0.35 to 115 k; four 13 cm mosaic observations give 0.8 hr integration times and a - coverage from 0.25 to 40.5 k; five other observations have 5.6 hr integrated observation time at 21 cm, which covers a - coverage from 0.1 to 29.6 k.
| \topruleTelescope | Obs. Date | Array | Center Freq. | Usable Band- | No. of | Integration | Pulsar Bin- |
| Config. | (MHz) | width (MHz) | Channels | Time (hr) | ning Mode | ||
| 6 cm | |||||||
| ATCA | 2018 Jan 09 | 6C | 5997.5 | 2048 | 513 | 9.5 | Y |
| ATCA | 2001 Feb 24 | 375 | 4800, 5696 | 104 | 13 | 11.5 | Y |
| ATCA | 2001 Mar 17 | 1.5D | 4800, 5696 | 104 | 13 | 10.4 | Y |
| ATCA | 2001 Mar 30 | 6E | 4800, 5696 | 104 | 13 | 10.7 | Y |
| ATCA | 2001 Apr 18 | 750D | 4800, 5696 | 104 | 13 | 10.6 | Y |
| 13 cm | |||||||
| ATCA | 1996 Jan 09 | 750C | 2368 | 104 | 13 | 0.2 | Y |
| ATCA | 1996 Jan 24 | 750B | 2368 | 104 | 13 | 0.2 | Y |
| ATCA | 1996 May 21 | 750D | 2368 | 104 | 13 | 0.2 | Y |
| ATCA | 1996 Nov 22 | 750A | 2368 | 104 | 13 | 0.2 | Y |
| 21 cm | |||||||
| ATCA | 1996 Jan 09 | 750C | 1344 | 104 | 13 | 0.2 | Y |
| ATCA | 1996 Jan 24 | 750B | 1344 | 104 | 13 | 0.2 | Y |
| ATCA | 1996 May 21 | 750D | 1344 | 104 | 13 | 0.2 | Y |
| ATCA | 1996 Jul 31 | 6C | 1344, 1432 | 104 | 13 | 4.8 | Y |
| ATCA | 1996 Nov 22 | 750A | 1344 | 104 | 13 | 0.2 | Y |
| \toprule |
The MIRIAD package helps to reduce all the radio data in this study (Sault et al., 1995). According to the standard procedures, we flagged bad data affected by radio frequency interference, obtained calibrated observation solutions (e.g., flux, band pass, and gains) from primary and secondary calibrators, and applied these solutions to the target source for every observation. We also eliminated contamination from the strong pulsar flux by excluding emission in the on-pulse phase with the help of ATCA pulsar binning mode (see Tab. 1 the last column). As is shown in Tab. 1, every observation in an individual band was combined together to produce Stokes I, Q, and U radio images of the Vela PWN. The rms noises of images are around 0.03, 0.04, and 0.08 mJy beam-1 at 6, 13, and 21 cm, respectively. We weighted data inversely proportional to the noise level and the Brigg’s robust parameter of 0.5 (Briggs, 1995), and plotted images in every band with beam sizes of 30″. Then, we deconvolved the initial images and combined final Stokes I, Q, and U images to produce the PA) images of polarized emission from Vela PWN in each band. Finally, we linearly fit the PA of every pixel in each band to measure the Faraday effect and derive the corrected PA map of magnetic field in the radio PWN.
3 Polarization Result
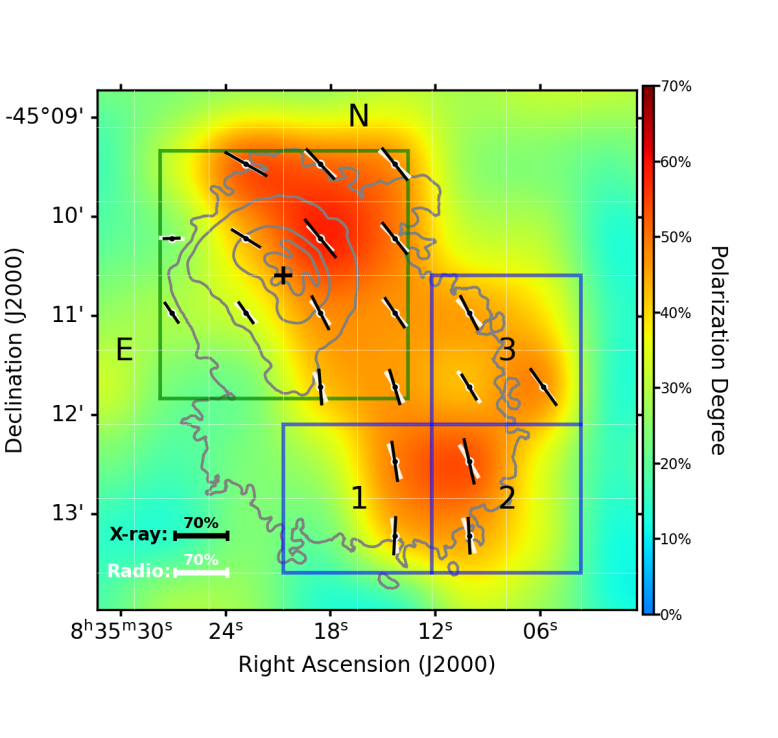
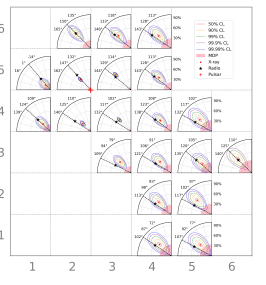
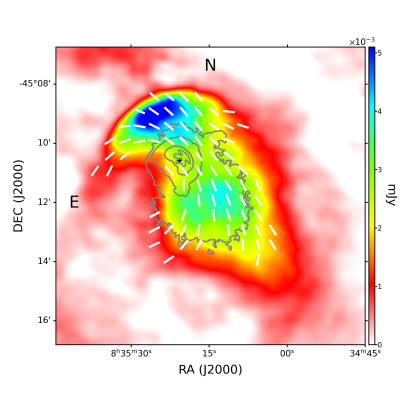
We performed a spatially resolved polarization analysis of Vela PWN in X-ray and radio band. The top panel of Fig. 2 displays the X-ray PD map using grids, convoluted with a Gaussian kernel function with a kernel size of , and overlaid with Chandra contours in the 2-5 keV band. The green box marks the region analysed in Xie et al. (2022), and three blue boxes are the outskirt regions we focus on (same as the 1, 2, 3 labeled square regions in Fig 1). The direction of the black lines represent the projected magnetic field, perpendicular to the X-ray PA (defined from north to east), with its length proportional to the PD. The white lines indicate the Faraday-rotation corrected magnetic field derived from radio data (Liu, 2023). Only the grids with X-ray PD larger than MDP99 (i.e., the minimum detectable polarization at 99% confidence level) have polarization vectors overlaid, and the corresponding polarization protractor plots are presented in the bottom panel. In these protractor plot, the confidence levels of 50%, 90%, 99%, 99.9%, and 99.99% are enclosed by the red, yellow, green, purple and blue contours, and the MDP99 are filled with pink shadow. The radio polarization is marked by the black star, and the black dash line highlight the direction of the radio PA. Owing to that the error of radio PA is at the level of 1∘, which is much smaller than that of X-ray, it is neglected in our discussion.
Xie et al. (2022) has shown that the X-ray polarization is well consistent with the radio in the central region. In this paper, we extend this consistance to the entire nebula. The maximum discrepancy in PA between the X-ray and the radio is below , and the average PA difference is with a mean error of . In the areas exhibiting the most difference, such as pixels (5, 2) and (5, 1), the X-ray PA errors are notably large, implying that the discrepancies may be heavily affected by a statistic effect. In addition, in pixel like (3, 4), the radio polarization deviates from the X-ray polarization by more than 4 (i.e., beyond the contour of 99.99% confidence level). This region is close to the pulsar, thus it may be affected by the pulsar’s polarization. Furthermore, the geometry structure near the pulsar seen in the Chandra image are highly curved, therefore, the underlying PA may vary rapidly, leading to a discrepancy in polarization between the radio and X-ray. Future X-ray polarimetry with smaller PSF will offer more insight into this matter.
The outskirt of the Vela PWN is highly polarized, as shown in Fig. 2, although it is much dimer than the central region. To obtain statistically significant polarization results, we rebin the diffuse emission into three squared regions, labeled by 1, 2, and 3, and each of them contains four pixels. All these three boxes display high level of significance exceeding 7 (calculated as the PD divided by its 1 error), which indicate a strong polarization in the diffuse emission region. We also consider the possible systematic effect on the diffuse emission, including the PSF and polarization leakage (Bucciantini et al., 2023a), using the simulation tools in ixpeobssim (Baldini et al., 2022) and GEANT4 (Agostinelli et al., 2003). It is found that these effects cause negligible impact on the X-ray polarization results within 1 uncertainty, thus are neglected in our analysis.
Moreover, for the area with low S/N ratio, such as the diffuse emission region, background subtraction could be crucial. We consider a local background sampled from the north-east side of the Vela PWN (the red panda region in the right panel of Fig. 1). This background is unpolarized, with an upper limit of 7.6%. Its normalized Stokes parameters are subtracted from the source data, with results presented in Tab. 2. In general, the PD substantially increase to almost twice its original value after background subtraction, ranging from to , with error of and significance level . To enhance the significance, we combine region 2 and 3, which are two most polarized area in the diffuse emission. The combined region have a PD of with a significance level larger than .
| \topruleRegion | Q/I | U/I | Sig() | PD() | PA(∘) |
| 1 | 7.00 | ||||
| 2 | 7.33 | ||||
| 3 | 7.82 | ||||
| Background | 2.72 | ||||
| Background Subtracted Polarization | |||||
| 7.21 | |||||
| 7.36 | |||||
| 7.60 | |||||
| 10.49 | |||||
| \toprule | |||||
4 Discussions
We detect a high PD in the outskirt region of the Vela PWN. For the most polarized region, at a confidence level of (), the PD is larger than () after background subtraction. The maximum PD allowed by the synchrotron mechanism for a power-law photon spectrum, with a photon index of , is given by (Rybicki & Lightman, 2004). For the diffuse emission, with a spectral index of (Kargaltsev & Pavlov, 2004, Kargaltsev et al., 2008, i.e., is ), the maximum PD is . Thus the observed PD of the outer diffuse emission is close to the maximum. The diffuse emission is located in away from the pulsar, which is almost 10 times further than the arc structure in the center PWN (Ng & Romani, 2004). The high PD of the diffuse emission reveals that the magnetic field in the outflow remains undisturbed as the magnetized plasma travels from the acceleration site to the outer region.
Following Bandiera & Petruk (2016) and Bucciantini et al. (2017), we estimate the upper limit of the energy ratio between the random and ordered magnetic field. The observed PD for a local region can be defined as:
| (1) |
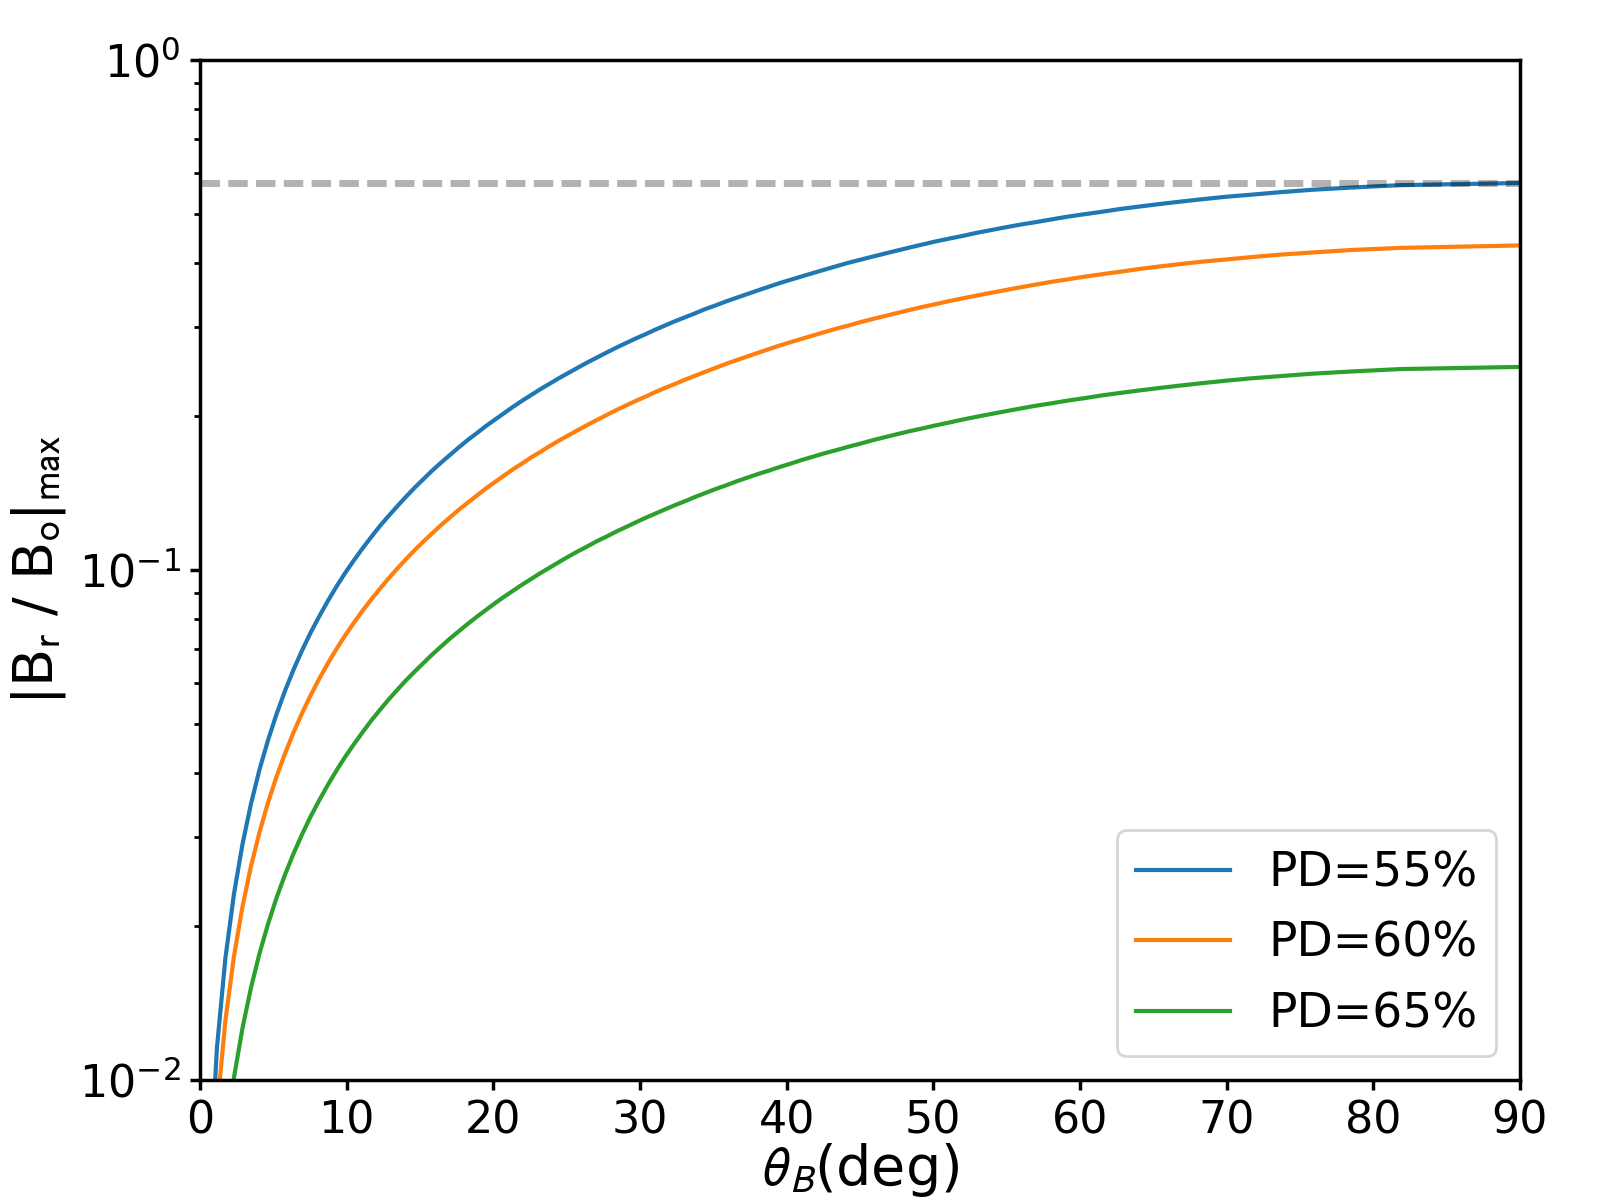
Here, is the spectral index, is the Kummer confluent hypergeometric function, with and representing the upper and lower parameters, and being the argument of the function, is the angle between the magnetic field direction and line of sight in the co-moving coordinate; is related to the energy ratio between the random magnetic field and the ordered magnetic field, assuming an three dimensional isotropic Gaussian random field with a variance of in each direction; the , , and are the strength of the random, ordered, and total magnetic field in the co-moving coordinate, respectively. The spectral index of Vela diffuse emission is measured as (Kargaltsev & Pavlov, 2004; Kargaltsev et al., 2008). The relation between the and the upper limit of is showed in Fig. 3, in cases of given PD of 55%, 60%, and 65%. With a PD of 55% and under an extreme condition , the maximum of is 57%, corresponding to a magnetic energy ratio of 33%. Considering a more possible case with higher PD and smaller (for example, PD and ), the upper limit of () would be ().
Beside the strong PD in X-ray, we also found a strong correlation between the polarization of the X-ray and the radio throughout the entire nebula, as shown in Fig. 2. Both X-ray and radio observations exhibit regions of high polarization, approaching the upper limit allowed by the synchrotron mechanism. This supports that the X-ray and radio emissions are produced by the electrons in the same magnetic field (Kargaltsev & Pavlov, 2004).
It is worth noting that such a correlation is not observed in Crab PWN (Bucciantini et al., 2023b; Aumont et al., 2010). This disparity might be attributed to their different evolutionary stages. The Crab is a relatively young nebula at an age of 1 kyr, while the Vela is 11.4 kyr, whose reverse shock of the supernova blast wave is interacting with the nebula. The outer nebular bubble undergoes compression, detaching from the pulsar, and forming the PWN relic, Vela X. In the absence of the outer nebula, we can directly observe the X-ray and radio nebula near the termination site. The predicted X-ray and radio polarization should be consistent, according to the magnetic hydrodynamic numerical simulations (Lyubarsky, 2002; Komissarov & Lyubarsky, 2004; Del Zanna et al., 2004; Bucciantini et al., 2005). While the young nebula, as the Crab, is expanding in its supernova ejecta and has not yet been interrupted by the reverse shock (Gaensler & Slane, 2006). The fresh X-ray emitting nebula is surrounded by the outer cool nebula, which predominantly radiates in the radio band, leading to the observed disparity between the radio and X-ray polarization.
Furthermore, the high PD observed in the Vela PWN implies a limited turbulence in the magnetic field, indicating some suppression of instability. A strong magnetic field could play a crucial role in suppressing the growth of instability (Bucciantini et al., 2004). The magnetic field in the Vela could be strengthened due to the compression of the reverse shock, resulting the observed high PD.
The boomerang PWN G106.6+2.96 is similar with Vela PWN (Kothes et al., 2006), where the original nebula has been crushed by the reverse shock. Its radio observations reveal a thick toroidal polarization pattern, akin to that observed in the Vela. If our understanding holds true, its X-ray polarization should also align closely with the radio polarization. Future observations will validate our conjecture.
5 Conclusion
X-ray polarization is important for understanding the magnetic fields of PWNe. Using data from IXPE we made the first full map of the X-ray polarization for Vela PWN as a function of position. In addition to the polarization detected in the inner regions closest to the pulsar, we find after careful background subtraction, statistically significant high PD is detected in the extended X-ray emission, which is close to the upper limit allowed by the synchrotron emission mechanism. The result suggests that the magnetic field in these regions remains highly uniform, and the turbulent magnetic field strength is estimated to be up to around half of the ordered magnetic field strength in the most polarized region.
We also found a strong correlation between the X-ray and radio polarization, which implies that the X-ray and radio are emitted by the electrons in the same magnetic field. Such consistence observed in the Vela PWN could be attributed to the interaction between the nebula and the reverse shock of the supernova blast-wave, which leads to a displacement between the synchrotron-cooled nebula and the fresh nebula close to the pulsar. The compression by the reverse shock amplifies the magnetic field, suppresses the growth of instability, and leads to an ordered magnetic field thus the high degree of polarization. Future X-ray polarization observations to other similar nebular systems, like boomerang PWN G106.6+2.9, will gain a deeper understanding on it.
References
- Agostinelli et al. (2003) Agostinelli, S., Allison, J., Amako, K., et al. 2003, Nuclear Instruments and Methods in Physics Research Section A: Accelerators, Spectrometers, Detectors and Associated Equipment, 506, 250
- Aumont et al. (2010) Aumont, J., Conversi, L., Thum, C., et al. 2010, Astronomy and Astrophysics, 514, A70
- Baldini et al. (2021) Baldini, L., Barbanera, M., Bellazzini, R., et al. 2021, Astroparticle Physics, 133, 102628
- Baldini et al. (2022) Baldini, L., Bucciantini, N., Lalla, N. D., et al. 2022, SoftwareX, 19, 101194
- Bandiera & Petruk (2016) Bandiera, R., & Petruk, O. 2016, Monthly Notices of the Royal Astronomical Society, 459, 178
- Blondin et al. (2001) Blondin, J. M., Chevalier, R. A., & Frierson, D. M. 2001, The Astrophysical Journal, 563, 806
- Briggs (1995) Briggs, D. 1995, BAAS, 27, 1444
- Bucciantini et al. (2004) Bucciantini, N., Amato, E., Bandiera, R., Blondin, J. M., & Del Zanna, L. 2004, Astronomy & Astrophysics, 423, 253
- Bucciantini et al. (2017) Bucciantini, N., Bandiera, R., Olmi, B., & Del Zanna, L. 2017, Monthly Notices of the Royal Astronomical Society, 470, 4066
- Bucciantini et al. (2005) Bucciantini, N., Del Zanna, L., Amato, E., & Volpi, D. 2005, Astronomy & Astrophysics, 443, 519
- Bucciantini et al. (2023a) Bucciantini, N., Di Lalla, N., Romani, R. W. R., et al. 2023a, Astronomy & Astrophysics, 672, A66
- Bucciantini et al. (2023b) Bucciantini, N., Ferrazzoli, R., Bachetti, M., et al. 2023b, Nature Astronomy, doi:10.1038/s41550-023-01936-8
- Caraveo et al. (2001) Caraveo, P. A., Luca, A. D., Mignani, R. P., & Bignami, G. F. 2001, The Astrophysical Journal, 561, 930
- Costa et al. (2001) Costa, E., Soffitta, P., Bellazzini, R., et al. 2001, Nature, 411, 662
- Del Zanna et al. (2004) Del Zanna, L., Amato, E., & Bucciantini, N. 2004, Astronomy & Astrophysics, 421, 1063
- Di Marco et al. (2023) Di Marco, A., Soffitta, P., Costa, E., et al. 2023, The Astronomical Journal, 165, 143
- Dodson et al. (2003a) Dodson, R., Legge, D., Reynolds, J. E., & McCulloch, P. M. 2003a, The Astrophysical Journal, 596, 1137
- Dodson et al. (2003b) Dodson, R., Lewis, D., McConnell, D., & Deshpande, A. A. 2003b, Monthly Notices of the Royal Astronomical Society, 343, 116
- Gaensler & Slane (2006) Gaensler, B. M., & Slane, P. O. 2006, Annual Review of Astronomy and Astrophysics, 44, 17
- Helfand et al. (2001) Helfand, D. J., Gotthelf, E. V., & Halpern, J. P. 2001, The Astrophysical Journal, 556, 380
- Kargaltsev & Pavlov (2004) Kargaltsev, O., & Pavlov, G. 2004, Symposium - International Astronomical Union, 218, 195
- Kargaltsev et al. (2008) Kargaltsev, O., Pavlov, G. G., Bassa, C., et al. 2008, in AIP Conference Proceedings, Vol. 983 (Montreal (Canada): AIP), 171–185
- Kislat et al. (2015) Kislat, F., Clark, B., Beilicke, M., & Krawczynski, H. 2015, Astroparticle Physics, 68, 45
- Komissarov & Lyubarsky (2004) Komissarov, S. S., & Lyubarsky, Y. E. 2004, Monthly Notices of the Royal Astronomical Society, 349, 779
- Kothes et al. (2006) Kothes, R., Reich, W., & Uyanıker, B. 2006, The Astrophysical Journal, 638, 225
- Liu (2023) Liu, Y. 2023, PhD thesis, publication Title: HKU Theses Online (HKUTO)
- Lyubarsky (2002) Lyubarsky, Y. E. 2002, Monthly Notices of the Royal Astronomical Society, 329, L34
- Ng & Romani (2004) Ng, C.-Y., & Romani, R. W. 2004, The Astrophysical Journal, 601, 479
- Rybicki & Lightman (2004) Rybicki, G. B., & Lightman, A. P. 2004, Radiative Processes in Astrophysics, Physics Textbook (Weinheim: Wiley)
- Sault et al. (1995) Sault, R., Teuben, P., Wright, M., et al. 1995, in ASP Conf. Ser., Vol. 77, Astron. Soc. Pac. San Francisco, 433
- Slane et al. (2018) Slane, P., Lovchinsky, I., Kolb, C., et al. 2018, The Astrophysical Journal, 865, 86
- Soffitta et al. (2021) Soffitta, P., Baldini, L., Bellazzini, R., et al. 2021, The Astronomical Journal, 162, 208
- Weisskopf et al. (2022) Weisskopf, M. C., Soffitta, P., Baldini, L., et al. 2022, Journal of Astronomical Telescopes, Instruments, and Systems, 8, doi:10.1117/1.JATIS.8.2.026002
- Xie et al. (2021) Xie, F., Ferrazzoli, R., Soffitta, P., et al. 2021, Astroparticle Physics, 128, 102566
- Xie et al. (2022) Xie, F., Di Marco, A., La Monaca, F., et al. 2022, Nature, 612, 658