A simulated electronic market with speculative behaviour and bubble formation
Abstract
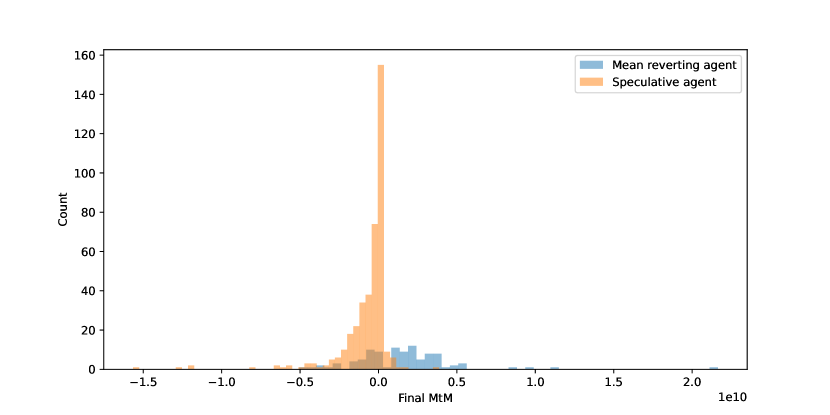
This paper presents an agent based model of an electronic market with two types of trading agents. One type follows a mean reverting strategy and the other, the speculative trader, tracks the maximum realised return over recent trades. The speculators have a distribution of returns concentrated on negative returns, with a small fraction making profits. The market experiences an increased volatility and prices that greatly depart from the fundamental value of the asset. Our research provides synthetic datasets of the order book to study its dynamics under different levels of speculation.
keywords:
simulation , agent-based model , multi-agent systems , speculation , financial bubble formation , algorithmic trading[inst1] addressline=, city=Phd Student. University of Gdansk, Faculty of Economics, state=Armii Krajowej 119/121, 81-824, Sopot, country=Poland
[inst2]addressline=, city=Professor. University of Lodz, Faculty of Economics and Sociology, state=POW 3/5, 90-255, Lodz, country=Poland
1 Introduction
The phenomenon of bubble formation has received extensive attention in the literature. For instance, in the early paper by Tirole (1985), it is stated that a prerequisite for the emergence of a bubble is a shared consensus regarding the asset’s value. The experimental work of Moinas and Pouget (2013) and Janssen et al. (2019) shows the importance of considering the behavioural traits of the agents. The bubble appears in an asset without fundamental value. They both used a sequential game and the traders decided to buy and sell the asset, but they were not aware of their position in the sequence. Weitzel et al. (2020) experiments with financial professionals and students and shows that bubbles appear for different market compositions. They also concluded that financial professionals act as price stabilizers when mixed with students. In the model proposed by Palfrey and Wang (2012), the emergence of a bubble is driven by the heterogeneity in agents’ updating strategies after receiving new information. When considering a Bayesian updating rule as the reference, certain agents exhibit a tendency to under-react, while others tend to over-react to the incoming news. In Abreu and Brunnermeier (2003) there is heterogeneity with respect to the time that arbitrageurs realise that there is a bubble. Bubbles can persist because the rational arbitrageurs players that are aware of the bubble are trying to profit from it for some time and therefore cannot coordinate their selling and burst it as soon as detected.
Our work attempts to contribute to the bubble formation literature simulating a number of agents interacting in a market with explicitly characterized motivations for each trade, incorporating different sources of heterogeneity in the same model. In our paper, the speculators are agents with lottery-like preferences. This type of preference for assets with high maximum returns or lottery-like demand, which is defined in Bali et al. (2011) as the demand for low probability/high payoff assets, has been studied in Lu et al. (2022) for stocks and in Grobys and Junttila (2021) for cryptocurrencies. The common proxy for lottery-like demand is the use of the maximum return observed or MAX factor. We provide a model with speculative agents that generates bubbles and it is useful for controlled experimentation. This simulated market environment could serve as an experimental platform for the investigation of methods for the detection of speculative bubbles. For recent developments in bubble detection methods see the works of Feng (2023), Pedersen and Schütte (2020), Astill et al. (2023), Wang et al. (2023) and Caravello et al. (2023). Another application involves the pricing done by the market maker and how it reacts to the presence of a bubble, testing algorithmic pricing methods as in Klein (2021). Our agent based model is based on the ABIDES-markets implementation by Byrd et al. (2019). For its extension compatible with OpenAI Gym see Amrouni et al. (2021). For OpenAI Gym and the current version re-named Gymnasium see Towers et al. (2023), which allows for the training of agents using reinforcement learning. For other works using ABIDES see Balch et al. (2019), which uses the simulator to assess the market impact of order sizes. Cao et al. (2022), which develops a synthetic dataset based on the simulations. Azamuke et al. (2022) uses it as a guideline for synthetic dataset generation.
An overview of agent-based models and examples of applications in finance can be found in Axtell and Farmer (2022). For other works using agent based models see Geanakoplos et al. (2012), LeBaron (2000), Steinbacher et al. (2021), Rekik et al. (2014), Wang et al. (2018), M. Ezzat (2020), Katahira et al. (2019), El Oubani and Lekhal (2022) and Poggio et al. (2001).
2 The model
The simulations contain three agent types: mean reverting agent, speculative agent and a market maker. They can trade one asset in a limit order book. The agents involved and the asset’s value process are described below.
2.1 Trading agents
The model involves trading agents of two types, they all start with 10 million in cash. One type of agent has a mean reverting strategy. It has a valuation for the asset and buys if the valuation is above the current mid price and sells otherwise. The implementation for this agent differs from the value agent provided in the source code of Byrd et al. (2019) in the updating rules. In our implementation, the agent relies on its current belief of the long term fundamental value and in the previous estimates of the short term value, capturing the idea of having different reactions to news. In one extreme the agent will set the belief as the latest observed value while in the other, the agent would never update this belief. The agent applies mean reversion of the short term estimate to the long term value. The agent does not keep estimates of the variance of the estimations nor has access to the variance of the fundamental value observations among agents as in Byrd et al. (2019).
The speculative agent type keeps the history of recent mid prices and will place a buy order if the recently observed maximum log return is high enough. The speculative agent would sell after hitting a take profit or stop loss level. Short selling is not allowed for the speculative agent, but they can use leverage.
The fact that we consider only two types of agents is further motivated by OECD (2017), which comments on the problems that algorithmic trading might pose for competition and how tacit collusion might be facilitated with the increased use of machine learning or black box models in trading. In our opinion, the release of public tools for the development of trading strategies111For example: https://www.composer.trade/learn/best-ai-trading-bot-platforms, which declares to use chatGPT4 makes any coordination less costly, as different agents can get access to the same under-laying code or type of strategy for trading. Our speculative agent serve as a representation of less sophisticated traders, motivated by the findings on the destabilizing effect of retail traders from Baig et al. (2023).
There is heterogeneity regarding the timing of the trading, as each agent has a time between trades exponentially distributed. The mean reverting agents, also present heterogeneity in terms of the mean reversal belief, the reaction to news and about the fundamental value of the asset. Therefore, some agents might choose to ride the bubble for longer than others depending on their beliefs. The beliefs of the value are normally distributed, the mean reversion speed and reaction to news are uniformly distributed. The speculators are heterogeneous with respect to the window for the maximum return calculation. This window is defined by the number of periods that the agents look back searching for the maximum return observed. This number of periods is Poisson distributed. The take profit, stop loss and returns triggering a buy order thresholds are also different for each agent and exponentially distributed. Following Abergel and Jedidi (2013), the order size or volume for each agent is drawn from a log-normal distribution.
is the mark to market value of the holdings at the moment of the last buy trade. is the current mark to market value of the holdings and is the starting cash. is the final time of the simulation. represents the maximum log return over the last mid prices.
2.2 Market maker agent
There is a market maker that generates orders on the ask and bid sides of the order book. As stated in McGroarty et al. (2019) the market maker attempts to profit from the spread in exchange of being a liquidity provider. This agent periodically resubmits a set of orders at different price levels (ticks). Considering the previous spreads using an exponentially weighted moving average (EWMA) this agent places orders such that the difference between levels is proportional to the EWMA spread and the volume or size placed at each level is proportional to the traded volume. As mentioned in Balch et al. (2019) the market maker model implemented in ABIDES is similar to the one in Chakraborty and Kearns (2011), but the ladder is built with a spacing proportional to the spread, instead of unit spacing. In our implementation the market maker skews the prices symmetrically around the mid price based on the current holdings of the asset. As mentioned in Czupryna (2022), if the market maker’s flow is skewed towards buying orders and thus building positive inventory, the market maker would decrease both the bid and ask quotes. Analogously, if the flow is skewed towards selling orders, it would increase both the ask and bid quotes. Price skewing by a market maker is also considered in Bergault (2021) and Barzykin et al. (2021).
2.3 The asset fundamental value
The asset fundamental value follows an OU mean-reverting process which is affected by additional shocks. Those shocks follow a mixture of 2 equally weighted normal distributions, with the same absolute mean, representing positive and negative shocks to the value of the asset. The agents can get noisy observations of the value that are normally distributed around the true fundamental value, which creates heterogeneity about the value beliefs. The speculative agents base their trading strategies on the observed returns and not on the fundamental value beliefs.
3 Results
3.1 Market without speculative agents
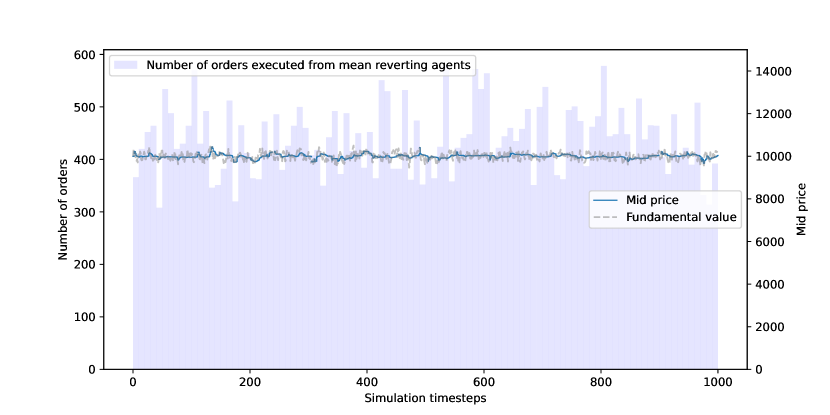
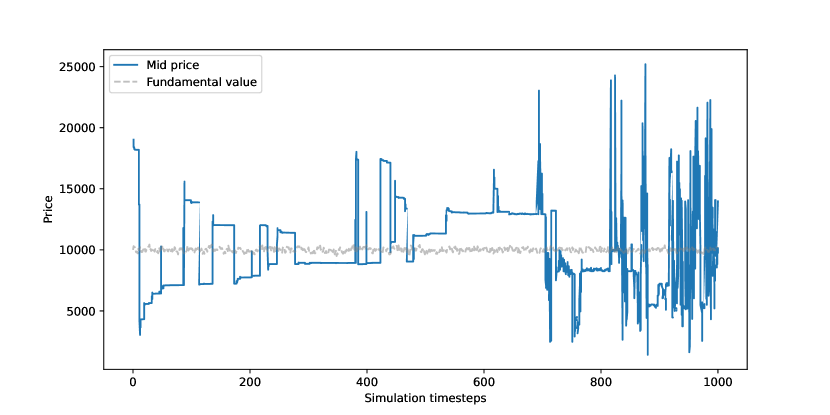
In this section we describe the results for the market that is populated with 500 mean reverting agents. As it can be seen in the figure below (random seed 2023), they generate a price path that follows closely the fundamental value of the asset.
The following figure shows the evolution of the portfolio mark to market for each agent. In this scenario all the agents follow a mean reverting strategy.
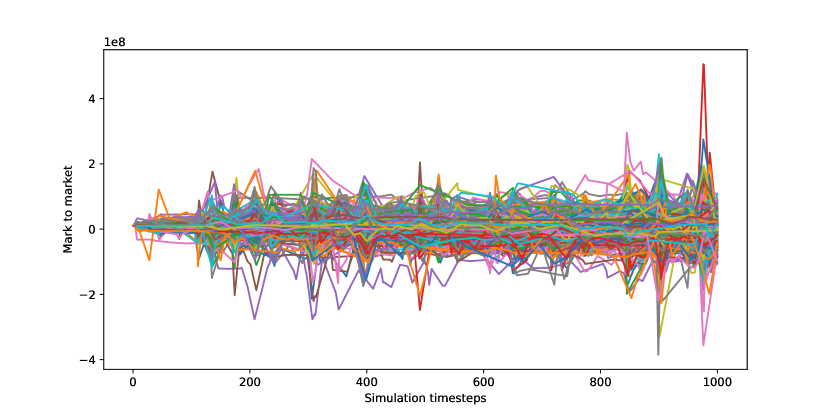
The mean reverting agents produce a price that follows closely the true fundamental value of the asset. The heterogeneity among agents allows for different levels of profitability as they have different beliefs regarding the fundamental value dynamics, but no bubble is created in this scenario.
3.2 Market with speculators
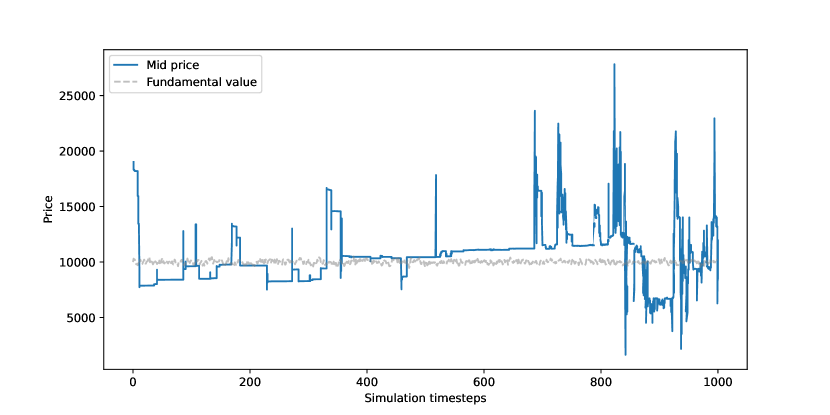
This sections presents the results for a market that contains the same fundamental value for the asset (same random seed), but this market has been created with 100 mean reverting agents and 400 speculative agents. In this case, the mid price shows bubble behaviour when compared against the fundamental value of the asset. This can be seen in the figure below.
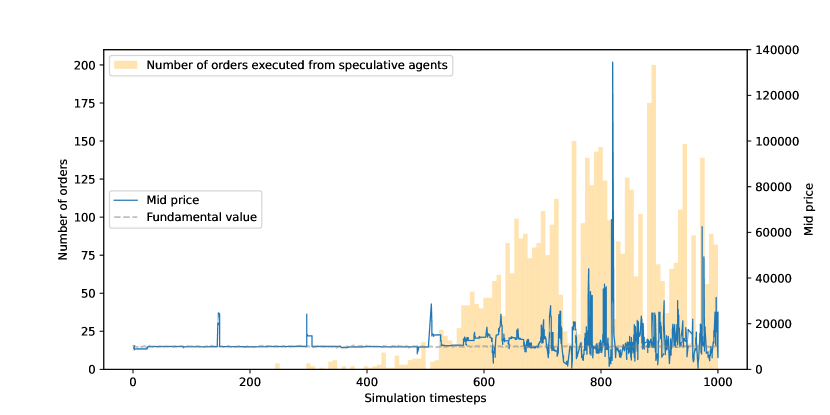
During the first half of the simulation, there is almost no trading done by the speculators and there is an increased volatility among the trades executed by the 100 mean reverting agents. Compared to the baseline case of 500 mean reverting agents, we observe short-lived bubbles among the heterogeneous mean reverting agents. But the price quickly returns to levels close to the fundamental value. In the second half of the simulation, the speculative agents start to engage in trading, producing another period of high volatility. This increased volatility promotes the entrance of more speculative agents, which in turns increases the demand for the asset, creating an imbalance in the inventory of the market maker. The market maker’s response is to increase both the ask and bid prices of its orders. The bubble during the second part of the simulation is the effect of both the pricing ladder of the market maker reacting to a trade imbalance and the higher demand of the speculative agents.
The onset of the speculative trading occurs several simulated timesteps before the peak of the bubble. An open question for future research is how fast the bubble can be anticipated from the activity in the order book data.
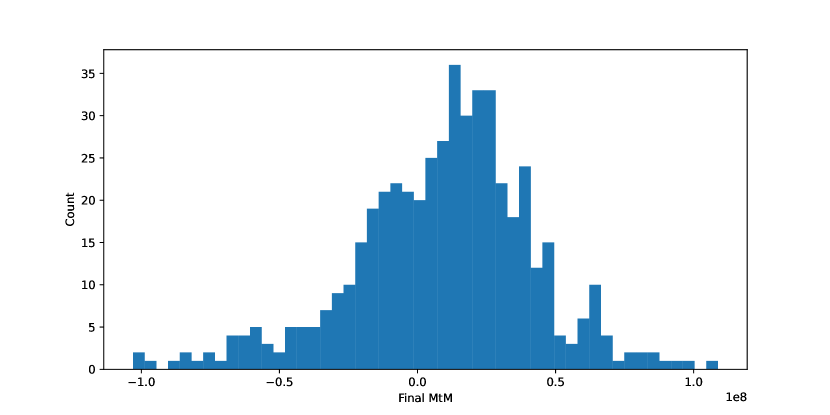
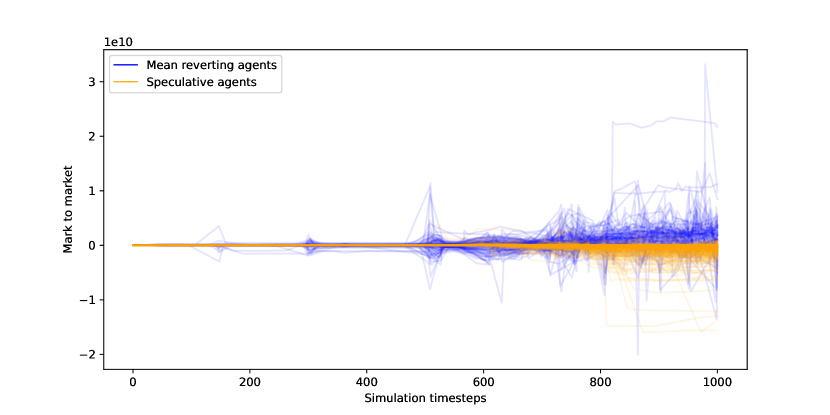
The time series of each agent’s mark to market values during the simulation show the under-performance of the speculators. For the speculative agents these are skewed towards negative values as it can be seen in the next figure.
4 Conclusions
This paper provides insights from an agent-based point of view on the complex dynamics of the market microstructure that drives bubble formation in speculative markets. Our work provides a source for synthetic datasets generation, which is useful for testing trading or risk models, pricing models from the market maker perspective and also for the research of bubble detection methodologies.
With the easier access to algorithmic trading platforms by retail traders, it is important to understand the effect of limited rationality in the markets. As seen in the simulations of this paper, with the increased presence of less sophisticated traders, short-sighted profit looking strategies can create a self-confirming loop in which a shock causing a positive return might incentivize more demand solely based on the shock and not on the fundamentals, further exacerbating the effect of the shock.
Under this controlled environment further research would explore the effects of more agent types and different variables on the bubble formation, like the degree of heterogeneity of beliefs among the traders, the speed of trading, liquidity constraints, leverage constraints and the pricing of the market maker.
In our simulated market, the speculative activity builds up several timesteps before the peak of the bubble. Using the simulated order book data, further research would focus on its early detection and prevention to help increase the stability of electronic markets.
5 Data availability
Data will be made available on request.
6 Declaration of competing interest
We declare that we have no relevant or material financial interests that relate to the research described in this paper.
References
- Tirole (1985) J. Tirole, Asset bubbles and overlapping generations, Econometrica: Journal of the Econometric Society (1985) 1499–1528.
- Moinas and Pouget (2013) S. Moinas, S. Pouget, The bubble game: An experimental study of speculation, Econometrica 81 (2013) 1507–1539.
- Janssen et al. (2019) D. J. Janssen, S. Füllbrunn, U. Weitzel, Individual speculative behavior and overpricing in experimental asset markets, Experimental Economics 22 (2019) 653–675. URL: https://link.springer.com/article/10.1007/s10683-018-9565-4. doi:10.1007/S10683-018-9565-4/FIGURES/5.
- Weitzel et al. (2020) U. Weitzel, C. Huber, J. Huber, M. Kirchler, F. Lindner, J. Rose, Bubbles and financial professionals, The Review of Financial Studies 33 (2020) 2659–2696.
- Palfrey and Wang (2012) T. R. Palfrey, S. W. Wang, Speculative overpricing in asset markets with information flows, Econometrica 80 (2012) 1937–1976.
- Abreu and Brunnermeier (2003) D. Abreu, M. K. Brunnermeier, Bubbles and crashes, Econometrica 71 (2003) 173–204.
- Bali et al. (2011) T. G. Bali, N. Cakici, R. F. Whitelaw, Maxing out: Stocks as lotteries and the cross-section of expected returns, Journal of financial economics 99 (2011) 427–446.
- Lu et al. (2022) J. Lu, N. T. Yang, K. Y. Ho, K. C. Ko, Lottery demand and the asset growth anomaly, Finance Research Letters 48 (2022) 102988. doi:10.1016/J.FRL.2022.102988.
- Grobys and Junttila (2021) K. Grobys, J. Junttila, Speculation and lottery-like demand in cryptocurrency markets, Journal of International Financial Markets, Institutions and Money 71 (2021) 101289. doi:10.1016/J.INTFIN.2021.101289.
- Feng (2023) H. Feng, Testing for explosive bubbles in the presence of non-gaussian conditions, Economics Letters (2023) 111391.
- Pedersen and Schütte (2020) T. Q. Pedersen, E. C. M. Schütte, Testing for explosive bubbles in the presence of autocorrelated innovations, Journal of Empirical Finance 58 (2020) 207–225.
- Astill et al. (2023) S. Astill, A. R. Taylor, N. Kellard, I. Korkos, Using covariates to improve the efficacy of univariate bubble detection methods, Journal of Empirical Finance 70 (2023) 342–366.
- Wang et al. (2023) S. Wang, H. Feng, D. Gao, Testing for short explosive bubbles: A case of brent oil futures price, Finance Research Letters 52 (2023) 103497.
- Caravello et al. (2023) T. E. Caravello, Z. Psaradakis, M. Sola, Rational bubbles: Too many to be true?, Journal of Economic Dynamics and Control 151 (2023) 104666.
- Klein (2021) T. Klein, Autonomous algorithmic collusion: Q-learning under sequential pricing, The RAND Journal of Economics 52 (2021) 538–558.
- Byrd et al. (2019) D. Byrd, M. Hybinette, T. H. Balch, Abides: Towards high-fidelity market simulation for ai research, 2019. arXiv:1904.12066.
- Amrouni et al. (2021) S. Amrouni, A. Moulin, J. Vann, S. Vyetrenko, T. Balch, M. Veloso, Abides-gym: Gym environments for multi-agent discrete event simulation and application to financial markets, 2021. arXiv:2110.14771.
- Towers et al. (2023) M. Towers, J. K. Terry, A. Kwiatkowski, J. U. Balis, G. d. Cola, T. Deleu, M. Goulão, A. Kallinteris, A. KG, M. Krimmel, R. Perez-Vicente, A. Pierré, S. Schulhoff, J. J. Tai, A. T. J. Shen, O. G. Younis, Gymnasium, 2023. URL: https://zenodo.org/record/8127025. doi:10.5281/zenodo.8127026.
- Balch et al. (2019) T. H. Balch, M. Mahfouz, J. Lockhart, M. Hybinette, D. Byrd, How to evaluate trading strategies: Single agent market replay or multiple agent interactive simulation? (2019). URL: https://arxiv.org/abs/1906.12010. doi:10.48550/ARXIV.1906.12010.
- Cao et al. (2022) D. Cao, Y. El-Laham, L. Trinh, S. Vyetrenko, Y. Liu, A synthetic limit order book dataset for benchmarking forecasting algorithms under distributional shift, in: NeurIPS 2022 Workshop on Distribution Shifts: Connecting Methods and Applications, 2022.
- Azamuke et al. (2022) D. Azamuke, M. Katarahweire, E. Bainomugisha, Scenario-based synthetic dataset generation for mobile money transactions, in: Proceedings of the Federated Africa and Middle East Conference on Software Engineering, FAMECSE ’22, Association for Computing Machinery, New York, NY, USA, 2022, p. 64–72. URL: https://doi.org/10.1145/3531056.3542774. doi:10.1145/3531056.3542774.
- Axtell and Farmer (2022) R. L. Axtell, J. D. Farmer, Agent-based modeling in economics and finance: Past, present, and future, Journal of Economic Literature (2022).
- Geanakoplos et al. (2012) J. Geanakoplos, R. Axtell, D. J. Farmer, P. Howitt, B. Conlee, J. Goldstein, M. Hendrey, N. M. Palmer, C.-Y. Yang, Getting at systemic risk via an agent-based model of the housing market, American Economic Review 102 (2012) 53–58.
- LeBaron (2000) B. LeBaron, Agent-based computational finance: Suggested readings and early research, Journal of Economic Dynamics and Control 24 (2000) 679–702.
- Steinbacher et al. (2021) M. Steinbacher, M. Raddant, F. Karimi, E. Camacho Cuena, S. Alfarano, G. Iori, T. Lux, Advances in the agent-based modeling of economic and social behavior, SN Business & Economics 1 (2021) 99.
- Rekik et al. (2014) Y. M. Rekik, W. Hachicha, Y. Boujelbene, Agent-based modeling and investors’ behavior explanation of asset price dynamics on artificial financial markets, Procedia Economics and Finance 13 (2014) 30–46.
- Wang et al. (2018) L. Wang, K. Ahn, C. Kim, C. Ha, Agent-based models in financial market studies, in: Journal of Physics: Conference Series, volume 1039, IOP Publishing, 2018, p. 012022.
- M. Ezzat (2020) H. M. Ezzat, Behavioral agent-based framework for interacting financial markets, Review of Economics and Political Science 5 (2020) 94–115.
- Katahira et al. (2019) K. Katahira, Y. Chen, G. Hashimoto, H. Okuda, Development of an agent-based speculation game for higher reproducibility of financial stylized facts, Physica A: Statistical Mechanics and its Applications 524 (2019) 503–518.
- El Oubani and Lekhal (2022) A. El Oubani, M. Lekhal, An agent-based model of financial market efficiency dynamics, Borsa Istanbul Review 22 (2022) 699–710.
- Poggio et al. (2001) T. Poggio, A. W. Lo, B. LeBaron, N. T. Chan, Agent-based models of financial markets: A comparison with experimental markets, Available at SSRN 290140 (2001).
- OECD (2017) OECD, Algorithms and collusion: Competition policy in the digital age, 2017.
- Baig et al. (2023) A. S. Baig, B. M. Blau, H. A. Butt, A. Yasin, Reprint of: Do retail traders destabilize financial markets? an investigation surrounding the covid-19 pandemic, Journal of banking & finance 147 (2023) 106744.
- Abergel and Jedidi (2013) F. Abergel, A. Jedidi, A mathematical approach to order book modeling, International Journal of Theoretical and Applied Finance 16 (2013) 1350025.
- McGroarty et al. (2019) F. McGroarty, A. Booth, E. Gerding, V. R. Chinthalapati, High frequency trading strategies, market fragility and price spikes: an agent based model perspective, Annals of Operations Research 282 (2019) 217–244.
- Chakraborty and Kearns (2011) T. Chakraborty, M. Kearns, Market making and mean reversion, in: Proceedings of the 12th ACM conference on Electronic commerce, 2011, pp. 307–314.
- Czupryna (2022) M. Czupryna, Market makers activity: behavioural and agent based approach, Central European Journal of Operations Research 30 (2022) 303–322.
- Bergault (2021) P. Bergault, Mathematical modeling for market making and related problems of financial liquidity: a song of assets and traders., Ph.D. thesis, Université Paris 1-Panthéon-Sorbonne, 2021.
- Barzykin et al. (2021) A. Barzykin, P. Bergault, O. Guéant, Market making by an fx dealer: tiers, pricing ladders and hedging rates for optimal risk control, 2021. URL: https://arxiv.org/abs/2112.02269. doi:10.48550/ARXIV.2112.02269.
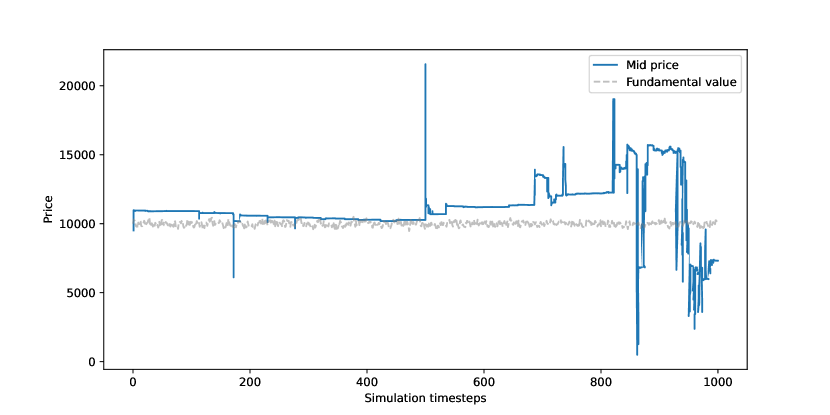
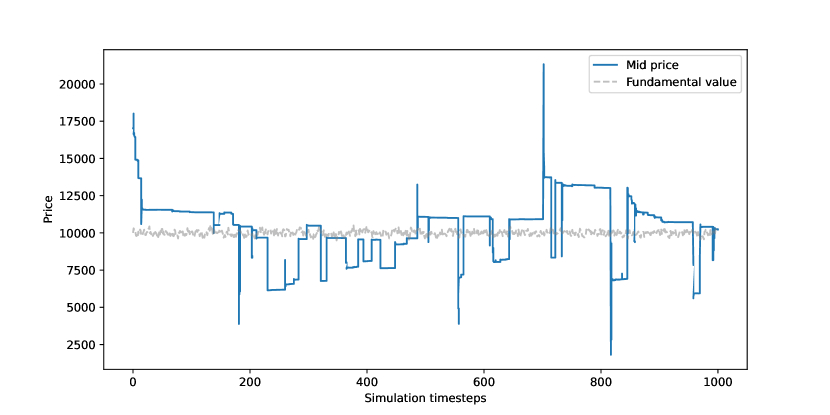
Appendix A Simulations with other random seeds
Appendix B Simulations with other compositions of agents
Appendix C Final distribution of mark to market portfolio value