Kuro Siwo: 12.1 billion under the water
A global multi-temporal satellite dataset for rapid flood mapping
Abstract
Global floods, exacerbated by climate change, pose severe threats to human life, infrastructure, and the environment. This urgency is highlighted by recent catastrophic events in Pakistan and New Zealand, underlining the critical need for precise flood mapping for guiding restoration efforts, understanding vulnerabilities, and preparing for future events. While Synthetic Aperture Radar (SAR) offers day-and-night, all-weather imaging capabilities, harnessing it for deep learning is hindered by the absence of a large annotated dataset. To bridge this gap, we introduce Kuro Siwo, a meticulously curated multi-temporal dataset, spanning 32 flood events globally. Our dataset maps more than 63 billion of land, with 12.1 billion of them being either a flooded area or a permanent water body. Kuro Siwo stands out for its unparalleled annotation quality to facilitate rapid flood mapping in a supervised setting. We also augment learning by including a large unlabeled set of SAR samples, aimed at self-supervised pretraining. We provide an extensive benchmark and strong baselines for a diverse set of flood events from Europe, America, Africa and Australia. Our benchmark demonstrates the quality of Kuro Siwo annotations, training models that can achieve and in F1-score for flooded areas and general water detection respectively. This work calls on the deep learning community to develop solution-driven algorithms for rapid flood mapping, with the potential to aid civil protection and humanitarian agencies amid climate change challenges. Our code and data will be made available at https://github.com/Orion-AI-Lab/KuroSiwo
1 Introduction
There is compelling evidence of compound effects that link extreme natural disasters worldwide [68]. The Intergovernmental Panel on Climate Change (IPCC) [74] underscores that floods represent the most frequent natural hazard globally. Furthermore, extreme floods exhibit strong correlations with the ongoing climate emergency [70], and are also projected to increase in frequency and intensity due to the effects of global warming [54, 4]. Flash floods [29] in particular, can occur with little to no warning and are characterized by their swift onset and high water levels, posing significant dangers to life, property, and the environment. The causes of flash floods, and more significantly, their expected impacts, exhibit significant variations contingent upon the exposure potential and vulnerabilities inherent in the affected population [77, 40] and socio-environmental assets [58]. In fact, floods tend to disproportionately affect the most impoverished and vulnerable segments of our society [69, 72, 11]. Research has revealed that approximately 170 million individuals exposed to substantial flood hazards are struggling with extreme poverty [69].
Recent tragic incidents in Pakistan [82, 84] and New Zealand [31] have exemplified the gravity of flash floods, resulting in significant human casualties and substantial economic losses. According to the World Bank [85], the latest flood in Pakistan affected a staggering million people, resulting in over 1,739 fatalities. The mismanagement of disasters triggered by floods in itself carries substantial risks. For instance, stagnant floodwaters, which present a significant hazard for the transmission of water-borne and vector-borne diseases, have left more than 8 million people in a state of health crisis [85]. Moreover, over 4 million children still live near contaminated floodwaters [82].
Remote sensing provides an opportunity for systematic, rapid and accurate flood mapping [16], crucial for effective flood impact management. Accurate flood mapping streamlines disaster response and relief efforts, allowing emergency responders, humanitarian organizations, and government agencies to efficiently allocate resources, deliver aid, and support affected populations [39]. It plays a crucial role in safeguarding critical infrastructure by identifying vulnerable assets prone to flood damage [57]. Additionally, it assists in assessing flood risks, guiding urban planning [25], land-use zoning [63, 81], and formulating flood mitigation strategies [46]. Accurate flood maps are indispensable for insurance companies and financial institutions in evaluating flood-related risks, determining insurance premiums, and managing financial exposure [78, 56, 79]. In the face of intensifying climate change impacts, flood mapping is crucial for adapting to evolving environmental conditions [59]. Lastly, it contributes to scientific research, enhancing our understanding of flood dynamics [53] and facilitating more informed decision-making in the long run [3, 21].
The exploitation of satellite data for flood mapping has seen extensive use [10], particularly with the emergence of Sentinel satellite platforms [80]. Specifically, the Sentinel-2 multispectral and Sentinel-1 Synthetic Aperture Radar (SAR) missions offer global, detailed and frequent imaging of the Earth’s surface. However, high precipitation and extensive cloud cover during flood events, impacts multispectral sensors which effectively become blind and unreliable for operational scenarios. In contrast, SAR operates seamlessly day and night, unaffected by weather conditions, making it better suited for operational flood mapping. Thus, our research is focused on developing methods that can rapidly map flooded areas using SAR data.
Modern computer vision methods are an excellent fit for this task and have already shown great promise in multiple Remote Sensing (RS) applications [75, 76, 9, 64]. However, the problem of rapid flood mapping remains unsolved. To the best of our knowledge, no machine learning method has notably excelled in both robust performance and generalization across diverse global flood events. We identify two primary reasons for this. Firstly, the task is inherently complex due to the presence of speckle noise in SAR [47], manifesting as random brightness variations in backscatter imagery. Second, deep learning methods require a substantial amount of well-curated training data to fulfill their potential. While the Sentinel-1 mission offers abundant data for leveraging these methods in flood mapping, a comprehensive and well-annotated dataset is currently absent.
To overcome this barrier, we undertake the laborious work of curating time-series data from Sentinel-1 SAR images linked to flood events worldwide, and manually annotate them by a group of SAR experts. We also incorporate unlabeled SAR samples, facilitating the exploration of semi-supervised and large-scale self-supervised learning (SSL). We name the resulting dataset “Kuro Siwo” and release it publicly with the aim to propel research in this field towards developing operational tools to support civil protection authorities for greater good.
Our main contributions can be summarized as follows:
-
•
We publish Kuro Siwo, a global, manually annotated multi-temporal SAR dataset providing labels for 32 distinct flood events. Kuro Siwo consists of time series SAR imagery with dual polarization paired with elevation information. Its sheer size, meticulous annotation process and diversity make it a unique and highly valuable dataset for rapid flood mapping.
-
•
We enhance Kuro Siwo with a large unlabeled SAR dataset, facilitating global representation learning alongside a well-defined downstream task for evaluation. The final dataset contains more than 2 million SAR images grouped into more than 700,000 time series.
-
•
We publish the first benchmark on Kuro Siwo, namely BlackBench, offering diverse and strong baselines. BlackBench demonstrates the quality of Kuro Siwo, enabling the training of models that achieve performance higher than 85% and 87% F1-Score for flood and general water detection respectively on a challenging test set.
2 Related Work
2.1 Flood mapping datasets
In this section we summarize previous work on the creation of analysis-ready satellite based datasets for flood mapping. Our investigation is focused on three key aspects. First, the provided satellite sensors, second the ground truth generation process and finally the evaluation scheme. Please refer to Tab. 1 for an overview of our analysis.
| Dataset | Sources |
Imagery
included? |
SGD | # samples | sample size | # events |
# events in
test set |
Timestamps | # continents | # classes |
Annotation
method |
|---|---|---|---|---|---|---|---|---|---|---|---|
| UNOSAT [62] | S1 | ✓ | 10m | 58,128 | 256x256 | 15 | all + 1 new | Post | 2 | 2 | SA |
| SEN12-FLOOD [67] | S1, S2 | ✓ | 10m | 336 | 512x512 | - | - | Time series | 3 | 2 | CEMS |
| Sen1Floods11 [6] | S1, S2 | ✓ | 10m | 4,831 | 512x512 | 11 | 1 | Post | 5 | 3 | M, A |
| Ombria [24] | S1, S2 | ✓ | 10m | 1,688 | 256x256 | 23 | all | Pre, Post | 5 | 2 | CEMS |
| WorldFloods [55] | S2 | ✓ | 10m | 185,574 | 256x256 | 119 | 6 | Post | 6 | 3 | SA |
| GF-FloodNet [94] | GF2, GF3 | ✓ | 1.5 - 5m | 13,388 | 256x256 | 8 | all + 3 new | Post | 4 | 2 | SA |
| Global Flood Database [77] | MODIS | ✗ | 250m | 12,719 | - | 913 | - | Post | 6 | 2 | A |
| S1GFloods [73] | S1 | ✓ | - | 5,360 | 256x256 | 46 | all + 2 new | Pre, Post | 6 | 2 | SA |
| MMFlood [60] | S1, DEM, OSMh | ✓ | 20m | 1,748 | 2000x2000 | 95 | 34 | Post | 6 | 2 | CEMS |
| RAPID-NRT [91] | S1 | ✗ | 10m | 559 | - | 4 | - | - | 1 | 2 | A |
| CAU-Flood [34] | S1, S2 | ✓ | 10m | 18,302 | 256x256 | 18 | 2 | Pre, Post | 4 | 2 | M |
| FloodNet [66] | UAV | ✓ | 1.5cm | 2,343 | 4000x3000 | 1 | 1 | Post | 1 | 9 | SA |
| Kuro Siwo (ours) | S1, DEM | ✓ | 10m | 24,969 | 224x224 | 32 | 6 | 2 Pre, Post | 6 | 3 | M |
Several datasets, such as SEN12-FLOOD, Sen1Floods11, Ombria, GF-FloodNet and CAU-Flood provide aligned multisource satellite imagery, facilitating the utilization of multiple modalities. A great number of datasets like UNOSAT, Sen1Floods11, WorldFloods, GF-FloodNet, MMFlood and FloodNet provide solely the post-flood acquisition omitting pre-event information which could greatly assist the mapping process and alleviate false positive predictions on permanent water bodies. In addition, databases like the Global Flood Database and RAPID-NRT comprise only flood mappings with no corresponding input imagery.
Given the difficulty and cost of satellite imagery photointerpretation, the creation of ground truth masks for large-scale datasets is not trivial, with many works offering automatic or semi-automatic methods to alleviate the need for a laborious labelling process (Tab. 1). Some datasets, like the Global Flood Database and RAPID-NRT, employ automatic annotation methods, introducing noise and inaccuracies in the labels due to their reliance on input data quality. Others, such as UNOSAT, WorldFloods, GF-FloodNet, S1GFloods, and FloodNet, utilize a semi-automatic pipeline where automatically generated labels undergo refinement by human annotators. It’s worth noting that in Sen1Floods11, only 446 samples from a single event were manually annotated, while the rest used a thresholding method without human intervention. Manual labeling through meticulous photointerpretation produces higher-quality ground truth mappings. Nevertheless, this approach is expensive, requiring expert input and potentially introducing annotator bias. Such labels have been produced for the CAU-Flood dataset to generate binary flood/no flood masks.
The proposed evaluation scheme is crucial for assessing the generalization capabilities of any flood mapping method. However, in Sen1Floods11, WorldFloods, CAU-Flood, and FloodNet, a limited number of events are reserved for testing, potentially providing an insufficient indicator of a model’s performance on unseen conditions. Additionally, in UNOSAT, Ombria, GF-FloodNet, and S1GFloods, samples from all flood events are shuffled and randomly split into training, validation, and test sets, posing a risk of data leakage where samples from the same area and satellite capture may appear in both training and test sets. To address this concern, the authors of UNOSAT, GF-FloodNet, and S1GFloods have also performed evaluation on imagery from a small number of new, unseen flood events, though these events are not included in the published datasets.
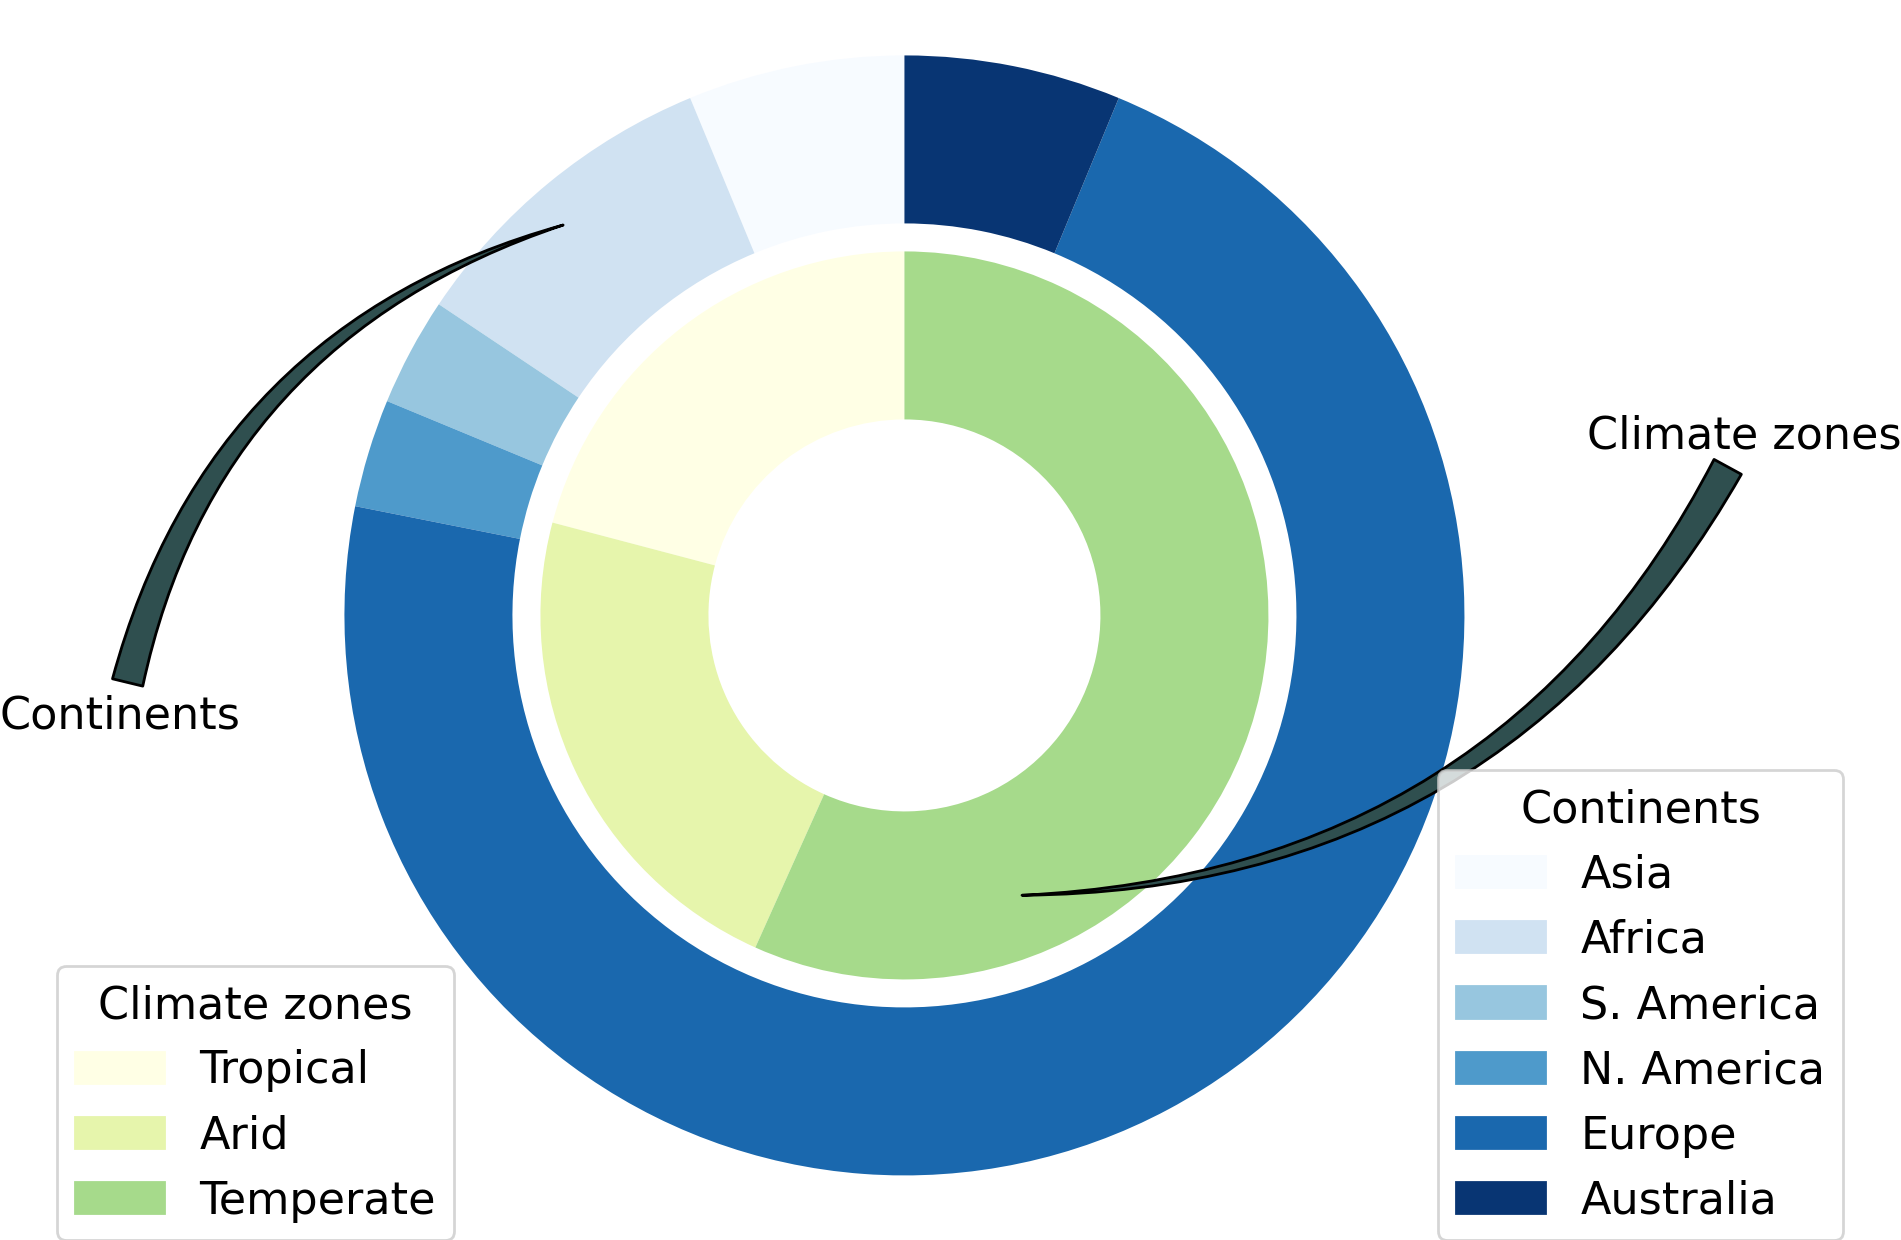
To our knowledge Kuro Siwo is the first flood mapping dataset offering ground truth labels based on expert photointerpretation at such an unprecedented scale (32 events), with wide spatial coverage spanning 6 out of 7 continents and 3 out of 4 climate zones. Kuro Siwo can be the first step towards unlocking the true potential of deep learning methods for rapid flood mapping.
2.2 Deep learning for rapid flood mapping from SAR imagery
Several studies have explored the synergistic use of SAR and multispectral imagery, aiming to capitalize on the strengths of both modalities. In works such as [67] and [24], simple CNN models extract features from a time series of both modalities, concurrently leveraging spatial and temporal contexts. [36] investigates domain adaptation techniques applied to various machine learning algorithms. Notably, [2, 61, 95] focus on post-flood imagery and experiment with CNN architectures distinguishing flood water from permanent water, assisted by auxiliary DEM input. Transfer learning approaches between SAR and multispectral domains have been explored in works like [50], [42], and [28], whereas in [34] a U-Net-like architecture with transformer modules is trained on Sentinel-2 pre-flood and Sentinel-1 post-flood images.
Nevertheless, multiple studies have focused solely on the use of SAR imagery due to its all weather imaging capabilities, and have designed various CNN architectures in order to segment the post-flood SAR image into flooded/non-flooded pixels (e.g. [41], [62], [87], [88], [15], [38], [1]). On the other hand, a number of methods opt for bitemporal imagery as input to their models in order to perform change detection analysis and better isolate the flooding events. For example, [37] utilize simple dual-branch CNN architectures on bitemporal SAR data, whereas [22], [92] and [73] exploit transformer networks for better feature and context extraction. In [96] a dual-branch CNN is pretrained on water extraction and then finetuned on flood inundation mapping, while in [30] a sparse autoencoder is employed for the creation of pseudo-labels which are then used to train a simple small CNN. Finally, in [86] the model is also assisted by salient maps produced using the backscatter coefficient, and in [90] a time series of pre-flood SAR acquisitions is fed as input to a U-Net with ConvLSTM modules which is trained in a contrastive self-supervised way. A handful of studies have also addressed flood mapping in urban areas. For this task, [97] propose a U-Net with an additional urban-aware normalization submodule, while [48] employ a semi-supervised approach through a teacher-student CNN network to address the limited number of labelled samples.
3 Kuro Siwo dataset
|
VH |
 |
 |
 |
 |
CEMS |
|
VV |
 |
 |
 |
 |
Kuro Siwo |
| Pre-Event 1 | Pre-Event 2 | Post-Event | Annotation |
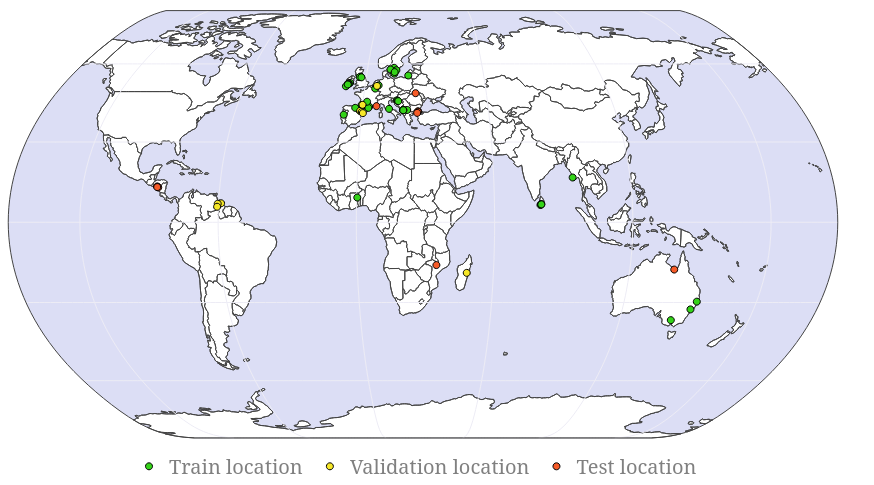
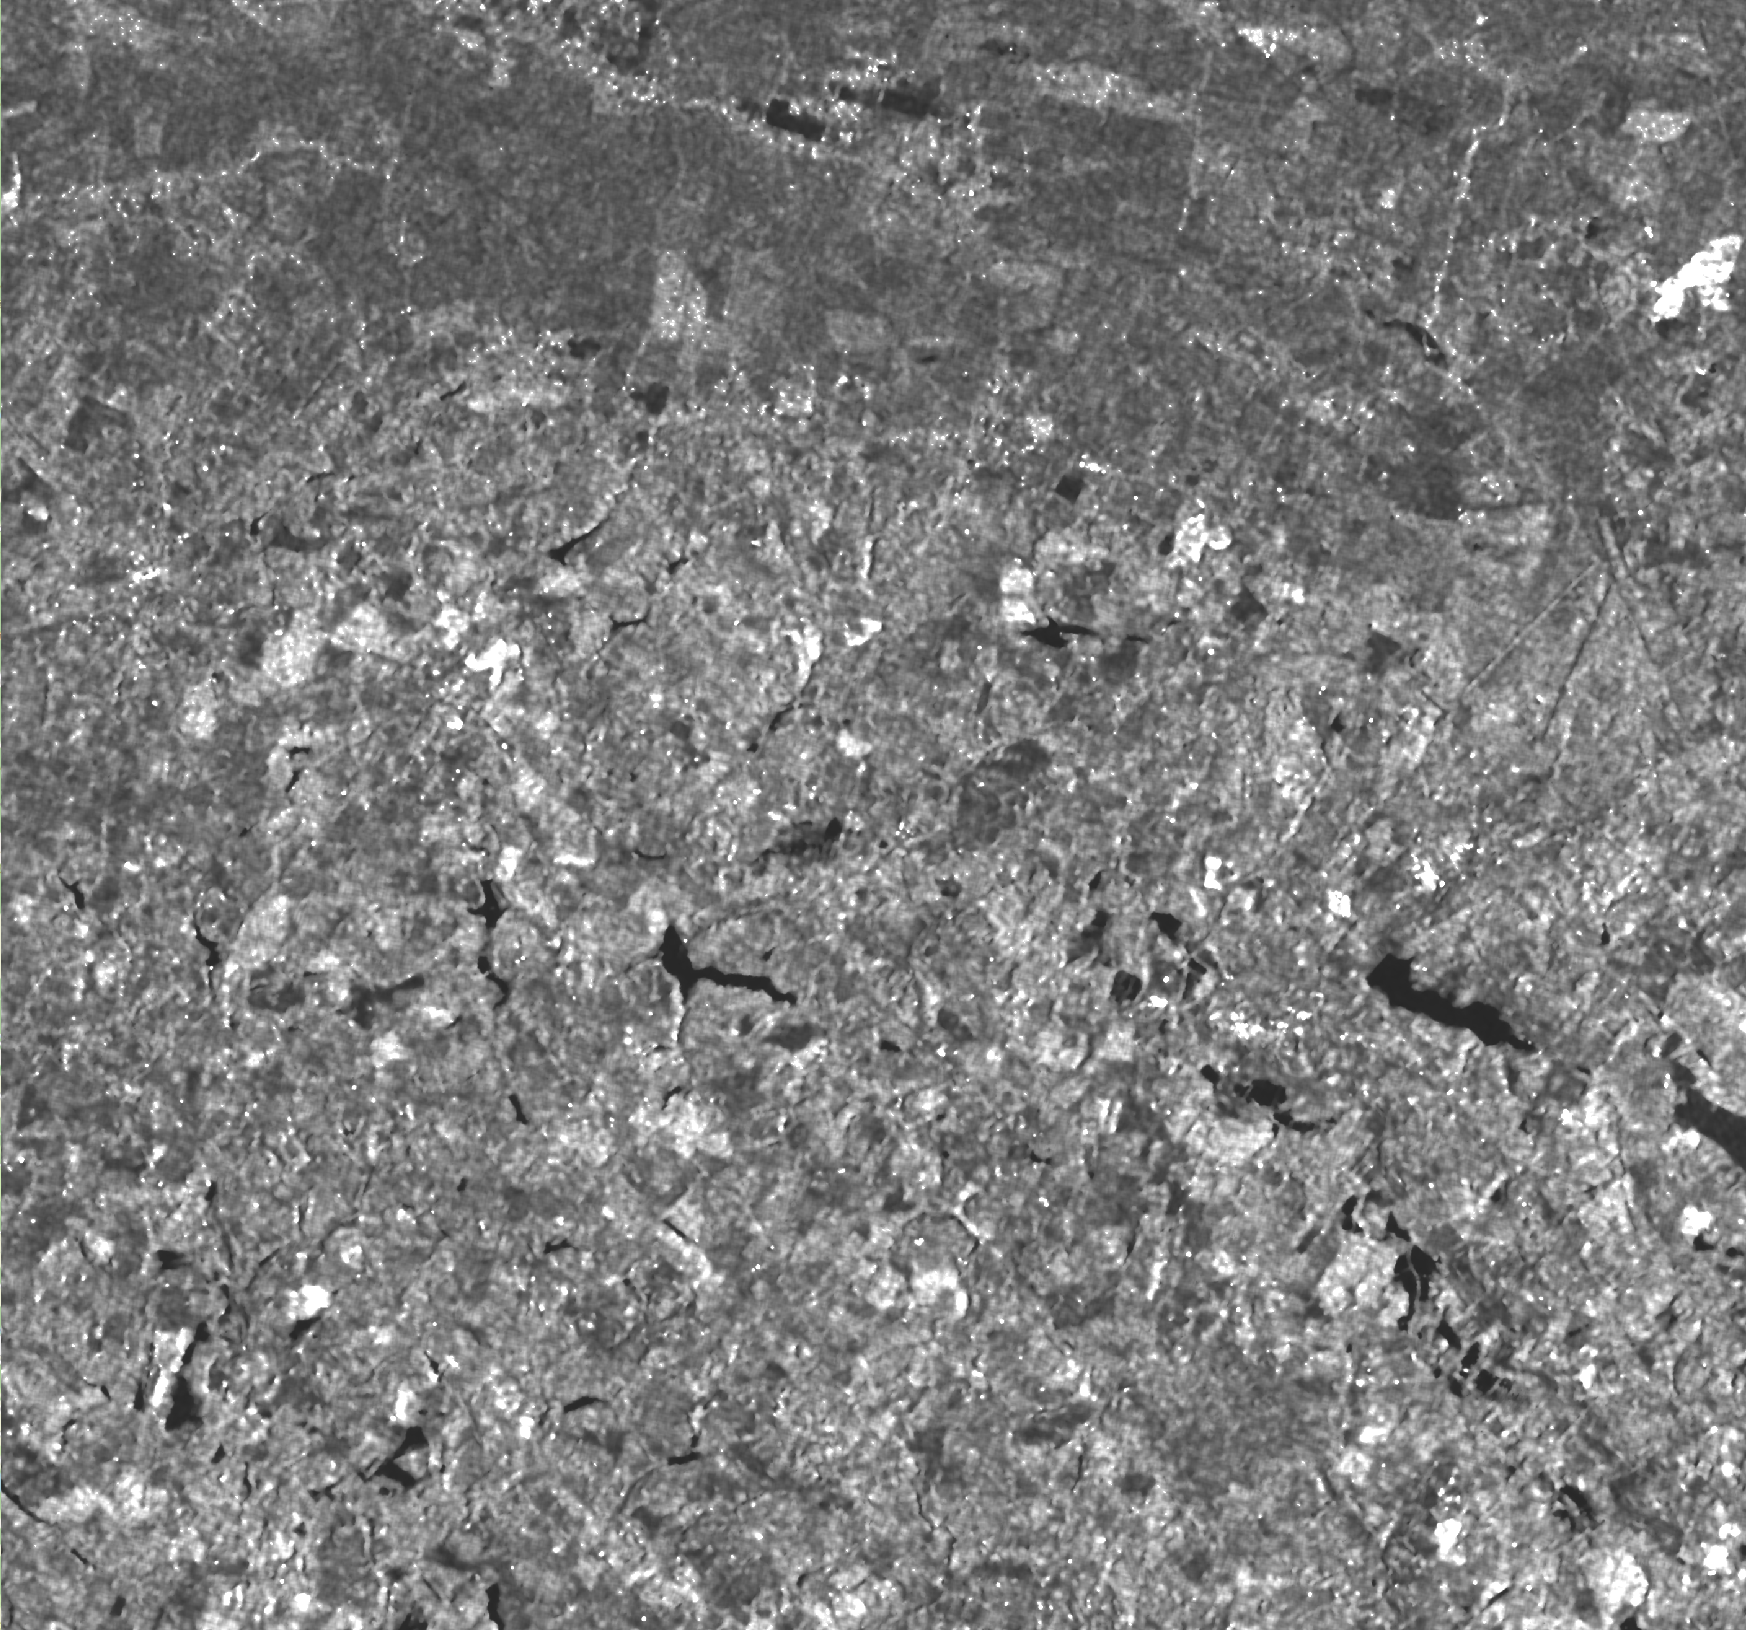
Requirements. While substantial efforts have been invested in automated flood mapping, the absence of a diverse and well-curated remote sensing dataset hampers the potential of deep learning methods for this critical task. To address this gap, we present Kuro Siwo, a distinctive flood inundation mapping dataset constructed with specific constraints. Firstly, the dataset is SAR-based, ensuring availability of usable imagery in all weather conditions, day and night, even during production in an operational context. In addition, we stick to SAR imagery from the Sentinel-1A&B satellites, since Copernicus data are available on a free and open basis, and there is strong commitment for the continuity of the mission. Secondly, Kuro Siwo is designed as a multi-temporal dataset to enable distinguishing between permanent water bodies, e.g rivers and lakes, and flooded areas, and also to facilitate testing change detection computer vision architectures. Thirdly, Kuro Siwo aims for diversity, featuring extensive spatio-temporal coverage of 32 major flood events spanning from 2015 to 2021, across six continents and three climate zones. The omission of flood events in Antarctica and polar/cold climate zones reflects their real-life distribution, as these areas typically do not experience floods. Fig. 1 illustrates the spatial coverage of Kuro Siwo, including the distribution of climate zones. Lastly, we prioritize the generation of high-quality flood annotations, surpassing those from existing sources like CEMS, achieved through manual photointerpretation by a group of SAR experts.
Events selection rationale. We curate a subset of events from those available in the CEMS pool. Specifically, we select all flood events from February 2015 onwards, subject to the condition that an event has at least one post-event delineation product generated using Sentinel-1 SAR imagery, as indicated by the CEMS production team.
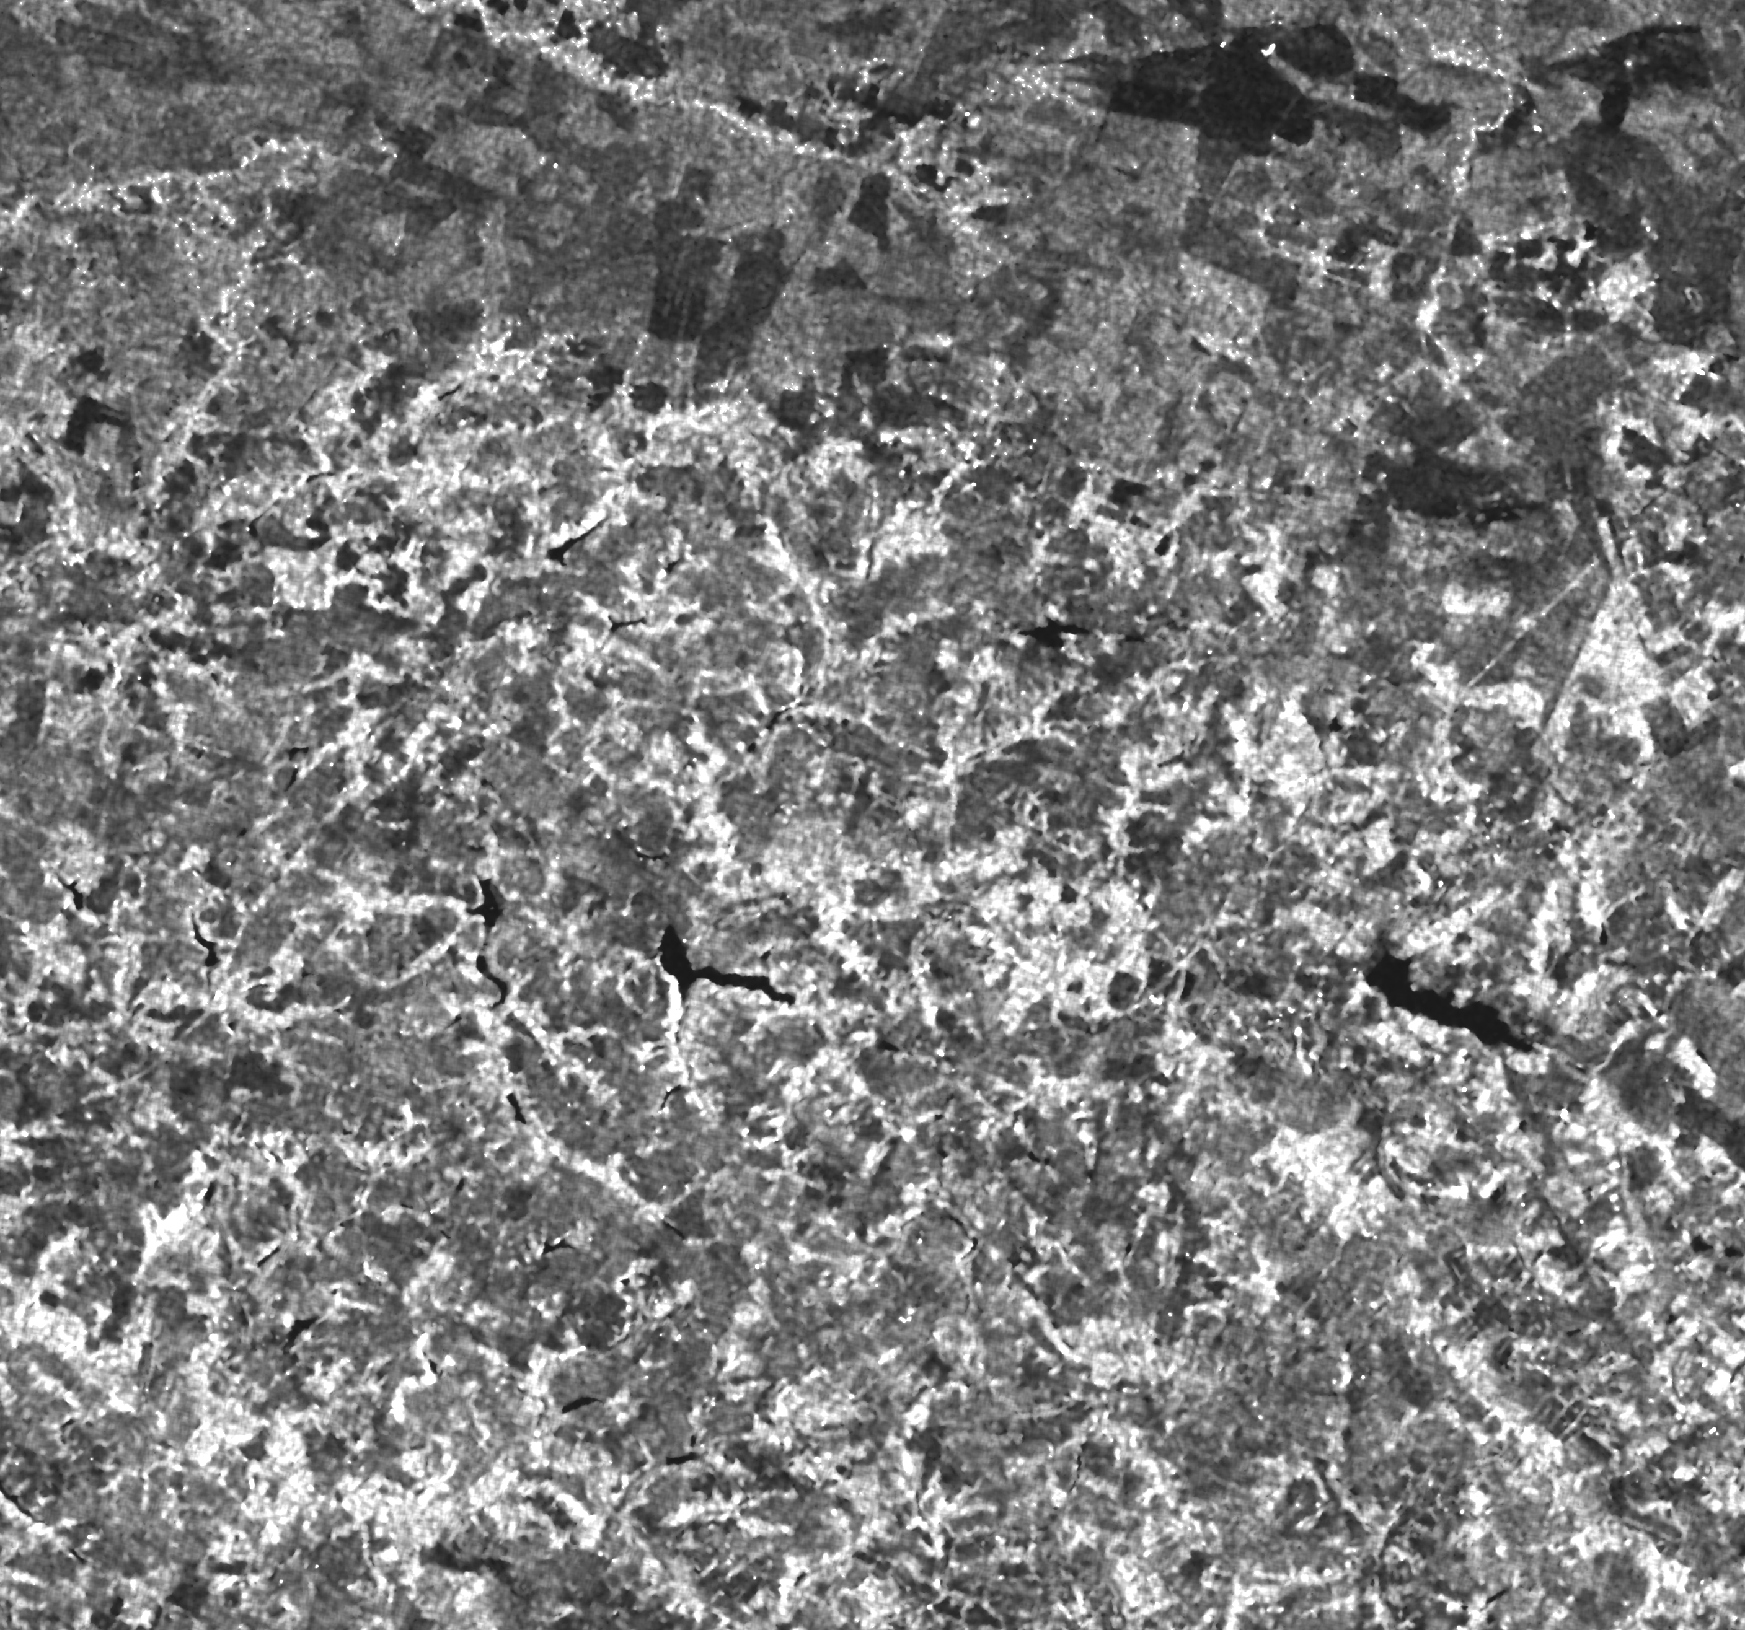
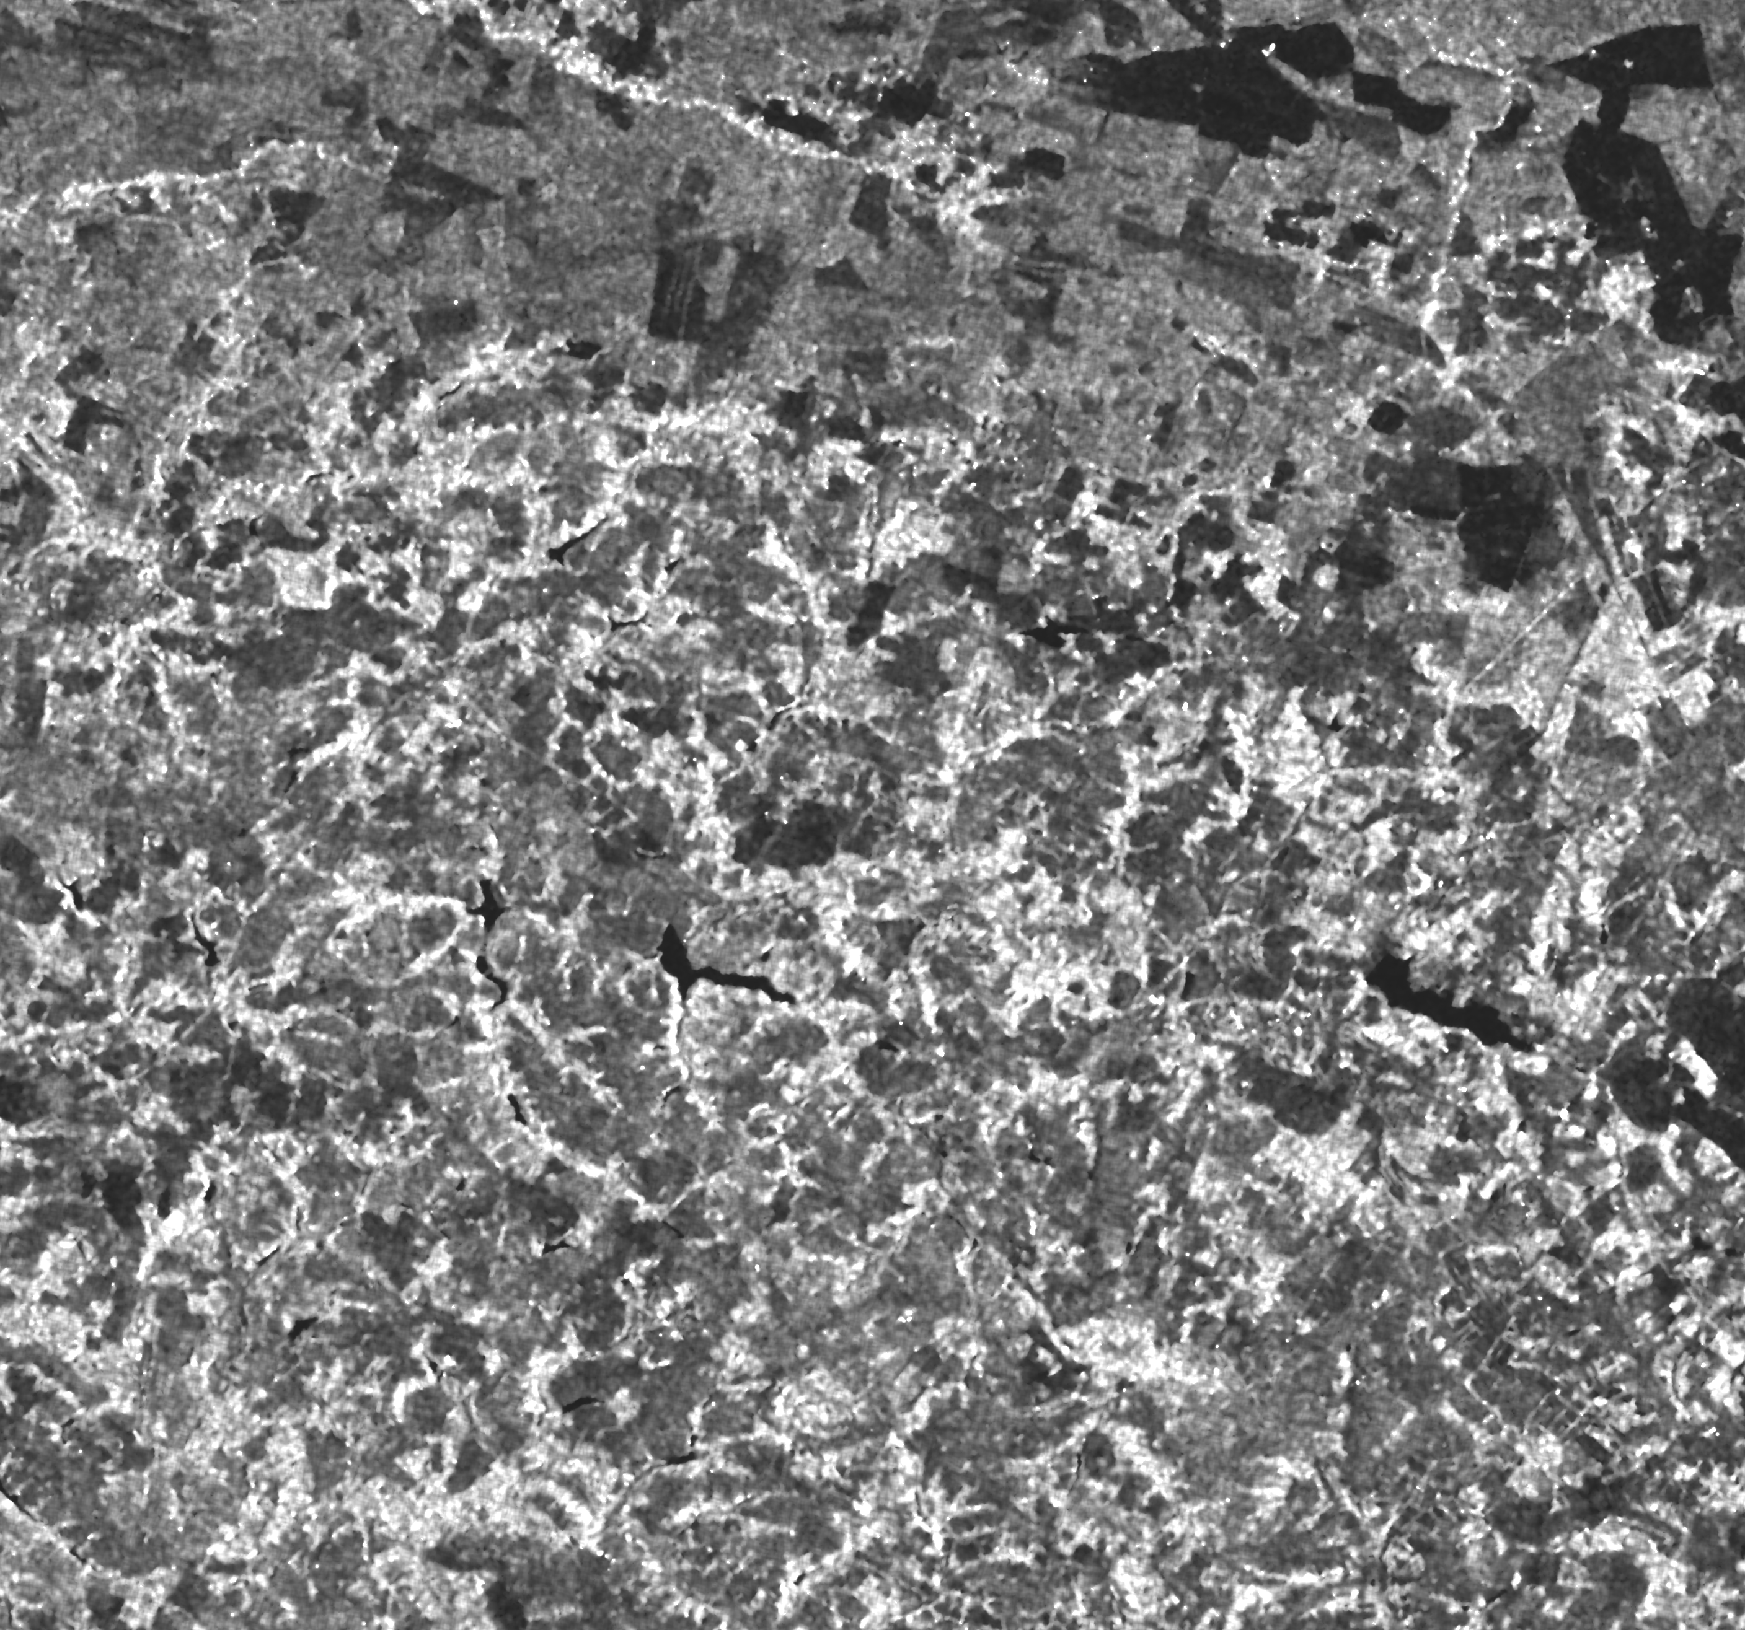
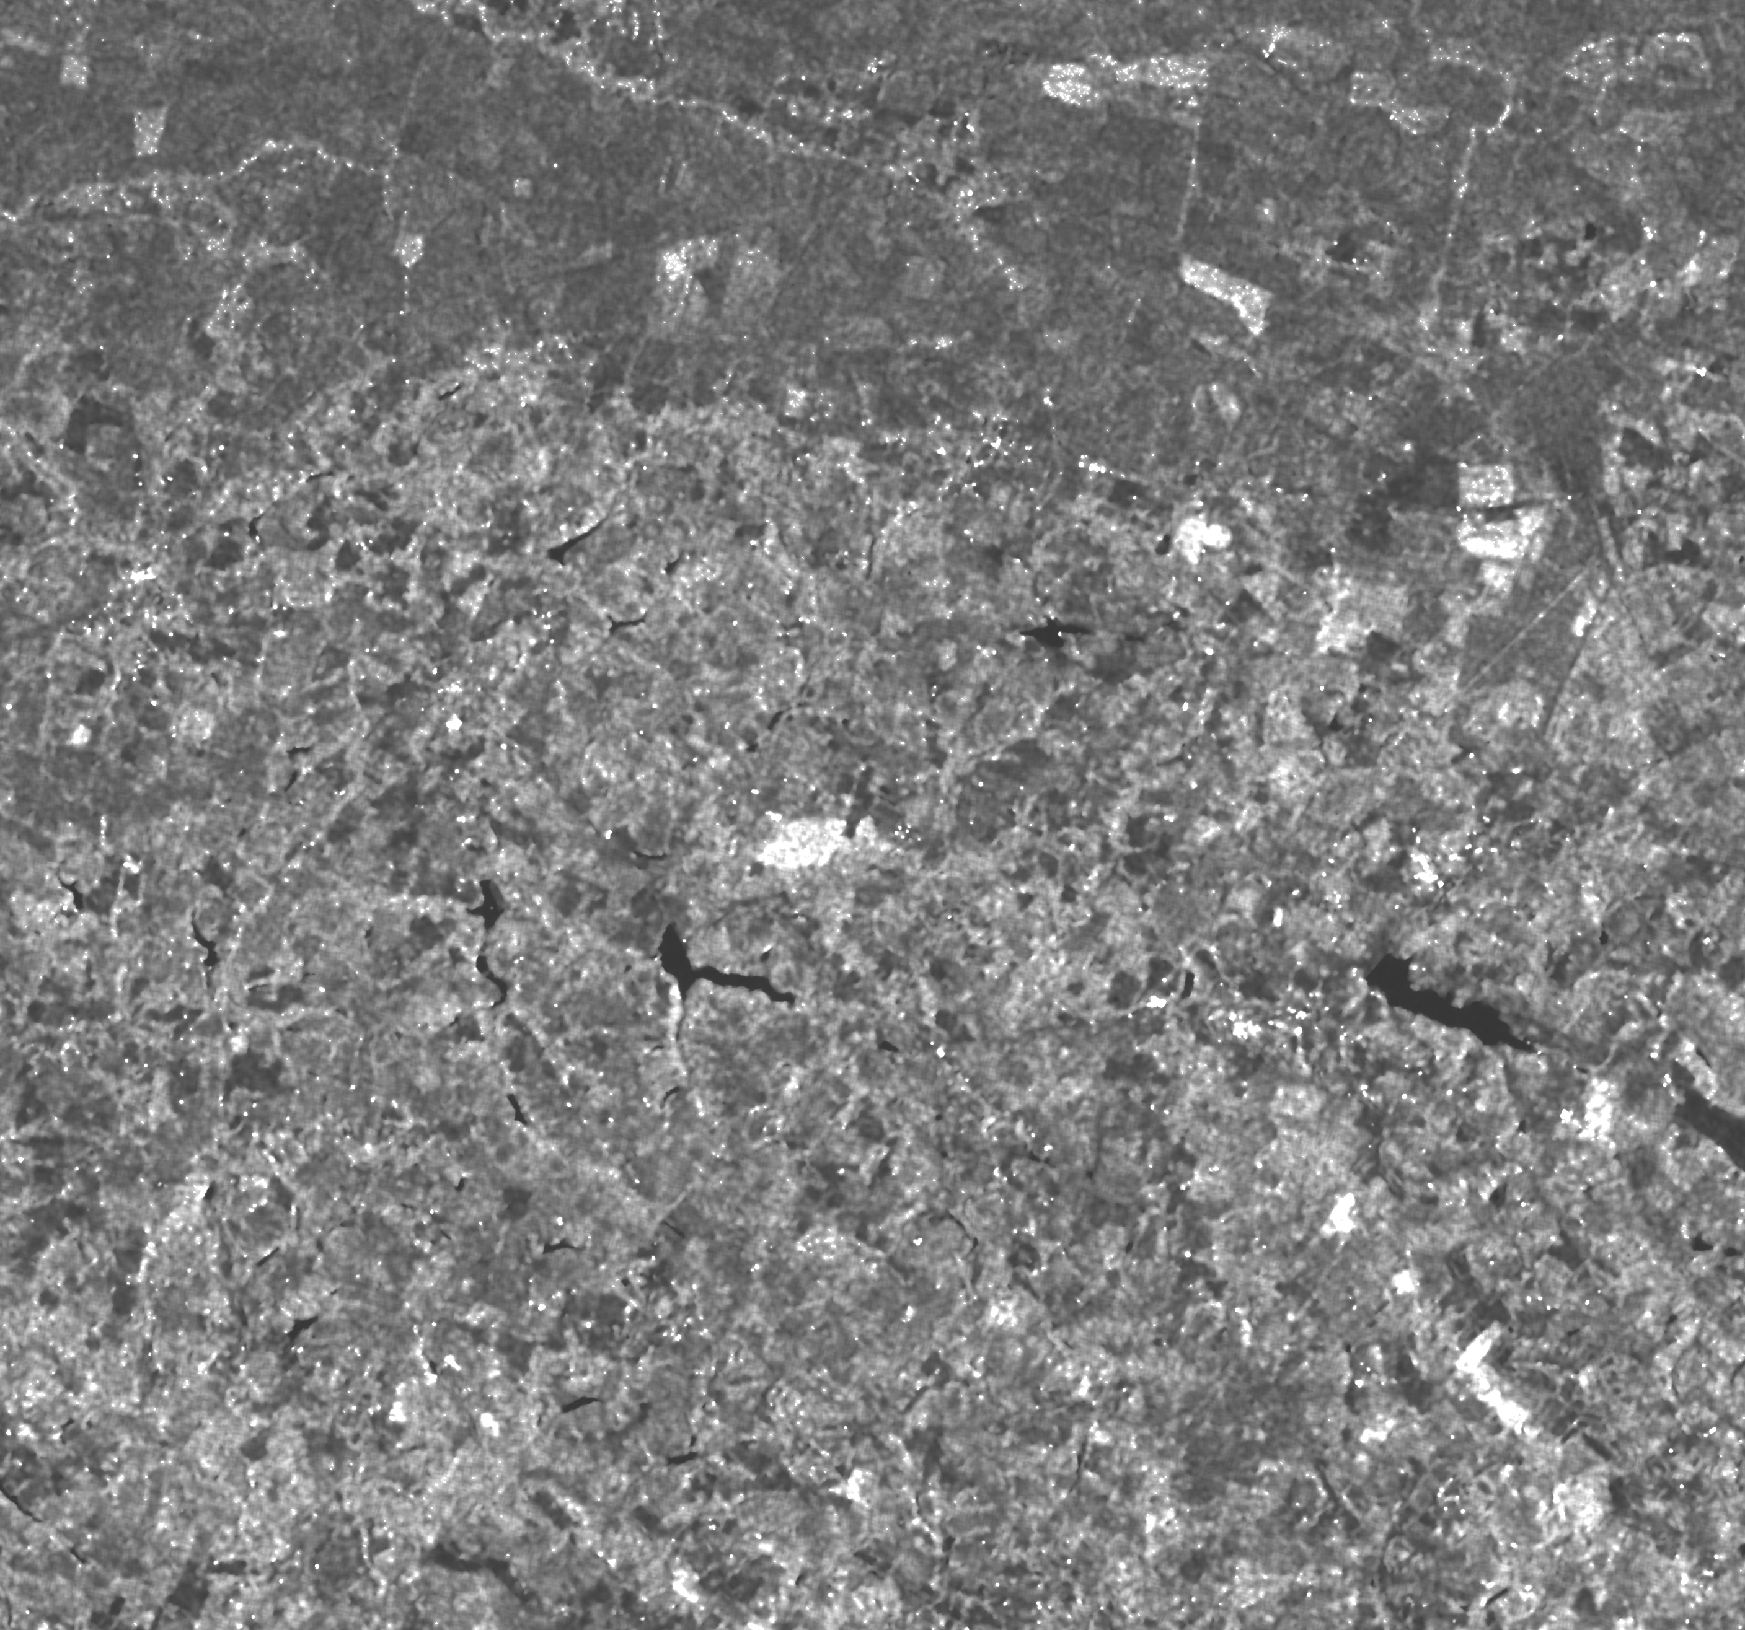
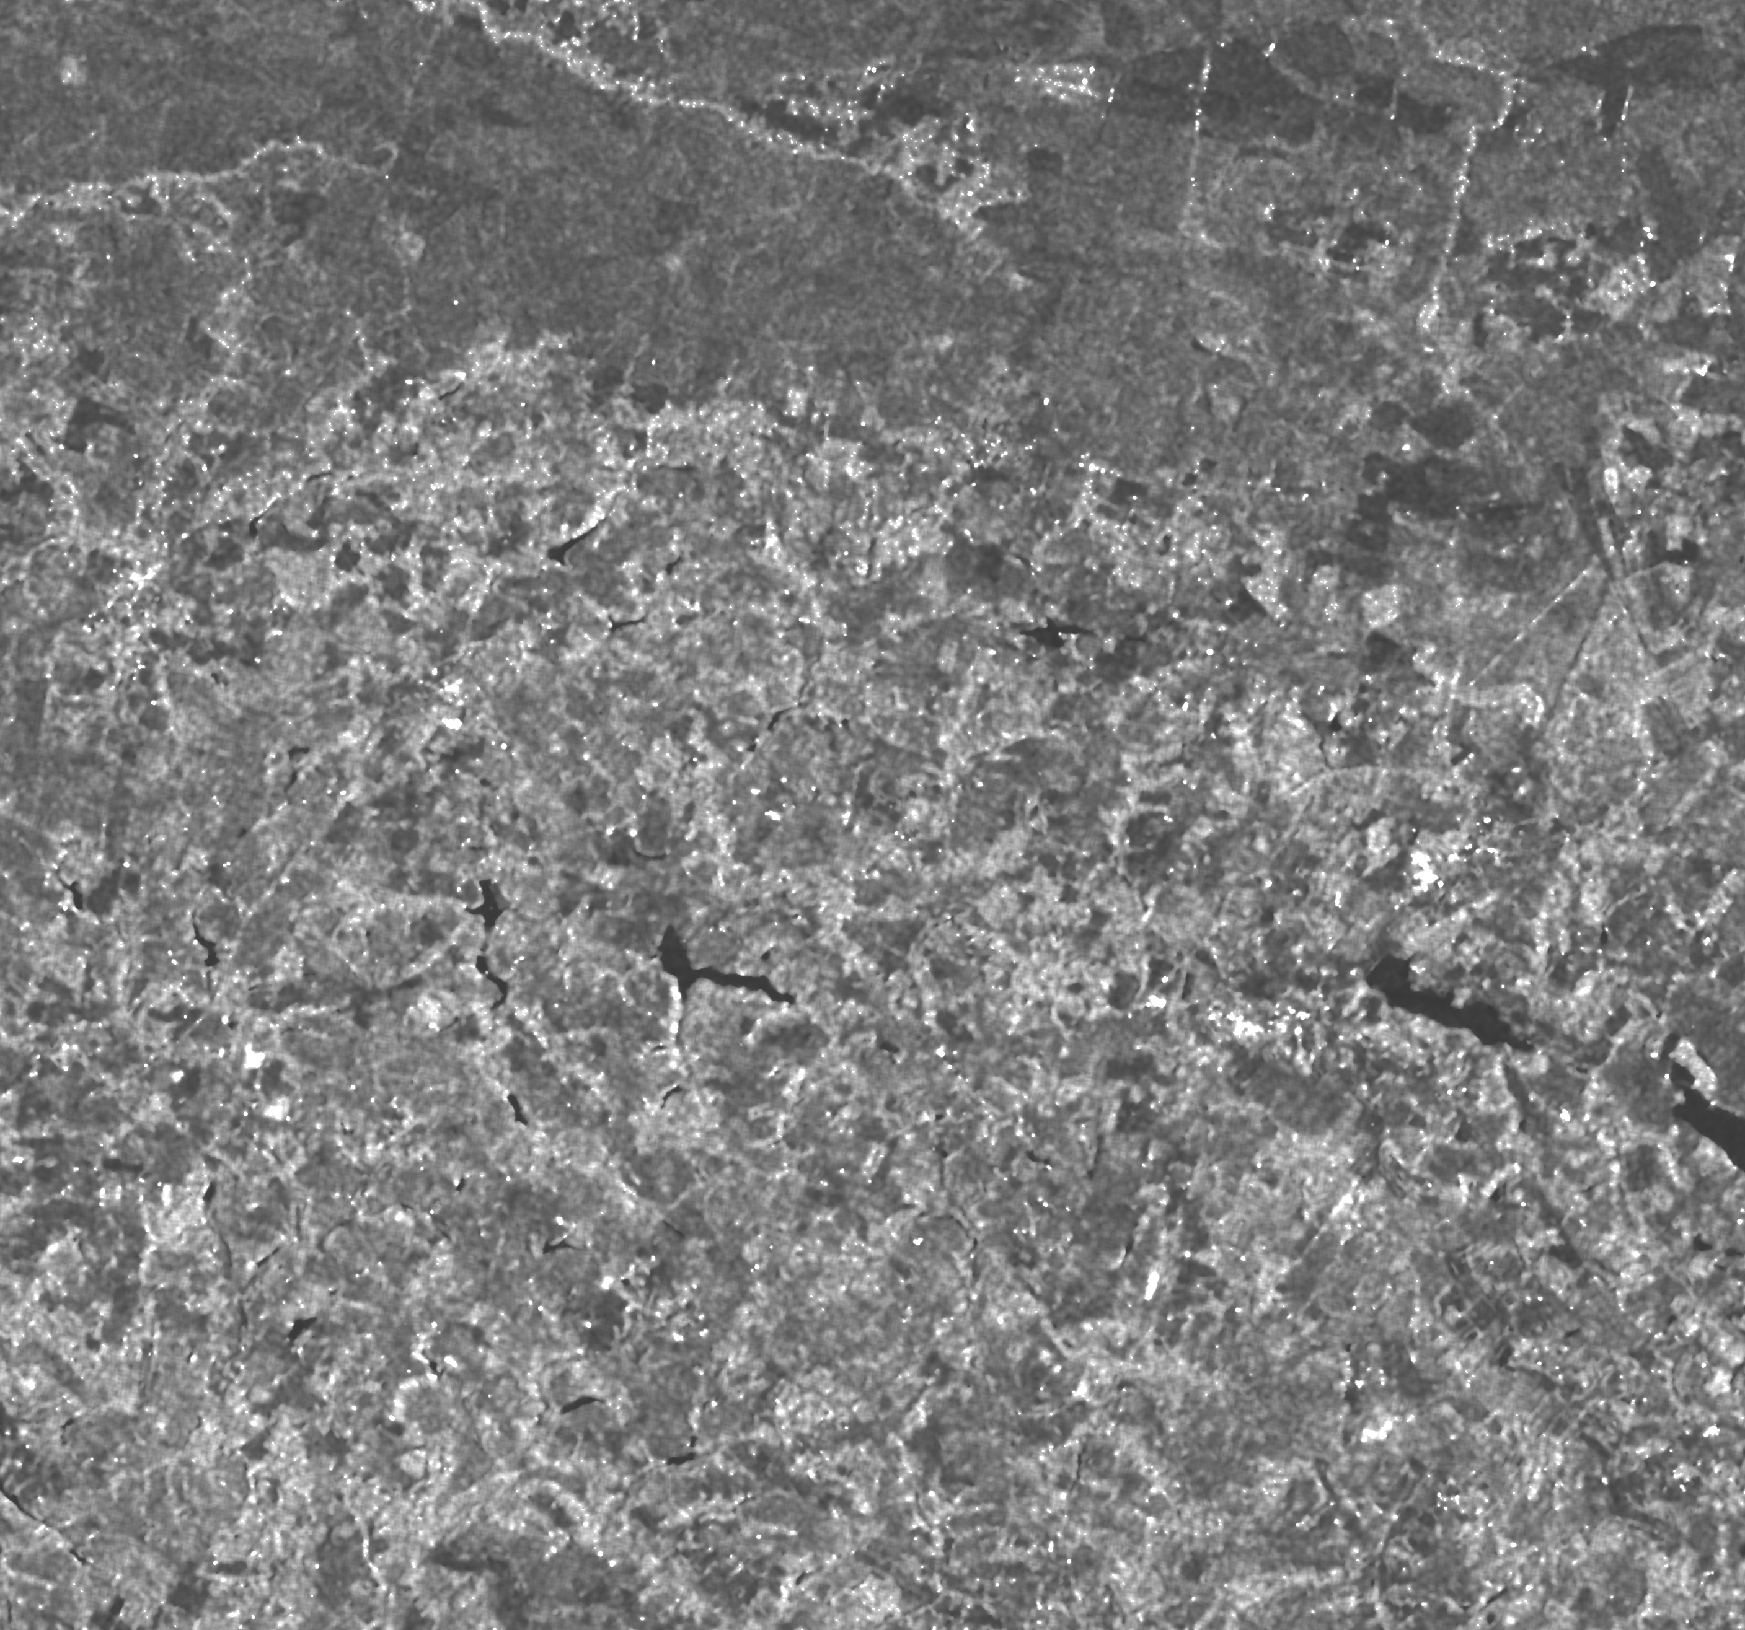
Input data. For each event, we assemble a triplet of Sentinel-1, Level-1 Ground Range Detected (GRD) SAR images, at 10 m spatial resolution. This triplet comprises two pre-event images with varying temporal distances—eliminating rigid constraints for real-world applications—and one post-event image acquired as close as possible to the actual event date. The temporal gap depends on the sensor revisit time and the location on earth. In Kuro Siwo, we have chosen to include only events with a maximum delay of one day. We impose that for each flood event, all three SAR images belong to either the descending or ascending imaging geometry to prevent variations in layover, foreshortening, and shadow effects [18] within the same sample. Additionally, for each SAR image in Kuro Siwo, both VV (Vertical transmit and Vertical receive) and VH (Vertical transmit and Horizontal receive) polarizations are registered, as studies have demonstrated their complementary value for flood mapping [49, 35].
To prepare our data for deep learning methods, we employ a standard Sentinel-1 GRD preprocessing pipeline [27] through the Sentinel Application Platform (SNAP) [99]. This pipeline involves precise orbit application, removal of thermal and border noise, land and sea masking, calibration, speckle filtering, and terrain correction using an external digital elevation model. The output of this pipeline yields a radiometrically calibrated SAR backscatter.
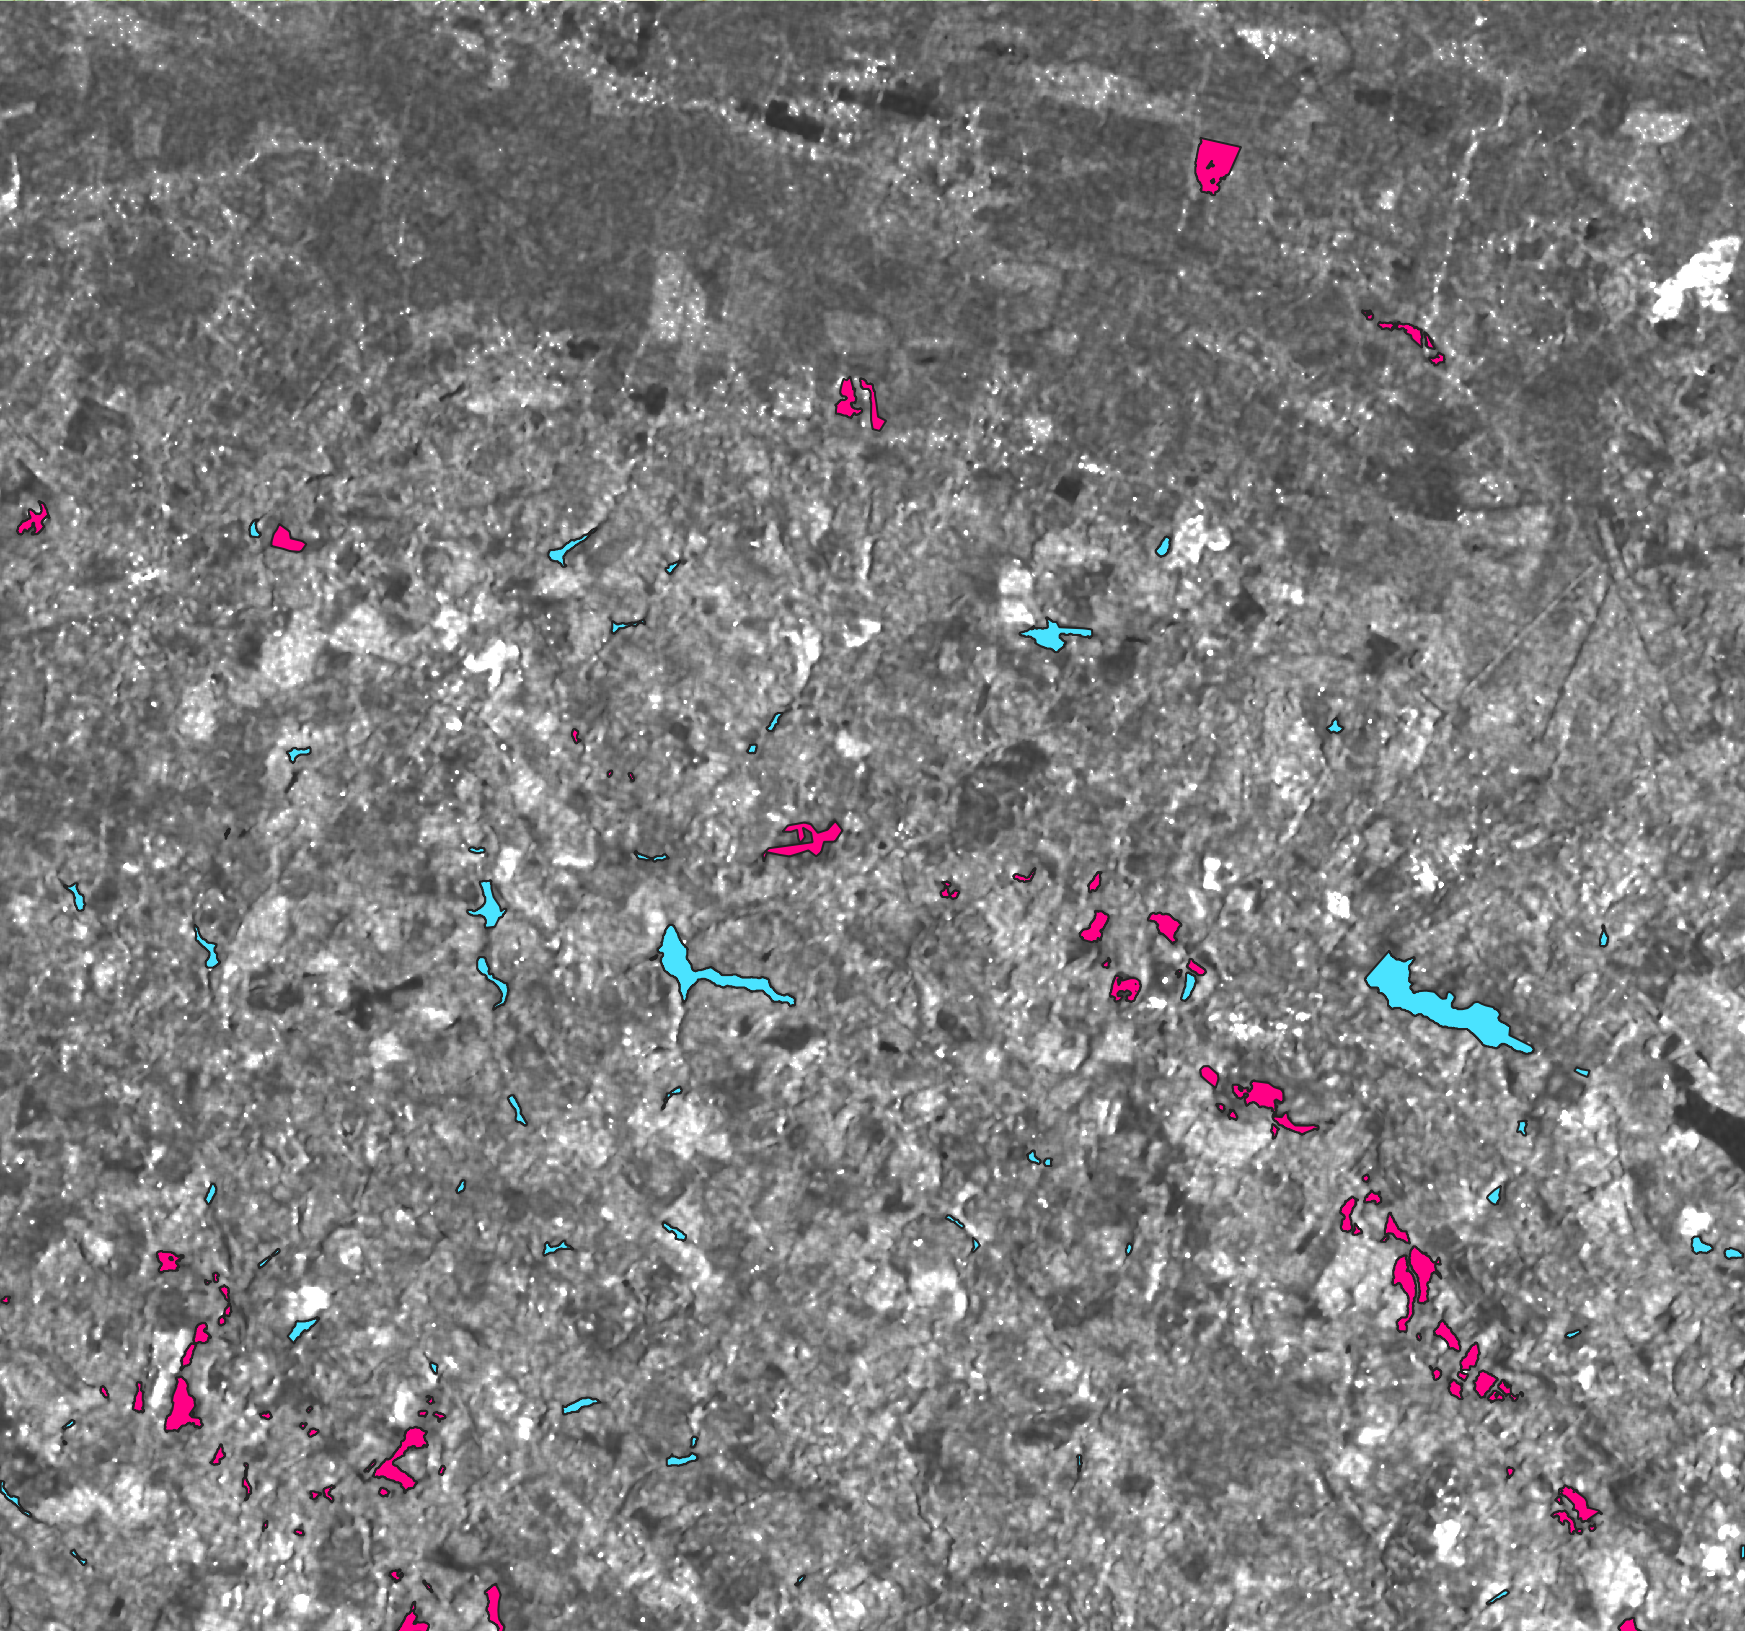
Labeling. We initialize the annotations by utilizing the original shapefiles from CEMS. Subsequently, we engage in the photointerpretation of the preprocessed images to refine these annotations and generate the ground truth masks. The outlined process unfolds in distinct phases: initially, we establish the entire procedure by defining the annotation categories, i.e. Permanent Waters, Floods, and No Water. We extract the corresponding photointerpretation keys, set the annotation scale to 1:1000, and establish criteria for flagging artifacts in the input data. Next, we partitioned the 32 flood events into five segments. A team of five SAR experts undertook the annotation process, with each member assigned to annotate one part and quality-check the annotations of another team member.
The resulting dataset contains time series and unique SAR samples, stored as 224x224 tiles in a PostgreSQL database along with all necessary metadata including the caption dates, the respective climate zone, the id of the area of interest, the Digital Elevation Model, the ground truth mask, etc.
Why update CEMS annotations? Some existing datasets used for rapid flood mapping with Sentinel-1 SAR data rely on the freely available Copernicus Emergency Management Service (CEMS) annotations, which cover a large number of events globally. Typically, these annotations involve a combined thresholding and photointerpretation approach during a CEMS Activation. There are three significant challenges associated with CEMS annotations. Firstly, these Activations require the delivery of flood delineation products within an exceptionally short time frame, usually a few hours upon receiving the satellite imagery, leading to human errors in the annotations. Secondly, different teams within Copernicus annotate various flood events, resulting in variable photointerpretation and methodological biases in the annotations. Lastly, quality standards requirements have evolved in CEMS over the years, and consequently, the latest flood activations provide better quality annotations compared to older ones.
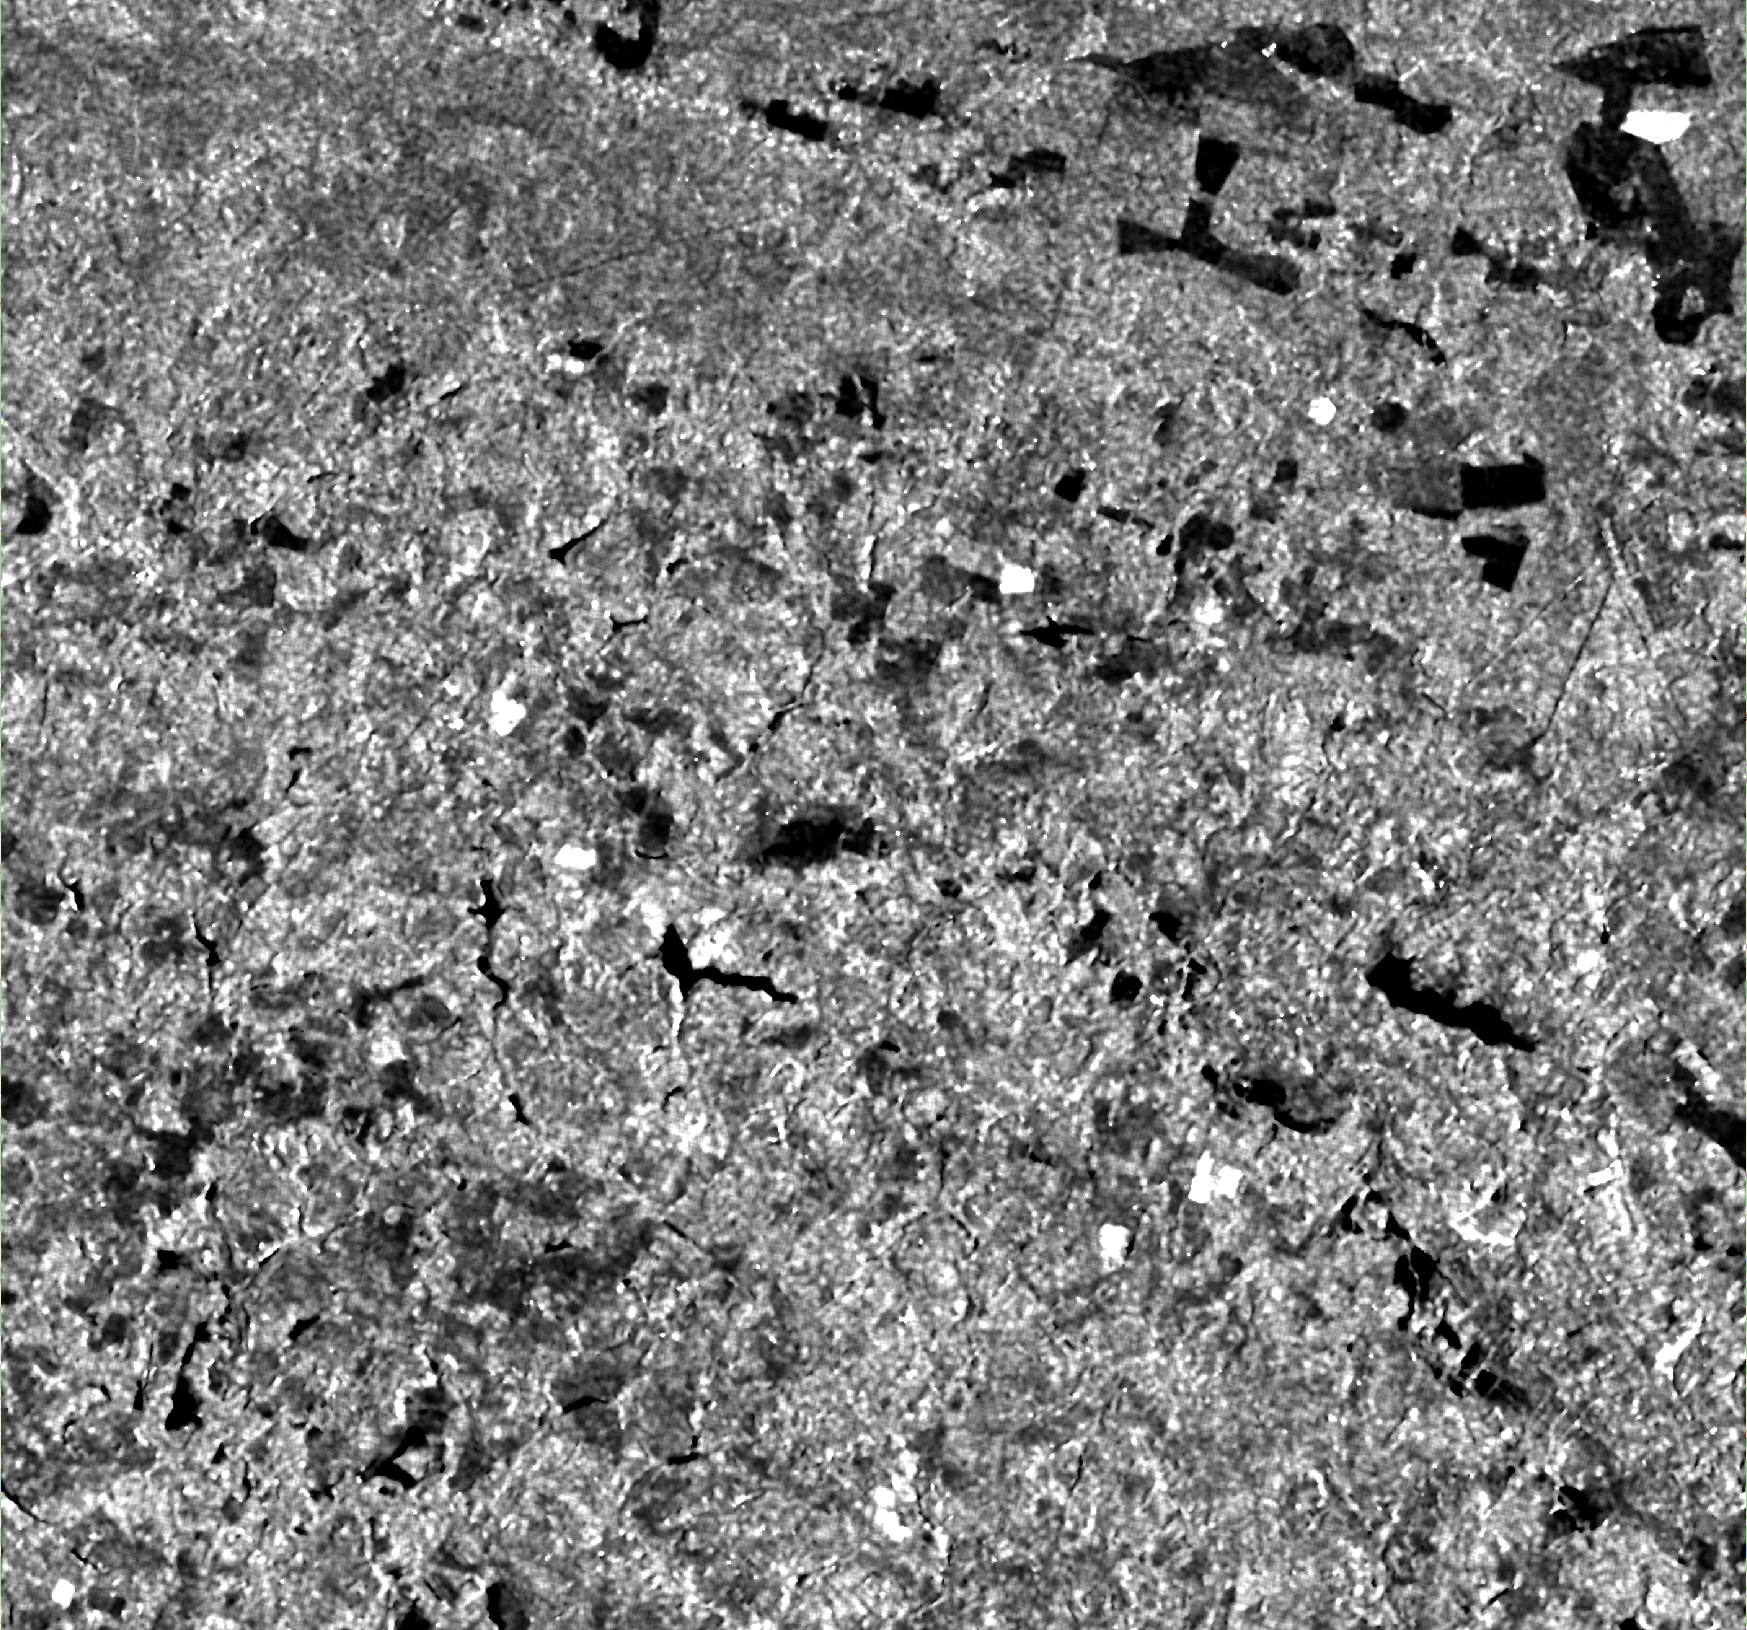
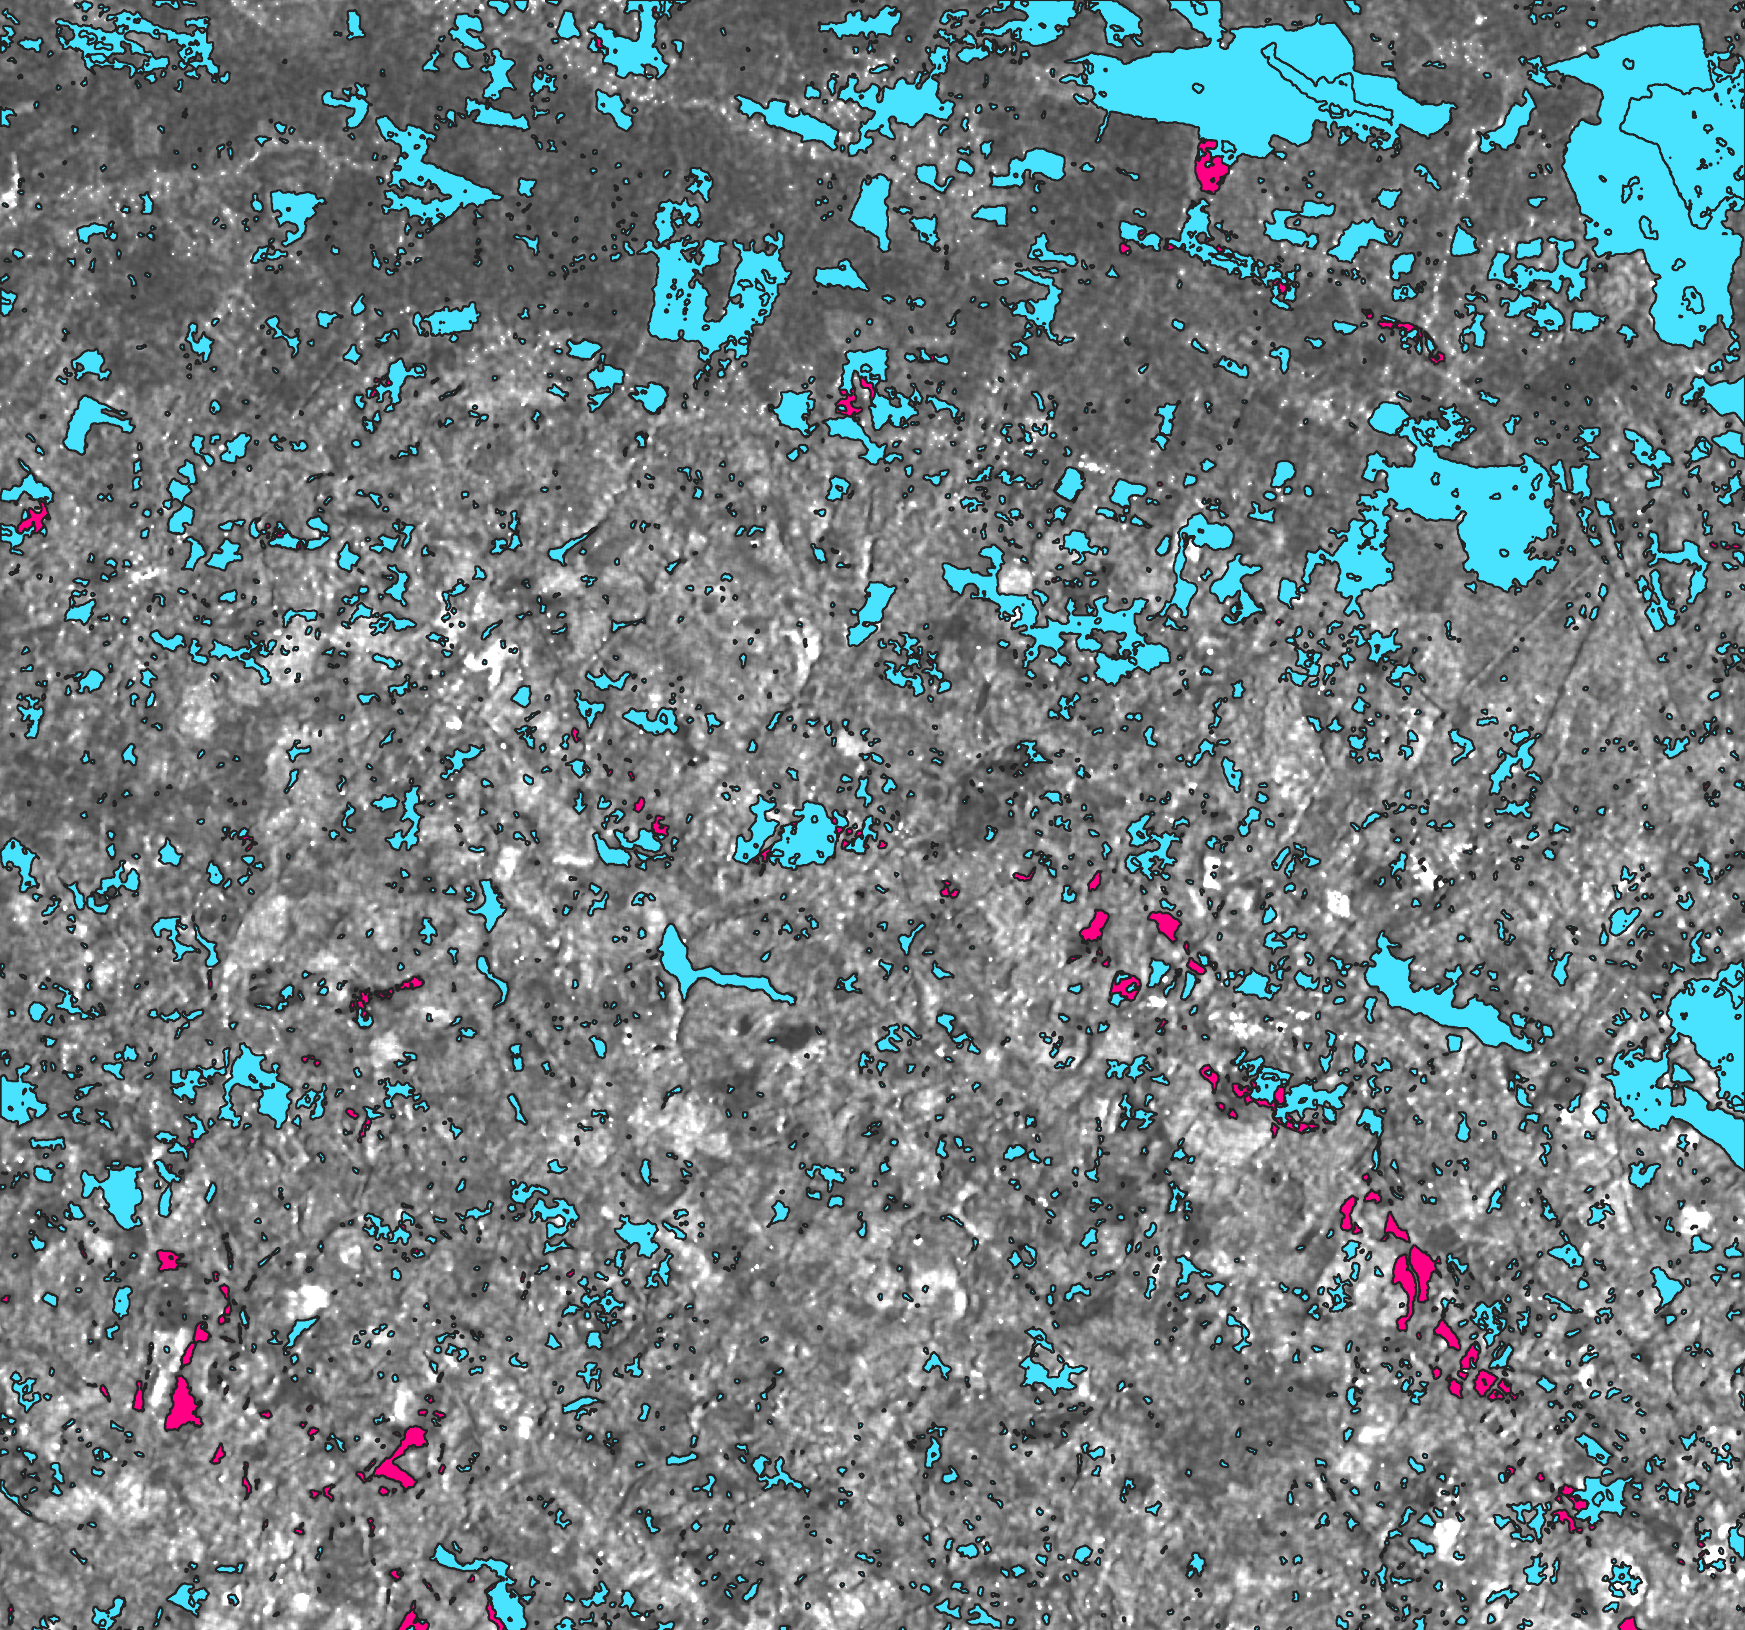
The above result in problematic annotations that hamper the possibility to train robust and accurate deep learning models. For example, the creators of the Ombria [24] and the MMFlood [60] datasets (Tab. 1) that both use CEMS annotations, report low classification accuracies. This was our experience also when we used the original CEMS annotations; our deep learning models achieved less than 70% for all evaluation metrics. Therefore we decided to invest in updating CEMS annotations through photointerpretation. Fig. 2 exemplifies the annotation improvement attained in Kuro Siwo for a flood event in an agricultural area in France. The errors in CEMS annotations, especially for the Permanent Waters class, are obvious when carefully examining both polarizations. To discern the disparity between the CEMS and Kuro Siwo annotation for the specific flood event, the two products exhibit IoU of 51% and 48% for the permanent water and flood dataset, respectively.
Splits. Recognizing the crucial need for a thorough assessment of flood mapping model generalization, we design a rigorous evaluation framework for Kuro Siwo. Specifically, our performance metrics are applied to previously unseen events exhibiting significant spatiotemporal variability, covering all six continents and three climate zones featured in Kuro Siwo. Our test set includes the 2018 flood in Honduras, representing the sole flood event from North America in Kuro Siwo, as well as the 2022 floods of Malawi, the singular flood event from the mainland of southeast Africa. Additionally, our test set encompasses flood events from Greece (2018) and Romania (2020), along with two events from France (2020) and Australia (2022), all located in regions not seen during the training phase. The spatial distribution of training, validation, and test flood events in Kuro Siwo is illustrated in Fig. 1.
Unlabeled component. In the context of natural hazards and extreme events, instances of positive occurrences, such as volcanic unrest [7, 8, 9], landslides [5], and wildfires [44, 65, 45], are notably rare. This scarcity results in a limited dataset, insufficient for mapping the diverse, intricate, and dynamic environmental variables, including water. Furthermore, the number of floods monitored with publicly available SAR imagery is finite, given that Sentinel-1 data are available after 2014 only, while at the same time, acquiring and photointerpreting them all implies a substantial cost.
Recognizing these constraints and the importance of generalizing to unseen events, we offer an extensive, unlabeled collection of satellite frame triplets, adhering to the same principles and preprocessing pipeline as the annotated Kuro Siwo set. This resultant dataset encompasses time series with unique SAR samples. Motivated by recent advancements in foundational models for computer vision [43], we release this dataset to encourage the exploration of SSL methods specifically designed for the domain of rapid flood mapping.
4 BlackBench: An extensive benchmark on rapid flood mapping
| Model | Caps. | DEM | Slope | F1-NW(%) | F1-PW(%) | F1-F(%) | mIOU(%) | F1-W(%) |
|---|---|---|---|---|---|---|---|---|
| UNet-ResNet18 | 3 | ✓ | - | 99 | 68.30 | 84.93 | 74.56 | 86.67 |
| UNet-ResNet50 | 3 | - | - | 98.97 | 68.17 | 84.48 | 74.27 | 86.71 |
| UNet-ResNet101 | 3 | - | - | 98.96 | 68.51 | 84.71 | 74.51 | 86.53 |
| DeepLab-ResNet18 | 3 | - | ✓ | 98.92 | 64.71 | 82.96 | 72.19 | 86.30 |
| DeepLab-ResNet50 | 3 | - | - | 98.96 | 64.38 | 83.71 | 72.47 | 86.65 |
| DeepLab-ResNet101 | 3 | - | - | 98.95 | 65.45 | 84.17 | 73.08 | 86.68 |
| UperNet-SwinS | 3 | - | - | 98.95 | 65.66 | 84.04 | 73.09 | 86.45 |
| UperNet-SwinB | 2 | - | - | 98.98 | 63.78 | 84.12 | 72.47 | 86.80 |
| UperNet-ConvnextS | 3 | - | ✓ | 98.93 | 60.54 | 82.09 | 70.31 | 86.33 |
| UperNet-ConvnextB | 3 | - | - | 98.94 | 63.99 | 82.57 | 71.76 | 85.93 |
| FloodViT-Linear | 3 | - | - | 98.69 | 64.01 | 82.96 | 71.79 | 83.53 |
| FlodViT-Decoder | 3 | - | - | 98.97 | 68.65 | 85.46 | 74.95 | 86.52 |
| FC-EF-Diff | 2 | ✓ | - | 97.26 | 11.33 | 51.9 | 45.24 | 53.29 |
| FC-EF-Conc | 2 | - | - | 98.72 | 48.75 | 75.93 | 63.64 | 81.43 |
| SNUNet-CD | 2 | - | ✓ | 99.07 | 67.45 | 85.82 | 74.73 | 87.58 |
| ADHR-CDNet | 2 | - | - | 99.02 | 63.35 | 82.87 | 71.72 | 87.08 |
| BIT-CD | 2 | - | ✓ | 98.32 | 40.94 | 72.1 | 59.6 | 76.99 |
| TransUNet-CD | 2 | - | - | 99.02 | 59.94 | 81.84 | 70.04 | 86.95 |
Scholastically assessing and comparing the capacity of flood mapping models to operate in novel environments is of great importance to reliably evaluate future methods and eventually deploy them in the real world. With that in mind, we construct a challenging evaluation framework, selecting flood events across the globe as testing sites, covering a wide range of environmental conditions and employ a large set of powerful models to act as baselines .
BlackBench includes common semantic segmentation architectures like U-Net [71], DeepLabv3 [14] and UPerNet [89] using both convolutional and transformer backbones like the ResNet [32] family, Swin Transformer [51] and ConvNext [52]. We use two variants of each backbone for UPerNet indicated as Small (S) and Base (B) as defined in [17]. Furthermore, we include a set of models inspired by change detection problems like FC-EF-Diff and FC-EF-Conc [19], which were among the first deep learning models proposed for this task. Additionally, we include SNUNet-CD [26], a densely connected U-Net++ [98] model with a dual-branch encoder, BIT-CD [12], a model consisting of a transformer encoder and two parallel transformer decoders, and ADHR-CDNet [93], which comprises an HRNet [83] backbone and a multi-scale spatial feature attention module. Furthermore, we design a novel architecture based on TransUNet [13], named TransUNet-CD from here onwards, that employs a U-Net structure whose contracting path is a dual-branch CNN-transformer hybrid encoder. The features extracted from each level are concatenated and fed to a convolutional decoder through skip connections.
For each model included in BlackBench, we assess the performance across diverse input scenarios. The input setting varies on two factors. First, in regards to the temporal resolution and second, in regards to the inclusion of elevation information. For all semantic segmentation models we consider time series of either 2 or 3 images varying the number of pre-event captions. For the change detection models we strictly use two captions by selecting only the most recent pre-flood image since this family of architectures usually employs a two-stream input encoder. For each temporal resolution, we examine the performance of the models when we a) include a DEM, b) include slope information (derived from the DEM) and c) provide no elevation information at all. In Tab. 2 we report the performance of the best setting for each architecture. In particular, we report the F1-Score (F1) for each class as well as the overall mean IoU (mIoU). Additionally, we evaluate the F1-Score for the binary task of water detection by combining the predictions for permanent water and flood into one “water” class. All semantic segmentation models use pretrained backbones and were trained for 20 epochs. U-Net and DeepLabv3 models use backbones pretrained on ImageNet [20], while UPerNet uses backbones from [17]. Change detection models were trained from scratch for 180 epochs.
To showcase the potential of large-scale SSL for rapid flood mapping we make use of the multi-temporal unlabeled dataset provided in this work. To model interactions in the temporal dimension as well as make the finetuning to the flood mapping task more direct, we consider each Kuro Siwo triplet as one sample. For the SSL pretraining we use the Masked Autoencoder [33] (MAE) method. We use a vision transformer [23] (ViT) with 24 layers and 16 attention heads as our encoder for the MAE and train for 100 epochs. The triplets are stacked on the channel dimension as done with all segmentation methods in BlackBench. We assess the quality of our encoder under two evaluation schemes. The first relies on the linear evaluation protocol, where we upsample the representation of each token to its original dimension and attach a linear layer on top to perform the pixel-based classification. From now on, we will refer to this model as FloodViT-Linear. For the second evaluation scheme, we add a simple, trainable, convolutional decoder on top of the learnt representations and finetune on the downstream task. Hereafter, we will refer to this transformer-CNN hybrid as FloodViT-Decoder. We discuss the insights gained from BlackBench in detail in Sec. 5.


5 Discussion
Quantitatively comparing Kuro Siwo to other datasets is very hard, as most publicly available SAR based datasets do not follow the same evaluation principles, which are to evaluate on events not present at training time and have a diverse set of test events. We identify MMFlood as the most fitting dataset for our comparison, offering 34 test events with labels acquired from CEMS. The authors report a maximum of mIoU solving the binary flood/no flood task, which is significantly lower than the one presented in BlackBench, where we solve a multi-class problem. This may be an indirect consequence of the problematic nature of CEMS labels as discussed in Sec. 3 and an indicator for the importance of accurate and cross verified ground truth labels.
Examining Tab. 2, we immediately notice the importance of the temporal aspect for the semantic segmentation models, with the majority of them performing the best when using all available pre-event captions. The superior quality of Kuro Siwo is evident as the majority of the models in BlackBench are able to achieve high performance, i.e more than 82% F1-Score at detecting flooded areas and more than 85% in the binary task of detecting water. This is particularly encouraging since all models are tested on very different conditions than the ones they were trained on as can be seen in Fig. 1. The goal of BlackBench, however, is not to announce a new state-of-the-art architecture for rapid flood mapping, but rather to create strong baselines for future methods. Interestingly enough, we notice that FloodViT-Decoder achieved the highest mean IoU with SNUNet-CD achieving comparable performance.
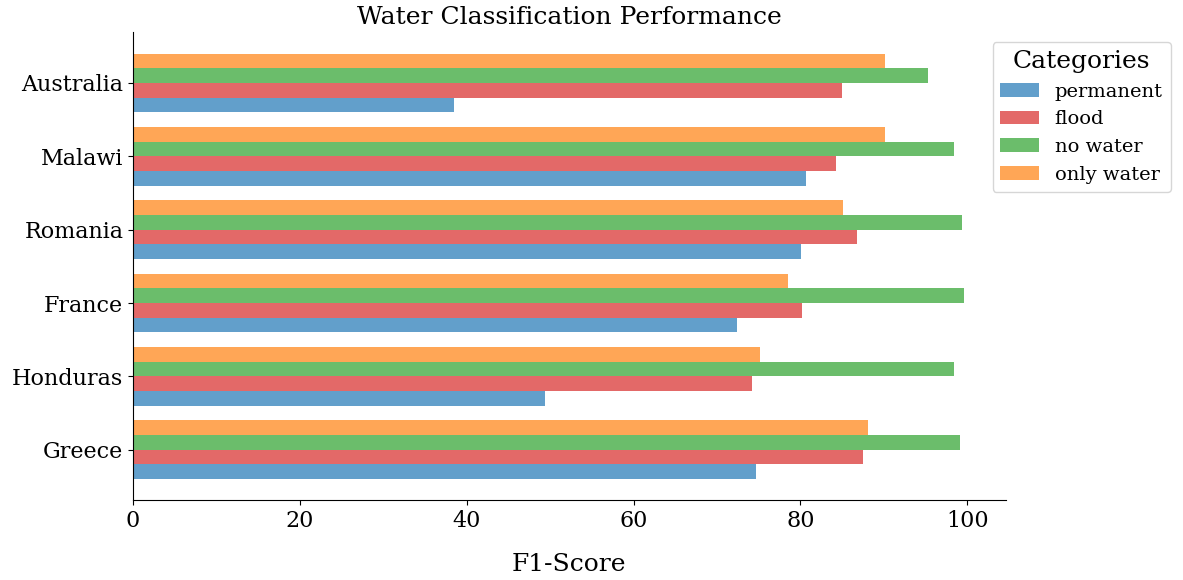
Looking deeper at BlackBench we notice a high discrepancy between the reported metrics for permanent water bodies and the rest of the classes. To get some insights on this phenomenon we present the per-event performance of our best performing model, i.e FloodViT-Decoder, in Fig. 3. Observing the drastic performance improvement on the binary task we hypothesize that this behaviour stems from the inherent challenge of discerning permanent water bodies from flooded areas in specific locations, especially close to overflowed rivers and lakes. This problem is magnified by the constant flow of water, resulting in small changes in the area it populates which in turn materializes with different signatures for each SAR timestep. Another factor for such behaviour could be attributed to sensor specific noise, e.g speckle noise. In real world applications with imperfect data streams, we must be able to process such lower quality satellite captions to promptly react to extreme events. We validate these assumptions with a qualitative examination of our best model’s predictions in Fig. 4. For our investigation we select the flood event in Honduras, where performance in permanent waters was particularly low, and the flood in Malawi where the F1-Score for the permanent water class was comparable with the rest of the water classes. The good performance in the generic “water” class is clear in the visual examination as well. As hypothesized, however, problems may arise in flooded permanent water bodies where exact delineation is particularly challenging. This phenomenon is manifested in both Fig. 4(a) and Fig. 4(b), which provide a solid demonstration of the inherent complexity of discerning an accurate outline for a river which is a dynamic, moving body of water. Furthermore, the second row of each region show submerged river islands that proved hard for the model to discriminate. This may be a result of a minute misalignment between the different captions that the model could not successfully resolve in order to identify the small isolated patches of land. Finally, in Fig. 4(b), where the permanent waters are very well detected, the predicted mask is not as detailed as the ground truth. This coarse mapping may indicate that the excessive speckle noise in the post-event imagery has interfered with the model’s ability to properly identify the flooded area and further research could potentially propel the design of techniques more robust to the intricacies of SAR data. Increasing the amount of captions may also prove to be a helpful asset for developing mapping methods, albeit a rather costly and resource consuming process. More samples from Kuro Siwo are provided in Appendix A.
6 Conclusion
With this work we release Kuro Siwo, a global, multi-temporal SAR dataset for flood mapping. Kuro Siwo contains manual annotations for 32 flood events across the globe, providing time series of SAR data with dual polarization and elevation information. Along with the curated dataset we release a large unlabeled dataset for large-scale SSL. Finally, we release BlackBench, the first unified benchmark on Kuro Siwo providing strong baselines on rapid flood mapping. BlackBench highlights consistent high performances in a challenging test set covering 6 out 7 continents. We strongly believe that the release of Kuro Siwo will propel research in the crucial task of rapid flood mapping, potentially aiding in disaster response and relief management.
References
- Aparna et al. [2022] A Aparna, N Sudha, et al. Sar-floodnet: A patch-based convolutional neural network for flood detection on sar images. In 2022 International Conference on Applied Artificial Intelligence and Computing (ICAAIC), pages 195–200. IEEE, 2022.
- Bai et al. [2021] Yanbing Bai, Wenqi Wu, Zhengxin Yang, Jinze Yu, Bo Zhao, Xing Liu, Hanfang Yang, Erick Mas, and Shunichi Koshimura. Enhancement of detecting permanent water and temporary water in flood disasters by fusing sentinel-1 and sentinel-2 imagery using deep learning algorithms: Demonstration of sen1floods11 benchmark datasets. Remote Sensing, 13(11):2220, 2021.
- Bates et al. [2014] Paul D Bates, Jefferey C Neal, Douglas Alsdorf, and Guy J-P Schumann. Observing global surface water flood dynamics. The Earth’s Hydrological Cycle, pages 839–852, 2014.
- Bevacqua et al. [2020] Emanuele Bevacqua, Michalis I. Vousdoukas, Giuseppe Zappa, Kevin Hodges, Theodore G. Shepherd, Douglas Maraun, Lorenzo Mentaschi, and Luc Feyen. More meteorological events that drive compound coastal flooding are projected under climate change. Communications Earth & Environment, 1(1):47, 2020.
- Böhm et al. [2022] Vanessa Böhm, Wei Ji Leong, Ragini Bal Mahesh, Ioannis Prapas, Edoardo Nemni, Freddie Kalaitzis, Siddha Ganju, and Raul Ramos-Pollan. Sar-based landslide classification pretraining leads to better segmentation. arXiv preprint arXiv:2211.09927, 2022.
- Bonafilia et al. [2020] Derrick Bonafilia, Beth Tellman, Tyler Anderson, and Erica Issenberg. Sen1floods11: A georeferenced dataset to train and test deep learning flood algorithms for sentinel-1. In Proceedings of the IEEE/CVF Conference on Computer Vision and Pattern Recognition Workshops, pages 210–211, 2020.
- Bountos et al. [2021] Nikolaos Ioannis Bountos, Ioannis Papoutsis, Dimitrios Michail, and Nantheera Anantrasirichai. Self-supervised contrastive learning for volcanic unrest detection. IEEE Geoscience and Remote Sensing Letters, 19:1–5, 2021.
- Bountos et al. [2022a] Nikolaos Ioannis Bountos, Dimitrios Michail, and Ioannis Papoutsis. Learning from synthetic insar with vision transformers: the case of volcanic unrest detection. IEEE Transactions on Geoscience and Remote Sensing, 60:1–12, 2022a.
- Bountos et al. [2022b] Nikolaos Ioannis Bountos, Ioannis Papoutsis, Dimitrios Michail, Andreas Karavias, Panagiotis Elias, and Isaak Parcharidis. Hephaestus: A large scale multitask dataset towards insar understanding. In Proceedings of the IEEE/CVF Conference on Computer Vision and Pattern Recognition, pages 1453–1462, 2022b.
- Brivio et al. [2002] PA Brivio, R Colombo, M Maggi, and R Tomasoni. Integration of remote sensing data and gis for accurate mapping of flooded areas. International Journal of Remote Sensing, 23(3):429–441, 2002.
- Brouwer et al. [2007] Roy Brouwer, Sonia Akter, Luke Brander, and Enamul Haque. Socioeconomic vulnerability and adaptation to environmental risk: a case study of climate change and flooding in bangladesh. Risk Analysis: An International Journal, 27(2):313–326, 2007.
- Chen et al. [2021a] Hao Chen, Zipeng Qi, and Zhenwei Shi. Remote sensing image change detection with transformers. IEEE Transactions on Geoscience and Remote Sensing, 60:1–14, 2021a.
- Chen et al. [2021b] Jieneng Chen, Yongyi Lu, Qihang Yu, Xiangde Luo, Ehsan Adeli, Yan Wang, Le Lu, Alan L. Yuille, and Yuyin Zhou. Transunet: Transformers make strong encoders for medical image segmentation. arXiv preprint arXiv:2102.04306, 2021b.
- Chen et al. [2017] Liang-Chieh Chen, George Papandreou, Florian Schroff, and Hartwig Adam. Rethinking atrous convolution for semantic image segmentation. arXiv preprint arXiv:1706.05587, 2017.
- Chouhan et al. [2023] Avinash Chouhan, Dibyajyoti Chutia, and Shiv Prasad Aggarwal. Attentive decoder network for flood analysis using sentinel 1 images. In 2023 International Conference on Communication, Circuits, and Systems (IC3S), pages 1–5, BHUBANESWAR, India, 2023. IEEE.
- Cian et al. [2018] Fabio Cian, Mattia Marconcini, and Pietro Ceccato. Normalized difference flood index for rapid flood mapping: Taking advantage of eo big data. Remote Sensing of Environment, 209:712–730, 2018.
- Contributors [2020] MMSegmentation Contributors. MMSegmentation: Openmmlab semantic segmentation toolbox and benchmark. https://github.com/open-mmlab/mmsegmentation, 2020.
- Cumming and Wong [2005] Ian G Cumming and Frank H Wong. Digital processing of synthetic aperture radar data. Artech house, 1(3):108–110, 2005.
- Daudt et al. [2018] Rodrigo Caye Daudt, Bertrand Le Saux, and Alexandre Boulch. Fully Convolutional Siamese Networks for Change Detection. arXiv:1810.08462 [cs], 2018. arXiv: 1810.08462.
- Deng et al. [2009] Jia Deng, Wei Dong, Richard Socher, Li-Jia Li, Kai Li, and Li Fei-Fei. Imagenet: A large-scale hierarchical image database. In 2009 IEEE conference on computer vision and pattern recognition, pages 248–255. Ieee, 2009.
- Domeneghetti et al. [2019] Alessio Domeneghetti, Guy J-P Schumann, and Angelica Tarpanelli. Preface: remote sensing for flood mapping and monitoring of flood dynamics. Remote Sensing, 11(8):943, 2019.
- Dong et al. [2023] Zhen Dong, Zifan Liang, Guojie Wang, Solomon Obiri Yeboah Amankwah, Donghan Feng, Xikun Wei, and Zheng Duan. Mapping inundation extents in Poyang Lake area using Sentinel-1 data and transformer-based change detection method. Journal of Hydrology, 620:129455, 2023.
- Dosovitskiy et al. [2020] Alexey Dosovitskiy, Lucas Beyer, Alexander Kolesnikov, Dirk Weissenborn, Xiaohua Zhai, Thomas Unterthiner, Mostafa Dehghani, Matthias Minderer, Georg Heigold, Sylvain Gelly, et al. An image is worth 16x16 words: Transformers for image recognition at scale. arXiv preprint arXiv:2010.11929, 2020.
- Drakonakis et al. [2022] Georgios I. Drakonakis, Grigorios Tsagkatakis, Konstantina Fotiadou, and Panagiotis Tsakalides. Ombrianet—supervised flood mapping via convolutional neural networks using multitemporal sentinel-1 and sentinel-2 data fusion. IEEE Journal of Selected Topics in Applied Earth Observations and Remote Sensing, 15:2341–2356, 2022.
- Eini et al. [2020] Mohammad Eini, Hesam Seyed Kaboli, Mohsen Rashidian, and Hossein Hedayat. Hazard and vulnerability in urban flood risk mapping: Machine learning techniques and considering the role of urban districts. International Journal of Disaster Risk Reduction, 50:101687, 2020.
- Fang et al. [2021] Sheng Fang, Kaiyu Li, Jinyuan Shao, and Zhe Li. Snunet-cd: A densely connected siamese network for change detection of vhr images. IEEE Geoscience and Remote Sensing Letters, 19:1–5, 2021.
- Filipponi [2019] Federico Filipponi. Sentinel-1 grd preprocessing workflow. In International Electronic Conference on Remote Sensing, page 11. MDPI, 2019.
- Garg et al. [2023] Shubhika Garg, Ben Feinstein, Shahar Timnat, Vishal Batchu, Gideon Dror, Adi Gerzi Rosenthal, and Varun Gulshan. Cross modal distillation for flood extent mapping. arXiv preprint arXiv:2302.08180, 2023.
- Gaume et al. [2009] Eric Gaume, Valerie Bain, Pietro Bernardara, Olivier Newinger, Mihai Barbuc, Allen Bateman, Lotta Blaškovičová, Günter Blöschl, Marco Borga, Alexandru Dumitrescu, et al. A compilation of data on european flash floods. Journal of Hydrology, 367(1-2):70–78, 2009.
- Gong et al. [2017] Maoguo Gong, Hailun Yang, and Puzhao Zhang. Feature learning and change feature classification based on deep learning for ternary change detection in sar images. ISPRS Journal of Photogrammetry and Remote Sensing, 129:212–225, 2017.
- Graham-McLay [2023] Charlotte Graham-McLay. Auckland floods: city begins clean-up after ‘biggest climate event’ in New Zealand’s history. The Guardian, 2023.
- He et al. [2016] Kaiming He, Xiangyu Zhang, Shaoqing Ren, and Jian Sun. Deep residual learning for image recognition. In Proceedings of the IEEE conference on computer vision and pattern recognition, pages 770–778, 2016.
- He et al. [2022] Kaiming He, Xinlei Chen, Saining Xie, Yanghao Li, Piotr Dollár, and Ross Girshick. Masked autoencoders are scalable vision learners. In Proceedings of the IEEE/CVF conference on computer vision and pattern recognition, pages 16000–16009, 2022.
- He et al. [2023] Xiaoning He, Shuangcheng Zhang, Bowei Xue, Tong Zhao, and Tong Wu. Cross-modal change detection flood extraction based on convolutional neural network. International Journal of Applied Earth Observation and Geoinformation, 117:103197, 2023.
- Henry et al. [2006] J-B Henry, P Chastanet, K Fellah, and Y-L Desnos. Envisat multi-polarized asar data for flood mapping. International Journal of Remote Sensing, 27(10):1921–1929, 2006.
- Islam et al. [2020] Kazi Aminul Islam, Mohammad Shahab Uddin, Chiman Kwan, and Jiang Li. Flood detection using multi-modal and multi-temporal images: A comparative study. Remote Sensing, 12(15):2455, 2020.
- Ji et al. [2022] L. Ji, Z. Zhao, W. Huo, J. Zhao, and R. Gao. Evaluation of several fully convolutional network in sar image change detection. ISPRS Annals of the Photogrammetry, Remote Sensing and Spatial Information Sciences, X-3/W1-2022:61–68, 2022.
- Jiang et al. [2021] Xin Jiang, Shijing Liang, Xinyue He, Alan D. Ziegler, Peirong Lin, Ming Pan, Dashan Wang, Junyu Zou, Dalei Hao, Ganquan Mao, Yelu Zeng, Jie Yin, Lian Feng, Chiyuan Miao, Eric F. Wood, and Zhenzhong Zeng. Rapid and large-scale mapping of flood inundation via integrating spaceborne synthetic aperture radar imagery with unsupervised deep learning. ISPRS Journal of Photogrammetry and Remote Sensing, 178:36–50, 2021.
- Jongman et al. [2015] Brenden Jongman, Jurjen Wagemaker, Beatriz Revilla Romero, and Erin Coughlan de Perez. Early flood detection for rapid humanitarian response: harnessing near real-time satellite and twitter signals. ISPRS International Journal of Geo-Information, 4(4):2246–2266, 2015.
- Jonkman [2005] Sebastiaan N Jonkman. Global perspectives on loss of human life caused by floods. Natural hazards, 34(2):151–175, 2005.
- Kang et al. [2018] Wenchao Kang, Yuming Xiang, Feng Wang, Ling Wan, and Hongjian You. Flood detection in gaofen-3 sar images via fully convolutional networks. Sensors, 18(9):2915, 2018.
- Katiyar et al. [2021] Vaibhav Katiyar, Nopphawan Tamkuan, and Masahiko Nagai. Near-real-time flood mapping using off-the-shelf models with sar imagery and deep learning. Remote Sensing, 13(12):2334, 2021.
- Kirillov et al. [2023] Alexander Kirillov, Eric Mintun, Nikhila Ravi, Hanzi Mao, Chloe Rolland, Laura Gustafson, Tete Xiao, Spencer Whitehead, Alexander C Berg, Wan-Yen Lo, et al. Segment anything. arXiv preprint arXiv:2304.02643, 2023.
- Kondylatos et al. [2022] Spyros Kondylatos, Ioannis Prapas, Michele Ronco, Ioannis Papoutsis, Gustau Camps-Valls, María Piles, Miguel-Ángel Fernández-Torres, and Nuno Carvalhais. Wildfire danger prediction and understanding with deep learning. Geophysical Research Letters, 49(17):e2022GL099368, 2022.
- Kondylatos et al. [2023] Spyros Kondylatos, Ioannis Prapas, Gustau Camps-Valls, and Ioannis Papoutsis. Mesogeos: A multi-purpose dataset for data-driven wildfire modeling in the mediterranean. arXiv preprint arXiv:2306.05144, 2023.
- Kreibich et al. [2015] Heidi Kreibich, Philip Bubeck, Mathijs Van Vliet, and Hans De Moel. A review of damage-reducing measures to manage fluvial flood risks in a changing climate. Mitigation and adaptation strategies for global change, 20:967–989, 2015.
- Lee et al. [1994] Jong-Sen Lee, L Jurkevich, Piet Dewaele, Patrick Wambacq, and André Oosterlinck. Speckle filtering of synthetic aperture radar images: A review. Remote sensing reviews, 8(4):313–340, 1994.
- Li et al. [2019] Yu Li, Sandro Martinis, and Marc Wieland. Urban flood mapping with an active self-learning convolutional neural network based on terrasar-x intensity and interferometric coherence. ISPRS Journal of Photogrammetry and Remote Sensing, 152:178–191, 2019.
- Liu et al. [2019] Bin Liu, Xiaofeng Li, and Gang Zheng. Coastal inundation mapping from bitemporal and dual-polarization sar imagery based on deep convolutional neural networks. Journal of Geophysical Research: Oceans, 124(12):9101–9113, 2019.
- Liu et al. [2023] Qiang Liu, Kai Ren, Xiangchao Meng, and Feng Shao. Domain adaptive cross-reconstruction for change detection of heterogeneous remote sensing images via a feedback guidance mechanism. IEEE Transactions on Geoscience and Remote Sensing, 2023.
- Liu et al. [2021] Ze Liu, Yutong Lin, Yue Cao, Han Hu, Yixuan Wei, Zheng Zhang, Stephen Lin, and Baining Guo. Swin transformer: Hierarchical vision transformer using shifted windows. In Proceedings of the IEEE/CVF international conference on computer vision, pages 10012–10022, 2021.
- Liu et al. [2022] Zhuang Liu, Hanzi Mao, Chao-Yuan Wu, Christoph Feichtenhofer, Trevor Darrell, and Saining Xie. A convnet for the 2020s. In Proceedings of the IEEE/CVF Conference on Computer Vision and Pattern Recognition, pages 11976–11986, 2022.
- Martinez and Le Toan [2007] Jean-Michel Martinez and Thuy Le Toan. Mapping of flood dynamics and spatial distribution of vegetation in the amazon floodplain using multitemporal sar data. Remote sensing of Environment, 108(3):209–223, 2007.
- Martinez-Villalobos and Neelin [2023] Cristian Martinez-Villalobos and J David Neelin. Regionally high risk increase for precipitation extreme events under global warming. Scientific Reports, 13(1):5579, 2023.
- Mateo-Garcia et al. [2021] Gonzalo Mateo-Garcia, Joshua Veitch-Michaelis, Lewis Smith, Silviu Vlad Oprea, Guy Schumann, Yarin Gal, Atılım Güneş Baydin, and Dietmar Backes. Towards global flood mapping onboard low cost satellites with machine learning. Scientific Reports, 11(1):7249, 2021.
- Matheswaran et al. [2018] Karthikeyan Matheswaran, Niranga Alahacoon, Rajesh Pandey, and Giriraj Amarnath. Flood risk assessment in south asia to prioritize flood index insurance applications in bihar, india. Geomatics, Natural Hazards and Risk, 2018.
- Membele et al. [2022] Garikai Martin Membele, Maheshvari Naidu, and Onisimo Mutanga. Examining flood vulnerability mapping approaches in developing countries: A scoping review. International Journal of Disaster Risk Reduction, 69:102766, 2022.
- Merz et al. [2021] Bruno Merz, Günter Blöschl, Sergiy Vorogushyn, Francesco Dottori, Jeroen CJH Aerts, Paul Bates, Miriam Bertola, Matthias Kemter, Heidi Kreibich, Upmanu Lall, et al. Causes, impacts and patterns of disastrous river floods. Nature Reviews Earth & Environment, 2(9):592–609, 2021.
- Mokrech et al. [2015] M Mokrech, AS Kebede, RJ Nicholls, F Wimmer, and L Feyen. An integrated approach for assessing flood impacts due to future climate and socio-economic conditions and the scope of adaptation in europe. Climatic Change, 128:245–260, 2015.
- Montello et al. [2022] Fabio Montello, Edoardo Arnaudo, and Claudio Rossi. Mmflood: A multimodal dataset for flood delineation from satellite imagery. IEEE Access, 10:96774–96787, 2022.
- Muñoz et al. [2021] David F. Muñoz, Paul Muñoz, Hamed Moftakhari, and Hamid Moradkhani. From local to regional compound flood mapping with deep learning and data fusion techniques. Science of The Total Environment, 782:146927, 2021.
- Nemni et al. [2020] Edoardo Nemni, Joseph Bullock, Samir Belabbes, and Lars Bromley. Fully Convolutional Neural Network for Rapid Flood Segmentation in Synthetic Aperture Radar Imagery. Remote Sensing, 12(16):2532, 2020.
- Nkwunonwo et al. [2020] UC Nkwunonwo, M Whitworth, and B Baily. A review of the current status of flood modelling for urban flood risk management in the developing countries. Scientific African, 7:e00269, 2020.
- Papoutsis et al. [2023] Ioannis Papoutsis, Nikolaos Ioannis Bountos, Angelos Zavras, Dimitrios Michail, and Christos Tryfonopoulos. Benchmarking and scaling of deep learning models for land cover image classification. ISPRS Journal of Photogrammetry and Remote Sensing, 195:250–268, 2023.
- Prapas et al. [2022] Ioannis Prapas, Akanksha Ahuja, Spyros Kondylatos, Ilektra Karasante, Eleanna Panagiotou, Lazaro Alonso, Charalampos Davalas, Dimitrios Michail, Nuno Carvalhais, and Ioannis Papoutsis. Deep learning for global wildfire forecasting. arXiv preprint arXiv:2211.00534, 2022.
- Rahnemoonfar et al. [2021] Maryam Rahnemoonfar, Tashnim Chowdhury, Argho Sarkar, Debvrat Varshney, Masoud Yari, and Robin Roberson Murphy. Floodnet: A high resolution aerial imagery dataset for post flood scene understanding. IEEE Access, 9:89644–89654, 2021.
- Rambour et al. [2020] C. Rambour, N. Audebert, E. Koeniguer, B. Le Saux, M. Crucianu, and M. Datcu. Flood detection in time series of optical and sar images. The International Archives of the Photogrammetry, Remote Sensing and Spatial Information Sciences, XLIII-B2-2020:1343–1346, 2020.
- Raymond et al. [2020] Colin Raymond, Radley M Horton, Jakob Zscheischler, Olivia Martius, Amir AghaKouchak, Jennifer Balch, Steven G Bowen, Suzana J Camargo, Jeremy Hess, Kai Kornhuber, et al. Understanding and managing connected extreme events. Nature climate change, 10(7):611–621, 2020.
- Rentschler et al. [2022] Jun Rentschler, Melda Salhab, and Bramka Arga Jafino. Flood exposure and poverty in 188 countries. Nature Communications, 13(1):3527, 2022.
- Rodell and Li [2023] Matthew Rodell and Bailing Li. Changing intensity of hydroclimatic extreme events revealed by grace and grace-fo. Nature Water, 1(3):241–248, 2023.
- Ronneberger et al. [2015] Olaf Ronneberger, Philipp Fischer, and Thomas Brox. U-net: Convolutional networks for biomedical image segmentation. In Medical Image Computing and Computer-Assisted Intervention–MICCAI 2015: 18th International Conference, Munich, Germany, October 5-9, 2015, Proceedings, Part III 18, pages 234–241. Springer, 2015.
- Rufat et al. [2015] Samuel Rufat, Eric Tate, Christopher G Burton, and Abu Sayeed Maroof. Social vulnerability to floods: Review of case studies and implications for measurement. International journal of disaster risk reduction, 14:470–486, 2015.
- Saleh et al. [2023] Tamer Saleh, Xingxing Weng, Shimaa Holail, Chen Hao, and Gui-Song Xia. Dam-net: Global flood detection from sar imagery using differential attention metric-based vision transformers. arXiv preprint arXiv:2306.00704, 2023.
- Seneviratne et al. [2021] Sonia I Seneviratne, Xuebin Zhang, Muhammad Adnan, Wafae Badi, Claudine Dereczynski, Alejandro Di Luca, Subimal Ghosh, I Iskander, James Kossin, Sophie Lewis, et al. Weather and climate extreme events in a changing climate (chapter 11). In IPCC 2021: Climate Change 2021: The Physical Science Basis. Contribution of Working Group I to the Sixth Assessment Report of the Intergovernmental Panel on Climate Change, pages 1513–1766. Cambridge University Press, 2021.
- Sumbul et al. [2019] Gencer Sumbul, Marcela Charfuelan, Begüm Demir, and Volker Markl. Bigearthnet: A large-scale benchmark archive for remote sensing image understanding. In IGARSS 2019-2019 IEEE International Geoscience and Remote Sensing Symposium, pages 5901–5904. IEEE, 2019.
- Sykas et al. [2022] Dimitrios Sykas, Maria Sdraka, Dimitrios Zografakis, and Ioannis Papoutsis. A sentinel-2 multiyear, multicountry benchmark dataset for crop classification and segmentation with deep learning. IEEE Journal of Selected Topics in Applied Earth Observations and Remote Sensing, 15:3323–3339, 2022.
- Tellman et al. [2021] B Tellman, JA Sullivan, C Kuhn, AJ Kettner, CS Doyle, GR Brakenridge, TA Erickson, and DA Slayback. Satellite imaging reveals increased proportion of population exposed to floods. Nature, 596(7870):80–86, 2021.
- Tellman et al. [2022] Beth Tellman, Upmanu Lall, AKM Saiful Islam, and Md Ariffuzaman Bhuyan. Regional index insurance using satellite-based fractional flooded area. Earth’s Future, 10(3):e2021EF002418, 2022.
- Thomas et al. [2023] Mitchell Thomas, Elizabeth Tellman, Daniel E Osgood, Ben DeVries, Akm Saiful Islam, Michael S Steckler, Maxwell Goodman, and Maruf Billah. A framework to assess remote sensing algorithms for satellite-based flood index insurance. IEEE Journal of Selected Topics in Applied Earth Observations and Remote Sensing, 16:2589–2604, 2023.
- Twele et al. [2016] André Twele, Wenxi Cao, Simon Plank, and Sandro Martinis. Sentinel-1-based flood mapping: a fully automated processing chain. International Journal of Remote Sensing, 37(13):2990–3004, 2016.
- Uddin and Matin [2021] Kabir Uddin and Mir A Matin. Potential flood hazard zonation and flood shelter suitability mapping for disaster risk mitigation in bangladesh using geospatial technology. Progress in disaster science, 11:100185, 2021.
- Unicef [2022] Unicef. Devastating floods in Pakistan, 2022.
- Wang et al. [2020] Jingdong Wang, Ke Sun, Tianheng Cheng, Borui Jiang, Chaorui Deng, Yang Zhao, Dong Liu, Yadong Mu, Mingkui Tan, Xinggang Wang, et al. Deep high-resolution representation learning for visual recognition. IEEE transactions on pattern analysis and machine intelligence, 43(10):3349–3364, 2020.
- Waseem and Rana [2023] Hassam Bin Waseem and Irfan Ahmad Rana. Floods in pakistan: A state-of-the-art review. Natural Hazards Research, 2023.
- World-Bank [2022] World-Bank. Pakistan: Flood Damages and Economic Losses Over USD 30 billion and Reconstruction Needs Over USD 16 billion - New Assessment, 2022.
- Wu et al. [2019] Congcong Wu, Xuezhi Yang, and Jun Wang. Flood Detection in Sar Images Based on Multi-Depth Flood Detection Convolutional Neural Network. In 2019 6th Asia-Pacific Conference on Synthetic Aperture Radar (APSAR), pages 1–6, Xiamen, China, 2019. IEEE.
- Wu et al. [2022] Han Wu, Huina Song, Jianhua Huang, Hua Zhong, Ronghui Zhan, Xuyang Teng, Zhaoyang Qiu, Meilin He, and Jiayi Cao. Flood detection in dual-polarization sar images based on multi-scale deeplab model. Remote Sensing, 14(20):5181, 2022.
- Wu et al. [2023] Xuan Wu, Zhijie Zhang, Shengqing Xiong, Wanchang Zhang, Jiakui Tang, Zhenghao Li, Bangsheng An, and Rui Li. A Near-Real-Time Flood Detection Method Based on Deep Learning and SAR Images. Remote Sensing, 15(8):2046, 2023.
- Xiao et al. [2018] Tete Xiao, Yingcheng Liu, Bolei Zhou, Yuning Jiang, and Jian Sun. Unified perceptual parsing for scene understanding. In Proceedings of the European conference on computer vision (ECCV), pages 418–434, 2018.
- Yadav et al. [2022] Ritu Yadav, Andrea Nascetti, Hossein Azizpour, and Yifang Ban. Unsupervised Flood Detection on SAR Time Series, 2022. arXiv:2212.03675 [cs].
- Yang et al. [2021] Qing Yang, Xinyi Shen, Emmanouil N Anagnostou, Chongxun Mo, Jack R Eggleston, and Albert J Kettner. A high-resolution flood inundation archive (2016–the present) from sentinel-1 sar imagery over conus. Bulletin of the American Meteorological Society, pages 1–40, 2021.
- Zhang et al. [2023a] Haopeng Zhang, Zijing Lin, Feng Gao, Junyu Dong, Qian Du, and Heng-Chao Li. Convolution and attention mixer for synthetic aperture radar image change detection. IEEE Geoscience and Remote Sensing Letters, 2023a.
- Zhang et al. [2022] Xiuwei Zhang, Mu Tian, Yinghui Xing, Yuanzeng Yue, Yanping Li, Hanlin Yin, Runliang Xia, Jin Jin, and Yanning Zhang. Adhr-cdnet: Attentive differential high-resolution change detection network for remote sensing images. IEEE Transactions on Geoscience and Remote Sensing, 60:1–13, 2022.
- Zhang et al. [2023b] Yuwei Zhang, Peng Liu, Lajiao Chen, Mengzhen Xu, Xingyan Guo, and Lingjun Zhao. A new multi-source remote sensing image sample dataset with high resolution for flood area extraction: Gf-floodnet. International Journal of Digital Earth, 16(1):2522–2554, 2023b.
- Zhang et al. [2023c] Yuwei Zhang, Peng Liu, Lajiao Chen, Mengzhen Xu, Xingyan Guo, and Lingjun Zhao. A new multi-source remote sensing image sample dataset with high resolution for flood area extraction: GF-FloodNet. International Journal of Digital Earth, 16(1):2522–2554, 2023c.
- Zhao et al. [2023] Bofei Zhao, Haigang Sui, and Junyi Liu. Siam-DWENet: Flood inundation detection for SAR imagery using a cross-task transfer siamese network. International Journal of Applied Earth Observation and Geoinformation, 116:103132, 2023.
- Zhao et al. [2022] Jie Zhao, Yu Li, Patrick Matgen, Ramona Pelich, Renaud Hostache, Wolfgang Wagner, and Marco Chini. Urban-Aware U-Net for Large-Scale Urban Flood Mapping Using Multitemporal Sentinel-1 Intensity and Interferometric Coherence. IEEE Transactions on Geoscience and Remote Sensing, 60:1–21, 2022.
- Zhou et al. [2018] Zongwei Zhou, Md Mahfuzur Rahman Siddiquee, Nima Tajbakhsh, and Jianming Liang. Unet++: A nested u-net architecture for medical image segmentation. In Deep Learning in Medical Image Analysis and Multimodal Learning for Clinical Decision Support: 4th International Workshop, DLMIA 2018, and 8th International Workshop, ML-CDS 2018, Held in Conjunction with MICCAI 2018, Granada, Spain, September 20, 2018, Proceedings 4, pages 3–11. Springer, 2018.
- Zuhlke et al. [2015] Marco Zuhlke, Norman Fomferra, Carsten Brockmann, Marco Peters, Luis Veci, Julien Malik, and Peter Regner. Snap (sentinel application platform) and the esa sentinel 3 toolbox. In Sentinel-3 for Science Workshop, page 21, 2015.