Images Connect Us Together: Navigating a COVID-19 Local Outbreak in China Through Social Media Images
Abstract.
Social media images, curated or casual, have become a crucial component of communicating situational information and emotions during health crises. Despite its prevalence and significance in informational dissemination and emotional connection, there lacks a comprehensive understanding of visual crisis communication in the aftermath of a pandemic which is characterized by uncertain local situations and emotional fatigue. To fill this gap, this work collected 345,423 crisis-related posts and 65,376 original images during the Xi’an COVID-19 local outbreak in China, and adopted a mixed-methods approach to understanding themes, goals, and strategies of crisis imagery. Image clustering captured the diversity of visual themes during the outbreak, such as text images embedding authoritative guidelines and “visual diaries” recording and sharing the quarantine life. Through text classification of the post that visuals were situated in, we found that different visual themes highly correlated with the informational and emotional goals of the post text, such as adopting text images to convey the latest policies and sharing food images to express anxiety. We further unpacked nuanced strategies of crisis image use through inductive coding, such as signifying authority and triggering empathy. We discuss the opportunities and challenges of crisis imagery and provide design implications to facilitate effective visual crisis communication.
1. INTRODUCTION
Social media has become a crucial information channel during crises. Characterized by de-centralized communication and crowdsourced information creation, social media affords a prominent place where people gather to cultivate situational awareness (Kou et al., 2017; Leavitt and Robinson, 2017; Dailey and Starbird, 2015), route help-seeking requests (Starbird and Palen, 2011; Yang et al., 2022; He et al., 2022) and provide mutual emotional support (He et al., 2021a; Yi et al., 2022; Huang et al., 2015). As the development of camera-embedded smartphones and high-speed internet eases the creation and sharing of images online, social media imagery is an increasingly substantial component in crisis communication. Millions of images are generated across different disasters (Alam et al., 2018) and transmit informative crisis-related messages (Sleigh et al., 2021).
Among different modalities in crisis communication, imagery has manifested a unique capability in delivering certain kinds of knowledge, sentiments, and experiences during crises (Perovich et al., 2022; Bica et al., 2019, 2017; Li et al., 2018; Zhang et al., 2021; Sosea et al., 2021; Seo, 2014). For example, crisis images in COVID-19, whether formal visualizations (Zhang et al., 2021) or non-formal memes (Perovich et al., 2022), could effectively engage viewers with crisis information such as disease prevalence, and facilitate public decision making. Through specific visual elements, crisis imagery can also have an emotional impact on the audience (Perovich et al., 2022; Joffe, 2008), with the power of emotional persuasion (Joffe, 2008) or emotional connection establishment (Bica et al., 2017; Porter et al., 2020). A visual representation is also helpful for reaching and engaging the audience with relatively low literacy levels (Guttman, 2017) and could facilitate their sensemaking under crises. Nonetheless, the majority of work in crisis communication has exclusively focused on textual content for analysis. The understanding of visual crisis communication through social media imagery, and the interplay between crisis text and images, are still limited.
The informational and emotional richness of crisis imagery has great potential in supporting crisis response during local outbreaks in the aftermath of the pandemic which are local situation-centered and emotionally fatigued (WIlliams and Dienes, 2021; Brownson et al., 2020; Abouk and Heydari, 2021). In the aftermath of the pandemic, local outbreaks are common (of Public Health, 2022; Website, 2021), unpredictable, and affect local policies and residents’ daily life (Brownson et al., 2020), which poses new challenges for crisis response. People not only need to cultivate situational awareness of the rapidly shifting local policies (Abouk and Heydari, 2021; Wu et al., 2021), but also have to retract to more constrained everyday behaviors and potentially suffer from crisis fatigue (WIlliams and Dienes, 2021). Further, local outbreaks are characterized by the information barrier, with segregated perceptions of crises between the affected local populations and the general public (Tsai et al., 2021), which demands persuasive crisis communication to get attention from the outside world. Given the unique value of social media crisis imagery in information persuasion and emotional contagion, understanding the use of crisis imagery may shed light on how people utilize visual narratives to cope with these specific challenges of crisis communication in local outbreaks. In particular, unpacking which visual themes are presented in local outbreaks, and how people strategically adopt them to share situational information and vent emotions beyond textual narratives, may provide insight into efficient and effective multimodal crisis communication in the aftermath of the pandemic.
To fill this significant research gap, we propose the following research questions:
-
•
RQ1: What themes of images do users share on social media during a COVID-19 local outbreak? (Crisis Visual Themes)
-
•
RQ2: For what crisis communication goals do users share crisis images during the local outbreak? (Crisis Visual Goals)
-
•
RQ3: How does the use of crisis images strategically facilitate crisis communication during the local outbreak? (Crisis Visual Strategies)
To answer the research questions, we adopted mixed-methods and multimodal analysis, incorporating image clustering, text classification, and inductive coding, to uncover themes, goals, and strategies of crisis imagery. We focused on the event of COVID-19 outbreak in Xi’an City in China, and collected 345,423 crisis-related posts and 65,376 original images from Weibo, a popular Chinese social media platform. We first used image clustering to distinguish diverse crisis visual themes such as text images and posters. By identifying information and emotions of crisis-related posts with images, we then revealed how the use of different visual themes significantly correlated with the informational and emotional goals in text, such as the proliferation of text images in disseminating the latest policies and the association between food image and anxiety in lockdown. Through the inductive coding of image-attached posts, we further identified four types of strategic use of crisis images to facilitate crisis communication, including images as signs of authority, visual-based information enhancement, evidence to improve credibility, and triggers for empathy. We discuss opportunities (e.g., establishing emotional connections) and challenges (e.g., image-enhanced misinformation) of image-based crisis communication, reflect on the complementary roles of crisis images and language, and propose design implications to promote effective and accurate crisis communication through social media crisis images.
In summary, the contribution of this work to crisis communication literature in HCI and CSCW includes: (1) we propose an effective analytical structure to identify diverse crisis image themes, and capture a comprehensive taxonomy of visual representations in a COVID-19 local outbreak; (2) we uncover inter-modality correlations between text and images, demonstrating that crisis images of different types serve different informational and emotional goals; (3) we unveil nuanced and unique strategic use of social media crisis images to supplement or augment textual narratives, enhancing crisis communication as a whole; and (4) we provide design implications to facilitate accurate, efficient and effective visual crisis communication. This work sheds light on opportunities and challenges of visual-based crisis communication, and highlights the significance of understanding multimodal crisis communication as an organic whole.
2. RELATED WORK
2.1. Crisis Communication on Social Media and Challenges in Local Outbreaks
Crisis communication has been a crucial research topic that aims to understand and facilitate the communication of preparing for, responding to, and recovering from crises (Coombs, 2020). Traditional crisis communication on mass media largely highlights a one-way and top-down approach from authoritative agencies to the general public (Veil et al., 2011; Zerman, 1995). The rapid development of social media has enabled two-way communication between the public and official agencies which emphasizes public participation and engagement in crisis response (Eriksson, 2018; Zhang et al., 2021; He et al., 2022). How users create, seek, and transmit crisis-related information on social media has attracted increasing research attention in the HCI and CSCW communities (e.g., (Li et al., 2021; Olteanu et al., 2015; Qu et al., 2011; Vieweg et al., 2010; Starbird and Palen, 2011)).
The two-way crisis communication on social media brings opportunities for crowdsourced information creation and dissemination (Zade et al., 2018; He et al., 2021a). Based on that, nuanced crisis communication patterns have been discovered and investigated by HCI and CSCW researchers. One line of work looks at how people cultivate situational awareness of a crisis through collective sensemaking (Kou et al., 2017; Leavitt and Clark, 2014; Leavitt and Robinson, 2017; Dailey and Starbird, 2015; Starbird, 2013). Under health crises like Zika and COVID-19 that are characterized by uncertainty, such a collective sensemaking process is substantial for risk assessment and decision making (Gui et al., 2017). Another strand of work focuses on self-organized collaboration in response to help-seeking requests when crises happen (Starbird and Palen, 2011; Yang et al., 2022; He et al., 2022; Li et al., 2019; Zhao et al., 2020; Starbird et al., 2012). Online community members especially digital volunteers develop a set of strategies such as using specific hashtags (Nishikawa et al., 2018; Yang et al., 2017) and structuring posts with a specialized syntax (Starbird and Palen, 2011; Yang et al., 2022; He et al., 2022) to facilitate the timely routing of help-seeking posts to the intended target(s). Owing to misinformation and conspiracy theories often becoming widely spread during crises (Starbird et al., 2014; Ferrara et al., 2020), researchers have also investigated the debunking efforts and procedures to cope (Yang et al., 2021; He and He, 2022).
Local outbreaks in the aftermath of a pandemic, as a special type of public health crisis, pose unique challenges to citizens’ crisis response. During local outbreaks, affected populations have to figure out and adapt to unpredictable local policies that influence their daily life (Brownson et al., 2020; Abouk and Heydari, 2021). Also, local residents have to retract to constrain everyday behaviors, and may potentially suffer from fatigue with decreased motivation to comply with regulations (WIlliams and Dienes, 2021). Moreover, in such local outbreaks, there are segregated perceptions of crises between the affected local populations and the general public, which demands persuasive crisis communication to cross the information barrier (Tsai et al., 2021). On this note, multimodal crisis communication combining text and visual use may hold special value in transmitting situational information and building emotional connections. Nonetheless, little work has looked at multimodal crisis communication during local outbreaks with a holistic view of text and visuals. In this work, we aim to explore how people adopt visual narratives on social media along with text to satisfy these specific communication needs, given images’ unique capacity for attention attraction, informational persuasion, and emotional contagion.
2.2. Visual Crisis Communication
Images inherently own distinguished power in delivering certain kinds of thoughts, experiences, emotions, and knowledge clearly and effectively, the role of which in communication could supplement written or oral language in many ways (Gillies et al., 2005; Powell et al., 2015; Schill, 2012). For instance, images have the potential of arousing emotional resonance crossing the language and cultural divide (Sawyer and Chen, 2012). Recent technology development such as high-resolution mobile phone camera and low-cost digital image archives enables amateurs to curate and share images on social media conveniently (Cooke, 2005; Porter et al., 2020), which make social media imagery a rich research source (Manikonda and De Choudhury, 2017). A plethora of work has examined imagery on social media in various areas such as mental health (Manikonda and De Choudhury, 2017), societal happiness (Abdullah et al., 2015), abusive behaviors (Pang et al., 2015) and politics (Porter et al., 2020).
Online crisis imagery has also attracted growing research attention in HCI and CSCW (Perovich et al., 2022; Bica et al., 2019, 2017; Li et al., 2018; Zhang et al., 2021; Sosea et al., 2021; Bowe et al., 2020; Mortensen et al., 2017; Seo, 2014). Some researchers have exploited the value of crisis imagery, as a special kind of data, to improve crisis-related decision-making, such as disaster type identification (Asif et al., 2021) and damage localization (Li et al., 2018). Existing literature has also investigated how images with different visual characteristics are utilized for crisis communication. Among them, crisis visualizations, one category of images that aims to systematically represent crisis information and augment the quality of risk communication, have been widely explored (Zhang et al., 2021; Bowe et al., 2020; Welhausen, 2015; Preim and Lawonn, 2020). For example, Zhang et al. centered on COVID-19 crisis visualizations and looked at how they helped to convey information on disease prevalence, epidemiological simulations, and economic and social change (Zhang et al., 2021). Crisis memes, one kind of informal crisis imagery that involves participatory creation, also manifests unique roles in crisis communication such as being a visual analogy and visual pun (Perovich et al., 2022).
Compared to crisis visualizations and memes as categories with special visual features, general crisis images that people post on social media tend to be more miscellaneous in visual topics and patterns, and are used for more diverse communication needs (Bica et al., 2017). For instance, they might be either a random photo recording the life under a crisis, or a screenshot of an article with the latest crisis-related policies. Such nature of the heterogeneity of social media crisis images complicates the analysis that aims to figure out their roles in crisis communication. Focusing on a local outbreak in the aftermath of the COVID-19 pandemic, we develop an image-clustering approach to effectively group different crisis visual themes (RQ1) as a preliminary step. Based on it, this work further contributes to visual crisis communication by illustrating how social media crisis images satisfy different informational and emotional needs in crises (RQ2), and what unique strategies they provide to augment crisis communication beyond textual narratives (RQ3).
2.3. Social Media Imagery Analysis Techniques
The growth of image use in everyday communication on social media has fueled the development of social media imagery analysis (Zhang and Peng, 2021; Bica et al., 2017; Manikonda and De Choudhury, 2017). Researchers have associated image data with other post- or user-relevant information for analysis based on specific tasks, such as text (Manikonda and De Choudhury, 2017; Pang et al., 2015; Abdullah et al., 2015), geospatial data (Bica et al., 2017), social status of the user (Stefanone et al., 2015), and social engagement (Bakhshi et al., 2015; Manikonda et al., 2016). For example, Bica et al. revealed the correlation between the severity of a disaster and the image tweet activity based on the geotag information (Bica et al., 2017).
Recent work has also begun to look specifically at the visual characteristics of social media imagery. For instance, Manikonda and Choudhury examined visual features, such as color palettes and visual saliency, that were manifested through mental health images on Instagram (Manikonda and De Choudhury, 2017). Visual themes are another significant topic of concern. Nonetheless, identifying meaningful and interpretable visual themes is a challenging task when images contain high-dimensional features (Goldberger et al., 2002). Some studies applied qualitative content analysis to establish theme categories (e.g., (Bica et al., 2019; Perovich et al., 2022; Andalibi et al., 2017; Brantner et al., 2020)), but content analysis suffers from scalability and reproducibility concerns. The recent progress of computer vision and deep learning enables more accurate quantitative thematic analysis at scale. Two representative approaches are supervised image classification (Williams et al., 2020; Guérin et al., 2017) and unsupervised image clustering (Zhang and Peng, 2021). Image clustering has exhibited its great performance in discovering meaningful patterns that are less subject to human annotation (Hu et al., 2014; Manikonda and De Choudhury, 2017; Zhang and Peng, 2021; Peng, 2021; Porter et al., 2020). Nonetheless, extracting low-dimensional representations of images remains a bottleneck for image clustering tasks (Zhang and Peng, 2021). To present images as low-dimensional vectors, some prior work relied on human-assigned feature codes (Porter et al., 2020), and another line of scholarship leveraged visual feature descriptors like Scale-Invariant Feature Transform (SIFT) (Daly and Thom, 2016) and Speeded Up Robust Features (SURF) (Manikonda and De Choudhury, 2017). Transfer learning-based feature extraction, with the development of pretrained deep learning models, has recently shown tremendous potential in social media imagery analysis. For example, Zhang and Peng compared different visual feature extraction methods for political image clustering, and revealed that transfer learning significantly outperformed other methods (Zhang and Peng, 2021).
Despite the advancement in imagery analysis techniques (Imran et al., 2020; Zhang and Peng, 2021), the setting of social media imagery during a COVID-19 local outbreak presents additional challenges to the analysis. First, emotional connections through visuals characterize the event, expressing both “positive energy” to establish public confidence (Lu et al., 2021), or anxiety and annoyance under “lockdown” fatigue (Ross et al., 2021; Cho et al., 2023). It necessitates multimodal sentiment analysis to understand and monitor public reactions (Imran et al., 2020). Second, public discourse on local outbreaks naturally intersects with social and political issues under crisis management of the local government (Marzouki et al., 2021; Cho et al., 2023). Therefore, situating imagery analysis within the specific sociopolitical context is crucial in this setting. Finally, it is significant for the imagery analysis to consider the heterogeneity of visual narratives during the crisis on social media (Perovich et al., 2022; Sleigh et al., 2021).
This work customizes image clustering with visual features extracted by transfer learning to comprehensively unpack crisis image themes during a COVID-19 local outbreak. We also apply qualitative thematic and sentiment analysis to capture a more in-depth understanding of the goals and strategies of social media crisis imagery during the event.
3. METHOD
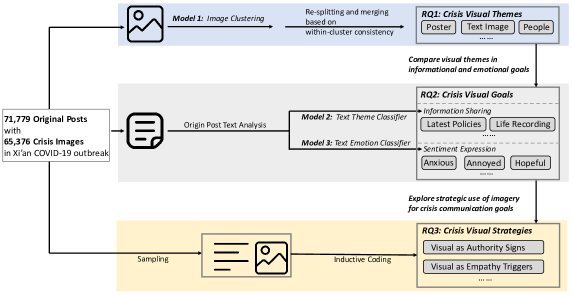
We adopted a mixed-methods approach to examine the characteristics of social media crisis imagery in a COVID-19 local outbreak. To systematically unpack crisis visual themes (RQ1, Section 3.3), we used image clustering to discern different visual elements in crisis imagery. To understand their crisis communication goals (RQ2, Section 3.4), we developed text classifiers to extract information and sentiments from original posts of crisis images, and made comparisons among different crisis visual themes. To further figure out the strategic use of images for these crisis communication goals (RQ3, Section 3.5), we conducted inductive coding of crisis image samples in the post context, unearthing its unique values in enhancing crisis communication. The overall analytic flow of this study is described in Figure 1.
3.1. Study Event: Xi’an COVID-19 Local Outbreak
The Xi’an COVID-19 local outbreak, caused mainly by SARS-CoV-2 Delta variant (News, 2021b), is regarded as the most severe COVID-19 local outbreak in China after Wuhan outbreak as of January 2022 (Wikipedia, 2022). The first COVID-19 case of this event was reported on December 9, 2021 (Wikipedia, 2022), at which time COVID-19 had infected more than 260 million people worldwide and caused more than 5 million deaths (Organization, 2 07). Following a dynamic zero-COVID strategy, the local government imposed a lockdown on December 23, 2021, which lasted for about one month till January 24, 2022 (Wikipedia, 2022). The lockdown implemented a stay-at-home order, in which citizens needed permission to leave residential compounds or the city, affecting 13 million local residents (Zhang and Rui, 2021). A total of 2053 cases were reported in Xi’an during this event (Wikipedia, 2022). We focus on visual crisis communication in this event as a typical example of a COVID-19 local outbreak with lockdown management, which might contribute to the understanding of civic response in similar health crisis events with highly contagious viruses, varied and strict management measures, and uncertain local situations.
3.2. Data Collection
We chose Weibo as the research site, which is the largest Chinese microblogging website and a significant social media platform for crisis communication in China (Yang et al., 2021; Chen et al., 2021; Qu et al., 2011). To determine the data inclusion criteria, we first randomly browsed posts related to the Xi’an COVID-19 Local Outbreak. We finally chose the most frequent keyword “Xi’an epidemic” (which sometimes appeared as a hashtag) for data collection. Applying the WeiboSuperSpider tool (inspurer, 2021), we crawled posts whose text included the “Xi’an epidemic” keyword and collected all the images within them. The data covered the period from December 9, 2021, when the first COVID-19 case was reported in this event, to January 24, 2022, the date when the Xi’an government lifted the lockdown. In total, we retrieved 345,423 relevant posts, and kept the 71,779 original posts contributed by 39,866 distinct users as the target dataset. Among them, 29,075 posts (40.5%) had one or more images, and the total image number was 66,183. We kept 65,376 images after excluding GIFs, which contained multiple frames and may produce unreliable results for static visual analysis.
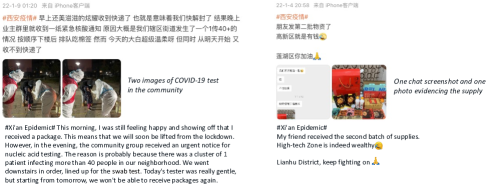
Generally, posts in the collected dataset received an average of 48.5 likes (SD=2093.0), 7.2 comments (SD=130.7), and 2.9 shares (SD=59.5). On average, posts with images received slightly higher user engagement, with an average of 54.4 likes (SD=2007.8), 8.7 comments (SD=131.2), and 3.2 shares (SD=45.1), compared to posts without images which received an average of 44.5 likes (SD=2149.0), 6.1 comments (SD=130.4), and 2.6 shares (SD=67.6). The average post length was 164.6 (SD=246.5). In addition to the de-facto hashtag “#Xi’an epidemic#” in the event (N=20,144, also as the keyword for collection), the other 5 most frequent hashtags included “#Xi’an#” (N=2028), “#Come on Xi’an#” (N=1605), “#Diary of Fighting Against the Epidemic in Xi’an#” (N=861), “#Epidemic prevention and control#” (N=560) and “#Xi’an Epidemic Updates#” (N=501). We provide two example posts with visuals in Figure 2 to familiarize readers with the dataset.
There were several considerations regarding the limitation of the dataset. First, we only used one most widely-adopted keyword “Xi’an epidemic” for data collection. As also the de-facto hashtag/super-topic (Chen et al., 2021) of this local outbreak on Weibo, this keyword was representative to collect a sufficiently large dataset for quantitative analysis and capture different themes of user-generated posts regarding the event. We did not include other keywords such as “Xi’an quarantine life” or “Xi’an epidemic updates” that might introduce a bias towards specific aspects of the outbreak. However, this keyword could not ensure the comprehensiveness of data collection, as some pertinent posts might be omitted. Second, we collected data on March 14, 2022, i.e., 50 days after the event, so that the engagement indexes of posts (e.g., likes and shares) stabilized for a fair comparison. Nonetheless, it inevitably led to the loss of some posts, especially under factors such as self-deleting outdated crisis-related posts (He et al., 2022). Finally, different from Twitter, Weibo adopts a more flexible setting on post visibility, including “public”, “followers”, “social circle (mutual followers)”, “selected friends” and “private” (Weibo, 2020). We only managed to collect the public posts, which limited the dataset size to some extent and was potentially skewed towards more public disclosure.
3.3. RQ1: Uncovering Visual Content Themes with an Image Clustering Approach
To have a preliminary understanding of what users disclosed and shared through images during the COVID-19 local outbreak, we first aimed to unpack the themes of social media crisis images. We chose unsupervised image clustering with transfer learning for feature extraction (Zhang and Peng, 2021) to categorize the data. Compared to the widely-adopted image content analysis of manually coding images and assigning theme labels (Perovich et al., 2022; Zhang et al., 2021; Bica et al., 2019), image clustering can scale image analysis to larger datasets and is less subject to reproducibility concerns. Also, in contrast to supervised image classification, image clustering is not restricted by the size and quality of the human-labeled training dataset. The recent development of transfer learning and deep neural networks further brings great potential for image clustering, especially in categorizing miscellaneous social media images (Zhang and Peng, 2021). Therefore, image clustering is well applicable for identifying visual themes of crisis imagery in the context of this work.
As our ultimate goal was to generate coherent clusters with pure and explainable content themes, we adopted within-cluster consistency (Zhang and Peng, 2021) as a quantitative measure of whether our clusters were internally consistent. Specifically, within-cluster consistency denoted the proportion of the most common theme in a human-annotated sample for a given cluster (similar to “semantic validity” in unsupervised topic modeling (Grimmer and Stewart, 2013)). We averaged within-cluster consistency of all clusters to evaluate the performance of each image clustering approach and selected models based on it.
3.3.1. Transfer Learning for Low-Dimensional Feature Extraction
We adopted transfer learning (Torrey and Shavlik, 2010) to extract low-dimensional features of high-dimensional pixel representations of images, which is the bottleneck of unsupervised image clustering (Zhang and Peng, 2021). It outperforms visual-element-based extraction approaches such as bag-of-visual-words models (Zhang and Peng, 2021; Sivic and Zisserman, 2003; Lowe, 2004), and achieves good performances in a variety of imagery analysis tasks (Zhang and Peng, 2021; Nguyen et al., 2017).
To find a suitable pretrained model, we performed a pilot experiment on 1000 image samples and tried various popular pretrained deep learning models, including VGG16 (Simonyan and Zisserman, 2014), VGG19 (Simonyan and Zisserman, 2014), ResNet (He et al., 2016), MobileNet (Howard et al., 2017) and MobileNetV2 (Sandler et al., 2018), for feature extraction. All models were pretrained on ImageNet (Deng et al., 2009), a large image database covering 1000 general categories, and thus had the generalizability to fit into our dataset. Specifically, we first resized images to 224 224 pixel with RGB color mode, fed images into each candidate model with pre-trained weights on the ImageNet (Deng et al., 2009), and generated the last layer as the low-dimensional representations of images (Zhang and Peng, 2021). Then, we applied a basic clustering method (K-means (Lloyd, 1982)) to the extracted features. We also experimented with a traditional feature extraction approach for comparison, i.e., the bag-of-visual-words model extracting scale-invariant visual features (Sivic and Zisserman, 2003). When varying the value of K, we found 5 clusters generally yielded a high silhouette score (a metric measuring clustering quality (Rousseeuw, 1987)) as well as meaningful results across different feature extraction models. Therefore, we set for a fair comparison. After clustering, two coders manually coded visual themes of 100 samples (5 clusters 20 samples in each cluster) for each candidate model, compared labels, and discussed to reach a consensus. They examined the performance with within-cluster consistency (Appendix A). The evaluation indicated that different pretrained models all outperformed the bag-of-visual-words model and did not exhibit substantially different performance among them. As such, we finally chose MobileNetV2 (Sandler et al., 2018) with the highest feature extraction speed to facilitate further experiments when scaling up to the whole dataset. Assisted by MobileNetV2, we represented each image in the dataset (224 224 3) as a 1280-dimension vector, which was the last hidden layer (global average pooling layer (Sandler et al., 2018)).
3.3.2. Image Clustering
After converting images to low-dimensional representations, we adopted clustering to uncover visual content themes that were accurate and interpretable.
First, we tried different types of clustering methods, including centroid-based (i.e., K-means (Lloyd, 1982)), density-based (i.e., DBSCAN (Khan et al., 2014)) and distribution-based (i.e., Gaussian Mixture Model (Reynolds, 2009)) approaches. Following a similar approach in determining the feature extraction model, we compared different clustering methods based on within-cluster consistency and found that there was no substantial difference between them (Appendix A). Therefore, we chose K-means to categorize crisis images for simplicity. To determine an optimal value, we defined the search space of in a range of 5 to 20, and computed silhouette scores (Rousseeuw, 1987) for each candidate; was finally adopted with a maximal silhouette score. We noticed that most generated clusters were surprisingly pure and clear (e.g., text images) but two clusters were a mixture of sub-themes (i.e., diverse types of photos). Therefore, we performed a re-splitting and merging step as detailed below.
-
(1)
Sampling: Randomly sampling 50 images for each cluster to measure the within-cluster consistency. It yields 300 image samples (50 images 6 clusters) in total.
-
(2)
Coding: Two coders independently coded images and assigned theme labels for image in cluster . In particular, the coders first followed a descriptive coding process to analyze visual content (Saldaña, 2021), focusing on visual types (e.g., chat screenshots and in-situ photos) and visual elements (e.g., medical staff and food). They then conducted pattern coding (Saldaña, 2021) to connect fine-grained codes and identify larger visual themes that potentially captured image clusters (e.g., assigning the high-level theme label “text images” for relevant codes such as “chat screenshots” and “document photos”). They reached a consensus on theme labels through several rounds of meetings, comparisons, and discussions.
-
(3)
Measuring Consistency: For each theme that appeared in Cluster , we computed its prevalence , i.e., the percentage of images belonging to this theme in the cluster. We defined a cluster as “consistent” when it had a dominant theme whose prevalence was larger than a dominance threshold , i.e., . A larger dominance threshold denotes stricter consistency when the dominant theme is required to have a higher proportion in the cluster. In this work, we set as 60%.
-
(4)
Splitting: For each inconsistent cluster, we re-split it according to how many significant themes it contained. Specifically, we selected significant themes whose prevalence was greater than a significance threshold (We set as 20% in this work). Then, we set (number of significant themes) to separate the inconsistent cluster into sub-clusters using K-means.
-
(5)
Merging: After splitting the inconsistent clusters, we repeated sampling, coding, measuring consistency, and finding the dominant theme for each sub-cluster. No inconsistent sub-cluster was detected in this round. We merged all clusters and sub-clusters with the same dominant theme.
In total, the image clustering yielded six clusters with distinct visual themes111Note that it is a coincidence that the number of clusters (six) equaled the initial value after the splitting and merging steps, including posters, text images, indoor objects, outdoor scenes, people, and food, which will be detailed in Section 4.1. Two coders independently annotated themes of 600 label-assigned samples (100 samples 6 clusters) as true or false (i.e., whether the actual theme of each image corresponded to the label assigned by image clustering) to evaluate the final performance. After annotation, the authors adopted Cohen’s kappa to validate inter-rater reliability (McHugh, 2012). The high Cohen’s kappa () suggested strong agreement between the two coders and strengthened the validity of the manual evaluation. The evaluation generated an average recall of 79.5%, indicating the substantially good performance of image clustering in uncovering visual themes.
Within all image clusters, we noticed that indoor objects and outdoor scenes were two relatively general categories, which communicated diverse indoor and outdoor activities valuable in the event (e.g., community nucleic acid test), and thus could benefit from a fine-grained classification to generate more meaningful results. Therefore, we applied deep learning models fine-tuned on specific scene-based datasets to predict scenes or items. To identify indoor objects, we chose MIT Indoor Scenes dataset as one of the benchmark datasets for indoor scene recognition (Quattoni and Torralba, 2009). To discern outdoor scenes, we chose Places365 database as one of the authoritative datasets for scene classification (Zhou et al., 2017). We adopted Vision Transformer (ViT) model (Dosovitskiy et al., 2020) fine-tuned on MIT Indoor Scenes dataset and VGG16 (Simonyan and Zisserman, 2014) fine-tuned on Places365 database, both of which achieved good performance in the specific task (vincentclaes, 2022; Kalliatakis, 2017).
3.4. RQ2: Investigating Visual Crisis Communication Goals with Text Analysis of Original Posts
RQ1 focused on visual features and generated a comprehensive taxonomy of crisis image themes during a COVID-19 local outbreak. It captured the substantial diversity of crisis imagery, ranging from text-embedded images with the latest policies to photos recording daily quarantine life. This led to a further question: which goals do these diverse types of images serve for crisis communication, and more importantly, how different visual themes are adopted for different crisis communication goals? To investigate this question, we (1) performed quantitative text analysis of original posts to unpack crisis communication goals, and (2) compared different visual themes in the informational and emotional objectives. The quantitative text analysis and inter-image comparison particularly focused on information sharing and sentiment expression, two significant communication objectives in crisis settings (He et al., 2021a; Zade et al., 2018; Vieweg et al., 2010; Qu et al., 2009, 2011).
3.4.1. Text Analysis of Original Posts
We developed information and emotion classifiers for original post analysis as a preliminary step to figure out the visual goals, i.e., how different types of crisis images were used to fulfill different crisis communication needs.
Information Theme Classifier: To identify which types of information were disseminated in the local outbreak-related posts, we developed a codebook through inductive thematic analysis, and leveraged a text classifier to generalize the information themes to the whole corpus.
To establish the codebook of information themes, we used inductive thematic analysis to code a sample of posts (Fereday and Muir-Cochrane, 2006), capturing the codes naturally reflecting the topics of crisis-related posts. Specifically, two coders carefully read through 200 post samples independently, and generated codes of information themes (e.g., “latest policies and measures”) that described the data. Through several rounds of discussions and comparisons, they reached a consensus on the theme codes of crisis-related posts as shown in Table 1, and returned to annotating every post in the 200 samples based on the four type labels. The Cohen’s Kappa () suggested substantial inter-rater agreement between the two coders (McHugh, 2012). Finally, the two coders separately annotated another 400 posts each, generating 1,000 theme-assigned samples as the training dataset. An additional sample of 200 posts was further labeled as the test dataset. The annotation process also helped the two coders validate that the four information types were inclusive to describe user-generated posts during the event with no new code emerging. Generally, the information themes aligned with the public response on Chinese social media during the early COVID-19 outbreak such as the discussion on management measures (Wang et al., 2020b; He et al., 2021a; Li et al., 2020). However, as a COVID-19 resurgence, little discourse focused on the causative agent, prevention knowledge, and epidemiological characteristics (Li et al., 2020; Xu et al., 2020). Meanwhile, life recording during lockdown characterized the event with prolonged abnormal living conditions.
| Type | Definition | Example | Percentage in the Sample |
| Situational Information | Posts communicating situational COVID-19-related information, such as recent cases, social events, and scientific suggestions on new variants | Up to now, a total of 1,451 cases have been diagnosed in Xi’an, including 2 critical illness cases and 11 serious illness cases. The critical illness rate was 0.14%, and the serious illness rate was 0.76%. | 34.9% |
| Attitude Disclosure | Expressing attitudes towards the COVID-19 local outbreak and relevant issues | I’m not in the mood to eat meals and go to class. I want to go home… I beg COVID-19 to stop troubling Xi’an. Don’t let Xi’an people be unable to go back hometown. | 29.8% |
| Life Recording under Lockdown | Recording personal life, status, and challenges under lockdown | This is the first time I feel that the epidemic is so close to me… The community downstairs of my company has raised a cordon. | 23.4% |
| Latest Policies and Measures | Announcement or adjustment of the COVID-19 management policies and measures | [IMPORTANT! Xi’an starts a new round of nucleic acid screening on December 27th] According to the news from the Xi’an Epidemic Prevention and Control Headquarters: From 12:00 on December 27th, Xi’an will start a new round of COVID-19 nucleic acid screening. Reminder: Keep social distance and protect yourself. | 11.9% |
We applied Bidirectional Encoder Representations from Transformers (BERT) (Devlin et al., 2018) to classify the local-outbreak-related posts for its good performance and generalizability in text classification tasks. Specifically, we adopted BERT-wwm, a Chinese BERT model pretrained on Chinese Wikipedia (Cui et al., 2021), and fine-tuned it with our training dataset (N=1000) to adjust it to our specific tasks. The micro f1-score achieved 82.1% in the test dataset (N=200), indicating its substantially good performance. Finally, we leveraged the information theme classifier to assign theme labels to the whole dataset of original posts (N=71,779).
Emotional Type Classifier: To identify emotional types of text posts, we first tried some widely-adopted Chinese emotion prediction models (e.g., Jingdong Sentiment API 222https://neuhub.jd.com/ai/api/nlp/sentiment and SnowNLP 333https://github.com/isnowfy/snownlp), yet we noticed that these models were not well-applicable to our context through manual evaluation. Therefore, we followed an emotion identification method similar to our information theme classification approach, including (1) codebook establishment through open coding (Corbin and Strauss, 2014) on 100 samples by two authors, capturing emotions in this specific scenario (five emotion types shown below); (2) validation of inter-rater reliability on assigning the five emotion types with Cohen’s Kappa (N=100, ); (3) annotation on training dataset (N=1000) and test dataset (N=200); and (4) BERT-based emotional type classification (micro f1-score = 78.6% on 5-class emotion classification). The open coding indicated that a single label could well represent each post, and five emotion classes were identified to effectively describe emotions in our samples:
-
•
Positive - Hopeful (19.9%444Percentage of each emotion denotes its proportion in the 1000 training dataset.): Mutual encouragement and wishes to overcome the difficulty;
-
•
Positive - Appreciative (4.3%): Gratitude to medical staff, community workers, and other social connections in the local outbreak;
-
•
Neutral (52.2%): Neutral posts such as news, latest policies, and unemotional life recording;
-
•
Negative - Annoyed (11.9%): Feeling of annoyance when normal life was disturbed by the local outbreak and relevant measures;
-
•
Negative - Anxious (11.7%): The nervousness and worry due to the uncertainty during the local outbreak (e.g., uncertain lockdown time and food supply).
3.4.2. Comparison of Crisis Visual Goals
After identifying the information theme and emotion type of each post, we extracted the crisis image category of the post established in RQ1 (or the dominant category based on frequency if the post contained more than one image). We investigated how the transmitted information themes and emotions correlated with (1) whether crisis images were used or not, and (2) which types of crisis images were used. Particularly, we compared different image types on the information or emotion categories of posts to investigate their differences in informational and emotional goals. We also performed chi-square tests (McHugh, 2013) to validate the statistical significance of such differences, i.e., whether different image types had significantly different information and emotion distributions.
3.5. RQ3: Understanding Strategies of Crisis Images with Inductive Coding
RQ1 and RQ2 leveraged computational approaches across visual and linguistic modalities to comprehensively unpack the rich themes and the nuanced informational and emotional goals of crisis imagery. The comparison of crisis communication goals among visual themes helped to statistically depict the inter-modality correlation between visual and text. Moving a further step, a more in-depth investigation of such inter-modality correlation, especially the strategic use of visuals to enhance crisis communication as a whole, could deepen the understanding of crisis image use. Therefore, we applied inductive coding to qualitatively look into the visual strategies in crisis communication, i.e., how crisis images facilitated information sharing and sentiment expression in the specific context.
Specifically, we sampled 1200 distinct images (200 images 6 visual theme categories) identified in Section 3.3, and situated them within the original posts. We conducted inductive thematic analysis (Fereday and Muir-Cochrane, 2006) and inductive emotion coding (Perovich et al., 2022) on the data. Two authors (1) inductively coded the information themes and emotions expressed in both the image samples and corresponding post text; (2) compared visual-based and language-based information and emotions; (3) figured out how they were related; and finally (4) recorded how crisis visuals strategically facilitated the information and emotion sharing. Two coders took an iterative process of coding, comparing, and discussing to resolve the difference and finalize the codebook. The coding reached saturation given the sample size, so we did not code more data. This step of qualitative analysis helped to unpack how visual narratives manifested unique values and complemented text in crisis communication. After qualitatively identifying specific visual strategies, we also presented relevant quantitative evidence to illustrate their prevalence and potential correlations with user engagement, affording a more thorough understanding of the result.
4. FINDINGS
This work provides a comprehensive description of the themes, goals, and strategies of crisis imagery during a COVID-19 local outbreak, promoting the understanding of visual crisis communication in general social media crisis images. In Section 4.1, we describe the taxonomy of crisis visual themes obtained from image clustering, showing distinct features of different visuals in the event. We further demonstrate how these crisis image themes were substantially correlated with different informational and emotional objectives in Section 4.2, unearthing the specialized use of crisis images in crisis communication. In Section 4.3, we depict several unique strategies of visuals that contributed to effective crisis communication. Overall, these findings uncover not only the rich features of social media crisis imagery, but also its special values in promoting situational awareness and establishing emotional connections.
4.1. RQ1: Visual Themes
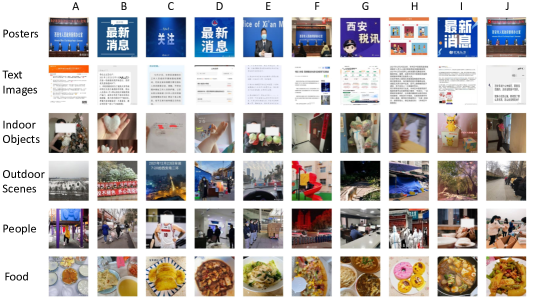
The image clustering yielded six representative visual themes as shown in Figure 3, including two text-embedded image categories (Manikonda and De Choudhury, 2017): posters and text images; and four “visual diary” image categories that recorded life during the outbreak: indoor objects, outdoor scenes, people, and food. These crisis image themes communicated distinct visual elements in the local outbreak to enhance situational awareness and establish emotional connections. We detailed descriptive analysis of different visual themes, and started with two text-embedded image categories:
-
•
Posters (22.7%, N=14,836): Images embedding some big-character text, especially with a solid-color background. Different from images with rich text about crisis information (text images), posters generally only had meta information (e.g., “latest news” in Figure 3 Posters, B) of the post. Some poster-style photos, especially photos of COVID-19-related press conferences with the agency name embedded in a solid-color background (e.g., Figure 3 Posters, A and E), also characterized this category. The highlighted text information of posters helped to convey the core message and catch users’ eyes at a glance. In a similar visual style, text-embedded visualizations and memes (e.g., Figure 3 Posters, H) were also categorized into this visual theme though not in a great amount.
-
•
Text images (16.0%, N=10,434): Images with plentiful embedded text. We noticed that plenty of authoritative regulations (e.g., the lockdown measures of the city) and community guidelines (e.g., communities’ COVID-19 test notice) were shared by local residents in the form of images such as screenshots of government-posted articles, potentially due to the convenience of forwarding images in and outside the Weibo platform. Screenshots of chat messages (e.g., Figure 3 Text Images, J) were another type of text image that provided situational information with original sources, such as the latest suggestions posted by community officers in a community group chat. Meanwhile, text images were also observed to convey some sensitive messages, such as conflicts with supply providers and rumors faked as chat logs with “political insiders”, to circumvent moderation.
Below are the four “visual diary” image categories:
-
•
Indoor objects (17.6%, N=11,480): Images capturing indoor objects that recorded everyday life during the lockdown. This category reflected people’s resilience during this isolated lifestyle, such as making handicrafts (Figure 3 Indoor Objects, I) and decorations (Figure 3 Indoor Objects, A). Self-disclosure of mental status in quarantine such as anxiety or hopefulness was typical along with this type of visual diary, which is further demonstrated in Section 4.2. According to the model pretrained on specific indoor scenes (vincentclaes, 2022), the top 5 most frequent indoor items include (1)buffet (9.4%, N=1082): Food supply and cooking555We note the contextual interpretations of each category after observing a series of examples with the given label.; (2) artstudio (9.3%, N=1072): Handicrafts, paintings, calligraphy, and homework; (3) inside_subway (7.8%, N=894): Actually as close-range photos of indoor family activities (e.g., playing with pets); (4) airport_inside (4.8%, N=553): Actually as spacious lobbies (sometimes with people queuing for the nucleic acid test); (5) greenhouse (4.8%, N=550): Potted plants, vegetables, fruits.
-
•
Outdoor scenes (17.2%, N=11,234): Outdoor photos such as streets, parks and attractions. Many images in this category demonstrated the emptiness of the city during the COVID-19 lockdown (e.g., Figure 3 Outdoor Scenes, C), expressing the wish for a normal life. Also, some outdoor photos served as real-time proof of situations in the local community, such as the location of checkpoints of movement pass (Figure 3 Outdoor Scenes, D) and the crowdedness of a specific COVID-19 test point that reminded community members to come later (Figure Outdoor Scenes, J). According to the scene-based pre-trained model (Kalliatakis, 2017), the top 5 most frequent outdoor items are (1) staircase (16.0%, N=1795): Actually as Chinese buildings especially ancient towers with storeyed shapes, such as Figure 11 B; (2) artstudio (14.0%, N=1574): Supply distribution points; (3) ice_cream_parlor (7.7%, N=868): Actually as the lockdown checkpoints or COVID-19 test points; (4) campus (5.1%, N=576): (empty) campus grounds and buildings; (5) hospital (4.0%, N=447): Outdoor scenes with doctors or workers in biohazard suites.
-
•
People (16.9%, N=11,040): Images of humans in the outbreak. Two important sub-themes of this category were (1) selfies and photos of families (e.g., Figure 3 People, A and I), notable types of social media images to show their lives to others and connect with audiences (Manikonda and De Choudhury, 2017; Hu et al., 2014; Marwick, 2015), which might be valuable for social connections during lockdown; and (2) photos of medical staff and community workers, some recording and appreciating their contributions and sacrifices during the crisis (e.g., Figure 3 People, F), and some showing conflicts between community workers and residents and criticizing specific workers on their abuse of power during the lockdown (e.g., Figure 3 People, H). Note that the theme People did not necessarily contradict with indoor objects or outdoor themes; both the two categories also contained a noteworthy proportion of photos with humans. However, we noticed that compared to people, human images categorized into outdoor scenes typically suggested significant environmental knowledge (e.g., surroundings of the lockdown checkpoint and COVID-19 test queue in Figure 3 Outdoor Scenes, D & J), while those classified as indoor objects often “spotlighted” items of quarantine life (e.g., Christmas tree in Figure 3 Indoor Objects, A and supply in Figure 3 Indoor Objects, G). Such subtle differences captured by the model were meaningful in distinguishing different crisis-related messages in the event.
-
•
Food (9.7%, N=6,532): plated food and drinks. In addition to recording everyday dishes, these food images also communicated information about the food supply of the local community during the lockdown to other affected citizens in the city.
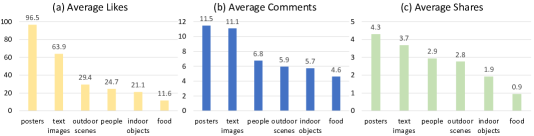
Different visual themes exhibited substantial differences in public engagement indexes (i.e., likes, comments, and shares) as shown in Figure 4. The differences in average comments and shares between visual themes were statistically significant under the one-way ANOVA test (). Generally, users were most engaged in posts with posters images which received the most likes, comments, and shares, followed by text images. In comparison, users were less engaged in the other four “visual diary” categories. One potential reason might be that visual messages passed through posters and text images (e.g., screenshots of government-posted articles) were more likely to be generalized to different settings and useful to other citizens, while photos recording daily life might be more personal and related to specific scenarios.
RQ1 Summary: Through image clustering, we captured a comprehensive taxonomy of crisis visual themes during a COVID-19 local outbreak, including posters and text images as two text-embedded categories, and four “visual diary” types presenting life in lockdown. These visual themes attracted different levels of user engagement (e.g., posters and text images received more likes, comments, and shares). It demonstrated the diversity of visual communication during a local outbreak in Chinese social media, and implicitly reflected some specialized use of crisis images, such as the prevalence of posters relating to the latest and authoritative information. In the next section, we explicitly described how these diverse visual themes were adopted for different informational and emotional goals, providing a quantitative view of visual-text correlation.
4.2. RQ2: Visual Goals
Through text analysis of the posts that contained crisis images, we unveiled how different themes of crisis images were adopted for different objectives in information sharing and emotional expression during the COVID-19 outbreak. These findings provided a comprehensive picture of the crisis communication goals of crisis images.
4.2.1. Descriptive Statistics
Using the information theme classifier described in Section 3.4.1, we captured the proportion of four information themes in crisis-related posts during the local outbreak. Specifically, situational information (N=26,963, 37.6%) and attitude disclosure (N=25,291, 35.2%) were the two most popular information categories. The prevalence of these two categories echoes prior works on crisis response (He et al., 2022; Qu et al., 2011, 2009). Life recording under lockdown accounted for 20.0% crisis-related posts (N=14,389), and information about the latest policies and measures had the smallest proportion (N=7.2%, N=5,136).
The text emotion analysis revealed that in addition to the neutral category, two negative emotions (i.e., annoyed and anxious) and two positive emotions (i.e., hopeful and appreciative) characterized emotions that users disclosed during the local outbreak. In the whole dataset, the total proportion of negative emotions (22.5%, with and ) was close to the total proportion of positive emotions (23.4%, and ). Therefore, there was an upsurge in negative emotions in the aftermath of the pandemic compared to the initial COVID-19 outbreak in Wuhan in Chinese social media (Wang et al., 2020a). It highlighted the prevalence of anxiety and annoyance, serving as a warning of unhealthy mental well-being that might be due to COVID-19 fatigue (WIlliams and Dienes, 2021; Deng et al., 2023) under repetitive and uncertain outbreaks.
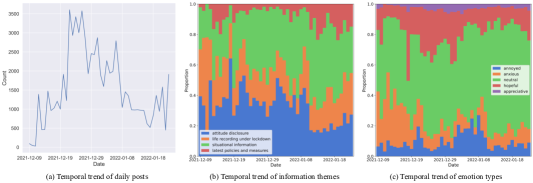
Figure 5 described the temporal trends of post volume, information themes and emotion types during the event. The number of posts gradually increased at the early stage of the outbreak, and reached the first peak on Dec. 22, 2021 with the announcement of lockdown (Wikipedia, 2022). The discourse gradually tapered off around Jan. 10, 2022 when the social transmission was controlled with no new cases (Wikipedia, 2022). The information themes and emotion types exhibited notable temporal patterns along with the development of the local outbreak. Specifically, latest policies and measures accounted for a significant proportion during the initial and final phases of the event. Situational information gradually grew at the onset of the outbreak and became stable since the lockdown. Besides, attitude disclosure was prevalent until the outbreak was brought under basic control. For emotion types, anxious prevailed at the outset of the outbreak, and annoyed manifested two peaks, one during the initial lockdown period and another after the lockdown had been in effect for some time. Meanwhile, hopeful posts remained in a great amount during the lockdown period with the decrease of cases.
These descriptive statistics helped to contextualize the crisis imagery regarding information sharing and sentiment expression in the corpus. Next, we focused on how different types of crisis images were adopted for different informational and emotional goals.
4.2.2. Information Sharing
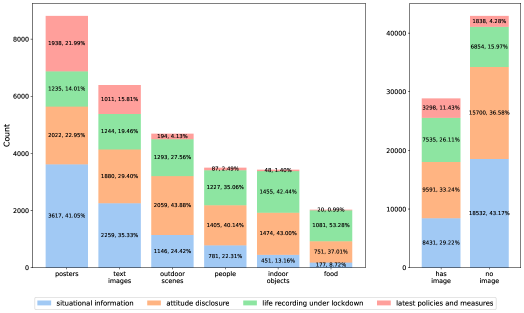
Figure 6 demonstrates the proportions of crisis information themes in different types of crisis images. Through a chi-square test, we revealed that there was a statistically significant difference in shared information among different crisis image types (). It suggests that the types of images used in a post largely correlated with the messages the post aimed to target. We underscore the following critical findings: (1) Compared to crisis-related posts without images, image-attached posts were far more widely adopted to share the latest policies and measures. It indicates that images were widely leveraged to signify or demonstrate formal and official information, which will be further illustrated in Section 4.3; (2)posters contained the highest proportion of situational information (41.05%, N=3617) and the latest policies and measures (21.99%, N=1938), followed by text images. In comparison, all remaining categories had less than 25% situational information and less than 5% latest policies and measures. This finding indicates that posters and text images had been broadly used to transmit policies and other situational information that were crucial in crisis response; (3) People, outdoor scenes, indoor objects and food all had a high proportion (greater than 70%) of posts for life recording under lockdown and attitude disclosure. Therefore, these four crisis image categories largely captured and embodied the public livelihood and mentality, which is crucial when strict lockdown measures are enforced (Sameer et al., 2020; Adams-Prassl et al., 2020).
4.2.3. Sentiment Expression
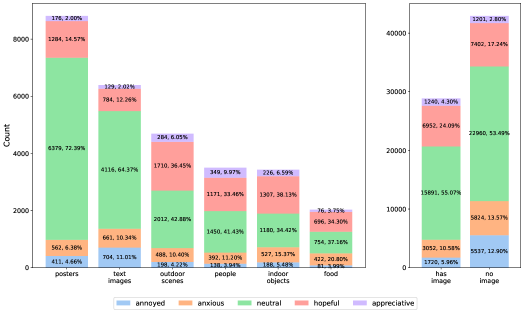
Figure 7 demonstrates the proportions of crisis-related emotions in different types of crisis images. The chi-square test denoted that there was a statistically significant difference in expressed emotions among different crisis image types (). We note the following important findings: (1) crisis-related posts containing images were generally more positive than posts without images; (2) posters was the most emotionally-neutral category containing 72.4% neutral posts (N=6379), followed by text images, which might be related to their nature for illustrating or signifying crisis-related information. Nevertheless, text images contained a notable proportion of negative emotions. After manually reviewing a set of samples, we realized that users frequently posted screenshots (as text images) to disclose their anxiety when the COVID-19 situation got worse (e.g., screenshots of an authoritative article on newly confirmed cases), or annoyance at the negligence of some staff (e.g., screenshots of chat revealing some staff’s abuse of power); (3) outdoor scenes and people were strongly correlated with positive emotions, e.g., using outdoor scenery to express the wish for a normal life. In particular, the people category had the highest proportion of appreciative emotion, when some users posted photos of medical staff to express their gratitude; (4) food was surprisingly the most negative category, especially with the highest anxiety percentage. We observed that some users posted food images to express their worry about food shortages or dissatisfaction with the food supply under lockdown; (5) indoor objects, recording the isolated quarantine life, was the most emotional category with high volumes of both positive and negative emotions.
RQ2 Summary: Through text classification, we unveiled four dominant information types (i.e., Situational Information, Attitude Disclosure, Life Recording under Lockdown, and Latest Policies and Measures) and five emotion categories (Hopeful, Appreciative, Neutral, Annoyed, and Anxious) in the corpus, and quantified their correlations with crisis visual themes. Results indicated statistically significant differences in shared information and expressed emotions among different crisis image types, e.g., the wide use of posters in disseminating the latest policies and measures, and the prevalence of anxious emotions regarding food images. These findings demonstrate inter-modality correlations in crisis communication. In the next section, we provide more nuances on such inter-modality correlation, revealing how the strategic use of visuals complemented text narratives and contributed to effective crisis communication.
4.3. RQ3: Visual Strategies
In this section, we demonstrate representative strategies of social media images to facilitate crisis communication, including images as signs of authority, images as visual-based information enhancement, images as evidence to improve credibility, and images as triggers for empathy.
4.3.1. Images as Signs of Authority
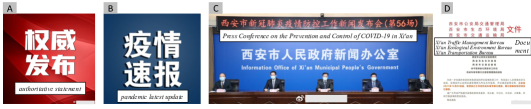
Adopting crisis images to signify authority surprisingly characterized visual crisis communication during the local outbreak in China as shown in Figure 8. These signposting images, typically as posters or text images, might not contain rich authoritative information in themselves, yet helped to capture public attention, and attracted users to read the post text with authoritative situation updates or guidelines. Typical examples of this strategy are posters with some big-character text (e.g., “authoritative statement” in Figure 8a, and “pandemic latest updates” in Figure 8b) embedded in a solid-color background, a clear indicator of official information in Chinese social media. Poster-style photos of officials in the epidemic prevention press conference (Figure 8c) were another kind of sign that implied an authoritative message in the text. Some users also forwarded text images of government documents in COVID-19 management (Figure 8d) to signify the authority of the transmitted text. Original posts along with this crisis image type mostly communicated the latest policies and measures. As the quantitative evidence, about 90% image-attached posts of latest policies and measures had dominant visual types as posters (58.8%) and text images (30.7%), accounting for also about 60% of all latest policies and measures posts. Besides, latest policies and measures posts using posters or text images, typically as authority signs, also attracted more likes (=45.2), comments (=6.8) and shares (=3.0) on average compared to those with other visuals (=14.2, =4.4, =2.5) or without images (=29.6, =4.6, =1.2). These images shed light on how official, organizational, and individual users leveraged visuals to denote and strengthen the authority of posts, and thus promote the transmission and acceptance of the communicated crisis information during the local outbreak.
4.3.2. Images as Visual-based Information Enhancement
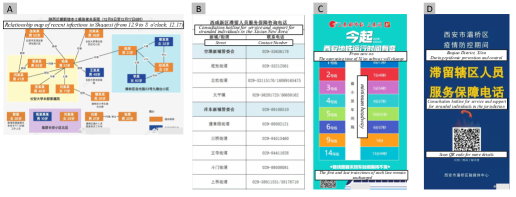
How experts and citizens use data visualization language (e.g., chart-based temporal visualization and map-based geospatial visualization) to better present crisis information has been a focus in crisis informatics literature (Perovich et al., 2022; Zhang et al., 2021; Bica et al., 2019). This work revealed that users leveraged diverse visual representations, as “visualizations” in a broad sense, to convey what was difficult or obscure to express through plain language. Such crisis images well supplemented and enhanced situational crisis information in the post text. For example, Figure 9a applied a diagram to elucidate the relationship and location of the infected population through epidemiological investigation, and Figure 9b used a table to clearly summarize helplines in different districts during the local outbreak. QR codes, a special pattern to condense and route useful crisis information, were also frequently observed to achieve information augmentation, such as in Figure 9c (public transport update during lockdown) and Figure 9d (helplines during lockdown). These visualizations were mostly classified into posters with a text-embedded visual style, which comprised 42.9% visual use in situational information. Indeed, posters were not only more likely to be adopted in situational information posts (compared to the 30.5% posters use among all posts), but also achieved higher user engagement in situational information (=189.9, =18.7, =7.0) than other visuals (=79.7, =11.9, =6.7). These examples point to ways in which multimodal communication with crisis images could enrich the presented situational knowledge in local outbreaks, going beyond what plain language could capture.
4.3.3. Images as Evidence to Improve Credibility
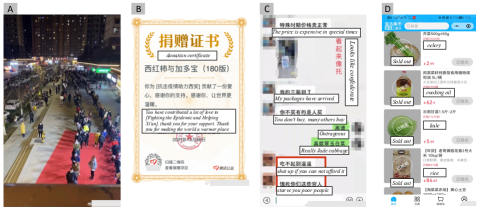
Information credibility on social media has been a concern during health crises when rumors, conspiracy, and misinformation abound (Zarocostas, 2020; Sommariva et al., 2018; Kou et al., 2017). We found that social media users widely took images as evidence to improve the credibility of the shared information during the local break. Such visual evidence can either be physical photos (e.g., Figure 10a proving the crowdedness of COVID-19 test in a local community), digital pictures (e.g., Figure 10b proving poster’s donation), or screenshots of mobile applications (e.g., Figure 10c and Figure 10d). Such visual evidence was a powerful way to demonstrate one’s difficulties and challenges, especially when social media users in non-affected areas had no concrete idea of the local outbreak situation. For example, Figure 10c used a chat screenshot to reveal the price gouging during the local outbreak, and Figure 10d used a screenshot of an online shopping and ordering platform to give evidence of the supply shortage, both of which were persuasive ways to deliver particular challenges in the crisis. These images provide empirical evidence of how users took advantage of crisis images to convince others on social media. Nevertheless, we warn that visual-enhanced persuasion might potentially be more detrimental when containing unverified information, which is detailed in Section 5.1.
4.3.4. Images as Triggers for Empathy
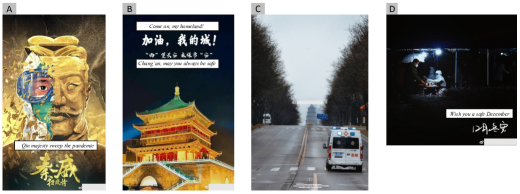
Through inductive coding, we identified that images were widely used as triggers to gain empathy and build emotional connections during the outbreak. Such images typically contained cultural, societal, or situational visual constructs that captured the sharing experience of the affected local population. For instance, Figure 11a and Figure 11b represent Terracotta Warriors and ancient buildings respectively, which were cultural symbols of the Xi’an city. The cultural symbols were integrated into the local challenge of the COVID-19 crisis, serving a role to call for unity and courage to overcome the difficulty. Figure 11c and Figure 11d used field photos of an empty street and a COVID-19 test at night to raise empathy among local residents under quarantine, expressing the wish for normal life and admiration of medical staff. In particular, we also found that visual use was more prevalent among positive (hopeful, appreciative) posts (48.8%) rather than neutral (40.9%) or negative (annoyed, anxious) ones (29.6%), potentially indicating the wider adoption of affective visuals in triggering and transmitting positive energy (Lu et al., 2021). Besides, when both neutral or negative posts had text images and posters as the two most popular visual themes, hopeful posts were mostly characterized by outdoor scenes (24.6%), potentially due to their use as symbols building emotional proximity; similarly, appreciative posts had people as the most dominant visual theme (28.1%), when photos of medical staffs were given emotional values in collectively expressing gratitude. These examples shed light on how users exploited the power of the emotional contagion of visual symbols for collective emoting during a crisis.
RQ3 Summary: In this section, we described rich and nuanced strategies of crisis image use in contributing to effective crisis communication, including images as signs of authority, images as visual-based information enhancement, images as evidence to improve credibility, and images as triggers for empathy. These findings not only revealed the unique values of visual narratives in engaging, persuasion, and emoting, but also reflected how the strategic use of crisis images supplemented and enhanced text narratives to fulfill informational and emotional needs.
5. DISCUSSION
By investigating themes, goals, and strategies of crisis images in a COVID-19 local outbreak, this work enriches the understanding of the unique patterns and values of social media crisis imagery. In this section, we discuss the opportunities and challenges along with the proliferation of crisis imagery, and rethink the complementary roles of crisis images and language in crisis communication. We finally provide design implications for image-based searching and image-combined moderation to facilitate accurate and effective visual crisis communication.
5.1. Unpacking Visual Crisis Communication on Social Media: Opportunities and Challenges
Existing work largely focuses on textual crisis communication to comprehend how people collaboratively cultivate situational awareness, develop risk perceptions, and provide informational and emotional support on social media under health crises (e.g., (Kou et al., 2017; Gui et al., 2018; Tsai et al., 2021)). This work contributes to the literature on crisis communication by comprehensively unpacking the visual use on social media during a COVID-19 local outbreak. We reveal how crisis imagery could be rich and nuanced in themes, goals, and strategies, and play a significant role in fulfilling diverse communication needs in crises. In this section, we situate our findings within the existing literature, uncovering opportunities and challenges of visual communication.
Users developed diverse crisis visual use to adapt to specific needs during local outbreaks. For example, text images embedded rich situational information in a single image, providing a convenient way for cross-platform sharing; in comparison, posters strengthened the timeliness and credibility with highlighted meta information, managing to capture the audience’s attention to the post text. Even different visual symbols of “visual diary” such as selfies and food, common in general social media for self-disclosure and social connection (Manikonda and De Choudhury, 2017; Hu et al., 2014), could convey crisis-specific information that visually enhances mutual understanding, cultivates situational awareness, and facilitates decision making (e.g., photos of long queues waiting for COVID-19 tests implying the crowdedness, and food images indicating community supply). These findings reflect the diversity and malleability of crisis imagery in conveying situational information with public wisdom. It provides new evidence of self-organized civic participation and collective intelligence for crisis response (Palen et al., 2010; Dailey and Starbird, 2015) through social media images, and adds nuances to the understanding of strategic communication in collectively cultivating risk perceptions and assessments (Demuth et al., 2018; Gui et al., 2017). In addition, these findings demonstrate that images could be a rich resource for public health researchers to uncover public understanding and attitudes towards health crises and crisis-related policies, which resonates with prior work (He et al., 2021b; Garimella et al., 2016). When images carry significant crisis communication roles, excluding image-based information could potentially lead to biases in understanding public opinions.
This work also revealed simple yet powerful emotional narratives (Wang et al., 2019; Perovich et al., 2022) in crisis images that could raise empathy among those sharing similar experiences and identities as described in Section 4.3.4. A photo of an empty fridge might express more anxiety than a large paragraph describing the food shortage, and a motivational poster integrating local cultural symbols might evoke more unity and courage than one thousand words. To this end, visual cues would not only serve as a vehicle for emotional disclosure (Manikonda and De Choudhury, 2017), but also establish emotional connections and stimulate solidarity among the affected populations in the crisis. It provides a new perspective on how visual narratives manage to build collective memory (Porter et al., 2020) through cultural, societal, and situational constructs to transmit specific emotions during crises. We also discovered the strong correlation between visual cues and the expressed emotions given the specific context in Section 4.2 (e.g., the prevalence of anxiety in food images). These findings provided empirical evidence on how different visual symbols might be given different emotional values in the crisis setting, shedding light on the potential of affective visualization for crisis response (Perovich et al., 2022).
On the other hand, given that crisis response and politics are tightly intertwined (Jasanoff et al., 2021), we warn that such emotion-embedded crisis images might be exploited to weaponize emotion for political purposes (Boler and Davis, 2021; Seo, 2014) or conspiracy theories (Kou et al., 2017). When particular emotions like fear or anger may influence people’s crisis assessment and response (Demuth et al., 2018; Lindell et al., 2016), weaponized emotion may lead to biased perceptions and even exacerbate rumors and conflicts during crises. Such a hidden danger was particularly notable when prioritizing information valence over veracity characterizes crisis communication in Chinese social media (Lu et al., 2021). As such, it is significant for future work to situate crisis images in the sociopolitical context and examine the dynamics of affective visual narratives surrounding political objectives, persuasive communication, and information credibility.
This work also enriches the understanding of how visual-based misinformation (Brennen et al., 2021) may go viral during local outbreaks. The information gap between local and non-local populations (or even different local communities during lockdown) naturally characterizes local outbreaks (Tsai et al., 2021), in which crisis images shared by local stakeholders can be particularly persuasive. Section 4.3.3 indicates that images, whether field photos or digital screenshots, were frequently used as evidence to improve credibility when “pictures don’t lie”. It vastly increases the misinformation risk when pictures do lie - for example, rumors expressed in faked screenshots of chat history (News, 2021a), or appropriated photos from other scenarios (Bica et al., 2017). The emotions embedded in visual narratives may further promote the spread of visual-based misinformation. Therefore, we suggest future researchers look into the dynamics of how image-based misinformation affects local/non-local user perceptions and online/offline crisis response (Brennen et al., 2021; Dewan et al., 2017; Tomonto, 2019), pay attention to the debunking effort of individuals and communities, and develop AI-supported or crowdsourcing-based countermeasures to cope.
5.2. Multimodal Crisis Communication: Rethinking the Complementary Roles of Crisis Images and Language
Images and language, two common modalities in social media, have been considered as two supplementary vehicles for communication and jointly provide affecting and persuasive narratives (Manikonda and De Choudhury, 2017). Nonetheless, how visual and linguistic elements complement each other to fulfill informational and emotional needs in crisis communication has been less investigated. This work reveals the nuances of the complementary roles of the two modalities in crisis communication.
Through qualitative analysis of crisis images within the context of a post, we revealed the distinct strategies of images to spotlight, enhance, and enrich situational information in the text. Images could either serve as simple yet powerful signs of authority (Section 4.3.1), catching public attention on the text-based authoritative guidelines; work as an auxiliary component to support and verify the linguistic argument (Section 4.3.3), visually improving the information credibility; or embody rich situational information within images themselves through various visualization approaches (Section 4.3.2), thus breaking the limit that text can express. These findings enrich the understanding of multimodal information sharing (Osatuyi, 2013) by unpacking dynamics of visual-language correlations in crises. Crisis images are more than a standalone component with visualized information, but connect with text and enhance the entire information through attention attraction, credibility indication (Osatuyi, 2013) and information embodiment (Perovich et al., 2022). These visual-language correlations exhibit the potential to correspondingly alleviate the critical challenges in heterogeneity, credibility, and quality of crisis information on social media (Palen et al., 2010). Moreover, the inter-modality correlations also afford user empowerment with evolving user-developed strategies for effective crisis communication, which resonates with prior work (Pulos, 2020; He et al., 2021a). To this end, we call for more fine-grained investigations of public strategies in establishing visual-language correlations to cope with specific challenges in crisis communication (e.g., attracting attention to critical posts among heterogeneous crisis information (He et al., 2022)), and how they influence risk perceptions and emergency responses.
Social media images also play an irreplaceable role that complements language in communicating emotions during crises. On the one hand, visual elements afford particular values in emotion expression through emotion embodiment (Perovich et al., 2022) and emotion contagion through constructing collective memory (Bica et al., 2017; Porter et al., 2020), which extend beyond linguistic narratives. On the other hand, when image-based emotion venting might suffer from ambiguity and subjectivity in interpretation (Bica et al., 2017), language is critical for contextualizing the visual constructs and facilitating emotion comprehension, achieving complementarity in emotional communication. On this note, it is warranted for future work to examine the strategic use and misuse of inter-modality emotional connections in crisis settings. For example, it is significant in understanding how conspiracy theorists may build malicious inter-modality connections (Micallef et al., 2022), e.g., situating unrelated but emotional crisis images within misinformation, to promote the spread of crisis-related rumors.
Generally, this work enriches the understanding of inter-modality correlation that empowers users for strategic crisis communication. Unpacking such inter-modality correlation would be as important as understanding information in each modality. Therefore, we suggest a holistic view that takes the text and visual as an organic whole for further researchers to get a comprehensive understanding of multimodal crisis communication (Unal et al., 2022), focusing on not only the uniqueness of one modality, but also the correlation and complementarity between modalities.
5.3. Design Implications
5.3.1. Implications for Crisis Information Seeking
This work unpacks the significant role of crisis imagery, from authoritative guidelines through text images to situation descriptions through on-site photos, in communicating situational crisis information. Such public-generated visual knowledge, as supplements to textual information, is meaningful for both local victims who may be subject to movement restrictions and non-local people who may lack a comprehensive understanding of crisis (Bica et al., 2019). That warrants an overarching design goal in supporting multimodal crisis information seeking.
First, this work indicated the feasibility of automatic algorithms in classifying diverse crisis visuals, which were correlated with different informational and emotional goals. It sheds light on the potential of AI-supported visual categorization to enhance crisis visual seeking. For example, the affordance of filtering based on AI-generated crisis visual categories could empower users to navigate all visuals categorized as “text images” to quickly find authoritative documents in crisis management.
Besides, we suggest designers broadly leverage the natural connection of multimodal data to help users sift through crisis information. For instance, during crises with movement restrictions (e.g., lockdowns or natural disasters), the navigation of crisis visuals could largely benefit from the incorporation of geolocation information. This work revealed users’ wide adoption of in-situ photos, such as outdoor scenes of COVID-19 test queues or supply locations, in spreading situational information. Nonetheless, other users may not easily capture such context-specific visual information under the overwhelming amount of crisis-related data (Imran et al., 2020). In this scenario, allowing users to view the “outdoor” visual category and sort based on location proximity could empower them to easily acquire situations in the local community.
Finally, we suggest designers actively situate crisis information systems within the sociocultural and sociopolitical context to propose specific interfaces for crisis communication. For example, when it is a norm to deliver authoritative guidelines along with visual authority signs in Chinese social media (as shown in Section 4.3.1), automatically identifying authority signs and affording the interface to browse relevant posts could support the seeking of authoritative crisis information.
5.3.2. Implications for Crisis Information Moderation
The findings on crisis visual strategies in Section 4.3 indicated that crisis images were often endowed with additional roles for crisis communication such as signifying authority, enhancing information, or triggering public emotions. Such visual use was typically correlated with higher public engagement indexes. These visual strategies could enhance crisis communication when properly delivered, but might also contribute to the spread of misinformation if the veracity was unchecked. Therefore, we suggest design interventions particularly pay attention to such critical visual use in crisis communication. For example, an AI-supported tool that prioritizes images with critical roles (e.g., images signifying authority) in fact-checking might help capture high-risk misinformation before its wide dissemination. Also, such visual-role reminders could be embedded into before-posting nudges (Jahanbakhsh et al., 2021) or during-exposure warnings (Jia et al., 2022) (e.g., remind sharers by “This image indicates the authority of the post text. Please double-check the content”).
5.4. Technical Implications
This study also revealed the limitations of current methodologies that would be valuable to note for further multimodal analysis of crisis communication. First, this work reflected how a lack of cross-cultural and in-domain datasets may bring unexpected algorithmic misinterpretations for multimodal analysis in the crisis setting. For example, deep learning models pretrained on scene-specific datasets wrongly categorized COVID-19 lockdown checkpoints in China as ice cream parlors. Such constraints also naturally limited the generalization of more fine-grained crisis-related types through image clustering. Therefore, it warrants the development of large-scale multimodal datasets for specific crisis settings, which echoed prior work (Imran et al., 2020; Alam et al., 2018). A more high-level challenge was that mainstream object-centered analytic tools (e.g., image classification and object detection) may fail to unpack the nuanced roles of multimodal crisis communication. For example, recognizing an image as a “chat screenshot” might be less meaningful compared to revealing its actual goal as “evidencing challenges mentioned in the post”. Therefore, content analysis might be only the starting point in understanding multimodal crisis communication rather than the ultimate goal.
On the other hand, the analytical approach employed in this study has highlighted potential avenues for conducting multimodal analyses of crisis-related data. We provide empirical evidence on the feasibility of transfer learning in understanding multimodal crisis communication, which could largely reduce the burden of manually curating labels. Also, this work integrated CV-based visual analysis and NLP-based text analysis to unpack the visual-language correlations for crisis communication. It enlightens a promising direction to adopt multimodal deep learning models (Xu et al., 2023) to process multimodal crisis data as an organic whole.
5.5. Limitations
This work investigated the themes, goals, and strategies of social media crisis images during a COVID-19 local outbreak, deepening the understanding of visual crisis communication in HCI and CSCW. Nonetheless, this work has the following limitations: (1) this work focuses on a COVID-19 local outbreak in China in the aftermath of the pandemic. Therefore, some findings may not be generalized to other health crisis settings; (2) the image clustering method managed to capture visual elements such as people and objects in crisis images, but was still limited in discerning detailed visual themes, such as topics of text image; (3) as a secondary analysis, we did not investigate how the affected population perceived crisis images, and understanding users’ perceptions on crisis images might provide more in-depth findings of the crisis visual strategies. When multimodal crisis communication has been an increasingly prevalent practice, we call for broad investigations into different crisis communication settings to reveal the full potential of crisis imagery. As a further step, it is also of great significance for future work to propose and evaluate proof-of-concept interfaces to facilitate and enhance visual crisis communication as well as maximally reduce visual-based misinformation.
6. CONCLUSION
This work makes the first investigation into how crisis communication is characterized and facilitated by social media crisis images during a COVID-19 local outbreak. Focusing on the Xi’an local outbreak in China, we collected 345,423 crisis-related posts and 65,376 original images on a popular Chinese social media platform Weibo, and conducted a mixed-methods study to understand visual themes, goals, and strategies in crisis communication. Through an image clustering approach, we unpacked the diversity of crisis imagery with two text-embedded visual categories (i.e., posters and text images) and four “visual diary” types that recorded life during the event (e.g., outdoor scenes during quarantine). We demonstrated how different visual types were leveraged to fulfill various informational and emotional communication goals, e.g., using text-highlighted posters to signify the latest policies and embedding anxiety into visual diaries of quarantine life. Users developed strategic use of crisis images as signs of authority, visual-based information enhancement, evidence to improve credibility, and triggers for empathy. We discuss opportunities and challenges of visual crisis communication, reflect on the inter-modality correlation and complementarity, and propose design implications to facilitate effective and accurate visual crisis communication.
References
- (1)
- Abdullah et al. (2015) Saeed Abdullah, Elizabeth L Murnane, Jean MR Costa, and Tanzeem Choudhury. 2015. Collective smile: Measuring societal happiness from geolocated images. In Proceedings of the 18th ACM Conference on Computer Supported Cooperative Work & Social Computing. 361–374.
- Abouk and Heydari (2021) Rahi Abouk and Babak Heydari. 2021. The immediate effect of COVID-19 policies on social-distancing behavior in the United States. Public health reports 136, 2 (2021), 245–252.
- Adams-Prassl et al. (2020) Abi Adams-Prassl, Teodora Boneva, Marta Golin, and Christopher Rauh. 2020. The impact of the coronavirus lockdown on mental health: evidence from the US. (2020).
- Alam et al. (2018) Firoj Alam, Ferda Ofli, and Muhammad Imran. 2018. Crisismmd: Multimodal twitter datasets from natural disasters. In Twelfth international AAAI conference on web and social media.
- Andalibi et al. (2017) Nazanin Andalibi, Pinar Ozturk, and Andrea Forte. 2017. Sensitive Self-disclosures, Responses, and Social Support on Instagram: the case of# depression. In Proceedings of the 2017 ACM conference on computer supported cooperative work and social computing. 1485–1500.
- Asif et al. (2021) Amna Asif, Shaheen Khatoon, Md Maruf Hasan, Majed A Alshamari, Sherif Abdou, Khaled Mostafa Elsayed, and Mohsen Rashwan. 2021. Automatic analysis of social media images to identify disaster type and infer appropriate emergency response. Journal of Big Data 8, 1 (2021), 1–28.
- Bakhshi et al. (2015) Saeideh Bakhshi, David Shamma, Lyndon Kennedy, and Eric Gilbert. 2015. Why we filter our photos and how it impacts engagement. In Proceedings of the International AAAI Conference on Web and Social Media, Vol. 9. 12–21.
- Bica et al. (2019) Melissa Bica, Julie L Demuth, James E Dykes, and Leysia Palen. 2019. Communicating hurricane risks: Multi-method examination of risk imagery diffusion. In Proceedings of the 2019 CHI Conference on Human Factors in Computing Systems. 1–13.
- Bica et al. (2017) Melissa Bica, Leysia Palen, and Chris Bopp. 2017. Visual representations of disaster. In Proceedings of the 2017 ACM conference on computer supported cooperative work and social computing. 1262–1276.
- Boler and Davis (2021) Megan Boler and E Davis. 2021. Affective politics of digital media. New York: Routledge.
- Bowe et al. (2020) Emily Bowe, Erin Simmons, and Shannon Mattern. 2020. Learning from lines: Critical COVID data visualizations and the quarantine quotidian. Big data & society 7, 2 (2020), 2053951720939236.
- Brantner et al. (2020) Cornelia Brantner, Katharina Lobinger, and Miriam Stehling. 2020. Memes against sexism? A multi-method analysis of the feminist protest hashtag# distractinglysexy and its resonance in the mainstream news media. Convergence 26, 3 (2020), 674–696.
- Brennen et al. (2021) J Scott Brennen, Felix M Simon, and Rasmus Kleis Nielsen. 2021. Beyond (mis) representation: Visuals in COVID-19 misinformation. The International Journal of Press/Politics 26, 1 (2021), 277–299.
- Brownson et al. (2020) Ross C Brownson, Thomas A Burke, Graham A Colditz, and Jonathan M Samet. 2020. Reimagining public health in the aftermath of a pandemic. American journal of public health 110, 11 (2020), 1605–1610.
- Chen et al. (2021) Yixin Chen, Ke-Rou Wang, Weikai Xu, and Yun Huang. 2021. Exploring Commenting Behavior in the COVID-19 Super-Topic on Weibo. In Extended Abstracts of the 2021 CHI Conference on Human Factors in Computing Systems. 1–7.
- Cho et al. (2023) Hichang Cho, Pengxiang Li, Annabel Ngien, Marion Grace Tan, Anfan Chen, and Elmie Nekmat. 2023. The bright and dark sides of social media use during COVID-19 lockdown: Contrasting social media effects through social liability vs. social support. Computers in Human Behavior 146 (2023), 107795.
- Cooke (2005) Lynne Cooke. 2005. A visual convergence of print, television, and the internet: charting 40 years of design change in news presentation. New Media & Society 7, 1 (2005), 22–46.
- Coombs (2020) W Timothy Coombs. 2020. Conceptualizing crisis communication. In Handbook of risk and crisis communication. Routledge, 99–118.
- Corbin and Strauss (2014) Juliet Corbin and Anselm Strauss. 2014. Basics of qualitative research: Techniques and procedures for developing grounded theory. Sage publications.
- Cui et al. (2021) Yiming Cui, Wanxiang Che, Ting Liu, Bing Qin, and Ziqing Yang. 2021. Pre-training with whole word masking for chinese bert. IEEE/ACM Transactions on Audio, Speech, and Language Processing 29 (2021), 3504–3514.
- Dailey and Starbird (2015) Dharma Dailey and Kate Starbird. 2015. ” It’s Raining Dispersants” Collective Sensemaking of Complex Information in Crisis Contexts. In Proceedings of the 18th ACM Conference Companion on Computer Supported Cooperative Work & Social Computing. 155–158.
- Daly and Thom (2016) Shannon Daly and James A Thom. 2016. Mining and Classifying Image Posts on Social Media to Analyse Fires.. In ISCRAM. Citeseer, 1–14.
- Demuth et al. (2018) Julie L Demuth, Rebecca E Morss, Leysia Palen, Kenneth M Anderson, Jennings Anderson, Marina Kogan, Kevin Stowe, Melissa Bica, Heather Lazrus, Olga Wilhelmi, et al. 2018. “Sometimes da# beachlife ain’t always da wave”: Understanding People’s Evolving Hurricane Risk Communication, Risk Assessments, and Responses Using Twitter Narratives. Weather, climate, and society 10, 3 (2018), 537–560.
- Deng et al. (2009) Jia Deng, Wei Dong, Richard Socher, Li-Jia Li, Kai Li, and Li Fei-Fei. 2009. Imagenet: A large-scale hierarchical image database. In 2009 IEEE conference on computer vision and pattern recognition. Ieee, 248–255.
- Deng et al. (2023) Yue Deng, Changyang He, and Bo Li. 2023. Understanding Emotional Disclosure via Diary-keeping in Quarantine on Social Media. In The Eleventh International Symposium of Chinese CHI.
- Devlin et al. (2018) Jacob Devlin, Ming-Wei Chang, Kenton Lee, and Kristina Toutanova. 2018. Bert: Pre-training of deep bidirectional transformers for language understanding. arXiv preprint arXiv:1810.04805 (2018).
- Dewan et al. (2017) Prateek Dewan, Anshuman Suri, Varun Bharadhwaj, Aditi Mithal, and Ponnurangam Kumaraguru. 2017. Towards understanding crisis events on online social networks through pictures. In Proceedings of the 2017 IEEE/ACM International Conference on Advances in Social Networks Analysis and Mining 2017. 439–446.
- Dosovitskiy et al. (2020) Alexey Dosovitskiy, Lucas Beyer, Alexander Kolesnikov, Dirk Weissenborn, Xiaohua Zhai, Thomas Unterthiner, Mostafa Dehghani, Matthias Minderer, Georg Heigold, Sylvain Gelly, et al. 2020. An image is worth 16x16 words: Transformers for image recognition at scale. arXiv preprint arXiv:2010.11929 (2020).
- Eriksson (2018) Mats Eriksson. 2018. Lessons for crisis communication on social media: A systematic review of what research tells the practice. International Journal of Strategic Communication 12, 5 (2018), 526–551.
- Fereday and Muir-Cochrane (2006) Jennifer Fereday and Eimear Muir-Cochrane. 2006. Demonstrating rigor using thematic analysis: A hybrid approach of inductive and deductive coding and theme development. International journal of qualitative methods 5, 1 (2006), 80–92.
- Ferrara et al. (2020) Emilio Ferrara, Stefano Cresci, and Luca Luceri. 2020. Misinformation, manipulation, and abuse on social media in the era of COVID-19. Journal of Computational Social Science 3, 2 (2020), 271–277.
- Garimella et al. (2016) Venkata Rama Kiran Garimella, Abdulrahman Alfayad, and Ingmar Weber. 2016. Social media image analysis for public health. In Proceedings of the 2016 CHI Conference on Human Factors in Computing Systems. 5543–5547.
- Gillies et al. (2005) Val Gillies, Angela Harden, Katherine Johnson, Paula Reavey, Vicky Strange, and Carla Willig. 2005. Painting pictures of embodied experience: The use of nonverbal data production for the study of embodiment. Qualitative research in psychology 2, 3 (2005), 199–212.
- Goldberger et al. (2002) Jacob Goldberger, Hayit Greenspan, and Shiri Gordon. 2002. Unsupervised image clustering using the information bottleneck method. In Joint Pattern Recognition Symposium. Springer, 158–165.
- Grimmer and Stewart (2013) Justin Grimmer and Brandon M Stewart. 2013. Text as data: The promise and pitfalls of automatic content analysis methods for political texts. Political analysis 21, 3 (2013), 267–297.
- Guérin et al. (2017) Joris Guérin, Olivier Gibaru, Stéphane Thiery, and Eric Nyiri. 2017. CNN features are also great at unsupervised classification. arXiv preprint arXiv:1707.01700 (2017).
- Gui et al. (2018) Xinning Gui, Yubo Kou, Kathleen Pine, Elisa Ladaw, Harold Kim, Eli Suzuki-Gill, and Yunan Chen. 2018. Multidimensional risk communication: public discourse on risks during an emerging epidemic. In Proceedings of the 2018 CHI Conference on Human Factors in Computing Systems. 1–14.
- Gui et al. (2017) Xinning Gui, Yubo Kou, Kathleen H Pine, and Yunan Chen. 2017. Managing uncertainty: using social media for risk assessment during a public health crisis. In Proceedings of the 2017 CHI conference on human factors in computing systems. 4520–4533.
- Guttman (2017) Nurit Guttman. 2017. Ethical issues in health promotion and communication interventions. In Oxford research encyclopedia of communication.
- He et al. (2022) Changyang He, Yue Deng, Wenjie Yang, and Bo Li. 2022. ” Help! Can You Hear Me?”: Understanding How Help-Seeking Posts are Overwhelmed on Social Media during a Natural Disaster. Proceedings of the ACM on Human-Computer Interaction 6, CSCW2 (2022), 1–25.
- He et al. (2021a) Changyang He, Lu He, Tun Lu, and Bo Li. 2021a. Beyond Entertainment: Unpacking Danmaku and Comments’ Role of Information Sharing and Sentiment Expression in Online Crisis Videos. Proceedings of the ACM on Human-Computer Interaction 5, CSCW2 (2021), 1–27.
- He et al. (2016) Kaiming He, Xiangyu Zhang, Shaoqing Ren, and Jian Sun. 2016. Deep residual learning for image recognition. In Proceedings of the IEEE conference on computer vision and pattern recognition. 770–778.
- He and He (2022) Lu He and Changyang He. 2022. Help Me DebunkThis: Unpacking Individual and Community’s Collaborative Work in Information Credibility Assessment. Proceedings of the ACM on Human-Computer Interaction 6, CSCW2 (2022).
- He et al. (2021b) Lu He, Changyang He, Tera L Reynolds, Qiushi Bai, Yicong Huang, Chen Li, Kai Zheng, and Yunan Chen. 2021b. Why do people oppose mask wearing? A comprehensive analysis of US tweets during the COVID-19 pandemic. Journal of the American Medical Informatics Association 28, 7 (2021), 1564–1573.
- Howard et al. (2017) Andrew G Howard, Menglong Zhu, Bo Chen, Dmitry Kalenichenko, Weijun Wang, Tobias Weyand, Marco Andreetto, and Hartwig Adam. 2017. Mobilenets: Efficient convolutional neural networks for mobile vision applications. arXiv preprint arXiv:1704.04861 (2017).
- Hu et al. (2014) Yuheng Hu, Lydia Manikonda, and Subbarao Kambhampati. 2014. What we instagram: A first analysis of instagram photo content and user types. In Eighth International AAAI conference on weblogs and social media.
- Huang et al. (2015) Y Linlin Huang, Kate Starbird, Mania Orand, Stephanie A Stanek, and Heather T Pedersen. 2015. Connected through crisis: Emotional proximity and the spread of misinformation online. In Proceedings of the 18th ACM conference on computer supported cooperative work & social computing. 969–980.
- Imran et al. (2020) Muhammad Imran, Ferda Ofli, Doina Caragea, and Antonio Torralba. 2020. Using AI and social media multimodal content for disaster response and management: Opportunities, challenges, and future directions. , 102261 pages.
- inspurer (2021) inspurer. 2021. WeiboSuperSpider. https://github.com/Python3Spiders/WeiboSuperSpider. Accessed: 2021-11-08.
- Jahanbakhsh et al. (2021) Farnaz Jahanbakhsh, Amy X Zhang, Adam J Berinsky, Gordon Pennycook, David G Rand, and David R Karger. 2021. Exploring lightweight interventions at posting time to reduce the sharing of misinformation on social media. Proceedings of the ACM on Human-Computer Interaction 5, CSCW1 (2021), 1–42.
- Jasanoff et al. (2021) Sheila Jasanoff, Stephen Hilgartner, J Benjamin Hurlbut, Onur Ozgode, and Margarita Rayzberg. 2021. Comparative Covid response: crisis, knowledge, politics. Ithaca: CompCoRe Network, Cornell University (2021).
- Jia et al. (2022) Chenyan Jia, Alexander Boltz, Angie Zhang, Anqing Chen, and Min Kyung Lee. 2022. Understanding Effects of Algorithmic vs. Community Label on Perceived Accuracy of Hyper-partisan Misinformation. Proceedings of the ACM on Human-Computer Interaction 6, CSCW2 (2022), 1–27.
- Joffe (2008) Hélène Joffe. 2008. The power of visual material: Persuasion, emotion and identification. Diogenes 55, 1 (2008), 84–93.
- Kalliatakis (2017) Grigorios Kalliatakis. 2017. Keras-VGG16-Places365. https://github.com/GKalliatakis/Keras-VGG16-places365.
- Khan et al. (2014) Kamran Khan, Saif Ur Rehman, Kamran Aziz, Simon Fong, and Sababady Sarasvady. 2014. DBSCAN: Past, present and future. In The fifth international conference on the applications of digital information and web technologies (ICADIWT 2014). IEEE, 232–238.
- Kou et al. (2017) Yubo Kou, Xinning Gui, Yunan Chen, and Kathleen Pine. 2017. Conspiracy talk on social media: collective sensemaking during a public health crisis. Proceedings of the ACM on Human-Computer Interaction 1, CSCW (2017), 1–21.
- Leavitt and Clark (2014) Alex Leavitt and Joshua A Clark. 2014. Upvoting hurricane Sandy: event-based news production processes on a social news site. In Proceedings of the SIGCHI conference on human factors in computing systems. 1495–1504.
- Leavitt and Robinson (2017) Alex Leavitt and John J Robinson. 2017. The role of information visibility in network gatekeeping: Information aggregation on Reddit during crisis events. In Proceedings of the 2017 ACM conference on computer supported cooperative work and social computing. 1246–1261.
- Li et al. (2019) Jing Li, Keri K Stephens, Yaguang Zhu, and Dhiraj Murthy. 2019. Using social media to call for help in Hurricane Harvey: Bonding emotion, culture, and community relationships. International Journal of Disaster Risk Reduction 38 (2019), 101212.
- Li et al. (2020) Jiawei Li, Qing Xu, Raphael Cuomo, Vidya Purushothaman, Tim Mackey, et al. 2020. Data mining and content analysis of the Chinese social media platform Weibo during the early COVID-19 outbreak: retrospective observational infoveillance study. JMIR Public Health and Surveillance 6, 2 (2020), e18700.
- Li et al. (2021) Xuyang Li, Antara Bahursettiwar, and Marina Kogan. 2021. Hello? Is There Anybody in There? Analysis of Factors Promoting Response From Authoritative Sources in Crisis. Proceedings of the ACM on Human-Computer Interaction 5, CSCW1 (2021), 1–21.
- Li et al. (2018) Xukun Li, Doina Caragea, Huaiyu Zhang, and Muhammad Imran. 2018. Localizing and quantifying damage in social media images. In 2018 IEEE/ACM International Conference on Advances in Social Networks Analysis and Mining (ASONAM). IEEE, 194–201.
- Lindell et al. (2016) Michael K Lindell, Carla S Prater, Hao Che Wu, Shih-Kai Huang, David M Johnston, Julia S Becker, and Hideyuki Shiroshita. 2016. Immediate behavioural responses to earthquakes in Christchurch, New Zealand, and Hitachi, Japan. Disasters 40, 1 (2016), 85–111.
- Lloyd (1982) Stuart Lloyd. 1982. Least squares quantization in PCM. IEEE transactions on information theory 28, 2 (1982), 129–137.
- Lowe (2004) David G Lowe. 2004. Distinctive image features from scale-invariant keypoints. International journal of computer vision 60, 2 (2004), 91–110.
- Lu et al. (2021) Zhicong Lu, Yue Jiang, Chenxinran Shen, Margaret C Jack, Daniel Wigdor, and Mor Naaman. 2021. ” Positive Energy” Perceptions and Attitudes Towards COVID-19 Information on Social Media in China. Proceedings of the ACM on human-computer interaction 5, CSCW1 (2021), 1–25.
- Manikonda and De Choudhury (2017) Lydia Manikonda and Munmun De Choudhury. 2017. Modeling and understanding visual attributes of mental health disclosures in social media. In Proceedings of the 2017 CHI Conference on Human Factors in Computing Systems. 170–181.
- Manikonda et al. (2016) Lydia Manikonda, Venkata Vamsikrishna Meduri, and Subbarao Kambhampati. 2016. Tweeting the mind and instagramming the heart: Exploring differentiated content sharing on social media. In Tenth international AAAI conference on web and social media.
- Marwick (2015) Alice E Marwick. 2015. Instafame: Luxury selfies in the attention economy. Public culture 27, 1 (75) (2015), 137–160.
- Marzouki et al. (2021) Yousri Marzouki, Fatimah Salem Aldossari, and Giuseppe A Veltri. 2021. Understanding the buffering effect of social media use on anxiety during the COVID-19 pandemic lockdown. Humanities and Social Sciences Communications 8, 1 (2021).
- McHugh (2012) Mary L McHugh. 2012. Interrater reliability: the kappa statistic. Biochemia medica 22, 3 (2012), 276–282.
- McHugh (2013) Mary L McHugh. 2013. The chi-square test of independence. Biochemia medica 23, 2 (2013), 143–149.
- Micallef et al. (2022) Nicholas Micallef, Marcelo Sandoval-Castañeda, Adi Cohen, Mustaque Ahamad, Srijan Kumar, and Nasir Memon. 2022. Cross-Platform Multimodal Misinformation: Taxonomy, Characteristics and Detection for Textual Posts and Videos. In Proceedings of the International AAAI Conference on Web and Social Media, Vol. 16. 651–662.
- Mortensen et al. (2017) Tara M Mortensen, Kevin Hull, and Kelli S Boling. 2017. Really social disaster: an examination of photo sharing on twitter during the# SCFlood. Visual Communication Quarterly 24, 4 (2017), 219–229.
- News (2021a) China News. 2021a. Analysis of recent epidemic rumors: chat screenshots and short videos become the main source (in Chinese). https://www.chinanews.com.cn/sh/2021/08-11/9541137.shtml. Accessed: 2022-09-09.
- News (2021b) China News. 2021b. The local epidemic in Xi’an, Shaanxi Province is caused by the delta variant, and there is hidden transmission (in Chinese). https://www.chinanews.com.cn/sh/2021/12-22/9635743.shtml. Accessed: 2022-09-14.
- Nguyen et al. (2017) Hanh TH Nguyen, Martin Wistuba, and Lars Schmidt-Thieme. 2017. Personalized tag recommendation for images using deep transfer learning. In Joint European Conference on Machine Learning and Knowledge Discovery in Databases. Springer, 705–720.
- Nishikawa et al. (2018) Shuji Nishikawa, Nozomi Tanaka, Keisuke Utsu, and Osamu Uchida. 2018. Time trend analysis of “# Rescue” tweets during and after the 2017 northern Kyushu heavy rain disaster. In 2018 5th International Conference on Information and Communication Technologies for Disaster Management (ICT-DM). IEEE, 1–4.
- of Public Health (2022) California Department of Public Health. 2022. COVID-19 Outbreak Data. https://www.cdph.ca.gov/Programs/CID/DCDC/Pages/COVID-19/COVID-19-Outbreak-Data.aspx. Accessed: 2022-09-14.
- Olteanu et al. (2015) Alexandra Olteanu, Sarah Vieweg, and Carlos Castillo. 2015. What to expect when the unexpected happens: Social media communications across crises. In Proceedings of the 18th ACM conference on computer supported cooperative work & social computing. 994–1009.
- Organization (2 07) World Health Organization. 2021-12-07. COVID-19 weekly epidemiological update, edition 69, 7 December 2021. Technical documents. 19 p. pages.
- Osatuyi (2013) Babajide Osatuyi. 2013. Information sharing on social media sites. Computers in Human Behavior 29, 6 (2013), 2622–2631.
- Palen et al. (2010) Leysia Palen, Kenneth M Anderson, Gloria Mark, James Martin, Douglas Sicker, Martha Palmer, and Dirk Grunwald. 2010. A vision for technology-mediated support for public participation & assistance in mass emergencies & disasters. ACM-BCS Visions of Computer Science 2010 (2010), 1–12.
- Pang et al. (2015) Ran Pang, Agustin Baretto, Henry Kautz, and Jiebo Luo. 2015. Monitoring adolescent alcohol use via multimodal analysis in social multimedia. In 2015 IEEE International Conference on Big Data (Big Data). IEEE, 1509–1518.
- Peng (2021) Yilang Peng. 2021. What makes politicians’ Instagram posts popular? Analyzing social media strategies of candidates and office holders with computer vision. The International Journal of Press/Politics 26, 1 (2021), 143–166.
- Perovich et al. (2022) Laura J Perovich, Meryl Alper, and Corey Cleveland. 2022. ” Self-Quaranteens” Process COVID-19: Understanding Information Visualization Language in Memes. Proceedings of the ACM on Human-Computer Interaction 6, CSCW1 (2022), 1–20.
- Porter et al. (2020) Emily Porter, PM Krafft, and Brian Keegan. 2020. Visual Narratives and Collective Memory across Peer-Produced Accounts of Contested Sociopolitical Events. ACM Transactions on Social Computing 3, 1 (2020), 1–20.
- Powell et al. (2015) Thomas E Powell, Hajo G Boomgaarden, Knut De Swert, and Claes H de Vreese. 2015. A clearer picture: The contribution of visuals and text to framing effects. Journal of communication 65, 6 (2015), 997–1017.
- Preim and Lawonn (2020) Bernhard Preim and Kai Lawonn. 2020. A survey of visual analytics for public health. In Computer Graphics Forum, Vol. 39. Wiley Online Library, 543–580.
- Pulos (2020) Rick Pulos. 2020. COVID-19 crisis memes, rhetorical arena theory and multimodality. Journal of Science Communication 19, 7 (2020), A01.
- Qu et al. (2011) Yan Qu, Chen Huang, Pengyi Zhang, and Jun Zhang. 2011. Microblogging after a major disaster in China: a case study of the 2010 Yushu earthquake. In Proceedings of the ACM 2011 conference on Computer supported cooperative work. 25–34.
- Qu et al. (2009) Yan Qu, Philip Fei Wu, and Xiaoqing Wang. 2009. Online community response to major disaster: A study of Tianya forum in the 2008 Sichuan earthquake. In 2009 42nd Hawaii International Conference on System Sciences. IEEE, 1–11.
- Quattoni and Torralba (2009) Ariadna Quattoni and Antonio Torralba. 2009. Recognizing indoor scenes. In 2009 IEEE conference on computer vision and pattern recognition. IEEE, 413–420.
- Reynolds (2009) Douglas A Reynolds. 2009. Gaussian mixture models. Encyclopedia of biometrics 741, 659-663 (2009).
- Ross et al. (2021) Stuart Ross, George Breckenridge, Mengdie Zhuang, and Ed Manley. 2021. Household visitation during the COVID-19 pandemic. Scientific reports 11, 1 (2021), 1–11.
- Rousseeuw (1987) Peter J Rousseeuw. 1987. Silhouettes: a graphical aid to the interpretation and validation of cluster analysis. Journal of computational and applied mathematics 20 (1987), 53–65.
- Saldaña (2021) Johnny Saldaña. 2021. The coding manual for qualitative researchers. The coding manual for qualitative researchers (2021), 1–440.
- Sameer et al. (2020) AS Sameer, MA Khan, S Nissar, and MZ Banday. 2020. Assessment of mental health and various coping strategies among general population living under imposed COVID-lockdown across world: a cross-sectional study. Ethics, Medicine and Public Health 15 (2020), 100571.
- Sandler et al. (2018) Mark Sandler, Andrew Howard, Menglong Zhu, Andrey Zhmoginov, and Liang-Chieh Chen. 2018. Mobilenetv2: Inverted residuals and linear bottlenecks. In Proceedings of the IEEE conference on computer vision and pattern recognition. 4510–4520.
- Sawyer and Chen (2012) Rebecca Sawyer and Guo-Ming Chen. 2012. The impact of social media on intercultural adaptation. (2012).
- Schill (2012) Dan Schill. 2012. The visual image and the political image: A review of visual communication research in the field of political communication. Review of communication 12, 2 (2012), 118–142.
- Seo (2014) Hyunjin Seo. 2014. Visual propaganda in the age of social media: An empirical analysis of Twitter images during the 2012 Israeli–Hamas conflict. Visual Communication Quarterly 21, 3 (2014), 150–161.
- Simonyan and Zisserman (2014) Karen Simonyan and Andrew Zisserman. 2014. Very deep convolutional networks for large-scale image recognition. arXiv preprint arXiv:1409.1556 (2014).
- Sivic and Zisserman (2003) Josef Sivic and Andrew Zisserman. 2003. Video Google: A text retrieval approach to object matching in videos. In Computer Vision, IEEE International Conference on, Vol. 3. IEEE Computer Society, 1470–1470.
- Sleigh et al. (2021) Joanna Sleigh, Julia Amann, Manuel Schneider, and Effy Vayena. 2021. Qualitative analysis of visual risk communication on twitter during the Covid-19 pandemic. BMC public health 21, 1 (2021), 1–12.
- Sommariva et al. (2018) Silvia Sommariva, Cheryl Vamos, Alexios Mantzarlis, Lillie Uyên-Loan Đào, and Dinorah Martinez Tyson. 2018. Spreading the (fake) news: exploring health messages on social media and the implications for health professionals using a case study. American journal of health education 49, 4 (2018), 246–255.
- Sosea et al. (2021) Tiberiu Sosea, Iustin Sirbu, Cornelia Caragea, Doina Caragea, and Traian Rebedea. 2021. Using the Image-Text Relationship to Improve Multimodal Disaster Tweet Classification. In The 18th International Conference on Information Systems for Crisis Response and Management (ISCRAM 2021).
- Starbird (2013) Kate Starbird. 2013. Delivering patients to sacré coeur: collective intelligence in digital volunteer communities. In Proceedings of the SIGCHI Conference on Human Factors in Computing Systems. 801–810.
- Starbird et al. (2014) Kate Starbird, Jim Maddock, Mania Orand, Peg Achterman, and Robert M Mason. 2014. Rumors, false flags, and digital vigilantes: Misinformation on twitter after the 2013 boston marathon bombing. IConference 2014 proceedings (2014).
- Starbird and Palen (2011) Kate Starbird and Leysia Palen. 2011. ” Voluntweeters” self-organizing by digital volunteers in times of crisis. In Proceedings of the SIGCHI conference on human factors in computing systems. 1071–1080.
- Starbird et al. (2012) Kate Starbird, Leysia Palen, Sophia B Liu, Sarah Vieweg, Amanda Hughes, Aaron Schram, Kenneth Mark Anderson, Mossaab Bagdouri, Joanne White, Casey McTaggart, et al. 2012. Promoting structured data in citizen communications during disaster response: an account of strategies for diffusion of the’Tweak the Tweet’syntax. In Crisis Information Management. Elsevier, 43–63.
- Stefanone et al. (2015) Michael A Stefanone, Gregory D Saxton, Michael J Egnoto, Wayne Wei, and Yun Fu. 2015. Image attributes and diffusion via Twitter: The case of# guncontrol. In 2015 48th Hawaii International Conference on System Sciences. IEEE, 1788–1797.
- Tomonto (2019) Matthew Tomonto. 2019. A Calamitous Imagination: Disaster Images, Fake News, and Challenges to Journalistic Objectivity. Ph. D. Dissertation. MA Thesis, Aristotle University of Thessaloniki. http://ikee. lib. auth. gr ….
- Torrey and Shavlik (2010) Lisa Torrey and Jude Shavlik. 2010. Transfer learning. In Handbook of research on machine learning applications and trends: algorithms, methods, and techniques. IGI global, 242–264.
- Tsai et al. (2021) Chun-Hua Tsai, Xinning Gui, Yubo Kou, and John M Carroll. 2021. With Help from Afar: Cross-Local Communication in an Online COVID-19 Pandemic Community. Proceedings of the ACM on Human-Computer Interaction 5, CSCW2 (2021), 1–24.
- Unal et al. (2022) Mesut Erhan Unal, Adriana Kovashka, Wen-Ting Chung, and Yu-Ru Lin. 2022. Visual persuasion in covid-19 social media content: A multi-modal characterization. In Companion Proceedings of the Web Conference 2022. 694–704.
- Veil et al. (2011) Shari R Veil, Tara Buehner, and Michael J Palenchar. 2011. A work-in-process literature review: Incorporating social media in risk and crisis communication. Journal of contingencies and crisis management 19, 2 (2011), 110–122.
- Vieweg et al. (2010) Sarah Vieweg, Amanda L Hughes, Kate Starbird, and Leysia Palen. 2010. Microblogging during two natural hazards events: what twitter may contribute to situational awareness. In Proceedings of the SIGCHI conference on human factors in computing systems. 1079–1088.
- vincentclaes (2022) vincentclaes. 2022. mit-indoor-scenes (ViT). https://huggingface.co/vincentclaes/mit-indoor-scenes. Accessed: 2023-07-01.
- Wang et al. (2020b) Junze Wang, Ying Zhou, Wei Zhang, Richard Evans, and Chengyan Zhu. 2020b. Concerns expressed by Chinese social media users during the COVID-19 pandemic: content analysis of Sina Weibo microblogging data. Journal of medical Internet research 22, 11 (2020), e22152.
- Wang et al. (2020a) Tianyi Wang, Ke Lu, Kam Pui Chow, and Qing Zhu. 2020a. COVID-19 sensing: negative sentiment analysis on social media in China via BERT model. Ieee Access 8 (2020), 138162–138169.
- Wang et al. (2019) Yun Wang, Adrien Segal, Roberta Klatzky, Daniel F Keefe, Petra Isenberg, Jörn Hurtienne, Eva Hornecker, Tim Dwyer, and Stephen Barrass. 2019. An emotional response to the value of visualization. IEEE computer graphics and applications 39, 5 (2019), 8–17.
- Website (2021) Chinese Government Website. 2021. The COVID-19 pandemic is in a state of local outbreaks and sporadic distribution in many places (in Chinese). http://www.gov.cn/xinwen/2021-01/13/content_5579636.htm. Accessed: 2022-09-14.
- Weibo (2020) Weibo. 2020. Adjustment of Weibo Visibility Range Setting (in Chinese). https://weibo.com/ttarticle/p/show?id=2309404485675293474819. Accessed: 2023-06-20.
- Welhausen (2015) Candice A Welhausen. 2015. Visualizing a non-pandemic: Considerations for communicating public health risks in intercultural contexts. Technical Communication 62, 4 (2015), 244–257.
- Wikipedia (2022) Wikipedia. 2022. 2021-2022 Xi’an COVID-19 outbreak (in Chinese). https://zh.wikipedia.org/zh-cn/2021%EF%BC%8D2022%E5%B9%B4%E8%A5%BF%E5%AE%89%E5%B8%822019%E5%86%A0%E7%8A%B6%E7%97%85%E6%AF%92%E7%97%85%E8%81%9A%E9%9B%86%E6%80%A7%E7%96%AB%E6%83%85. Accessed: 2022-09-14.
- Williams et al. (2020) Nora Webb Williams, Andreu Casas, and John D Wilkerson. 2020. Images as data for social science research: An introduction to convolutional neural nets for image classification. Cambridge University Press.
- WIlliams and Dienes (2021) Simon Nicholas WIlliams and Kimberly Dienes. 2021. ‘Variant fatigue’? Public attitudes to COVID-19 18 months into the pandemic: A qualitative study. (2021).
- Wu et al. (2021) Jiang Wu, Kaili Wang, Chaocheng He, Xiao Huang, and Ke Dong. 2021. Characterizing the patterns of China’s policies against COVID-19: A bibliometric study. Information Processing & Management 58, 4 (2021), 102562.
- Xu et al. (2023) Peng Xu, Xiatian Zhu, and David A Clifton. 2023. Multimodal learning with transformers: A survey. IEEE Transactions on Pattern Analysis and Machine Intelligence (2023).
- Xu et al. (2020) Qing Xu, Ziyi Shen, Neal Shah, Raphael Cuomo, Mingxiang Cai, Matthew Brown, Jiawei Li, Tim Mackey, et al. 2020. Characterizing Weibo social media posts from Wuhan, China during the early stages of the COVID-19 pandemic: qualitative content analysis. JMIR public health and surveillance 6, 4 (2020), e24125.
- Yang et al. (2021) Wenjie Yang, Sitong Wang, Zhenhui Peng, Chuhan Shi, Xiaojuan Ma, and Diyi Yang. 2021. Know it to Defeat it: Exploring Health Rumor Characteristics and Debunking Efforts on Chinese Social Media during COVID-19 Crisis. arXiv preprint arXiv:2109.12372 (2021).
- Yang et al. (2022) Wenjie Yang, Zhiyang Wu, Nga Yiu Mok, and Xiaojuan Ma. 2022. How to Save Lives with Microblogs? Lessons From the Usage of Weibo for Requests for Medical Assistance During COVID-19. In CHI Conference on Human Factors in Computing Systems. 1–18.
- Yang et al. (2017) Zhou Yang, Long Hoang Nguyen, Joshua Stuve, Guofeng Cao, and Fang Jin. 2017. Harvey flooding rescue in social media. In 2017 IEEE International Conference on Big Data (Big Data). IEEE, 2177–2185.
- Yi et al. (2022) Jingjing Yi, Jiayu Gina Qu, and Wanjiang Jacob Zhang. 2022. Depicting the Emotion Flow: Super-Spreaders of Emotional Messages on Weibo During the COVID-19 Pandemic. Social Media+ Society 8, 1 (2022), 20563051221084950.
- Zade et al. (2018) Himanshu Zade, Kushal Shah, Vaibhavi Rangarajan, Priyanka Kshirsagar, Muhammad Imran, and Kate Starbird. 2018. From situational awareness to actionability: Towards improving the utility of social media data for crisis response. Proceedings of the ACM on human-computer interaction 2, CSCW (2018), 1–18.
- Zarocostas (2020) John Zarocostas. 2020. How to fight an infodemic. The lancet 395, 10225 (2020), 676.
- Zerman (1995) David Zerman. 1995. Crisis communication: Managing the mass media. Information Management & Computer Security (1995).
- Zhang and Peng (2021) Han Zhang and Yilang Peng. 2021. Image clustering: An unsupervised approach to categorize visual data in social science research. Sociological Methods & Research (2021), 00491241221082603.
- Zhang and Rui (2021) Phoebe Zhang and Guo Rui. 2021. Chinese Terracotta Warriors city Xian in lockdown as Covid-19 outbreak grows. https://www.scmp.com/news/china/science/article/3160816/chinese-terracotta-warriors-city-xian-lockdown-covid-19-outbreak. Accessed: 2022-11-28.
- Zhang et al. (2021) Yixuan Zhang, Yifan Sun, Lace Padilla, Sumit Barua, Enrico Bertini, and Andrea G Parker. 2021. Mapping the landscape of covid-19 crisis visualizations. In Proceedings of the 2021 CHI Conference on Human Factors in Computing Systems. 1–23.
- Zhao et al. (2020) Xiaoman Zhao, Ju Fan, Iccha Basnyat, Baijing Hu, et al. 2020. Online health information seeking using “# COVID-19 patient seeking help” on Weibo in Wuhan, China: descriptive study. Journal of Medical Internet Research 22, 10 (2020), e22910.
- Zhou et al. (2017) Bolei Zhou, Agata Lapedriza, Aditya Khosla, Aude Oliva, and Antonio Torralba. 2017. Places: A 10 million image database for scene recognition. IEEE transactions on pattern analysis and machine intelligence 40, 6 (2017), 1452–1464.
Appendix A Image Clustering Model Performance based on Within-cluster Consistency
| Experiment | Feature Extraction Model | Clustering Model | Splitting and Merging | Averaged Within-Cluster Consistency |
| Determining Feature Extraction Model | bag-of-visual-words (Sivic and Zisserman, 2003) | K-Means (Lloyd, 1982) | No | 0.64 |
| VGG16 (Simonyan and Zisserman, 2014) | K-Means (Lloyd, 1982) | No | 0.71 | |
| VGG19 (Simonyan and Zisserman, 2014) | K-Means (Lloyd, 1982) | No | 0.70 | |
| ResNet (He et al., 2016) | K-Means (Lloyd, 1982) | No | 0.72 | |
| MobileNet (Howard et al., 2017) | K-Means (Lloyd, 1982) | No | 0.67 | |
| MobileNetV2 (Sandler et al., 2018) | K-Means (Lloyd, 1982) | No | 0.72 | |
| Determining Clustering Model | MobileNetV2 (Sandler et al., 2018) | K-Means (Lloyd, 1982) | No | 0.72 |
| MobileNetV2 (Sandler et al., 2018) | DBSCAN (Khan et al., 2014) | No | 0.65 | |
| MobileNetV2 (Sandler et al., 2018) | Gaussian Mixture Model (Reynolds, 2009) | No | 0.69 | |
| Final Model | MobileNetV2 (Sandler et al., 2018) | K-Means (Lloyd, 1982) | Yes | 0.80 |