The hidden dimension of information diffusion: A latent space representation of Social Media News Sharing behavior
Abstract
In times marked by an abundance of news sources and the widespread use of social media for staying informed, acquiring accurate data faces increasing challenges. Today, access to information plays a crucial role in shaping public opinion and is significantly influenced by interactions on social media. Therefore, studying the dissemination of news on these platforms is vital for understanding how individuals stay informed. In this paper, we study emergent properties of media outlet sharing behavior by users in social media. We quantify this behavior in terms of coordinates in a latent space proposing a metric called Media Sharing Index (MSI). We observe that the MSI shows a bimodal distribution in this latent dimension, reflecting the preference of large groups of users for specific groups of media outlets. This methodology allows the study of the extent to which communities of interacting users are permeable to different sources of information. Additionally, it facilitates the analysis of the relationship between users’ media outlet preferences, their political leanings, and the political leanings of the media outlets.
Keywords: echo chambers, media bias, polarization, news sharing, social media, correspondence analysis.
1 Introduction
Getting properly informed is a fundamental civic right to live in a modern democracy. This seemingly simple fact is becoming increasingly challenging to achieve due to the abundance of information sources, as well as the competition between true and false news [1, 2, 3, 4, 5].
Nowadays, the way we access information has become increasingly reliant on social media [6, 7]. Consequently, our access to it is mediated by the interactions of individuals who post and share news. Studying the issue of news dissemination on social media becomes essential for understanding people get informed in a modern society.
The process of how people become informed plays a fundamental role in shaping opinion formation across several topics and has been deeply addressed since the seminal work of Mc.Combs and Shaw [8, 9] grounding the bases of Agenda Setting Theory.
News sharing behavior on Twitter was analyzed by Weaver et al [10] within the context of political elections, using a bipartite network of users and news articles. Here, the authors analyzed the emergence of communities in the projection onto the news layer and identify their main features that explain these communities. A similar approach was addressed in [11] for Argentinian media outlets, comparing electoral with non-electoral periods of time. In this context, the researchers found that groups of users on Twitter emerge as a consequence of their preferences for a given set of media outlets.
Given that the dissemination of news is highly influenced by the process of sharing them on social media, understanding how this process is affected by user behavior and news’ features is crucial for comprehending its scope and limitations. In this context, we face the question whether it is possible to define a metric that quantifies users’ preferences in media sharing behavior.
Political preferences on social media have been quantified using either the content of messages (tweets, for instance) as in [12, 13] or by considering the connectivity patterns among users, as in [14, 15]. In these last papers, the authors have developed a model, called Latent Ideology, that assumes that the positions of individuals in an unobserved social space can be inferred on the basis of observed connections among them, assuming that such connections are governed by the principle of homophily. In particular, they estimated latent parameters by applying correspondence analysis to the adjacency matrix of users following political accounts on Twitter. Latent Ideology was recently used in [16] to analyze political polarization in the context of 2016 and 2020 US presidential elections, estimating individual positions from the users-influencers adjacency matrix. A similar approach was employed in [17] to estimate latent opinions within online debate about measures to mitigate climate change.
In this work, we study the process of large-scale users preferences for certain media groups. We quantify these preferences in terms of coordinates in a latent space by adapting the Latent Ideology methodology, which we have customized for this context, defining what we call the Media Sharing Index (MSI). In particular, we raised the following research questions:
-
•
Do users tend to form groups according to their preferences for specific media outlets?
-
•
How homogeneous are those groups in terms of their position in a latent space of information, and how does it relate to political ideology?
-
•
Is there a polarization in news sharing? Is it related to the underlying political polarization?
-
•
Do these preferences produce the formation of echo-chambers in news outlets preferences, thereby restricting the free diffusion of information in social media?
2 Background
In this section, we review the political and media landscape in Argentina during the period under study. In the last decade, Argentina’s political landscape has been characterized by the dominance of two major parties: a center-left coalition (CL), known as Frente de Todos, and a center-right coalition (CR) referred to as Juntos por el Cambio. During the 2019 elections, the center-left coalition presented Alberto Fernández and Cristina Fernández de Kirchner as their candidates. Meanwhile, the center-right coalition sought a second term for Mauricio Macri as president, with Miguel Angel Pichetto as his vice-presidential candidate.
In reference to the media landscape in Argentina, the most significant media outlets are Infobae, Clarín and La Nación (each boasting approximately 20 million unique users in 2020 [18]), followed closely by a second group with audience numbers ranging from 6 to 13 million unique visitors. Prominent among this group are Página 12, Ámbito Financiero, Todo Noticias and El Destape Web.
3 Data and Methods
3.1 Data
In this research, we employed a pre-existing Twitter dataset [19] comprising tweets collected between March 1, 2019, and August 27, 2019. This dataset was acquired by utilizing keywords linked to participants in the 2019 Argentinean primary election, such as alferdez, CFK, CFKArgentina, Kirchner, mauriciomacri, Macri, and Pichetto.
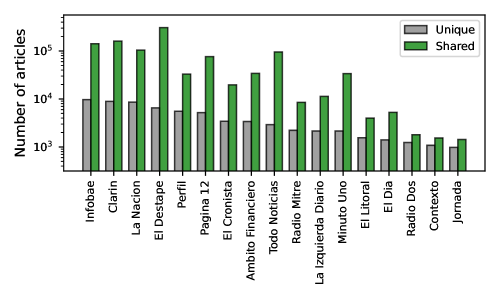
We made two specific modifications to the original dataset. Firstly, we filtered for all types of tweets, including tweets, retweets, and quotes, that exclusively contained external URLs linking to Argentinian news outlets, based on the ABYZ News Links Guide [20]. We also extracted the content of the news articles from their respective web pages, by developing custom code for each media outlet, using Python libraries such as Requests [21], Selenium [22], and Beautiful Soup [23]. Following these initial steps, we obtained a dataset encompassing the activity of 123,180 users, who collectively generated 1,039,281 tweets, sharing 66,982 unique news articles from 17 Argentinian media outlets. Figure 1 displays the number of unique news articles for each media outlet during the specified period (indicated in blue), as well as the number of sharing events (tweets with URLs) of these unique news articles (indicated in red). These variations represent users’ preferences for particular media outlets.
Secondly, we incorporated user data related to the final vote intention, as detailed in [19]. This procedure resulted in 65,876 tweets originating from 17,349 individuals who expressed their intention to support the Center-Left (CL) coalition (Fernández-Fernández), alongside approximately 40,277 tweets from 15,361 individuals with an inclination toward the Center-Right (CR) coalition (Macri-Pichetto). Supporters of the CL coalition shared 19,276 news articles, while those leaning towards the CR coalition shared 10,135.
3.2 Methods
3.2.1 Sentiment Bias Definition
Here, we analyze the sentiment of the text of the shared news articles by decomposing each article into multiple sentences and applying the Pysentimiento algorithm [24] to each sentence of every text article. Then, we obtain the amount of positivity, neutrality, and negativity mention towards the two main election candidates, as was previously introduced in [25]. For a single mention, it is counted as one; for multiple mentions, sentiment is calculated individually, categorizing them as neutral, positive, or negative. We evaluate the balance between positive and negative mentions of the Center-Left coalition (CL) versus the Center-Right (CR) defining the Sentiment Bias (SB) [26, 11] of an article i as:
| (1) |
Defining mentions on a per-sentence basis, the total count includes positive, negative, and neutral mentions. For instance, consider an article containing six sentences referring to political candidates: one negative mention of CR candidates (), one positive mention of CR candidates(), three positive mentions of CL candidates (), and three neutral mentions regarding CL candidates. In this case, , , and . The Sentiment Bias of the article is calculated as follows: .
3.2.2 Media Sharing Index
In this section, we introduce the Media Sharing Index (MSI), a metric that positions users within a hidden space reflecting their preferences for specific groups of media outlets. Simultaneously, it enables the placement of media outlets within the same latent space, determined by the average preferences of their audience. Essentially, users closer in this space tend to share similar media outlets, indicating comparable preferences in media consumption. Likewise, media outlets situated closely in this latent space imply shared usage by a similar set of users.
To define the Media Sharing Index (MSI), we follow previous works [14, 16] that propose a methodology to identify the ideology of users in social media based on correspondence analysis [27]. We initiate by establishing a bipartite network denoted as G = (U, V, E), where U stand for the set of users, V represents the news outlets, and E denotes the edges in the graph. The corresponding adjacency matrix associated with this network is denoted as Y. The element represents the number of times user , with shares a news from a media outlet , with .
The matrix is converted to the correspondence matrix by dividing each element by its grand total . The element represents the probability of finding an event in which user shares an article from media outlet . From matrix , the matrix of standardized residuals is computed as:
where vectors and are defined such as and .The element represents the likelihood that user shares an article from any media outlet. Conversely, represents the probability of media outlet being shared by any user. The elements of outer product () can be interpreted as the probability of user sharing a media outlet given a null model where only the activity of user and the frequency of media outlet being shared matter. By defining diagonal matrices and , we can express the elements of as follows:
This expression can be interpreted as the deviation, measured in standard units, of from a null model where users and media outlets are independent.
In order to compute the MSI for each user, we firstly perform singular value decomposition to , that is
where and is a diagonal matrix with the singular values on its diagonal. The Media Sharing Index for the user i, , is then identified by the standard row coordinates by projecting only over the first singular component:
and finally normalizing these values to have zero mean and standard deviation equal to 1. As such, users with similar values of MSI imply that they share a similar set of media outlets. In particular, if user sharing behavior is driven by two distinct groups of media outlets, as shown in [11], we would expect to observe a group of individuals with and another with .
Finally, we define the MSI for media outlets as the weighted average of the MSI of the users, weighted by the number of times user shares media :
| (2) |
The interpretation of MSIj is analogous to one provided for MSIi: media outlets with will have a very different set of users who share its articles compared to media outlets with .
4 Results
4.1 The users - media outlets network and Media Sharing Index
Following a similar approach to previous studies [11], we build a bipartite adjacency matrix , where each element gives the number of news articles from media outlet , shared by user .
We start with the binary projection of the users-media outlet network on the media outlets layer. Here, nodes represent the media outlets, and they are linked if the number of users share at least one article from those media outlets. In order to take into consideration only significant connections, we validate them against those present in random networks generated by a Bipartite Configuration Model (BiCM), following the approach introduced in [28].
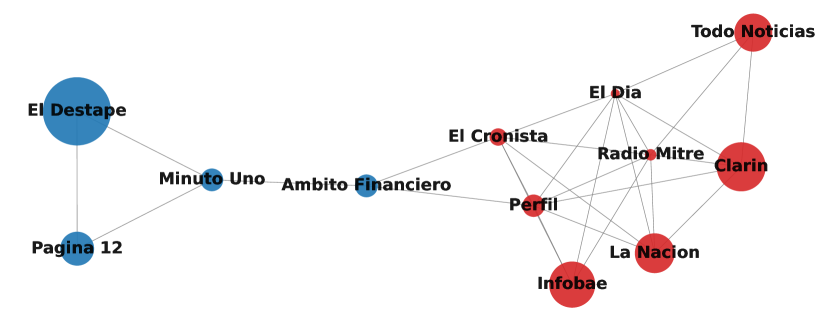
Figure 2 shows the giant component of the validated projection on the media outlet layer. In this case, the giant component has 12 media outlets out of the 17 original ones. The node size is directly proportional to the number of shared news articles, while node colors are determined by the community assignments obtained through the Louvain algorithm [29]. The figure illustrates the emergence of two distinct clusters of media outlets. One cluster includes Página 12 and El Destape, among others, while the other comprises Infobae, Clarín, La Nación, and Todo Noticias. This clustering pattern mirrors users’ preferences and their sharing behavior on social media.
In order to quantitatively analyze these preferences, we make use of Media Sharing Index (MSI) introduced in section 3.2.2. First, we consider only the 12 media that emerge in the giant component of Fig. 2. By considering only these outlets, the dataset reduces to 59874 unique news (about 88% of the unique news from the total dataset) and 120626 users (about 97% of the users in the original dataset), that come from a total of 1015380 tweets with a link to one of these 12 principal outlets (about 98% of the number of original tweets), showing that these 12 media outlets are very representative of the original dataset and no much information is lost.
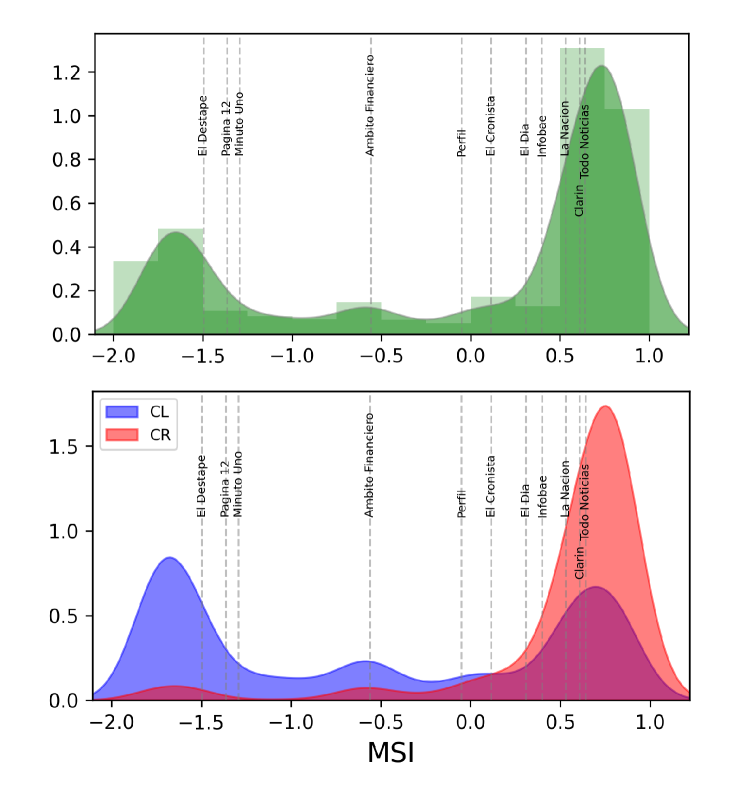
Figure 3, top panel, shows the probability density function of the MSI from the set of users that share at least one of the 12 media outlets from the giant component of user-media projection. This figure illustrates the emergence of a bimodal distribution in the Media Sharing Index. We applied a Gaussian kernel to the histograms instead of adjusting a bimodal model, so it is clearer the bi-modality of the distribution. We check the multi-modality of this distribution using the Dip test [31, 32] and discard uni-modality with a p-value practically equal to zero ().
Note that the order in the values of the MSI of the media outlets corresponds with the structure observed in the Fig. 2. This bimodal distribution reflects polarization in user’s preferences for the two groups media outlets identified in Fig. 2. In particular, it can be observed that there is a majority group of users that shares news from the media cluster represented by Clarín, La Nación, Todo Noticias, among others, while it can also be identified a minority group that prefers El Destape, Página 12 and Minuto Uno.
4.2 The two faces of political dimension
Despite the clear polarization visible in Fig. 2 and Fig. 3 top panel, it remains uncertain whether this polarization aligns with users’ political preferences or the content of the news. In this section, we investigate the potential link between the observed polarization in Figs. 2 and 3 and the underlying political polarization of users, as defined in [19], as well as the content of news articles.
4.2.1 Users political preferences
As was described in section 3.1, the dataset for this analysis is the same used by Zhou et. al. (2021) [19] to infer the political preferences of users from their tweets on Twitter. There, the authors developed a model to infer the users’ voting intentions based on the majority of tweets they posted, subsequently labeling them as either Center-Left (CL) or Center-Right (CR) supporters. The model developed in [19] infers vote intention based on the labeled hashtags that individuals used to express themselves in social media.
Figure 3 bottom panel shows the probability density function of the users’ Media Share Index, segmented by political preferences as computed in [19]. The two histograms are independently normalized (we provide histograms with absolute values in Supplementary Material). It’s important to note that although users’ political preferences are dynamic (the model allows users to change their preferences over time), in this instance, each user is assigned a unique label corresponding to the most frequent one. The alignment between the right peak in the bimodal distribution and the CR coalition is evident, whereas users associated with the CL coalition predominantly cluster around the left peak, with a notable presence in the right peak as well. This implies that users affiliated with the Center-Right (CR) coalition tend to share news from outlets like Clarín, La Nación, and Infobae, among others. In contrast, individuals identified with the Center-Left (CL) coalition show a strong preference for Página 12 and El Destape (which are generally avoided by CR users). However, CL users also exhibit some level of engagement with media outlets closer to the right peak.

A more detailed description of a user’s ideology can be provided given that the label assigned in [19] is dynamic, as mentioned above. We can define the ideology valence of a user i () as:
| (3) |
where () is the number of times user i, identified as a Center-Right (or Center-Left) partisan at that particular time, shared a news article, with the sum being the total number of news articles shared by user i. By this definition, means user i is always labeled as CR, so it points to a pure CR partisan. Analogously, points to a pure CL partisan. IV will only be defined for users with a label assigned in [19].
4.2.2 Media Outlet Bias
Another dimension of the analysis is to focus on media outlets instead of users. Analogously to the relationship between the MSI of the users and their inferred ideology, the MSI of the media outlets can be compared to the political content of the news articles. To get insight of the political content, we select articles from our dataset that mention presidential candidates of both main coalitions (Alberto Fernández - Cristina Fernández de Kirchner for the Center-Left coalition and Mauricio Macri - Miguel Angel Pichetto for the Center-Right one, see section 2 for reference) and perform sentiment analysis to account for positive and negative mentions to each candidate. Given the labeled mentions, we calculate Sentiment Bias (SB) (Eq.1) as was described in section 3.2.
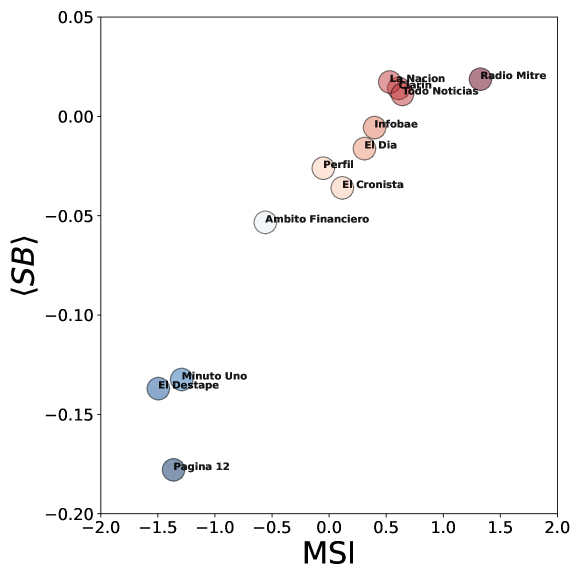
Figure 5 shows the mean value of Sentiment Bias for each media outlet as a function of its MSI. We can observe a strong correlation (Spearman ) between both quantities, where newspapers from the negative pole of Media Sharing Index (Página 12 and El Destape, among others) correspond to a mean Sentiment Bias favorable towards Center-Left candidates (), while news outlets from the positive pole of the MSI correspond to favorable to Center-Right candidates.
Summarizing, we have seen that users preferences codified in the Media Sharing Index strongly correlates with partisan leaning of sharers as well as the political bias of the main analyzed media outlets.
4.3 Retweet user networks
In this last section, we analyze the interaction among users by constructing the retweet network. In particular, we focus in the relationship between the community structure, the Media Sharing Index and the users political preferences. The retweet network is directed and weighted. The direction points out the information flow (i.e., arrows go from a retweeted user to the user who retweets), and the weights account for the number of retweets between both users. This network has 114,673 nodes, which is about the 90% of the users described in section 3.1. The remaining 10% are users that did not retweet or were retweeted by other users during the analyzed period. On the other hand, there is a total of 12,993,644 edges, which is the number of retweets registered among users in this network. Is it important to stress that we construct this network taking into account only retweets without links to news articles. This means that this network does not have any information used in the calculation of the MSI.
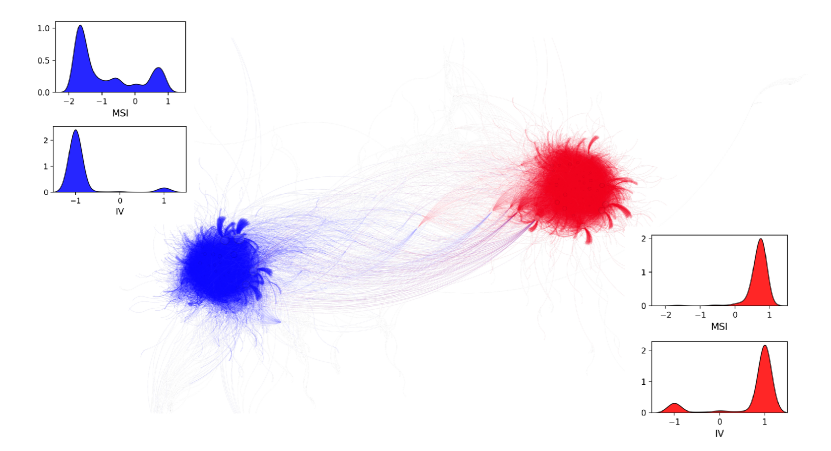
Figure 6 shows the two main communities of the retweet network, showing the two largest communities detected with the Louvain algorithm [29]. The algorithm detects 440 communities, but the two largest communities comprise the 75 of the full retweet network, with practically the same number of nodes in each community (see Table 1 for size and metrics references). Figure 6 shows a highly modular structure of the retweet network, with a modularity score . This figure also reveals the bias of each community, both in the Media Sharing Index and in the Ideological Valence (see histograms associated with each community). For instance, we can observe that the red community can be labeled as Center-Right, given the tendency of the users to have values of IV and MSI towards 1, in both cases associated to CR political leaning as discussed in previous sections. On the other hand, the blue community can be clearly associated with a Center-Left political leaning, given in particular the distribution of the IV among the community. Moreover, as was also observed in the bottom panel of Fig.3, this community shows a MSI distribution less biased, pointing out that this community not only consumes CL media outlets but also media outlets linked with the opposite ideological position.
| Community | Relative size | ||
|---|---|---|---|
| 1 | 38% | 0.68 | 0.74 |
| 2 | 37% | -0.87 | -0.84 |
| 3 | 8% | 0.46 | 0.28 |
| 4 | 3% | 0.61 | 0.41 |
| 5 | 2% | -1.03 | -0.72 |
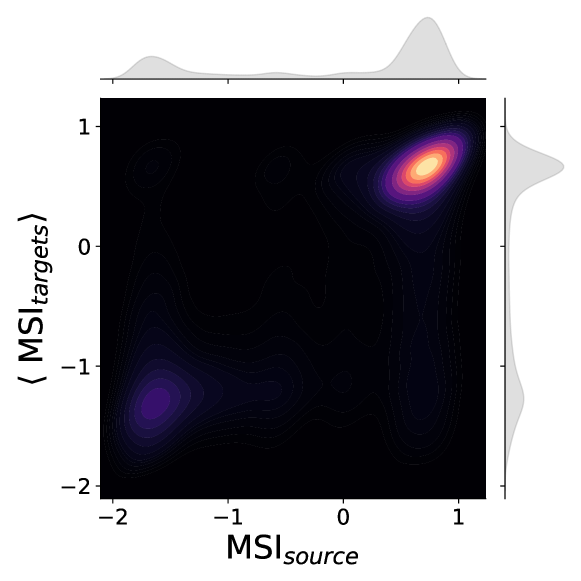
The modular structure of the retweet network is informative about users that tend to interact frequently among them share similar preferences for media outlets. This produces that information diffuses preferentially among users with same political leaning, leading to increase polarization and enhance the formation of echo-chambers. To provide a more detailed quantification of this modular structure, in Fig. 7 we measure the relationship between the MSI of retweeted users (sources of information) and the average of the users who retweet them (targets), following a similar approach developed in [12, 13]. Given that an user can be at the same time both source and target, we distinguish between these two roles: each time a user is retweeted at least one time, it acts as source; eventually, the same user retweets someone else and in that case its information is included as target. Figure 7 shows that users (targets of information) tend to share information from other users (sources) that have highly similar media consumption profile, i.e. information flows between users that tend to consume the same subset of media sources, as can be qualitatively conclude from Fig. 6.
5 Discussion and Conclusions
In this work, we propose a metric to characterize users’ behaviour on social media when sharing information, particularly links to articles from media outlets. This metric, which we call Media Sharing Index (MSI), is an adaptation of a proposed method sketched in [14, 16] to study political leaning in social media. Here we focus in how users interact with mainstream media and the way the share information taken from them.
The MSI enables us to set up a scale that describes the level of polarization in how users receive information through social media. In this work, we specifically observe a bimodal distribution of the MSI, where the two clearly defined peaks can readily be linked to two distinct groups of media outlets. In the case of Argentina, these two groups are exemplified by Clarin, La Nación, Infobae, and Todo Noticias, among others, on one side, and on the other side, Página 12 and El Destape. These six media outlets stand out as the most widely shared on social media.
The Media Sharing Index’s strength lies in its ability to associate users within the two mentioned groups with their respective political biases. One group is representative of the Center-Right (CR) ideology, while the other embodies the Center-Left (CL) perspective. This association was validated through two methods. First, we utilized the political preferences of a group of users, identified as Center Right (CR) or Center Left (CL) supporters using the machine learning model developed in [19]. We observed a clear correlation between media outlets and political preferences. However, while the CR group predominantly shares news from media aligned with their own beliefs, the CL group exhibits greater diversity in its media sources. This diversity arises from the fact that CR media outlets represent mainstream media, and the CL group cannot overlook them when engaging in political discourse.
Using the semantic content of shared news articles mentioning the candidates of Center Left and Center Right coalitions, we measured Sentiment Bias (SB), which can be used a as a proxy for bias from media outlets to candidates of political parties [11, 26]. We found that the average sentiment bias of each media outlet show a strong correlation with their Media Sharing Index. This means that media outlets with a similar bias are shared by a similar set of users. We can then conclude that in a polarized society (as can happen in particular during electoral periods), the way users share media information is strongly related with bias of these media outlets.
The larger diversification in media sharing from the Center-Left group was better understood by studying the retweet network among users. This network, which excludes those retweets with links to a news articles, shows that users tend to retweet others that share same media preferences and display two large communities that can be identified as Center Right and Center Left, respectively. Being more specific, we found that it is more probable to find users that are very retweeted for the CL community, but their use to share CR media outlets. This shows that it is not possible to the CL community to ignore the CR media outlets, given that, for this Argentinian case, they represent the more consumed media outlets in the country.
Acknowledgements
HAM and MS were supported by NSF Grant No. 2214217. PB, SMdP and SP were supported by PICT-2020-SERIEA-00966.
Author contributions statement
SMdP, SP, and MS were responsible for collecting the raw data. SMdP and SP developed the computational code utilized consistently throughout the paper. TC and FM made contributions to the statistical analysis. PB and HAM conceptualized the research. All authors engaged in discussions about the results and collaborated on the development of the manuscript.
Data and code availability statement
Twitter data analyzed in this work are provided according to its terms and are available at https://osf.io/u29tk/. Analytical codes are available in https://github.com/spinto88/MediaSharingIndex.
References
- [1] Alexandre Bovet and Hernán A Makse “Influence of fake news in Twitter during the 2016 US presidential election” In Nature communications 10.1 Nature Publishing Group UK London, 2019, pp. 7
- [2] Gizem Ceylan, Ian A Anderson and Wendy Wood “Sharing of misinformation is habitual, not just lazy or biased” In Proceedings of the National Academy of Sciences 120.4 National Acad Sciences, 2023, pp. e2216614120
- [3] Michela Del Vicario et al. “The spreading of misinformation online” In Proceedings of the national academy of Sciences 113.3 National Acad Sciences, 2016, pp. 554–559
- [4] Soroush Vosoughi, Deb Roy and Sinan Aral “The spread of true and false news online” In science 359.6380 American Association for the Advancement of Science, 2018, pp. 1146–1151
- [5] Yasmim Mendes Rocha et al. “The impact of fake news on social media and its influence on health during the COVID-19 pandemic: A systematic review” In Journal of Public Health Springer, 2021, pp. 1–10
- [6] Nic Newman et al. “Reuters Institute digital news report 2021” In Reuters Institute for the study of Journalism, 2021
- [7] N. Newman and al. “Digital News Report 2023” Accessed 27 Oct. 2023 Reuters Institute URL: https://policycommons.net/artifacts/4164711/digital_news_report_2023/4973510/
- [8] M.. McCombs and D.. Shaw “Public opinion quarterly” In Public Opinion Quarterly 36(2):176-187, 1972 DOI: 10.1086/267990
- [9] Renita Coleman, Maxwell McCombs, Donald Shaw and David Weaver “Agenda setting” In The handbook of journalism studies Routledge, 2009, pp. 167–180
- [10] Iain S Weaver et al. “Communities of online news exposure during the UK General Election 2015” In Online Social Networks and Media 10 Elsevier, 2019, pp. 18–30
- [11] Tomas Cicchini, Sofia Morena Del Pozo, Enzo Tagliazucchi and Pablo Balenzuela “News sharing on Twitter reveals emergent fragmentation of media agenda and persistent polarization” In EPJ Data Science 11.1 Springer Berlin Heidelberg, 2022, pp. 48
- [12] Matteo Cinelli et al. “The echo chamber effect on social media” In Proceedings of the National Academy of Sciences 118.9 National Acad Sciences, 2021, pp. e2023301118
- [13] Wesley Cota, Silvio C Ferreira, Romualdo Pastor-Satorras and Michele Starnini “Quantifying echo chamber effects in information spreading over political communication networks” In EPJ Data Science 8.1 Springer Berlin Heidelberg, 2019, pp. 35
- [14] Pablo Barberá et al. “Tweeting from left to right: Is online political communication more than an echo chamber?” In Psychological science 26.10 Sage Publications Sage CA: Los Angeles, CA, 2015, pp. 1531–1542
- [15] Pablo Barberá “Birds of the same feather tweet together: Bayesian ideal point estimation using Twitter data” In Political analysis 23.1 Cambridge University Press, 2015, pp. 76–91
- [16] James Flamino et al. “Political polarization of news media and influencers on Twitter in the 2016 and 2020 US presidential elections” In Nature Human Behaviour Nature Publishing Group UK London, 2023, pp. 1–13
- [17] Max Falkenberg et al. “Growing polarization around climate change on social media” In Nature Climate Change 12.12 Nature Publishing Group UK London, 2022, pp. 1114–1121
- [18] “Todo Medios (Comscore data) ” Accessed 14 Nov. 2023, https://www.totalmedios.com/nota/54090/infobae-lidero-en-un-agosto-marcado-por-las-paso-y-con-crecimiento-de-todos-los-sitios
- [19] Zhenkun Zhou et al. “Why polls fail to predict elections” In Journal of Big Data 8.1 Springer, 2021, pp. 1–28
- [20] “ABYZ Web Links Inc.” Accessed 14 Nov. 2023 URL: http://www.abyznewslinks.com/argen.htm
- [21] “Requests Python Library: ” URL: https://pypi.org/project/requests/
- [22] “Selenium Python Library” URL: https://pypi.org/project/selenium/
- [23] “BeautifulSoup Python Library: ” URL: https://pypi.org/project/beautifulsoup4/
- [24] Juan Manuel Pérez, Juan Carlos Giudici and Franco Luque “pysentimiento: A Python Toolkit for Sentiment Analysis and SocialNLP tasks”, 2021 arXiv:2106.09462 [cs.CL]
- [25] Sofía M Pozo et al. “Biased news sharing and partisan polarization on social media”, 2023 arXiv:2310.08701 [cs.SI]
- [26] Federico Albanese, Sebastián Pinto, Viktoriya Semeshenko and Pablo Balenzuela “Analyzing mass media influence using natural language processing and time series analysis” In Journal of Physics: Complexity 1.2 IOP Publishing, 2020, pp. 025005
- [27] Michael J Greenacre “Correspondence analysis” In Wiley Interdisciplinary Reviews: Computational Statistics 2.5 Wiley Online Library, 2010, pp. 613–619
- [28] Fabio Saracco et al. “Inferring monopartite projections of bipartite networks: an entropy-based approach” In New Journal of Physics 19.5 IOP Publishing, 2017, pp. 053022 DOI: 10.1088/1367-2630/aa6b38
- [29] Vincent D Blondel, Jean-Loup Guillaume, Renaud Lambiotte and Etienne Lefebvre “Fast unfolding of communities in large networks” In Journal of statistical mechanics: theory and experiment 2008.10 IOP Publishing, 2008, pp. P10008
- [30] Nicolò Vallarano et al. “Fast and scalable likelihood maximization for exponential random graph models with local constraints” In Scientific Reports 11.1 Nature Publishing Group UK London, 2021, pp. 15227
- [31] John A Hartigan and Pamela M Hartigan “The dip test of unimodality” In The annals of Statistics JSTOR, 1985, pp. 70–84
- [32] “Diptest Python Library: ” URL: https://pypi.org/project/diptest/